
#82
82
2,541 views
29 Discussing
Hot
Latest

·
--
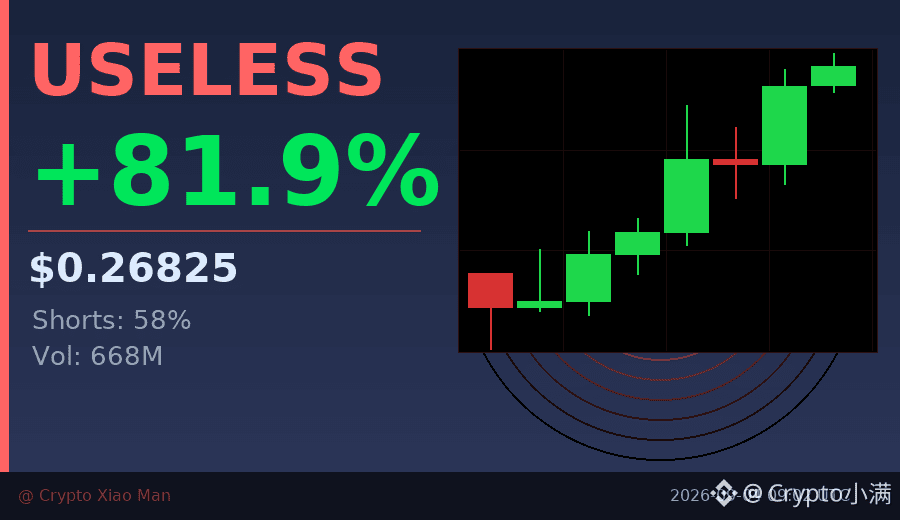
82% rise, but shorts still account for 58%—is this round of USELESS short squeeze just getting started?
Today’s harshest market move isn’t just a simple vertical rally, but a sustained push higher while the short ratio stays high. In the past 6 hours, candles have been closing green one after another, and trading volume jumped to 668 million U—clearly indicating funds are forcing a squeeze.
On the hourly chart, price has been pushed from around 0.20 up to 0.27. Every pullback gets bought up. Shorts now have two options: cut losses and exit to make the rally even stronger, or hold on and wait to be liquidated.
Personally, I’ll watch the prior high at 0.27. If it breaks out, short panic could accelerate. But remember: in squeeze-driven markets, volatility is extremely high—don’t go all-in betting on a direction.
$USELESS #空头挤压 #82%
Click the small card below to quickly check the market👇
82% rise, but shorts still account for 58%—is this round of USELESS short squeeze just getting started?
Today’s harshest market move isn’t just a simple vertical rally, but a sustained push higher while the short ratio stays high. In the past 6 hours, candles have been closing green one after another, and trading volume jumped to 668 million U—clearly indicating funds are forcing a squeeze.
On the hourly chart, price has been pushed from around 0.20 up to 0.27. Every pullback gets bought up. Shorts now have two options: cut losses and exit to make the rally even stronger, or hold on and wait to be liquidated.
Personally, I’ll watch the prior high at 0.27. If it breaks out, short panic could accelerate. But remember: in squeeze-driven markets, volatility is extremely high—don’t go all-in betting on a direction.
$USELESS #空头挤压 #82%
Click the small card below to quickly check the market👇
Today’s harshest market move isn’t just a simple vertical rally, but a sustained push higher while the short ratio stays high. In the past 6 hours, candles have been closing green one after another, and trading volume jumped to 668 million U—clearly indicating funds are forcing a squeeze.
On the hourly chart, price has been pushed from around 0.20 up to 0.27. Every pullback gets bought up. Shorts now have two options: cut losses and exit to make the rally even stronger, or hold on and wait to be liquidated.
Personally, I’ll watch the prior high at 0.27. If it breaks out, short panic could accelerate. But remember: in squeeze-driven markets, volatility is extremely high—don’t go all-in betting on a direction.
$USELESS #空头挤压 #82%
Click the small card below to quickly check the market👇
10

·
--
This crypto sector is up 213% since Bitcoin’s 2025 peak — One coin is leading the rally
- Privacy coins have surged 213% since Bitcoin hit its peak in October 2025, with Zcash (ZEC) leading the sector, accounting for 62% of the market-cap increase of the privacy-coin sector, from $7.1 billion to $33.6 billion.
- Zcash’s market capitalization has grown 25-fold over the past year, rising from position #82 to #9 on the rankings, while the privacy-coin sector is the only one trading above October levels.
- Despite the rally, some analysts are questioning the sustainability of ZEC’s price surge, saying the coin may be overvalued compared with Bitcoin’s trading activity at a similar stage.
Source: CryptoPotato
🌍 Updated by GemCrypto
$BTC
#Bitcoin #Crypto
This crypto sector is up 213% since Bitcoin’s 2025 peak — One coin is leading the rally
- Privacy coins have surged 213% since Bitcoin hit its peak in October 2025, with Zcash (ZEC) leading the sector, accounting for 62% of the market-cap increase of the privacy-coin sector, from $7.1 billion to $33.6 billion.
- Zcash’s market capitalization has grown 25-fold over the past year, rising from position #82 to #9 on the rankings, while the privacy-coin sector is the only one trading above October levels.
- Despite the rally, some analysts are questioning the sustainability of ZEC’s price surge, saying the coin may be overvalued compared with Bitcoin’s trading activity at a similar stage.
Source: CryptoPotato
🌍 Updated by GemCrypto
$BTC
#Bitcoin #Crypto
- Privacy coins have surged 213% since Bitcoin hit its peak in October 2025, with Zcash (ZEC) leading the sector, accounting for 62% of the market-cap increase of the privacy-coin sector, from $7.1 billion to $33.6 billion.
- Zcash’s market capitalization has grown 25-fold over the past year, rising from position #82 to #9 on the rankings, while the privacy-coin sector is the only one trading above October levels.
- Despite the rally, some analysts are questioning the sustainability of ZEC’s price surge, saying the coin may be overvalued compared with Bitcoin’s trading activity at a similar stage.
Source: CryptoPotato
🌍 Updated by GemCrypto
$BTC
#Bitcoin #Crypto

311

·
--
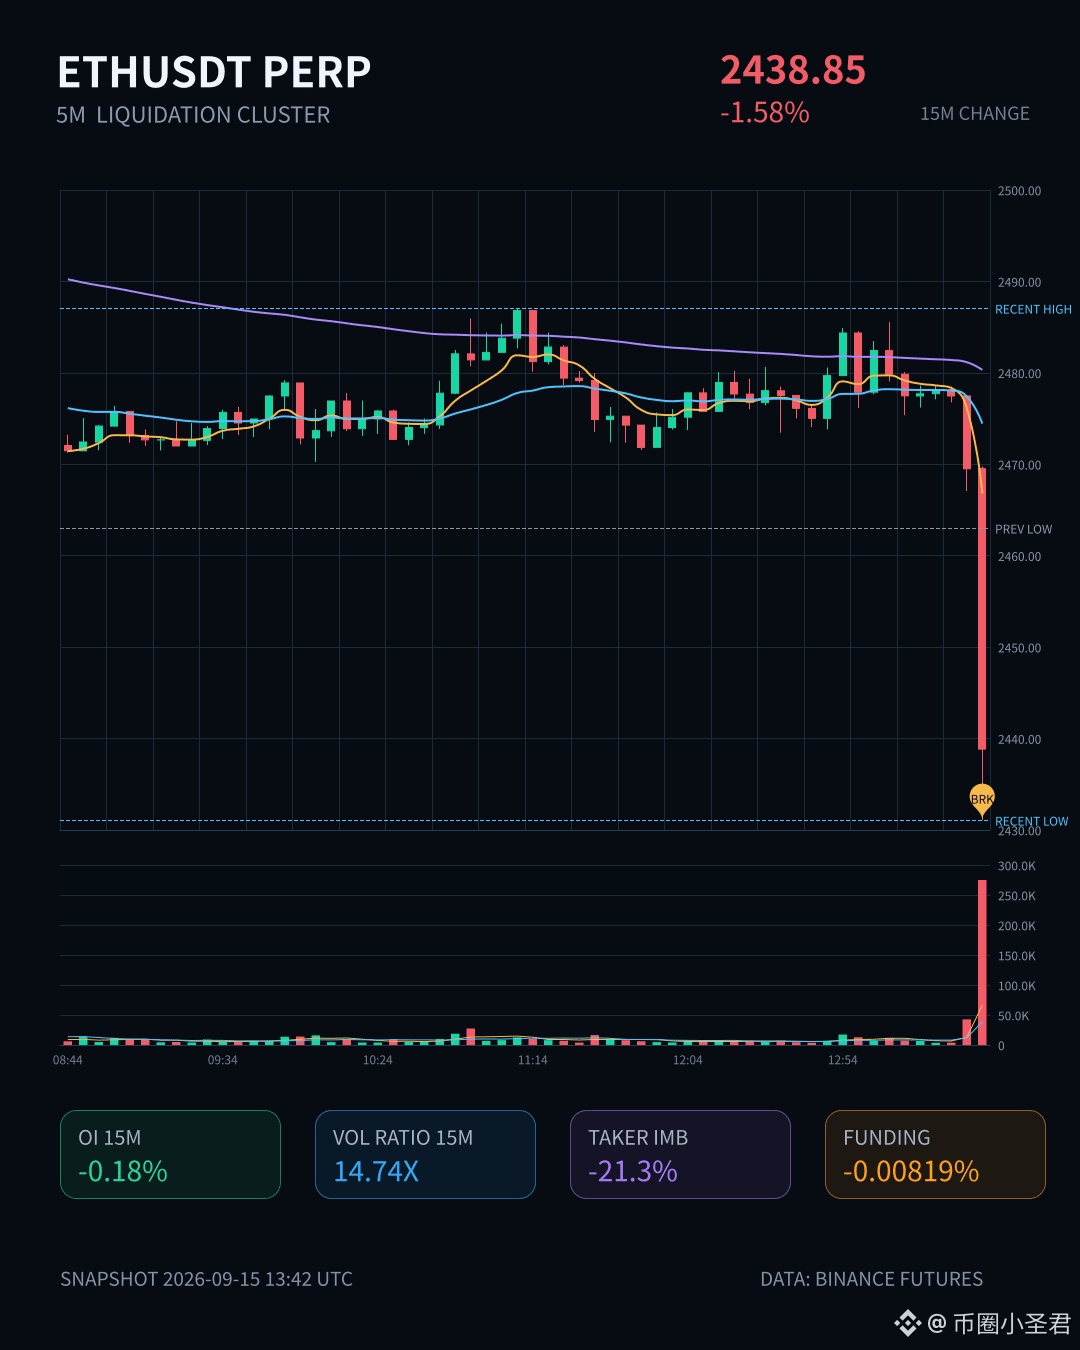
ETH This 15m move just got slammed down directly, down 1.58%. Volume shot up to more than 14x the average—there were clearly people rushing for the exit on the order book. OI fell as well; this isn’t just new shorts entering—it’s longs deleveraging and getting stopped out. On Binance 5m futures, liquidation agents concentrated at 19.76M: sell-side orders were bunched up. Active buy/sell ratio was 0.65. One bearish candle drove straight to the lower edge of the recent range. The OI percentile is at 91.7%—the entire pool queued up to #82, but the notional change ranks 2nd. In plain terms: leveraged positions are being forced to liquidate—not merely panic selling. First, see whether this level can hold; if it can’t, then it’s a vacuum below.
ETH This 15m move just got slammed down directly, down 1.58%. Volume shot up to more than 14x the average—there were clearly people rushing for the exit on the order book. OI fell as well; this isn’t just new shorts entering—it’s longs deleveraging and getting stopped out. On Binance 5m futures, liquidation agents concentrated at 19.76M: sell-side orders were bunched up. Active buy/sell ratio was 0.65. One bearish candle drove straight to the lower edge of the recent range. The OI percentile is at 91.7%—the entire pool queued up to #82, but the notional change ranks 2nd. In plain terms: leveraged positions are being forced to liquidate—not merely panic selling. First, see whether this level can hold; if it can’t, then it’s a vacuum below.
173

Article
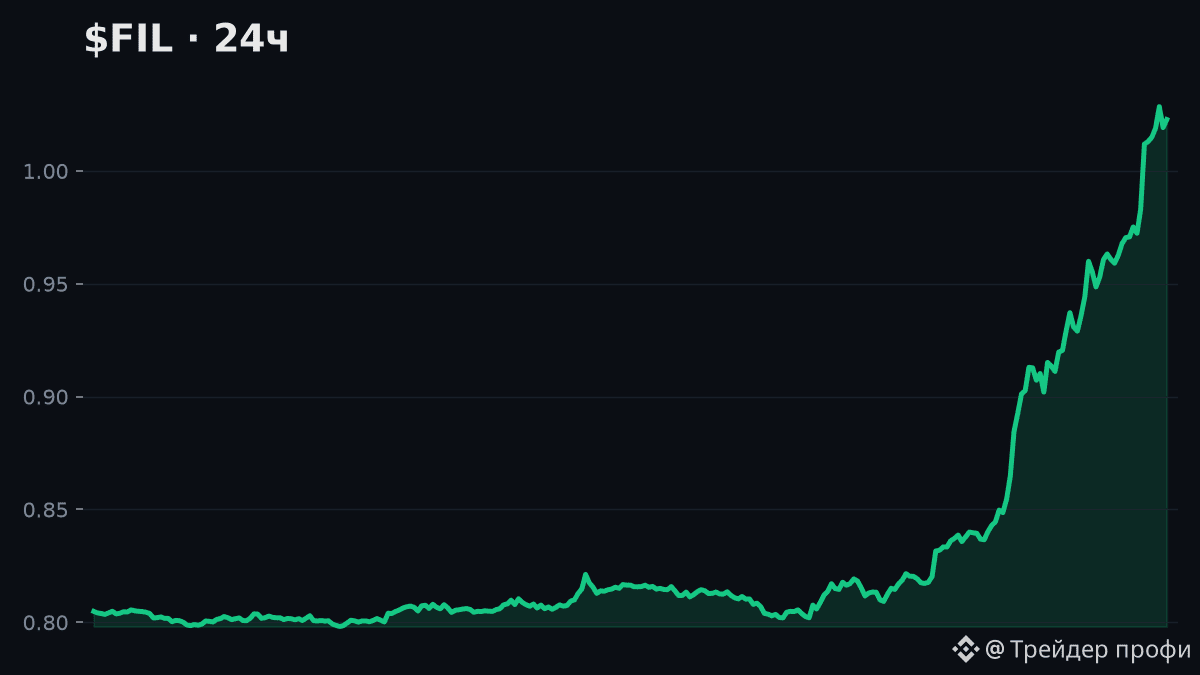
$FIL +27.1% over 24h — delivered the best result of the day in the top-100!🔥 $FIL +27.1% over 24h — delivered the best result of the day in the top-100!
We gathered the hottest picks for you in the last 24 hours. 🔥
🧭 Summary: price movement is aligned with a broader trend — the 7D and 30D charts point in the same direction; confirmed by high trading volume.
🌍 Market context: out of 57 major coins with noticeable movement in the last 24h — 🔼 21 rose, 🔽 36 fell
$FIL +27.1% over 24h — delivered the best result of the day in the top-100!
🔥 $FIL +27.1% over 24h — delivered the best result of the day in the top-100!
We gathered the hottest picks for you in the last 24 hours. 🔥
🧭 Summary: price movement is aligned with a broader trend — the 7D and 30D charts point in the same direction; confirmed by high trading volume.
🌍 Market context: out of 57 major coins with noticeable movement in the last 24h — 🔼 21 rose, 🔽 36 fell
We gathered the hottest picks for you in the last 24 hours. 🔥
🧭 Summary: price movement is aligned with a broader trend — the 7D and 30D charts point in the same direction; confirmed by high trading volume.
🌍 Market context: out of 57 major coins with noticeable movement in the last 24h — 🔼 21 rose, 🔽 36 fell
119
Article
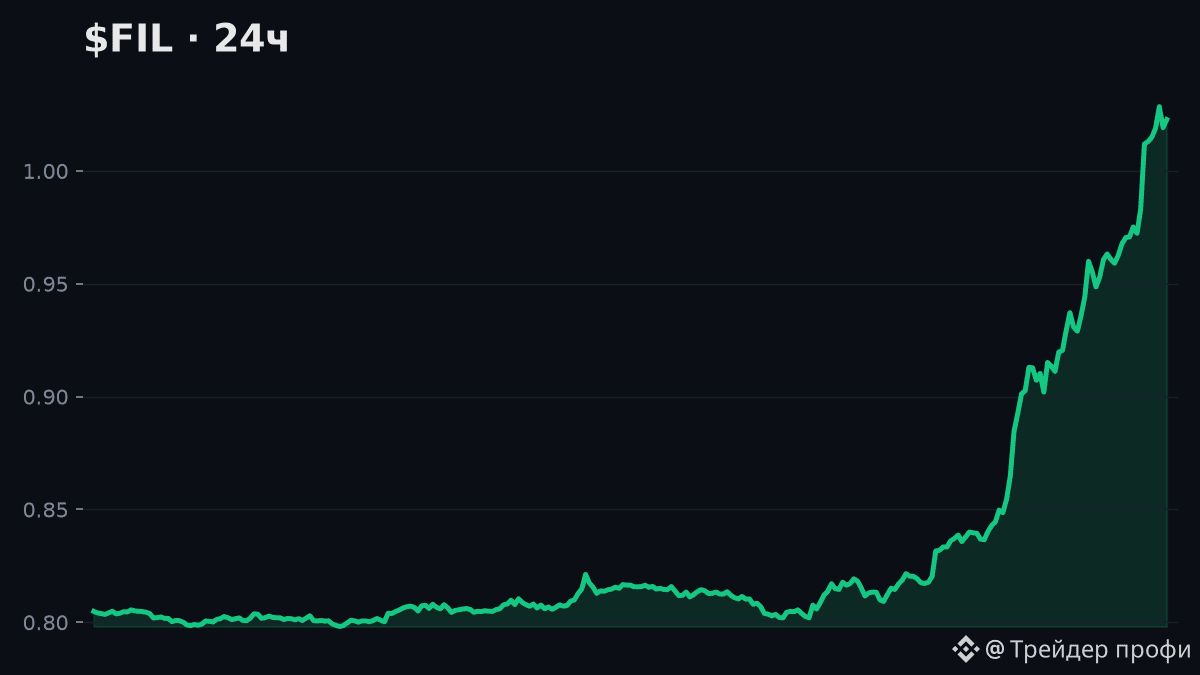
$FIL +27.1% in 24h — fired brighter than anyone else in the top 100!🚀 $FIL +27.1% in 24h — fired brighter than anyone else in the top 100!
Day breakdown — short and to the point.
🧭 Summary: movement within the wider trend — 7d and 30d in the same direction; confirmed by high trading volume.
🌍 Market context: out of 57 large coins with notable movement over 24h — 🔼 21 rose, 🔽 36 fell
$FIL +27.1% in 24h — fired brighter than anyone else in the top 100!
🚀 $FIL +27.1% in 24h — fired brighter than anyone else in the top 100!
Day breakdown — short and to the point.
🧭 Summary: movement within the wider trend — 7d and 30d in the same direction; confirmed by high trading volume.
🌍 Market context: out of 57 large coins with notable movement over 24h — 🔼 21 rose, 🔽 36 fell
Day breakdown — short and to the point.
🧭 Summary: movement within the wider trend — 7d and 30d in the same direction; confirmed by high trading volume.
🌍 Market context: out of 57 large coins with notable movement over 24h — 🔼 21 rose, 🔽 36 fell
155
·
--
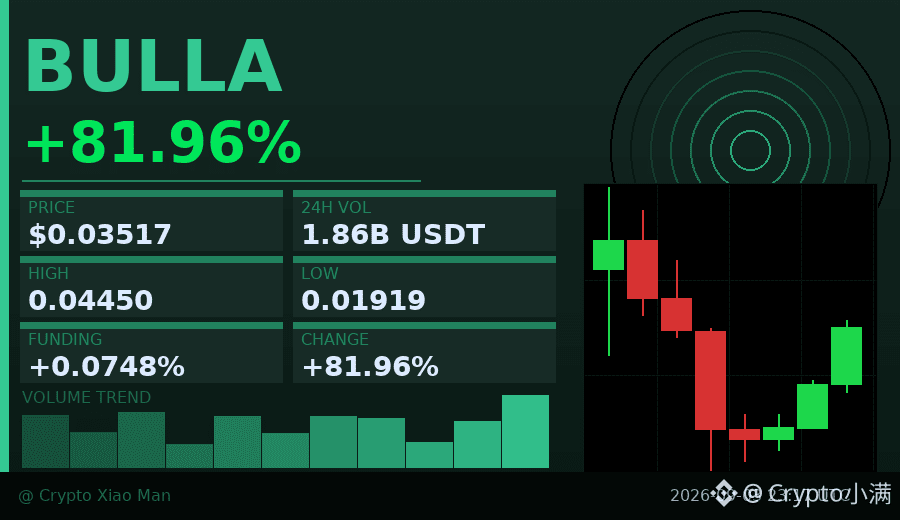
Fell from the high point of $0.0445 to $0.019, then rebounded 82%—what happened with BULLA that day?
It looks like a typical “deep-pit rebound”: first, it dumps a 57% deep drop, and then the bulls step in to buy the dip in batches. After that, three consecutive hourly K-lines close green, pushing the price back to around $0.035.
The trading volume of 186M USDT isn’t small, suggesting real money is involved in the battle. However, the long-to-short ratio of 61% plus the positive funding rate means people chasing higher prices are already getting crowded.
The thing this kind of move fears most is that after the rebound reaches the prior dense trading zone, the trapped-seller unwind and profit-taking sell orders hit at the same time. I’ll observe whether the volume can keep up in the $0.038–$0.040 range.
$BULLA #超跌反弹 #82%
Click the small card below to quickly check the chart 👇
Fell from the high point of $0.0445 to $0.019, then rebounded 82%—what happened with BULLA that day?
It looks like a typical “deep-pit rebound”: first, it dumps a 57% deep drop, and then the bulls step in to buy the dip in batches. After that, three consecutive hourly K-lines close green, pushing the price back to around $0.035.
The trading volume of 186M USDT isn’t small, suggesting real money is involved in the battle. However, the long-to-short ratio of 61% plus the positive funding rate means people chasing higher prices are already getting crowded.
The thing this kind of move fears most is that after the rebound reaches the prior dense trading zone, the trapped-seller unwind and profit-taking sell orders hit at the same time. I’ll observe whether the volume can keep up in the $0.038–$0.040 range.
$BULLA #超跌反弹 #82%
Click the small card below to quickly check the chart 👇
It looks like a typical “deep-pit rebound”: first, it dumps a 57% deep drop, and then the bulls step in to buy the dip in batches. After that, three consecutive hourly K-lines close green, pushing the price back to around $0.035.
The trading volume of 186M USDT isn’t small, suggesting real money is involved in the battle. However, the long-to-short ratio of 61% plus the positive funding rate means people chasing higher prices are already getting crowded.
The thing this kind of move fears most is that after the rebound reaches the prior dense trading zone, the trapped-seller unwind and profit-taking sell orders hit at the same time. I’ll observe whether the volume can keep up in the $0.038–$0.040 range.
$BULLA #超跌反弹 #82%
Click the small card below to quickly check the chart 👇
249

·
--
Trending: Arbitrum (ARBUSDT)Arbitrum (ARBUSDT) is trending on CoinGecko!
Rank: #82
On September 1, 2026, the leading cryptocurrencies posted modest but positive moves, signaling a period of relative calm after weeks of heightened volatility. According to CoinGecko data timestamped at 01:34 UTC, Bitcoin (BTC) traded at **8,385**, up **0.85%** over the past 24 hours with a robust trading volume of **9.36 billion**. Ethereum (ETH) followed suit, priced at **,459.51**, gaining **1.72%** in the same window and recording a volume of **1.58 billion**.
The upward ticks, while not dramatic, reflect a few noteworthy dynamics in the current market landscape:
1. **Institutional Flow Signals** – Both BTC and ETH have seen steady inflows into regulated investment products over the last month. Spot‑ETF holdings for Bitcoin rose by approximately 1.2 % week‑over‑week, while Ethereum‑focused products added roughly 0.9 %. These inflows tend to underpin price stability and can explain the gradual upside observed today.
2. **Network Activity & Upgrades** – Ethereum’s Shanghai‑style upgrade, which enabled smoother withdrawal of staked ETH, continues to drive optimism about reduced selling pressure from stakers. On‑chain metrics show a slight increase in active addresses and a decline in large‑holder (whale) transfers, suggesting that holders are opting to hold rather than move large sums. Bitcoin’s hash rate remains near all‑time highs, indicating sustained miner confidence despite the recent halving‑induced reward reduction.
3. **Macro‑Economic Backdrop** – Global equity markets have been trading in a narrow range, with major indices showing low volatility. The U.S. Dollar Index (DXY) hovered around 103.5, and inflation data released earlier in the week came in line with forecasts, reducing expectations for aggressive monetary tightening. In such an environment, risk‑on assets like cryptocurrencies often find a footing, attracting investors seeking diversification away from traditional fiat‑denominated instruments.
4. **Liquidity Depth** – The 24‑hour volumes for both assets remain substantial, underscoring deep liquidity that can absorb sizable orders without causing sharp price swings. This depth helps prevent the kind of flash crashes that have occasionally rattled the market during periods of low trading activity.
While today’s gains are modest, they highlight a market that is finding equilibrium after a series of rapid moves earlier in the year. Traders should keep an eye on upcoming catalysts—such as the anticipated rollout of Ethereum’s Layer‑2 scaling solutions, potential regulatory clarifications in major jurisdictions, and any shifts in macro‑economic policy—as these could tilt the balance toward either further accumulation or a corrective phase.
In summary, Bitcoin and Ethereum are currently exhibiting steady, data‑backed upward momentum supported by institutional interest, healthy on‑chain activity, and a relatively stable macro backdrop. As always, market participants should conduct their own research and consider multiple factors before making any trading decisions.
#arb #crypto #trending #CoinGecko
Trending: Arbitrum (ARBUSDT)
Arbitrum (ARBUSDT) is trending on CoinGecko!
Rank: #82
On September 1, 2026, the leading cryptocurrencies posted modest but positive moves, signaling a period of relative calm after weeks of heightened volatility. According to CoinGecko data timestamped at 01:34 UTC, Bitcoin (BTC) traded at **8,385**, up **0.85%** over the past 24 hours with a robust trading volume of **9.36 billion**. Ethereum (ETH) followed suit, priced at **,459.51**, gaining **1.72%** in the same window and recording a volume of **1.58 billion**.
The upward ticks, while not dramatic, reflect a few noteworthy dynamics in the current market landscape:
1. **Institutional Flow Signals** – Both BTC and ETH have seen steady inflows into regulated investment products over the last month. Spot‑ETF holdings for Bitcoin rose by approximately 1.2 % week‑over‑week, while Ethereum‑focused products added roughly 0.9 %. These inflows tend to underpin price stability and can explain the gradual upside observed today.
2. **Network Activity & Upgrades** – Ethereum’s Shanghai‑style upgrade, which enabled smoother withdrawal of staked ETH, continues to drive optimism about reduced selling pressure from stakers. On‑chain metrics show a slight increase in active addresses and a decline in large‑holder (whale) transfers, suggesting that holders are opting to hold rather than move large sums. Bitcoin’s hash rate remains near all‑time highs, indicating sustained miner confidence despite the recent halving‑induced reward reduction.
3. **Macro‑Economic Backdrop** – Global equity markets have been trading in a narrow range, with major indices showing low volatility. The U.S. Dollar Index (DXY) hovered around 103.5, and inflation data released earlier in the week came in line with forecasts, reducing expectations for aggressive monetary tightening. In such an environment, risk‑on assets like cryptocurrencies often find a footing, attracting investors seeking diversification away from traditional fiat‑denominated instruments.
4. **Liquidity Depth** – The 24‑hour volumes for both assets remain substantial, underscoring deep liquidity that can absorb sizable orders without causing sharp price swings. This depth helps prevent the kind of flash crashes that have occasionally rattled the market during periods of low trading activity.
While today’s gains are modest, they highlight a market that is finding equilibrium after a series of rapid moves earlier in the year. Traders should keep an eye on upcoming catalysts—such as the anticipated rollout of Ethereum’s Layer‑2 scaling solutions, potential regulatory clarifications in major jurisdictions, and any shifts in macro‑economic policy—as these could tilt the balance toward either further accumulation or a corrective phase.
In summary, Bitcoin and Ethereum are currently exhibiting steady, data‑backed upward momentum supported by institutional interest, healthy on‑chain activity, and a relatively stable macro backdrop. As always, market participants should conduct their own research and consider multiple factors before making any trading decisions.
#arb #crypto #trending #CoinGecko
Rank: #82
On September 1, 2026, the leading cryptocurrencies posted modest but positive moves, signaling a period of relative calm after weeks of heightened volatility. According to CoinGecko data timestamped at 01:34 UTC, Bitcoin (BTC) traded at **8,385**, up **0.85%** over the past 24 hours with a robust trading volume of **9.36 billion**. Ethereum (ETH) followed suit, priced at **,459.51**, gaining **1.72%** in the same window and recording a volume of **1.58 billion**.
The upward ticks, while not dramatic, reflect a few noteworthy dynamics in the current market landscape:
1. **Institutional Flow Signals** – Both BTC and ETH have seen steady inflows into regulated investment products over the last month. Spot‑ETF holdings for Bitcoin rose by approximately 1.2 % week‑over‑week, while Ethereum‑focused products added roughly 0.9 %. These inflows tend to underpin price stability and can explain the gradual upside observed today.
2. **Network Activity & Upgrades** – Ethereum’s Shanghai‑style upgrade, which enabled smoother withdrawal of staked ETH, continues to drive optimism about reduced selling pressure from stakers. On‑chain metrics show a slight increase in active addresses and a decline in large‑holder (whale) transfers, suggesting that holders are opting to hold rather than move large sums. Bitcoin’s hash rate remains near all‑time highs, indicating sustained miner confidence despite the recent halving‑induced reward reduction.
3. **Macro‑Economic Backdrop** – Global equity markets have been trading in a narrow range, with major indices showing low volatility. The U.S. Dollar Index (DXY) hovered around 103.5, and inflation data released earlier in the week came in line with forecasts, reducing expectations for aggressive monetary tightening. In such an environment, risk‑on assets like cryptocurrencies often find a footing, attracting investors seeking diversification away from traditional fiat‑denominated instruments.
4. **Liquidity Depth** – The 24‑hour volumes for both assets remain substantial, underscoring deep liquidity that can absorb sizable orders without causing sharp price swings. This depth helps prevent the kind of flash crashes that have occasionally rattled the market during periods of low trading activity.
While today’s gains are modest, they highlight a market that is finding equilibrium after a series of rapid moves earlier in the year. Traders should keep an eye on upcoming catalysts—such as the anticipated rollout of Ethereum’s Layer‑2 scaling solutions, potential regulatory clarifications in major jurisdictions, and any shifts in macro‑economic policy—as these could tilt the balance toward either further accumulation or a corrective phase.
In summary, Bitcoin and Ethereum are currently exhibiting steady, data‑backed upward momentum supported by institutional interest, healthy on‑chain activity, and a relatively stable macro backdrop. As always, market participants should conduct their own research and consider multiple factors before making any trading decisions.
#arb #crypto #trending #CoinGecko
4
·
--
Trending: Arbitrum (ARBUSDT)Arbitrum (ARBUSDT) is trending on CoinGecko!
Rank: #82
On September 1, 2026, the two largest cryptocurrencies by market capitalization posted modest but positive moves, reflecting a market that is still finding its footing after a period of heightened volatility. According to CoinGecko data captured at 01:21 UTC, Bitcoin (BTC) traded at **8,598**, up **1.09%** over the past 24 hours, while Ethereum (ETH) sat at **,468.73**, gaining **2.04%** in the same window.
The accompanying trading volumes underscore sustained investor interest. Bitcoin’s 24‑hour volume reached **9.33 billion**, and Ethereum’s volume totaled **1.59 billion**. These figures are well above the average daily turnover seen during the quieter months of early 2026, suggesting that both retail and institutional participants remain active despite the relatively small price swings.
Several factors may be contributing to this steady upward bias. First, macro‑economic indicators from the United States and the Eurozone have shown signs of easing inflation pressures, which often reduces the demand for traditional safe‑haven assets and can shift some capital toward risk‑on investments like crypto. Second, ongoing developments in Ethereum’s layer‑2 ecosystem—particularly the rollout of newer zero‑knowledge rollup solutions—have continued to drive developer activity and transaction volume, providing fundamental support for ETH’s price. Third, Bitcoin’s recent resilience around the 8k level has been viewed by many market observers as a test of its “psychological barrier” near the 0k mark; a clean break above that level could trigger further buying interest, while a failure to hold might prompt profit‑taking.
It is also worth noting that the top‑mover, gainer, and loser lists returned empty in the data snapshot, indicating that the broader altcoin market was relatively flat during this period. This lack of extreme outliers suggests that the current momentum is largely driven by the two leading assets rather than speculative rallies in smaller tokens.
For traders and enthusiasts, the takeaway is clear: while price moves are modest, the underlying volume remains healthy, and both BTC and ETH are benefiting from a combination of macro‑economic tailwinds and ongoing technical upgrades. Monitoring key resistance levels—0k for Bitcoin and ,600 for Ethereum—alongside volume trends will be essential for gauging whether the current uptrend can sustain itself in the coming days.
#arb #crypto #trending #CoinGecko
Trending: Arbitrum (ARBUSDT)
Arbitrum (ARBUSDT) is trending on CoinGecko!
Rank: #82
On September 1, 2026, the two largest cryptocurrencies by market capitalization posted modest but positive moves, reflecting a market that is still finding its footing after a period of heightened volatility. According to CoinGecko data captured at 01:21 UTC, Bitcoin (BTC) traded at **8,598**, up **1.09%** over the past 24 hours, while Ethereum (ETH) sat at **,468.73**, gaining **2.04%** in the same window.
The accompanying trading volumes underscore sustained investor interest. Bitcoin’s 24‑hour volume reached **9.33 billion**, and Ethereum’s volume totaled **1.59 billion**. These figures are well above the average daily turnover seen during the quieter months of early 2026, suggesting that both retail and institutional participants remain active despite the relatively small price swings.
Several factors may be contributing to this steady upward bias. First, macro‑economic indicators from the United States and the Eurozone have shown signs of easing inflation pressures, which often reduces the demand for traditional safe‑haven assets and can shift some capital toward risk‑on investments like crypto. Second, ongoing developments in Ethereum’s layer‑2 ecosystem—particularly the rollout of newer zero‑knowledge rollup solutions—have continued to drive developer activity and transaction volume, providing fundamental support for ETH’s price. Third, Bitcoin’s recent resilience around the 8k level has been viewed by many market observers as a test of its “psychological barrier” near the 0k mark; a clean break above that level could trigger further buying interest, while a failure to hold might prompt profit‑taking.
It is also worth noting that the top‑mover, gainer, and loser lists returned empty in the data snapshot, indicating that the broader altcoin market was relatively flat during this period. This lack of extreme outliers suggests that the current momentum is largely driven by the two leading assets rather than speculative rallies in smaller tokens.
For traders and enthusiasts, the takeaway is clear: while price moves are modest, the underlying volume remains healthy, and both BTC and ETH are benefiting from a combination of macro‑economic tailwinds and ongoing technical upgrades. Monitoring key resistance levels—0k for Bitcoin and ,600 for Ethereum—alongside volume trends will be essential for gauging whether the current uptrend can sustain itself in the coming days.
#arb #crypto #trending #CoinGecko
Rank: #82
On September 1, 2026, the two largest cryptocurrencies by market capitalization posted modest but positive moves, reflecting a market that is still finding its footing after a period of heightened volatility. According to CoinGecko data captured at 01:21 UTC, Bitcoin (BTC) traded at **8,598**, up **1.09%** over the past 24 hours, while Ethereum (ETH) sat at **,468.73**, gaining **2.04%** in the same window.
The accompanying trading volumes underscore sustained investor interest. Bitcoin’s 24‑hour volume reached **9.33 billion**, and Ethereum’s volume totaled **1.59 billion**. These figures are well above the average daily turnover seen during the quieter months of early 2026, suggesting that both retail and institutional participants remain active despite the relatively small price swings.
Several factors may be contributing to this steady upward bias. First, macro‑economic indicators from the United States and the Eurozone have shown signs of easing inflation pressures, which often reduces the demand for traditional safe‑haven assets and can shift some capital toward risk‑on investments like crypto. Second, ongoing developments in Ethereum’s layer‑2 ecosystem—particularly the rollout of newer zero‑knowledge rollup solutions—have continued to drive developer activity and transaction volume, providing fundamental support for ETH’s price. Third, Bitcoin’s recent resilience around the 8k level has been viewed by many market observers as a test of its “psychological barrier” near the 0k mark; a clean break above that level could trigger further buying interest, while a failure to hold might prompt profit‑taking.
It is also worth noting that the top‑mover, gainer, and loser lists returned empty in the data snapshot, indicating that the broader altcoin market was relatively flat during this period. This lack of extreme outliers suggests that the current momentum is largely driven by the two leading assets rather than speculative rallies in smaller tokens.
For traders and enthusiasts, the takeaway is clear: while price moves are modest, the underlying volume remains healthy, and both BTC and ETH are benefiting from a combination of macro‑economic tailwinds and ongoing technical upgrades. Monitoring key resistance levels—0k for Bitcoin and ,600 for Ethereum—alongside volume trends will be essential for gauging whether the current uptrend can sustain itself in the coming days.
#arb #crypto #trending #CoinGecko
2
·
--
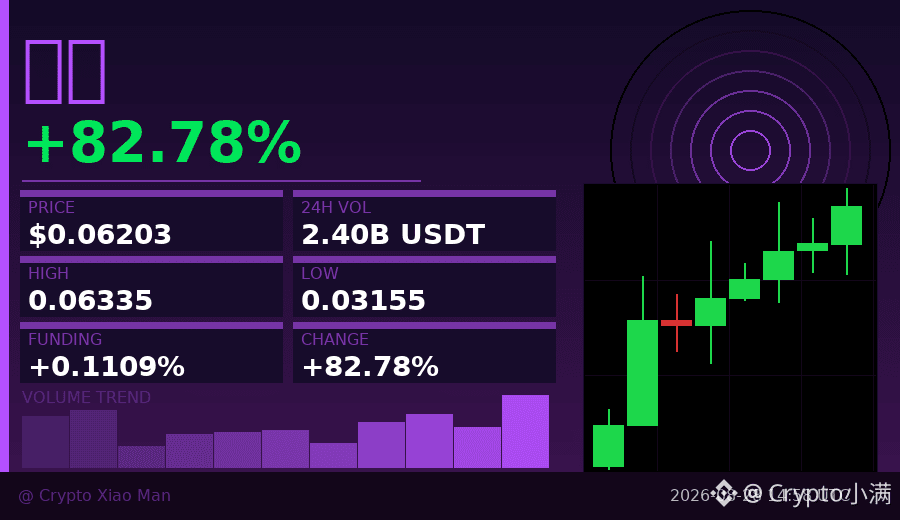
64% of people are shorting, but it’s up 82%.
That’s exactly the situation with the lobster today.
The price surged from 0.031 straight to 0.063—nearly doubled—
while two-thirds of positions in the market are shorts.
This is what’s called a “short squeeze.”
The more it falls, the more shorts pile in; the more shorts pile in, the more they get forced to close.
And when positions are closed, it pushes the price up even further.
The funding rate has risen to 0.111%, meaning longs are paying shorts—
but now, it’s actually the shorts who are getting beaten up passively.
Open interest is as high as 750 million, indicating a very large position size.
Short-term volatility will continue to amplify, no matter which direction it moves.
Three consecutive bullish candles in a row suggest that, in the short term, the trend is still in the hands of the bulls.
But keep in mind: after a 80% rally, the risk of chasing is also doubled.
$CLAW #空头陷阱 #82%爆涨
Click the small card below to quickly check the行情👇
64% of people are shorting, but it’s up 82%.
That’s exactly the situation with the lobster today.
The price surged from 0.031 straight to 0.063—nearly doubled—
while two-thirds of positions in the market are shorts.
This is what’s called a “short squeeze.”
The more it falls, the more shorts pile in; the more shorts pile in, the more they get forced to close.
And when positions are closed, it pushes the price up even further.
The funding rate has risen to 0.111%, meaning longs are paying shorts—
but now, it’s actually the shorts who are getting beaten up passively.
Open interest is as high as 750 million, indicating a very large position size.
Short-term volatility will continue to amplify, no matter which direction it moves.
Three consecutive bullish candles in a row suggest that, in the short term, the trend is still in the hands of the bulls.
But keep in mind: after a 80% rally, the risk of chasing is also doubled.
$CLAW #空头陷阱 #82%爆涨
Click the small card below to quickly check the行情👇
That’s exactly the situation with the lobster today.
The price surged from 0.031 straight to 0.063—nearly doubled—
while two-thirds of positions in the market are shorts.
This is what’s called a “short squeeze.”
The more it falls, the more shorts pile in; the more shorts pile in, the more they get forced to close.
And when positions are closed, it pushes the price up even further.
The funding rate has risen to 0.111%, meaning longs are paying shorts—
but now, it’s actually the shorts who are getting beaten up passively.
Open interest is as high as 750 million, indicating a very large position size.
Short-term volatility will continue to amplify, no matter which direction it moves.
Three consecutive bullish candles in a row suggest that, in the short term, the trend is still in the hands of the bulls.
But keep in mind: after a 80% rally, the risk of chasing is also doubled.
$CLAW #空头陷阱 #82%爆涨
Click the small card below to quickly check the行情👇
44

·
--
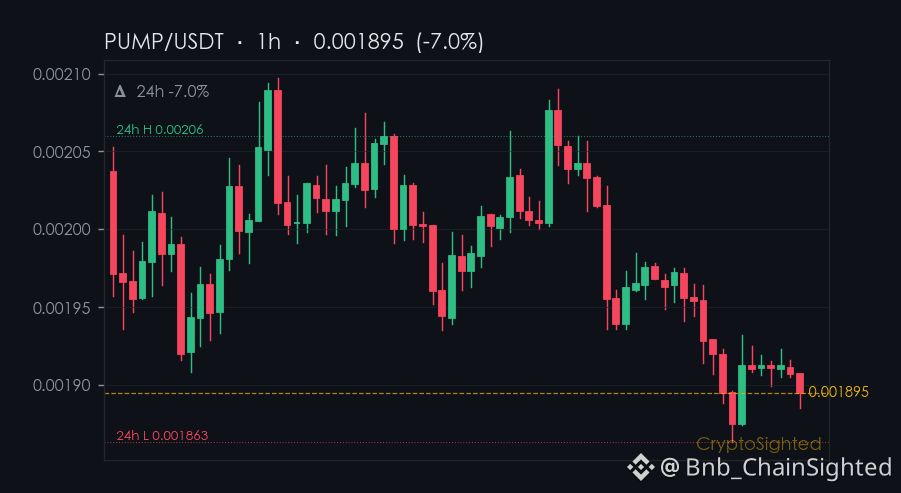
$PUMP is down 7.0% in 24 hours, yet its 7-day price run is still ↑18.1%.
That’s the kind of split that makes you pause.
The price is below its 24-hour high of $0.00206, and it’s trading at $0.001894 - a drop that’s not being matched by a drop in volume or open interest.
In fact, derivatives volume is sitting at $51M, and open interest has grown 14.4% in seven days.
That’s the first tension: price is down, but the leverage on the market is still stacking up.
You don’t see that often. Usually, a sharp move like this would come with a clear catalyst, but there’s nothing in the news that explains this drop.
It’s not panic. It’s something else - maybe a test of liquidity, maybe a shift in funding dynamics.
Checkpoint: PUMP is trading at $0.001894 now - if it holds above that level for the next 24 hours, the move might still have legs.
If it drops below, the divergence between price and leverage could be more than just a test.
—
📊 14 directional calls in the last 30d, every one auto-settled against price. Direction only — no buy/sell calls.
Not financial advice. DYOR.
📌 Funding Pulse · #82 · #FundingRate #CryptoSighted $PUMP
$PUMP is down 7.0% in 24 hours, yet its 7-day price run is still ↑18.1%.
That’s the kind of split that makes you pause.
The price is below its 24-hour high of $0.00206, and it’s trading at $0.001894 - a drop that’s not being matched by a drop in volume or open interest.
In fact, derivatives volume is sitting at $51M, and open interest has grown 14.4% in seven days.
That’s the first tension: price is down, but the leverage on the market is still stacking up.
You don’t see that often. Usually, a sharp move like this would come with a clear catalyst, but there’s nothing in the news that explains this drop.
It’s not panic. It’s something else - maybe a test of liquidity, maybe a shift in funding dynamics.
Checkpoint: PUMP is trading at $0.001894 now - if it holds above that level for the next 24 hours, the move might still have legs.
If it drops below, the divergence between price and leverage could be more than just a test.
—
📊 14 directional calls in the last 30d, every one auto-settled against price. Direction only — no buy/sell calls.
Not financial advice. DYOR.
📌 Funding Pulse · #82 · #FundingRate #CryptoSighted $PUMP
That’s the kind of split that makes you pause.
The price is below its 24-hour high of $0.00206, and it’s trading at $0.001894 - a drop that’s not being matched by a drop in volume or open interest.
In fact, derivatives volume is sitting at $51M, and open interest has grown 14.4% in seven days.
That’s the first tension: price is down, but the leverage on the market is still stacking up.
You don’t see that often. Usually, a sharp move like this would come with a clear catalyst, but there’s nothing in the news that explains this drop.
It’s not panic. It’s something else - maybe a test of liquidity, maybe a shift in funding dynamics.
Checkpoint: PUMP is trading at $0.001894 now - if it holds above that level for the next 24 hours, the move might still have legs.
If it drops below, the divergence between price and leverage could be more than just a test.
—
📊 14 directional calls in the last 30d, every one auto-settled against price. Direction only — no buy/sell calls.
Not financial advice. DYOR.
📌 Funding Pulse · #82 · #FundingRate #CryptoSighted $PUMP
190

·
--
$RNDR quick research note, not a hype thread.
Render is being priced like a narrative reset, not just a candle trade.
Price: $7.0300
Market cap: $714.8M
Rank: #82
FDV: $0.0000
7d / 30d: -7.5% / -14.4%
The part I care about:
Circulating ratio is about 97.2%, so supply pressure belongs in the valuation debate.
Daily trend: Neutral/Consolidating ↔️
RSI: 51.2
Support: $5.6500
Resistance: $7.7300
My read: if $RNDR reclaims resistance, the market starts paying for the story again. Lose support, and I would rather wait than be early. NFA.
Is $RNDR undervalued here, or just another bounce trap?
$RNDR quick research note, not a hype thread.
Render is being priced like a narrative reset, not just a candle trade.
Price: $7.0300
Market cap: $714.8M
Rank: #82
FDV: $0.0000
7d / 30d: -7.5% / -14.4%
The part I care about:
Circulating ratio is about 97.2%, so supply pressure belongs in the valuation debate.
Daily trend: Neutral/Consolidating ↔️
RSI: 51.2
Support: $5.6500
Resistance: $7.7300
My read: if $RNDR reclaims resistance, the market starts paying for the story again. Lose support, and I would rather wait than be early. NFA.
Is $RNDR undervalued here, or just another bounce trap?
Render is being priced like a narrative reset, not just a candle trade.
Price: $7.0300
Market cap: $714.8M
Rank: #82
FDV: $0.0000
7d / 30d: -7.5% / -14.4%
The part I care about:
Circulating ratio is about 97.2%, so supply pressure belongs in the valuation debate.
Daily trend: Neutral/Consolidating ↔️
RSI: 51.2
Support: $5.6500
Resistance: $7.7300
My read: if $RNDR reclaims resistance, the market starts paying for the story again. Lose support, and I would rather wait than be early. NFA.
Is $RNDR undervalued here, or just another bounce trap?
24

·
--
After the AI narrative cools off, the destination of capital is worth examining more than $RENDER’s price itself. From $1.60 to $1.37, it fell 15% over 30 days and nearly 8% over 7 days, yet it’s almost flat over the past 24 hours—this isn’t panic selling, but a passive drift downward as trading volume keeps shrinking. With a market cap ranked at #82 (about $700 million), daily trading volume is only around $20 million, turnover is below 3%, and liquidity has already withered into a relatively quiet state.
In this kind of structure, $RENDER looks more like an alpha asset that was forgotten by the narrative: the fundamental logic of GPU rendering hasn’t changed, but the market isn’t buying it in the short term. What really needs confirming is whether new capital or ecosystem catalysts can break this low-liquidity equilibrium. For example, has there been any recent institutional accumulation, changes in network usage data, or news of new partners? If you’re tracking such leads, feel free to share them—this is more important than guessing where the bottom is.
The risk is that if the AI narrative continues to be sidelined and there’s no independent catalyst, $RENDER may consolidate for the long term and even see further downside with shrinking volume. It’s still 90% down from its ATH—not because it’s expensive, but because market consensus has fallen apart.
After the AI narrative cools off, the destination of capital is worth examining more than $RENDER ’s price itself. From $1.60 to $1.37, it fell 15% over 30 days and nearly 8% over 7 days, yet it’s almost flat over the past 24 hours—this isn’t panic selling, but a passive drift downward as trading volume keeps shrinking. With a market cap ranked at #82 (about $700 million), daily trading volume is only around $20 million, turnover is below 3%, and liquidity has already withered into a relatively quiet state.
In this kind of structure, $RENDER looks more like an alpha asset that was forgotten by the narrative: the fundamental logic of GPU rendering hasn’t changed, but the market isn’t buying it in the short term. What really needs confirming is whether new capital or ecosystem catalysts can break this low-liquidity equilibrium. For example, has there been any recent institutional accumulation, changes in network usage data, or news of new partners? If you’re tracking such leads, feel free to share them—this is more important than guessing where the bottom is.
The risk is that if the AI narrative continues to be sidelined and there’s no independent catalyst, $RENDER may consolidate for the long term and even see further downside with shrinking volume. It’s still 90% down from its ATH—not because it’s expensive, but because market consensus has fallen apart.
In this kind of structure, $RENDER looks more like an alpha asset that was forgotten by the narrative: the fundamental logic of GPU rendering hasn’t changed, but the market isn’t buying it in the short term. What really needs confirming is whether new capital or ecosystem catalysts can break this low-liquidity equilibrium. For example, has there been any recent institutional accumulation, changes in network usage data, or news of new partners? If you’re tracking such leads, feel free to share them—this is more important than guessing where the bottom is.
The risk is that if the AI narrative continues to be sidelined and there’s no independent catalyst, $RENDER may consolidate for the long term and even see further downside with shrinking volume. It’s still 90% down from its ATH—not because it’s expensive, but because market consensus has fallen apart.
42
·
--
For the holders of $KAS , the hardest thing right now may not be whether to sell, but not knowing what price to use as an anchor for their position. It’s still 87.73% away from the ATH. Over the past year, the trend has almost been a slow downward slope. Current price is $0.025444, down 2.05% in the last 24 hours—but this kind of fluctuation is not even enough to count as noise compared to the bigger trend.
Over 30 days, it slid from $0.028386 to $0.025444, a drop of about 10%. What’s truly worth noting isn’t the price, but the trading volume. Daily trading volume fell from over $10M on July 16 to only $4.65M by August 13. The classic signs of a slow, bearish grind on shrinking volume include both a lack of selling pressure and a lack of bids—no panic-driven selloff, just a “warm-water boil” type of market.
Market cap is $703M, ranking #82, which suggests it hasn’t been completely abandoned by capital yet. But the $4.65M daily turnover relative to this market cap implies something close to liquidity drying up.
What I care about more is the buyback/repurchase behavior: within a month, there have been no signs of any single day’s volume rising back enough to reclaim the prior highs, and there’s also been no signal of a volume-backed rebound after rejecting new lows. The current price is falling across all major timeframes. The only sense of support comes from occasional sideways consolidation during the selloff, but these levels often prove fragile when a volume-backed decline happens.
It’s important to be clear: at this moment, $KAS isn’t being actively shorted—it’s being forgotten. The $4.65M trading volume can’t withstand any narrative-driven stimulation, but it also won’t instantly implode just because of emotional, purely sentiment-based dumping. What really needs to be confirmed isn’t which integer level the price breaks, but whether at some price point the trading volume suddenly expands to above $15M—regardless of direction. Only when volume returns can this coin re-enter a zone that’s genuinely discussable. Until then, holders aren’t deciding which direction the market will go—they’re deciding whether they have the patience to wait for liquidity to come back.
For the holders of $KAS , the hardest thing right now may not be whether to sell, but not knowing what price to use as an anchor for their position. It’s still 87.73% away from the ATH. Over the past year, the trend has almost been a slow downward slope. Current price is $0.025444, down 2.05% in the last 24 hours—but this kind of fluctuation is not even enough to count as noise compared to the bigger trend.
Over 30 days, it slid from $0.028386 to $0.025444, a drop of about 10%. What’s truly worth noting isn’t the price, but the trading volume. Daily trading volume fell from over $10M on July 16 to only $4.65M by August 13. The classic signs of a slow, bearish grind on shrinking volume include both a lack of selling pressure and a lack of bids—no panic-driven selloff, just a “warm-water boil” type of market.
Market cap is $703M, ranking #82, which suggests it hasn’t been completely abandoned by capital yet. But the $4.65M daily turnover relative to this market cap implies something close to liquidity drying up.
What I care about more is the buyback/repurchase behavior: within a month, there have been no signs of any single day’s volume rising back enough to reclaim the prior highs, and there’s also been no signal of a volume-backed rebound after rejecting new lows. The current price is falling across all major timeframes. The only sense of support comes from occasional sideways consolidation during the selloff, but these levels often prove fragile when a volume-backed decline happens.
It’s important to be clear: at this moment, $KAS isn’t being actively shorted—it’s being forgotten. The $4.65M trading volume can’t withstand any narrative-driven stimulation, but it also won’t instantly implode just because of emotional, purely sentiment-based dumping. What really needs to be confirmed isn’t which integer level the price breaks, but whether at some price point the trading volume suddenly expands to above $15M—regardless of direction. Only when volume returns can this coin re-enter a zone that’s genuinely discussable. Until then, holders aren’t deciding which direction the market will go—they’re deciding whether they have the patience to wait for liquidity to come back.
Over 30 days, it slid from $0.028386 to $0.025444, a drop of about 10%. What’s truly worth noting isn’t the price, but the trading volume. Daily trading volume fell from over $10M on July 16 to only $4.65M by August 13. The classic signs of a slow, bearish grind on shrinking volume include both a lack of selling pressure and a lack of bids—no panic-driven selloff, just a “warm-water boil” type of market.
Market cap is $703M, ranking #82, which suggests it hasn’t been completely abandoned by capital yet. But the $4.65M daily turnover relative to this market cap implies something close to liquidity drying up.
What I care about more is the buyback/repurchase behavior: within a month, there have been no signs of any single day’s volume rising back enough to reclaim the prior highs, and there’s also been no signal of a volume-backed rebound after rejecting new lows. The current price is falling across all major timeframes. The only sense of support comes from occasional sideways consolidation during the selloff, but these levels often prove fragile when a volume-backed decline happens.
It’s important to be clear: at this moment, $KAS isn’t being actively shorted—it’s being forgotten. The $4.65M trading volume can’t withstand any narrative-driven stimulation, but it also won’t instantly implode just because of emotional, purely sentiment-based dumping. What really needs to be confirmed isn’t which integer level the price breaks, but whether at some price point the trading volume suddenly expands to above $15M—regardless of direction. Only when volume returns can this coin re-enter a zone that’s genuinely discussable. Until then, holders aren’t deciding which direction the market will go—they’re deciding whether they have the patience to wait for liquidity to come back.
37
·
--
10 new contracts listed in a week.
Binance just added 10 new futures contracts in a span of seven days - and it’s not just a numbers game. It’s a shift in how the market is being built and who’s building it.
Think of the crypto market as a restaurant. Every new contract is like a new dish on the menu - some are familiar, others are experimental. Binance is not just adding more dishes; it’s expanding the kitchen. And in this case, the menu is getting more diverse - not just crypto assets, but also TradFi instruments like stocks and bonds, wrapped in the familiar USDⓈ-margining structure.
Now, the question is: are these new contracts just another layer of complexity, or are they a sign of something bigger? Are they filling a gap, or are they a distraction? The answer lies in how they’re being used - and that’s where the real data comes in.
spot bid or leverage push - which do you see?
—
For educational purposes only. Not financial advice.
📌 Crypto 101 · #82 · #CryptoEducation #CryptoSighted
10 new contracts listed in a week.
Binance just added 10 new futures contracts in a span of seven days - and it’s not just a numbers game. It’s a shift in how the market is being built and who’s building it.
Think of the crypto market as a restaurant. Every new contract is like a new dish on the menu - some are familiar, others are experimental. Binance is not just adding more dishes; it’s expanding the kitchen. And in this case, the menu is getting more diverse - not just crypto assets, but also TradFi instruments like stocks and bonds, wrapped in the familiar USDⓈ-margining structure.
Now, the question is: are these new contracts just another layer of complexity, or are they a sign of something bigger? Are they filling a gap, or are they a distraction? The answer lies in how they’re being used - and that’s where the real data comes in.
spot bid or leverage push - which do you see?
—
For educational purposes only. Not financial advice.
📌 Crypto 101 · #82 · #CryptoEducation #CryptoSighted
Binance just added 10 new futures contracts in a span of seven days - and it’s not just a numbers game. It’s a shift in how the market is being built and who’s building it.
Think of the crypto market as a restaurant. Every new contract is like a new dish on the menu - some are familiar, others are experimental. Binance is not just adding more dishes; it’s expanding the kitchen. And in this case, the menu is getting more diverse - not just crypto assets, but also TradFi instruments like stocks and bonds, wrapped in the familiar USDⓈ-margining structure.
Now, the question is: are these new contracts just another layer of complexity, or are they a sign of something bigger? Are they filling a gap, or are they a distraction? The answer lies in how they’re being used - and that’s where the real data comes in.
spot bid or leverage push - which do you see?
—
For educational purposes only. Not financial advice.
📌 Crypto 101 · #82 · #CryptoEducation #CryptoSighted
152

·
--
Bullish
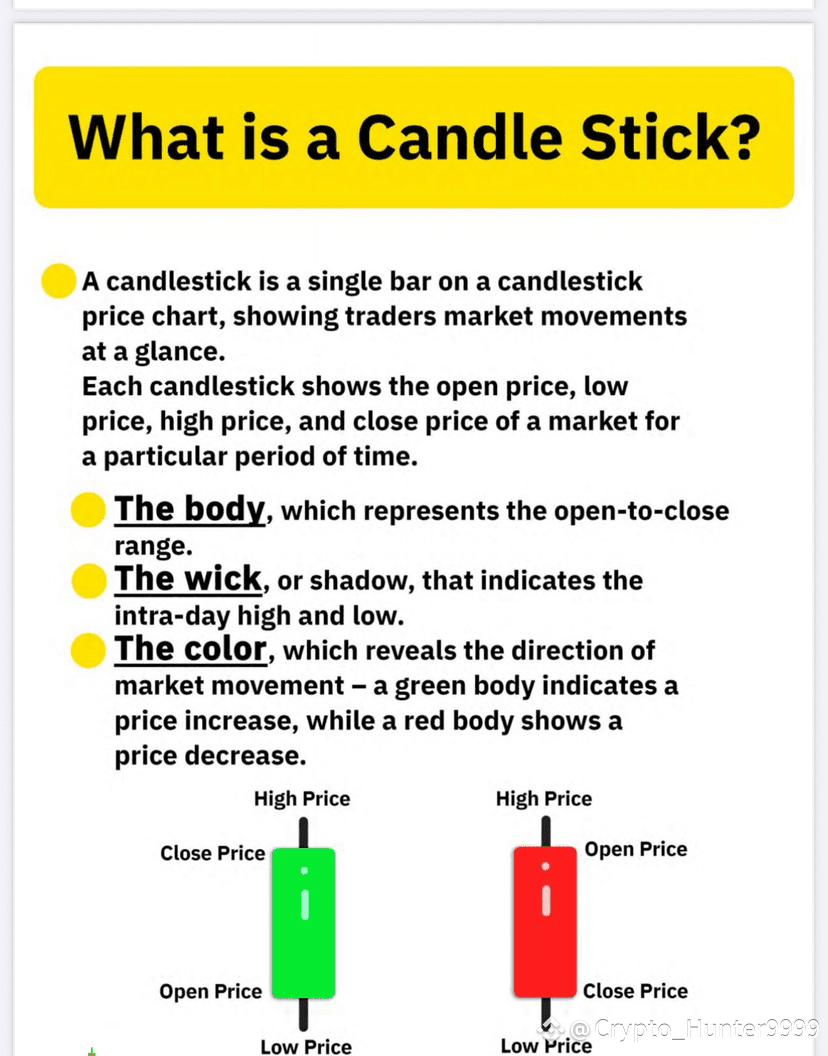
#82 THE MEANING OF CANDLE STICK
Green - Open & Close Increasing Price
Red - Open & Close Decreasing Price
$BTC
$ETH
$XRP
#82 THE MEANING OF CANDLE STICK
Green - Open & Close Increasing Price
Red - Open & Close Decreasing Price
$BTC
$ETH
$XRP
Green - Open & Close Increasing Price
Red - Open & Close Decreasing Price
$BTC
$ETH
$XRP
4.1k
2k
204
4.1k

·
--
🔬 Market Analysis · Crypto Report | 2026-05-29 Friday
━━━━━━━━━━━━━━━━━━━━
📊 Market Overview
💰 BTC 73,383 📉 -0.14%
💎 ETH 2,002 📈 +0.65%
💵 Funding Rate: BTC 0.0023% | ETH 0.0059%
😱 Fear & Greed: 23 — Extreme Fear 🥶
🔥 Trending Coins
🥇 Bonk (BONK) — rank #110
🥈 Aptos (APT) — rank #82
🥉 Allora (ALLO)
4️⃣ Hyperliquid (HYPE) — rank #11
5️⃣ Pudgy Penguins (PENGU)
🚀 24h Top Gainers
📈 XLM +13.65%
📈 INJ +13.54%
📈 DEXE +11.95%
📈 ALGO +9.65%
📈 HYPE +9.25%
📉 24h Top Losers
📉 HTX -2.73%
📉 MORPHO -2.30%
📉 TRX -2.11%
📉 WLFI -1.95%
📉 TON -1.44%
━━━ 🌐 Market Structure ━━━
🏗️ BTC 4H Trend: EMA9 below EMA21 — bearish, RSI 26.9 oversold
🏗️ BTC 1H Trend: EMA9 slightly above EMA21 — neutral to bullish
🏗️ BTC 15M Trend: EMA9 below EMA21 — weak
🔗 BTC Resonance: Conflicting — long-term bearish but oversold, 1H neutral
🏗️ ETH 4H Trend: EMA9 below EMA21 — bearish, RSI 30.9 near oversold
🏗️ ETH 1H Trend: EMA9 equal to EMA21 — neutral
🏗️ ETH 15M Trend: EMA9 below EMA21 — weak
🔗 ETH Resonance: bearish but near oversold
⚡ BTC Market Share: 57.70%
━━━ 🔧 Technical Indicators ━━━
📐 BTC EMA Alignment: 4H bearish · 1H EMA9 slightly crosses above · 15M bearish
📊 BTC RSI(14): 4H=26.9(oversold) | 1H=51.7(neutral) | 15M=39.3(weak)
📦 BTC Volume: Extremely contracted, volume ratio 0.015 — declining on low volume
📐 ETH EMA Alignment: 4H bearish · 1H moving averages converge · 15M bearish
📊 ETH RSI(14): 4H=30.9(near oversold) | 1H=53.6(neutral) | 15M=37.7(weak)
📦 ETH Volume: Significantly contracted, volume ratio 0.033
━━━ 🎭 Market Sentiment ━━━
😱 Fear & Greed: 23 — Extreme Fear 🥶 (yesterday 22, consecutive extreme fear)
💹 Funding Rate: BTC 0.0023% · ETH 0.0059% (still positive, no panic selling)
📊 Total Market Cap: Approximately 2.55 trillion USD
📉 ETFs: Record net outflow for 9 consecutive days, totaling 2.8 billion USD — demand side continues to weaken
🔍 CryptoQuant: Long-term holder supply hits record high, reflecting buyer shortage
━━━ 🏛️ Macro Background ━━━
💲 EUR/USD: Approximately 1.12 USD weak, US stocks strong but BTC not benefiting
📈 US Stocks: Index futures nearing historical highs, AI/semiconductors lead the way
🛢️ Geopolitical: US-Iran ceasefire extended, oil prices retreat
⚠️ BTC significantly diverging from US stocks — crypto market weakening independently
━━━ 🎯 Probability Forecast (1-3 days) ━━━
📈 Up 25% — 4H RSI deeply oversold indicating a technical bounce; ETH turning green may pull BTC up; strong US stocks could provide external support
📉 Down 40% — ETFs record outflow for 9 consecutive days totaling 2.8 billion USD; 4H long-term bearish alignment remains unchanged; extremely contracted volume with no support; CryptoQuant confirming buyer shortage
↔️ Sideways 35% — Multi-timeframe conflict (4H oversold vs bearish trend); Fear & Greed at 23 has reached extreme levels but lacks catalysts for reversal
━━━ 📍 Key Levels ━━━
🟢 BTC Support: 72,580 (previous low) · 71,500 (psychological level)
🔴 BTC Resistance: 73,950 (24h high) · 74,800 (EMA21 4H)
🟢 ETH Support: 1,985 (recent low) · 1,940 (previous low area)
🔴 ETH Resistance: 2,030 (24h high) · 2,045 (EMA21 4H)
━━━ ⚠️ Risk Warning ━━━
🔼 Upside Risks: US stocks continue reaching new highs or boost risk appetite; reversal in ETF outflow trend; oversold bounce attracting short-term funds
🔽 Downside Risks: ETF outflow continues for the 10th day; BTC accelerating below 72,500 to 71,000; CryptoQuant buyer exhaustion signal worsening
━━━ 📡 Breaking News ━━━
🗞️ ETFs record outflows for 9 consecutive days, totaling 2.8 billion USD
... Full report available in the Market Analysis Channel
$BTC $ETH
🔬 Market Analysis · Crypto Report | 2026-05-29 Friday
━━━━━━━━━━━━━━━━━━━━
📊 Market Overview
💰 BTC 73,383 📉 -0.14%
💎 ETH 2,002 📈 +0.65%
💵 Funding Rate: BTC 0.0023% | ETH 0.0059%
😱 Fear & Greed: 23 — Extreme Fear 🥶
🔥 Trending Coins
🥇 Bonk (BONK) — rank #110
🥈 Aptos (APT) — rank #82
🥉 Allora (ALLO)
4️⃣ Hyperliquid (HYPE) — rank #11
5️⃣ Pudgy Penguins (PENGU)
🚀 24h Top Gainers
📈 XLM +13.65%
📈 INJ +13.54%
📈 DEXE +11.95%
📈 ALGO +9.65%
📈 HYPE +9.25%
📉 24h Top Losers
📉 HTX -2.73%
📉 MORPHO -2.30%
📉 TRX -2.11%
📉 WLFI -1.95%
📉 TON -1.44%
━━━ 🌐 Market Structure ━━━
🏗️ BTC 4H Trend: EMA9 below EMA21 — bearish, RSI 26.9 oversold
🏗️ BTC 1H Trend: EMA9 slightly above EMA21 — neutral to bullish
🏗️ BTC 15M Trend: EMA9 below EMA21 — weak
🔗 BTC Resonance: Conflicting — long-term bearish but oversold, 1H neutral
🏗️ ETH 4H Trend: EMA9 below EMA21 — bearish, RSI 30.9 near oversold
🏗️ ETH 1H Trend: EMA9 equal to EMA21 — neutral
🏗️ ETH 15M Trend: EMA9 below EMA21 — weak
🔗 ETH Resonance: bearish but near oversold
⚡ BTC Market Share: 57.70%
━━━ 🔧 Technical Indicators ━━━
📐 BTC EMA Alignment: 4H bearish · 1H EMA9 slightly crosses above · 15M bearish
📊 BTC RSI(14): 4H=26.9(oversold) | 1H=51.7(neutral) | 15M=39.3(weak)
📦 BTC Volume: Extremely contracted, volume ratio 0.015 — declining on low volume
📐 ETH EMA Alignment: 4H bearish · 1H moving averages converge · 15M bearish
📊 ETH RSI(14): 4H=30.9(near oversold) | 1H=53.6(neutral) | 15M=37.7(weak)
📦 ETH Volume: Significantly contracted, volume ratio 0.033
━━━ 🎭 Market Sentiment ━━━
😱 Fear & Greed: 23 — Extreme Fear 🥶 (yesterday 22, consecutive extreme fear)
💹 Funding Rate: BTC 0.0023% · ETH 0.0059% (still positive, no panic selling)
📊 Total Market Cap: Approximately 2.55 trillion USD
📉 ETFs: Record net outflow for 9 consecutive days, totaling 2.8 billion USD — demand side continues to weaken
🔍 CryptoQuant: Long-term holder supply hits record high, reflecting buyer shortage
━━━ 🏛️ Macro Background ━━━
💲 EUR/USD: Approximately 1.12 USD weak, US stocks strong but BTC not benefiting
📈 US Stocks: Index futures nearing historical highs, AI/semiconductors lead the way
🛢️ Geopolitical: US-Iran ceasefire extended, oil prices retreat
⚠️ BTC significantly diverging from US stocks — crypto market weakening independently
━━━ 🎯 Probability Forecast (1-3 days) ━━━
📈 Up 25% — 4H RSI deeply oversold indicating a technical bounce; ETH turning green may pull BTC up; strong US stocks could provide external support
📉 Down 40% — ETFs record outflow for 9 consecutive days totaling 2.8 billion USD; 4H long-term bearish alignment remains unchanged; extremely contracted volume with no support; CryptoQuant confirming buyer shortage
↔️ Sideways 35% — Multi-timeframe conflict (4H oversold vs bearish trend); Fear & Greed at 23 has reached extreme levels but lacks catalysts for reversal
━━━ 📍 Key Levels ━━━
🟢 BTC Support: 72,580 (previous low) · 71,500 (psychological level)
🔴 BTC Resistance: 73,950 (24h high) · 74,800 (EMA21 4H)
🟢 ETH Support: 1,985 (recent low) · 1,940 (previous low area)
🔴 ETH Resistance: 2,030 (24h high) · 2,045 (EMA21 4H)
━━━ ⚠️ Risk Warning ━━━
🔼 Upside Risks: US stocks continue reaching new highs or boost risk appetite; reversal in ETF outflow trend; oversold bounce attracting short-term funds
🔽 Downside Risks: ETF outflow continues for the 10th day; BTC accelerating below 72,500 to 71,000; CryptoQuant buyer exhaustion signal worsening
━━━ 📡 Breaking News ━━━
🗞️ ETFs record outflows for 9 consecutive days, totaling 2.8 billion USD
... Full report available in the Market Analysis Channel
$BTC $ETH
━━━━━━━━━━━━━━━━━━━━
📊 Market Overview
💰 BTC 73,383 📉 -0.14%
💎 ETH 2,002 📈 +0.65%
💵 Funding Rate: BTC 0.0023% | ETH 0.0059%
😱 Fear & Greed: 23 — Extreme Fear 🥶
🔥 Trending Coins
🥇 Bonk (BONK) — rank #110
🥈 Aptos (APT) — rank #82
🥉 Allora (ALLO)
4️⃣ Hyperliquid (HYPE) — rank #11
5️⃣ Pudgy Penguins (PENGU)
🚀 24h Top Gainers
📈 XLM +13.65%
📈 INJ +13.54%
📈 DEXE +11.95%
📈 ALGO +9.65%
📈 HYPE +9.25%
📉 24h Top Losers
📉 HTX -2.73%
📉 MORPHO -2.30%
📉 TRX -2.11%
📉 WLFI -1.95%
📉 TON -1.44%
━━━ 🌐 Market Structure ━━━
🏗️ BTC 4H Trend: EMA9 below EMA21 — bearish, RSI 26.9 oversold
🏗️ BTC 1H Trend: EMA9 slightly above EMA21 — neutral to bullish
🏗️ BTC 15M Trend: EMA9 below EMA21 — weak
🔗 BTC Resonance: Conflicting — long-term bearish but oversold, 1H neutral
🏗️ ETH 4H Trend: EMA9 below EMA21 — bearish, RSI 30.9 near oversold
🏗️ ETH 1H Trend: EMA9 equal to EMA21 — neutral
🏗️ ETH 15M Trend: EMA9 below EMA21 — weak
🔗 ETH Resonance: bearish but near oversold
⚡ BTC Market Share: 57.70%
━━━ 🔧 Technical Indicators ━━━
📐 BTC EMA Alignment: 4H bearish · 1H EMA9 slightly crosses above · 15M bearish
📊 BTC RSI(14): 4H=26.9(oversold) | 1H=51.7(neutral) | 15M=39.3(weak)
📦 BTC Volume: Extremely contracted, volume ratio 0.015 — declining on low volume
📐 ETH EMA Alignment: 4H bearish · 1H moving averages converge · 15M bearish
📊 ETH RSI(14): 4H=30.9(near oversold) | 1H=53.6(neutral) | 15M=37.7(weak)
📦 ETH Volume: Significantly contracted, volume ratio 0.033
━━━ 🎭 Market Sentiment ━━━
😱 Fear & Greed: 23 — Extreme Fear 🥶 (yesterday 22, consecutive extreme fear)
💹 Funding Rate: BTC 0.0023% · ETH 0.0059% (still positive, no panic selling)
📊 Total Market Cap: Approximately 2.55 trillion USD
📉 ETFs: Record net outflow for 9 consecutive days, totaling 2.8 billion USD — demand side continues to weaken
🔍 CryptoQuant: Long-term holder supply hits record high, reflecting buyer shortage
━━━ 🏛️ Macro Background ━━━
💲 EUR/USD: Approximately 1.12 USD weak, US stocks strong but BTC not benefiting
📈 US Stocks: Index futures nearing historical highs, AI/semiconductors lead the way
🛢️ Geopolitical: US-Iran ceasefire extended, oil prices retreat
⚠️ BTC significantly diverging from US stocks — crypto market weakening independently
━━━ 🎯 Probability Forecast (1-3 days) ━━━
📈 Up 25% — 4H RSI deeply oversold indicating a technical bounce; ETH turning green may pull BTC up; strong US stocks could provide external support
📉 Down 40% — ETFs record outflow for 9 consecutive days totaling 2.8 billion USD; 4H long-term bearish alignment remains unchanged; extremely contracted volume with no support; CryptoQuant confirming buyer shortage
↔️ Sideways 35% — Multi-timeframe conflict (4H oversold vs bearish trend); Fear & Greed at 23 has reached extreme levels but lacks catalysts for reversal
━━━ 📍 Key Levels ━━━
🟢 BTC Support: 72,580 (previous low) · 71,500 (psychological level)
🔴 BTC Resistance: 73,950 (24h high) · 74,800 (EMA21 4H)
🟢 ETH Support: 1,985 (recent low) · 1,940 (previous low area)
🔴 ETH Resistance: 2,030 (24h high) · 2,045 (EMA21 4H)
━━━ ⚠️ Risk Warning ━━━
🔼 Upside Risks: US stocks continue reaching new highs or boost risk appetite; reversal in ETF outflow trend; oversold bounce attracting short-term funds
🔽 Downside Risks: ETF outflow continues for the 10th day; BTC accelerating below 72,500 to 71,000; CryptoQuant buyer exhaustion signal worsening
━━━ 📡 Breaking News ━━━
🗞️ ETFs record outflows for 9 consecutive days, totaling 2.8 billion USD
... Full report available in the Market Analysis Channel
$BTC $ETH
68

·
--
Bullish
They laughed at LUNC holders. 😂
2022: "You lost everything lol"
2023: "Give up already"
2024: "Dead coin walking"
Dec 2025: "ATL. It's over."
May 2026:
📈 +20,000% from ATL
💰 $462M market cap
🔥 Burns: still going
👥 Community: stronger than ever
🏆 Rank: #82 globally
We didn't argue.
We didn't fight back.
We just held. 💎
And the chart said everything. 📊
Tag someone who doubted LUNC! 👇😤
$LUNC #LUNC #TerraClassic #LUNCArmy #BinanceSquare #SilenceTheDoubt #Revenge #BullRun2026 #HODL #ProvenWrong
They laughed at LUNC holders. 😂
2022: "You lost everything lol"
2023: "Give up already"
2024: "Dead coin walking"
Dec 2025: "ATL. It's over."
May 2026:
📈 +20,000% from ATL
💰 $462M market cap
🔥 Burns: still going
👥 Community: stronger than ever
🏆 Rank: #82 globally
We didn't argue.
We didn't fight back.
We just held. 💎
And the chart said everything. 📊
Tag someone who doubted LUNC! 👇😤
$LUNC #LUNC #TerraClassic #LUNCArmy #BinanceSquare #SilenceTheDoubt #Revenge #BullRun2026 #HODL #ProvenWrong
2022: "You lost everything lol"
2023: "Give up already"
2024: "Dead coin walking"
Dec 2025: "ATL. It's over."
May 2026:
📈 +20,000% from ATL
💰 $462M market cap
🔥 Burns: still going
👥 Community: stronger than ever
🏆 Rank: #82 globally
We didn't argue.
We didn't fight back.
We just held. 💎
And the chart said everything. 📊
Tag someone who doubted LUNC! 👇😤
$LUNC #LUNC #TerraClassic #LUNCArmy #BinanceSquare #SilenceTheDoubt #Revenge #BullRun2026 #HODL #ProvenWrong

1
587
·
--
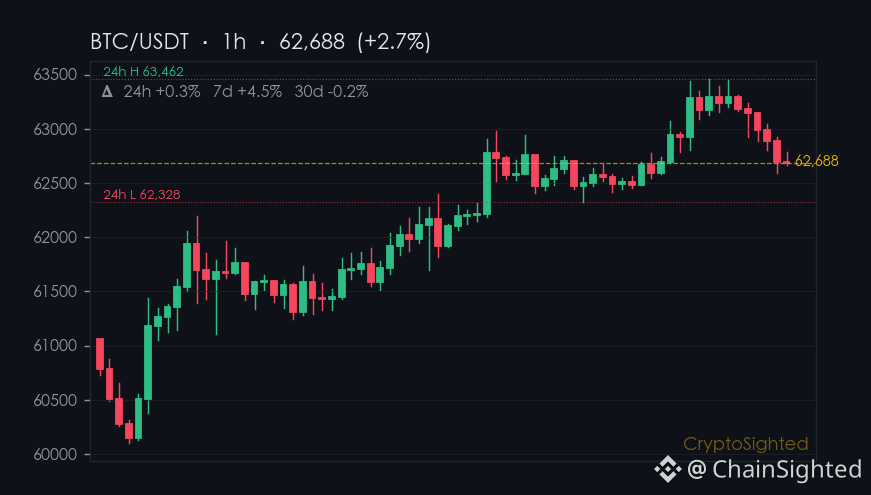
$BTC is sitting at $62,775, with a 7-day rally of ↑4.6% - that’s 70.0% of its 30-day gain. It’s not just moving
it’s leading the charge.
Ethereum is up ↑12.3% over 7 days
but that’s still below its 30-day gain of ↑12.3%. BTC
on the other hand, is gaining momentum, even as altcoins like Solana and $ADA see sharp moves.
The question isn’t whether BTC is trending - it’s whether this is the start of a breakout or just a temporary push.
Defense or offense - one word.
—
Not financial advice. DYOR.
📌 Hotspot Watch · #82 · #CryptoTrends #CryptoSighted $BTC
$BTC is sitting at $62,775, with a 7-day rally of ↑4.6% - that’s 70.0% of its 30-day gain. It’s not just moving
it’s leading the charge.
Ethereum is up ↑12.3% over 7 days
but that’s still below its 30-day gain of ↑12.3%. BTC
on the other hand, is gaining momentum, even as altcoins like Solana and $ADA see sharp moves.
The question isn’t whether BTC is trending - it’s whether this is the start of a breakout or just a temporary push.
Defense or offense - one word.
—
Not financial advice. DYOR.
📌 Hotspot Watch · #82 · #CryptoTrends #CryptoSighted $BTC
it’s leading the charge.
Ethereum is up ↑12.3% over 7 days
but that’s still below its 30-day gain of ↑12.3%. BTC
on the other hand, is gaining momentum, even as altcoins like Solana and $ADA see sharp moves.
The question isn’t whether BTC is trending - it’s whether this is the start of a breakout or just a temporary push.
Defense or offense - one word.
—
Not financial advice. DYOR.
📌 Hotspot Watch · #82 · #CryptoTrends #CryptoSighted $BTC
21

·
--
$BEAT This drop is kind of interesting—within 15 minutes it fell by -8.31%, and the trading volume is 5.77x that of normal times. This clearly isn’t a dump that retail traders could smash. What’s truly worth paying attention to is this: while the price is falling, open interest (OI) is actually rising—1-hour contracts are up +13.24%. This doesn’t look like longs getting squeezed; it looks more like someone is actively adding leverage to short.
The close has already broken below the lows of the past ~20 5-minute candlesticks, and proactive traded volume is down by -7.5%, with sell orders definitely gaining momentum. But don’t rush to chase the short. OI has surged to an all-pool abnormal level of #82, and the positioning is already getting a bit extreme. Chasing in here most likely means handing someone the knife.
Nominal changes across the whole market rank in the top 23, but actual contract notional is shrinking—this divergence usually signals that a new round of liquidation/clearing may be starting. 24-hour trading volume is $316 million, liquidity is sufficient, and volatility won’t be small.
Keep a close eye on the order book. This kind of structure either breaks out of a short trap within the next 15 minutes with a quick rebound, or it directly starts a slow, bearish drift downward. Don’t bet on direction—first see how volume and momentum evolve.
$BEAT This drop is kind of interesting—within 15 minutes it fell by -8.31%, and the trading volume is 5.77x that of normal times. This clearly isn’t a dump that retail traders could smash. What’s truly worth paying attention to is this: while the price is falling, open interest (OI) is actually rising—1-hour contracts are up +13.24%. This doesn’t look like longs getting squeezed; it looks more like someone is actively adding leverage to short.
The close has already broken below the lows of the past ~20 5-minute candlesticks, and proactive traded volume is down by -7.5%, with sell orders definitely gaining momentum. But don’t rush to chase the short. OI has surged to an all-pool abnormal level of #82, and the positioning is already getting a bit extreme. Chasing in here most likely means handing someone the knife.
Nominal changes across the whole market rank in the top 23, but actual contract notional is shrinking—this divergence usually signals that a new round of liquidation/clearing may be starting. 24-hour trading volume is $316 million, liquidity is sufficient, and volatility won’t be small.
Keep a close eye on the order book. This kind of structure either breaks out of a short trap within the next 15 minutes with a quick rebound, or it directly starts a slow, bearish drift downward. Don’t bet on direction—first see how volume and momentum evolve.
The close has already broken below the lows of the past ~20 5-minute candlesticks, and proactive traded volume is down by -7.5%, with sell orders definitely gaining momentum. But don’t rush to chase the short. OI has surged to an all-pool abnormal level of #82, and the positioning is already getting a bit extreme. Chasing in here most likely means handing someone the knife.
Nominal changes across the whole market rank in the top 23, but actual contract notional is shrinking—this divergence usually signals that a new round of liquidation/clearing may be starting. 24-hour trading volume is $316 million, liquidity is sufficient, and volatility won’t be small.
Keep a close eye on the order book. This kind of structure either breaks out of a short trap within the next 15 minutes with a quick rebound, or it directly starts a slow, bearish drift downward. Don’t bet on direction—first see how volume and momentum evolve.
45

·
--
We're keeping an eye on the trending tokens, as per CoinGecko 📊. Our community is interested in the latest market movements. We're seeing a mix of established and new tokens gaining traction.
We've noticed Bonk (BONK) and Aptos (APT) making waves, with market cap ranks #108 and #82 respectively. Hyperliquid (HYPE) is also trending at #11, while Stellar (XLM) holds steady at #18. Other tokens like Allora (ALLO) and Citrea (CTR) are further down the list, but still worth watching 🚀.
We're excited to see how these tokens perform in the coming days 💡. With Bitcoin (BTC) leading the pack at #1, we're expecting some interesting movements in the market 📈.
$ALLO, $RIF, $GUA
We're keeping an eye on the trending tokens, as per CoinGecko 📊. Our community is interested in the latest market movements. We're seeing a mix of established and new tokens gaining traction.
We've noticed Bonk (BONK) and Aptos (APT) making waves, with market cap ranks #108 and #82 respectively. Hyperliquid (HYPE) is also trending at #11, while Stellar (XLM) holds steady at #18. Other tokens like Allora (ALLO) and Citrea (CTR) are further down the list, but still worth watching 🚀.
We're excited to see how these tokens perform in the coming days 💡. With Bitcoin (BTC) leading the pack at #1, we're expecting some interesting movements in the market 📈.
$ALLO , $RIF , $GUA
We've noticed Bonk (BONK) and Aptos (APT) making waves, with market cap ranks #108 and #82 respectively. Hyperliquid (HYPE) is also trending at #11, while Stellar (XLM) holds steady at #18. Other tokens like Allora (ALLO) and Citrea (CTR) are further down the list, but still worth watching 🚀.
We're excited to see how these tokens perform in the coming days 💡. With Bitcoin (BTC) leading the pack at #1, we're expecting some interesting movements in the market 📈.
$ALLO , $RIF , $GUA
201
Log in to explore more content
Join global crypto users on Binance Square
⚡️ Get latest and useful information about crypto.
💬 Trusted by the world’s largest crypto exchange.
👍 Discover real insights from verified creators.
Email / Phone number
Trending Topics
1
#FedRateWatch
1.3M views
6,396 Discussing
2
#ZcashRises6%
32,277 views
512 Discussing
3
#XRPSinks10%
21,118 views
336 Discussing
4
#BitcoinETFsShed$450M
3,361 views
70 Discussing
5
#CircleOpensArcMainnet
10,585 views
231 Discussing
6
#ZcashHoldersBackNU7Upgrade
21,568 views
406 Discussing
7
#MSTRTradingVolumeSurpassesMorganStanley
22,235 views
565 Discussing
8
#BitcoinFalls4%
45,368 views
870 Discussing
9
#SKHynixInTalksToMakeMemoryChipsInUS
18,949 views
351 Discussing
10
#OpenAIDiscussesNewFundingAt$1.2TValuation
4,674 views
57 Discussing