
#53
53
11,158 views
38 Discussing
Hot
Latest

·
--
ENA dropped 2 points in just 15 minutes, with volume surging to 4.45x and a Z-score of 3.88. This clearly wasn’t retail selling. The closing price fell below the lower bound of the past 20 five-minute candlesticks; the aggressive trade delta was -37.3%, and the buy/sell ratio was 0.46, indicating sellers were in control.
But take a look at OI: 15-minute contracts were down 0.10%, or -1.83M in notional value; over one hour, they were down 0.23%, or -2.57M. Price down + OI down is typical of longs deleveraging or getting stopped out—not fresh shorts opening positions to drive the price lower. The funding rate is still in a high percentile relative to recent levels, OI’s anomaly percentile is 94.6%, it ranks #53 across the entire pool, and notional change ranks #9. This combination suggests longs were previously quite crowded and are now reducing their positions.
My take: this looks more like leveraged positions getting flushed out than the start of a trend-driven short move. But don’t rush to buy the dip—the price is still searching for a level. It’s better to wait and see if OI stabilizes and the aggressive trade delta narrows.
ENA dropped 2 points in just 15 minutes, with volume surging to 4.45x and a Z-score of 3.88. This clearly wasn’t retail selling. The closing price fell below the lower bound of the past 20 five-minute candlesticks; the aggressive trade delta was -37.3%, and the buy/sell ratio was 0.46, indicating sellers were in control.
But take a look at OI: 15-minute contracts were down 0.10%, or -1.83M in notional value; over one hour, they were down 0.23%, or -2.57M. Price down + OI down is typical of longs deleveraging or getting stopped out—not fresh shorts opening positions to drive the price lower. The funding rate is still in a high percentile relative to recent levels, OI’s anomaly percentile is 94.6%, it ranks #53 across the entire pool, and notional change ranks #9. This combination suggests longs were previously quite crowded and are now reducing their positions.
My take: this looks more like leveraged positions getting flushed out than the start of a trend-driven short move. But don’t rush to buy the dip—the price is still searching for a level. It’s better to wait and see if OI stabilizes and the aggressive trade delta narrows.
But take a look at OI: 15-minute contracts were down 0.10%, or -1.83M in notional value; over one hour, they were down 0.23%, or -2.57M. Price down + OI down is typical of longs deleveraging or getting stopped out—not fresh shorts opening positions to drive the price lower. The funding rate is still in a high percentile relative to recent levels, OI’s anomaly percentile is 94.6%, it ranks #53 across the entire pool, and notional change ranks #9. This combination suggests longs were previously quite crowded and are now reducing their positions.
My take: this looks more like leveraged positions getting flushed out than the start of a trend-driven short move. But don’t rush to buy the dip—the price is still searching for a level. It’s better to wait and see if OI stabilizes and the aggressive trade delta narrows.
31

·
--
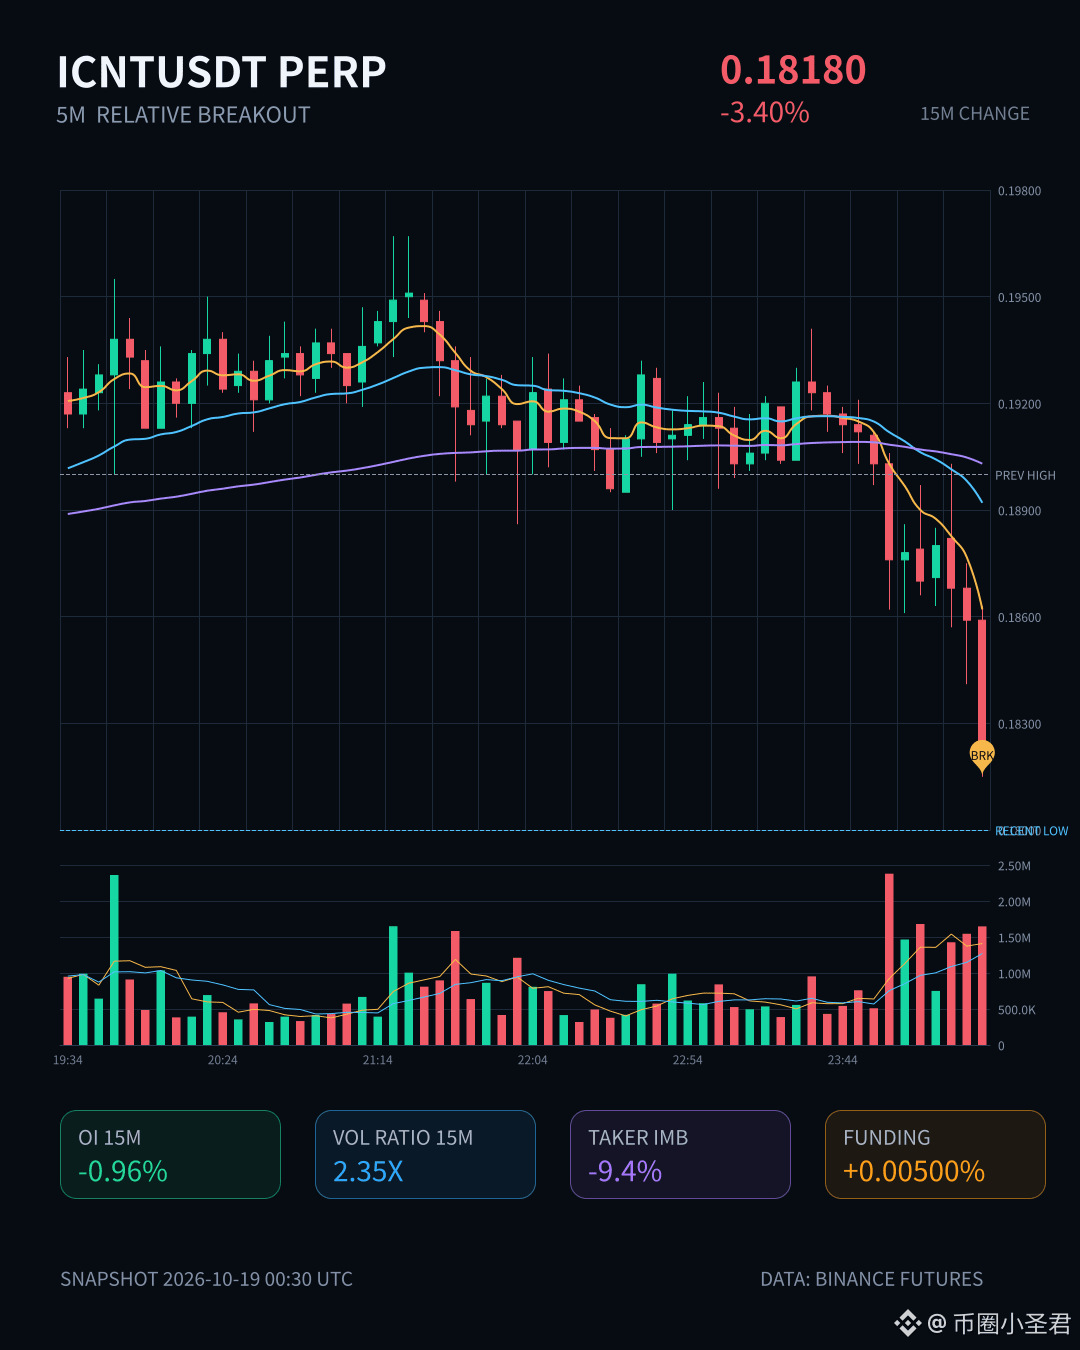
$ICNT dropped 3.4% over this 15m period on 2.35x volume, but OI is falling instead—longs are pulling out, not shorts piling in. Notional change is -247K, with a 1h cumulative change of -359K: a deleveraging pattern. It closed below the lower end of the 20-bar 5m range, aggressive trade delta is -9.4%, and the buy/sell ratio is 0.83, with selling pressure in control. 24h volume is still 149M, so liquidity is sufficient. Anomaly percentile is 81.9%, ranked #53 across the full pool and #27 by notional—not the most conspicuous, but still near the top. Watching for a second confirmation.
$ICNT dropped 3.4% over this 15m period on 2.35x volume, but OI is falling instead—longs are pulling out, not shorts piling in. Notional change is -247K, with a 1h cumulative change of -359K: a deleveraging pattern. It closed below the lower end of the 20-bar 5m range, aggressive trade delta is -9.4%, and the buy/sell ratio is 0.83, with selling pressure in control. 24h volume is still 149M, so liquidity is sufficient. Anomaly percentile is 81.9%, ranked #53 across the full pool and #27 by notional—not the most conspicuous, but still near the top. Watching for a second confirmation.
62

·
--
Bullish
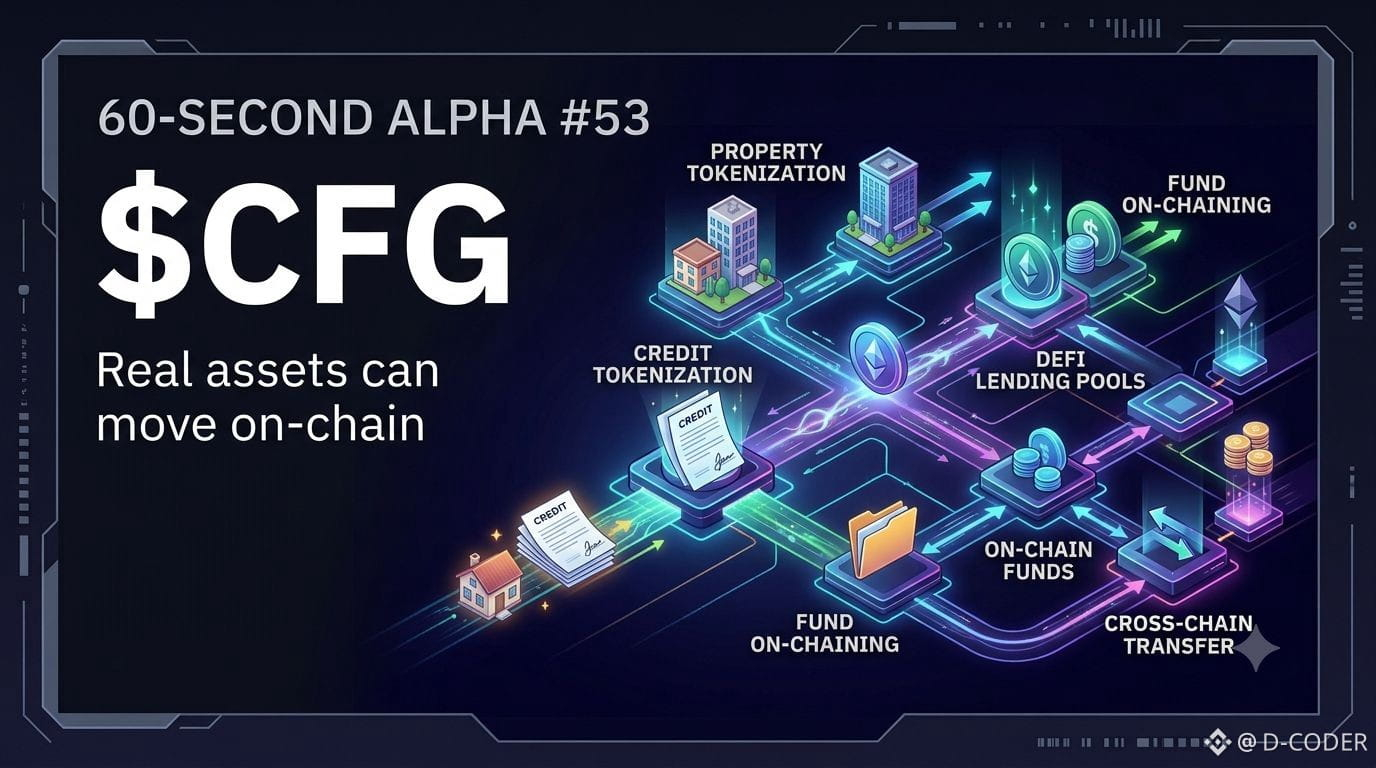
60-SECOND ALPHA #53 | $CFG
$CFG is part of the growing real-world asset narrative, connecting traditional assets such as credit and funds with blockchain infrastructure. Its recent market strength makes the project interesting, but the bigger story is the infrastructure behind the token.
RWA projects are trying to bring assets that already exist in the real world onto blockchain rails.
The lesson: Tokenization is not just about creating tokens — it is about bringing real economic activity on-chain.
{future}(CFGUSDT)
60-SECOND ALPHA #53 | $CFG
$CFG is part of the growing real-world asset narrative, connecting traditional assets such as credit and funds with blockchain infrastructure. Its recent market strength makes the project interesting, but the bigger story is the infrastructure behind the token.
RWA projects are trying to bring assets that already exist in the real world onto blockchain rails.
The lesson: Tokenization is not just about creating tokens — it is about bringing real economic activity on-chain.
$CFG is part of the growing real-world asset narrative, connecting traditional assets such as credit and funds with blockchain infrastructure. Its recent market strength makes the project interesting, but the bigger story is the infrastructure behind the token.
RWA projects are trying to bring assets that already exist in the real world onto blockchain rails.
The lesson: Tokenization is not just about creating tokens — it is about bringing real economic activity on-chain.
103

·
--
Pump.fun ($PUMP) Gains Momentum Despite 24h Downturn
Pump.fun ($PUMP) is trending despite a 4.37% dip in the last 24 hours. The coin’s massive $148.94M trading volume and #53 market cap rank signal strong interest. $PUMP’s community is buzzing with updates on new features and partnerships, keeping the momentum alive. Traders should watch for any positive news that could reverse the current trend. 👀
Follow for more crypto setups.
#HahaProfit #PumpFun
Pump.fun ($PUMP ) Gains Momentum Despite 24h Downturn
Pump.fun ($PUMP ) is trending despite a 4.37% dip in the last 24 hours. The coin’s massive $148.94M trading volume and #53 market cap rank signal strong interest. $PUMP ’s community is buzzing with updates on new features and partnerships, keeping the momentum alive. Traders should watch for any positive news that could reverse the current trend. 👀
Follow for more crypto setups.
#HahaProfit #PumpFun
Pump.fun ($PUMP ) is trending despite a 4.37% dip in the last 24 hours. The coin’s massive $148.94M trading volume and #53 market cap rank signal strong interest. $PUMP ’s community is buzzing with updates on new features and partnerships, keeping the momentum alive. Traders should watch for any positive news that could reverse the current trend. 👀
Follow for more crypto setups.
#HahaProfit #PumpFun

8

Article
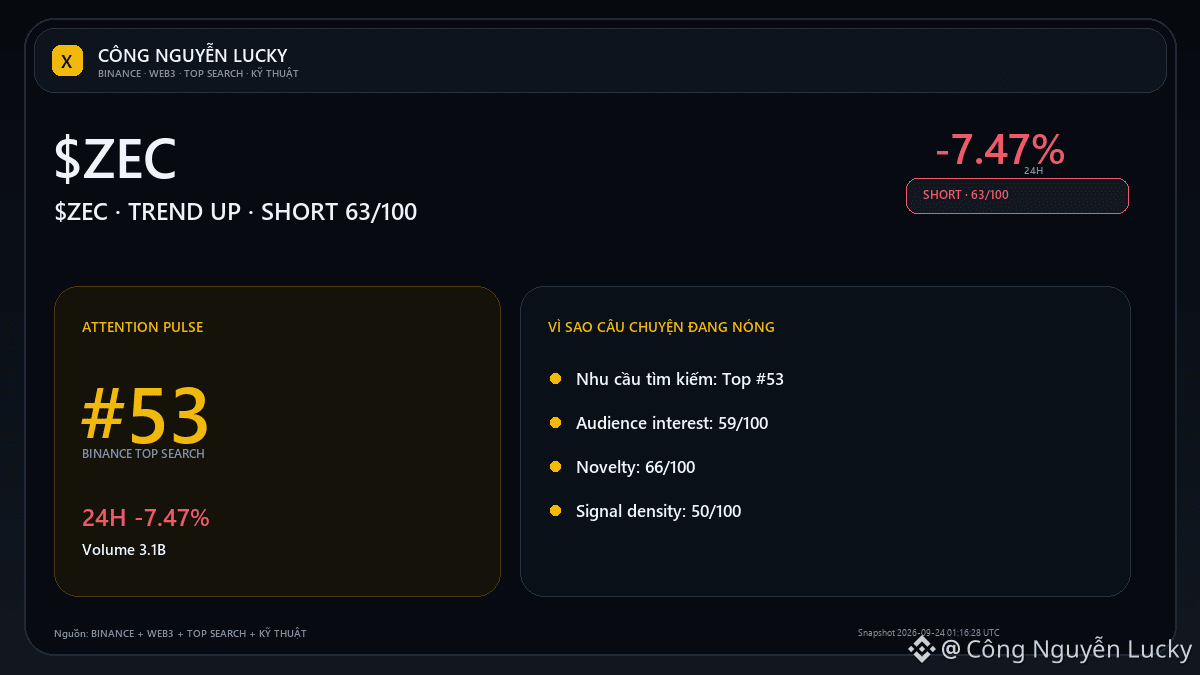
$ZEC: Does RSI divergence have enough to flip the bias?$ZEC is around 1,493.33. If you only look at the current price, you’re still missing the most important part: what confirms or refutes the thesis? Market: 1,493.33 · 24h -7.47% · volume ~3,058.5M USDT · 8,014,620 trades.
RSI14 37.5 · INCREASING TREND state · overall bias LONG 91/100. What you need to see next: the price reaction at 1,679.98 and whether MACD/volume confirms.
If the price continues to break the structure according to the old trend, divergence will be considered a failure rather than something to hold onto. The technical layers being selected are based on the regime:
$ZEC: Does RSI divergence have enough to flip the bias?
$ZEC is around 1,493.33. If you only look at the current price, you’re still missing the most important part: what confirms or refutes the thesis? Market: 1,493.33 · 24h -7.47% · volume ~3,058.5M USDT · 8,014,620 trades.
RSI14 37.5 · INCREASING TREND state · overall bias LONG 91/100. What you need to see next: the price reaction at 1,679.98 and whether MACD/volume confirms.
If the price continues to break the structure according to the old trend, divergence will be considered a failure rather than something to hold onto. The technical layers being selected are based on the regime:
RSI14 37.5 · INCREASING TREND state · overall bias LONG 91/100. What you need to see next: the price reaction at 1,679.98 and whether MACD/volume confirms.
If the price continues to break the structure according to the old trend, divergence will be considered a failure rather than something to hold onto. The technical layers being selected are based on the regime:
130

·
--
$ASTER surges into trending; with a market cap ranking at #53, many people’s first reaction is, “It’s about to fly again.” But if you lay the data out plainly: 24h +6.99%, 30d +7.95%, 1y -61%, and still -68.93% from ATH. This isn’t liftoff—it’s gasping for air in the pit after a deep fall.
On the chart, over the past month $ASTER has been moving sideways between $0.68 and $0.78. On Sep 6, volume surged to $368M and the price touched $0.786 before immediately pulling back. After that, volume dropped back to around $100M, and the price lost momentum as well. Today, with $167M in volume alongside +6.99%, viewed within the range, it’s at most a single tentative probe.
What I care about more is which direction the volume expands. For bulls, what you should watch isn’t how much it’s up today, but whether there’s a day where volume can reclaim above $300M and the price holds above the $0.78 level. If it only bounces back on shrinking volume to $0.68–0.72, then it could just as easily break down to find a bottom. For bears, the same applies: watch that volume line—only a breakout below $0.68 on increased volume would be convincing confirmation of a downward trend. And today’s small bullish candle with no supporting volume isn’t enough to justify a short.
The most overlooked risk with this token is that it may ride the trending-board sentiment to draw one move up, then fail to keep volume up and fall back again—after all, the yearly line is still -61%, and the broader trend hasn’t been repaired. Instead of guessing whether tomorrow goes up or down, answer this first: for validating your position logic today, at $0.78 versus $0.68, which level’s volume would you use as the confirmation? Your conclusion needs to be testable—otherwise it’s just a gamble.
$ASTER surges into trending; with a market cap ranking at #53, many people’s first reaction is, “It’s about to fly again.” But if you lay the data out plainly: 24h +6.99%, 30d +7.95%, 1y -61%, and still -68.93% from ATH. This isn’t liftoff—it’s gasping for air in the pit after a deep fall.
On the chart, over the past month $ASTER has been moving sideways between $0.68 and $0.78. On Sep 6, volume surged to $368M and the price touched $0.786 before immediately pulling back. After that, volume dropped back to around $100M, and the price lost momentum as well. Today, with $167M in volume alongside +6.99%, viewed within the range, it’s at most a single tentative probe.
What I care about more is which direction the volume expands. For bulls, what you should watch isn’t how much it’s up today, but whether there’s a day where volume can reclaim above $300M and the price holds above the $0.78 level. If it only bounces back on shrinking volume to $0.68–0.72, then it could just as easily break down to find a bottom. For bears, the same applies: watch that volume line—only a breakout below $0.68 on increased volume would be convincing confirmation of a downward trend. And today’s small bullish candle with no supporting volume isn’t enough to justify a short.
The most overlooked risk with this token is that it may ride the trending-board sentiment to draw one move up, then fail to keep volume up and fall back again—after all, the yearly line is still -61%, and the broader trend hasn’t been repaired. Instead of guessing whether tomorrow goes up or down, answer this first: for validating your position logic today, at $0.78 versus $0.68, which level’s volume would you use as the confirmation? Your conclusion needs to be testable—otherwise it’s just a gamble.
On the chart, over the past month $ASTER has been moving sideways between $0.68 and $0.78. On Sep 6, volume surged to $368M and the price touched $0.786 before immediately pulling back. After that, volume dropped back to around $100M, and the price lost momentum as well. Today, with $167M in volume alongside +6.99%, viewed within the range, it’s at most a single tentative probe.
What I care about more is which direction the volume expands. For bulls, what you should watch isn’t how much it’s up today, but whether there’s a day where volume can reclaim above $300M and the price holds above the $0.78 level. If it only bounces back on shrinking volume to $0.68–0.72, then it could just as easily break down to find a bottom. For bears, the same applies: watch that volume line—only a breakout below $0.68 on increased volume would be convincing confirmation of a downward trend. And today’s small bullish candle with no supporting volume isn’t enough to justify a short.
The most overlooked risk with this token is that it may ride the trending-board sentiment to draw one move up, then fail to keep volume up and fall back again—after all, the yearly line is still -61%, and the broader trend hasn’t been repaired. Instead of guessing whether tomorrow goes up or down, answer this first: for validating your position logic today, at $0.78 versus $0.68, which level’s volume would you use as the confirmation? Your conclusion needs to be testable—otherwise it’s just a gamble.
60


·
--
We're excited to share the latest trending tokens with our community 🚀. According to CoinGecko, Koma Inu and Pudgy Penguins are gaining attention, with market cap ranks #967 and #112 respectively.
We're seeing significant movement in the market, with top tokens like Bitcoin and Uniswap maintaining their strong positions. Solana and Aave are also trending, with market cap ranks #7 and #53. Additionally, GRVT Token is making waves at rank #614, while Koma Inu and Pudgy Penguins show promise.
We're tracking these tokens closely, and our community is eager to see how they perform 💡. As we continue to monitor the market, we're confident that our users will make informed decisions 📈.
$1000SATS, $HOME, $1000RATS
We're excited to share the latest trending tokens with our community 🚀. According to CoinGecko, Koma Inu and Pudgy Penguins are gaining attention, with market cap ranks #967 and #112 respectively.
We're seeing significant movement in the market, with top tokens like Bitcoin and Uniswap maintaining their strong positions. Solana and Aave are also trending, with market cap ranks #7 and #53. Additionally, GRVT Token is making waves at rank #614, while Koma Inu and Pudgy Penguins show promise.
We're tracking these tokens closely, and our community is eager to see how they perform 💡. As we continue to monitor the market, we're confident that our users will make informed decisions 📈.
$1000SATS, $HOME , $1000RATS
We're seeing significant movement in the market, with top tokens like Bitcoin and Uniswap maintaining their strong positions. Solana and Aave are also trending, with market cap ranks #7 and #53. Additionally, GRVT Token is making waves at rank #614, while Koma Inu and Pudgy Penguins show promise.
We're tracking these tokens closely, and our community is eager to see how they perform 💡. As we continue to monitor the market, we're confident that our users will make informed decisions 📈.
$1000SATS, $HOME , $1000RATS
227
Article
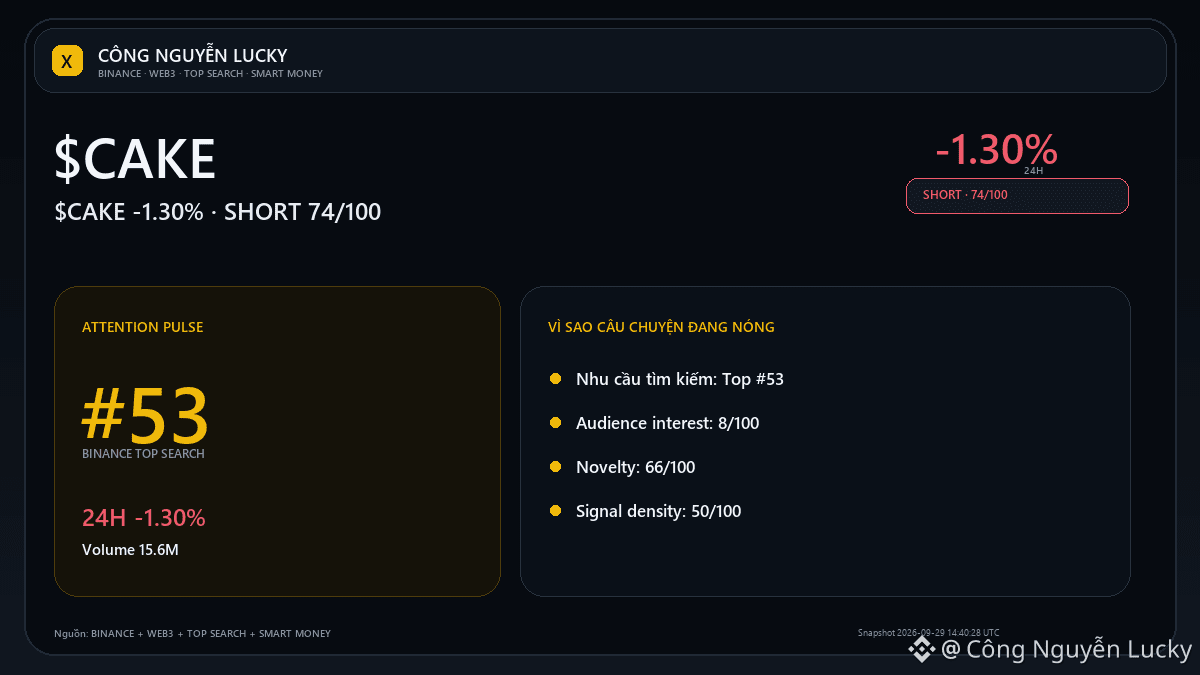
$CAKE: the none pattern is waiting for confirmation📐 $CAKE: model recognition system NONE on 1H. I only consider this as a geometric hypothesis; it’s not a signal until the activation level is broken and maintained. Market: 2.5894 · 24h -1.30% · volume ~15.6M USDT · 235,061 trades.
Reference activation level — · status MIXED · technical bias SHORT 62/100. Volume/ATR must expand when the pattern is broken; if price breaks through a level and then returns to the old boundary, prioritize the failed breakout rather than forcing continuation. The technical layers being selected are based on the regime:
$CAKE: the none pattern is waiting for confirmation
📐 $CAKE : model recognition system NONE on 1H. I only consider this as a geometric hypothesis; it’s not a signal until the activation level is broken and maintained. Market: 2.5894 · 24h -1.30% · volume ~15.6M USDT · 235,061 trades.
Reference activation level — · status MIXED · technical bias SHORT 62/100. Volume/ATR must expand when the pattern is broken; if price breaks through a level and then returns to the old boundary, prioritize the failed breakout rather than forcing continuation. The technical layers being selected are based on the regime:
Reference activation level — · status MIXED · technical bias SHORT 62/100. Volume/ATR must expand when the pattern is broken; if price breaks through a level and then returns to the old boundary, prioritize the failed breakout rather than forcing continuation. The technical layers being selected are based on the regime:
72

·
--
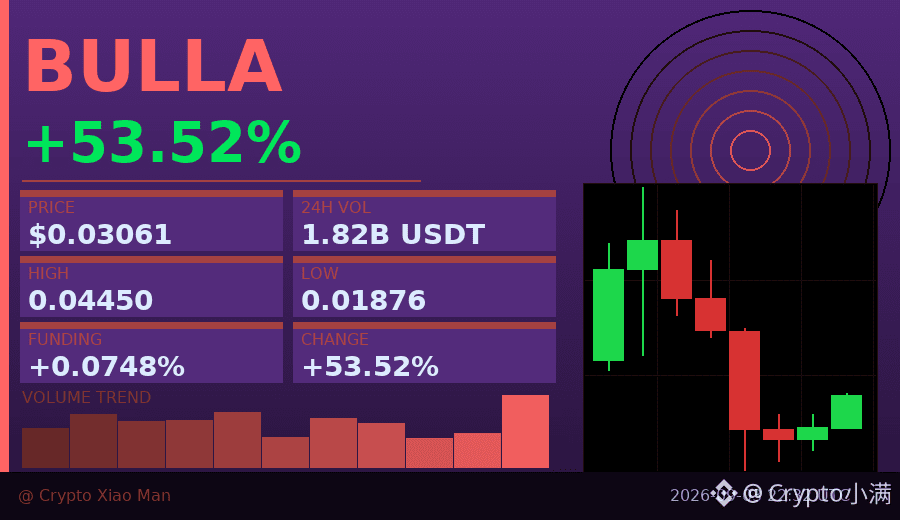
Behind the 53% surge, the funding rate has quietly climbed to 0.07478.
BULLA is indeed strong today—trading volume spiked to 182 million U, but the price has pulled back from the high of 0.0445 to 0.0306, a drawdown of over 30%. Longs account for 58%, not extremely crowded, but three consecutive bullish candles on the hourly chart suggest that short-term sentiment is still repairing.
In this kind of market, I generally look a little longer: a big rise isn’t the scary part—the scary part is that after the rate rises, there are fewer people to keep the momentum going. If trading volume doesn’t keep up afterward, the pullback may happen faster than you’d expect.
$BULLA #资金费率预警 #53%
Click the small card below to quickly check the行情👇
Behind the 53% surge, the funding rate has quietly climbed to 0.07478.
BULLA is indeed strong today—trading volume spiked to 182 million U, but the price has pulled back from the high of 0.0445 to 0.0306, a drawdown of over 30%. Longs account for 58%, not extremely crowded, but three consecutive bullish candles on the hourly chart suggest that short-term sentiment is still repairing.
In this kind of market, I generally look a little longer: a big rise isn’t the scary part—the scary part is that after the rate rises, there are fewer people to keep the momentum going. If trading volume doesn’t keep up afterward, the pullback may happen faster than you’d expect.
$BULLA #资金费率预警 #53%
Click the small card below to quickly check the行情👇
BULLA is indeed strong today—trading volume spiked to 182 million U, but the price has pulled back from the high of 0.0445 to 0.0306, a drawdown of over 30%. Longs account for 58%, not extremely crowded, but three consecutive bullish candles on the hourly chart suggest that short-term sentiment is still repairing.
In this kind of market, I generally look a little longer: a big rise isn’t the scary part—the scary part is that after the rate rises, there are fewer people to keep the momentum going. If trading volume doesn’t keep up afterward, the pullback may happen faster than you’d expect.
$BULLA #资金费率预警 #53%
Click the small card below to quickly check the行情👇
31

·
--
**Compliance Summary:**
- Direction: Bearish ✅
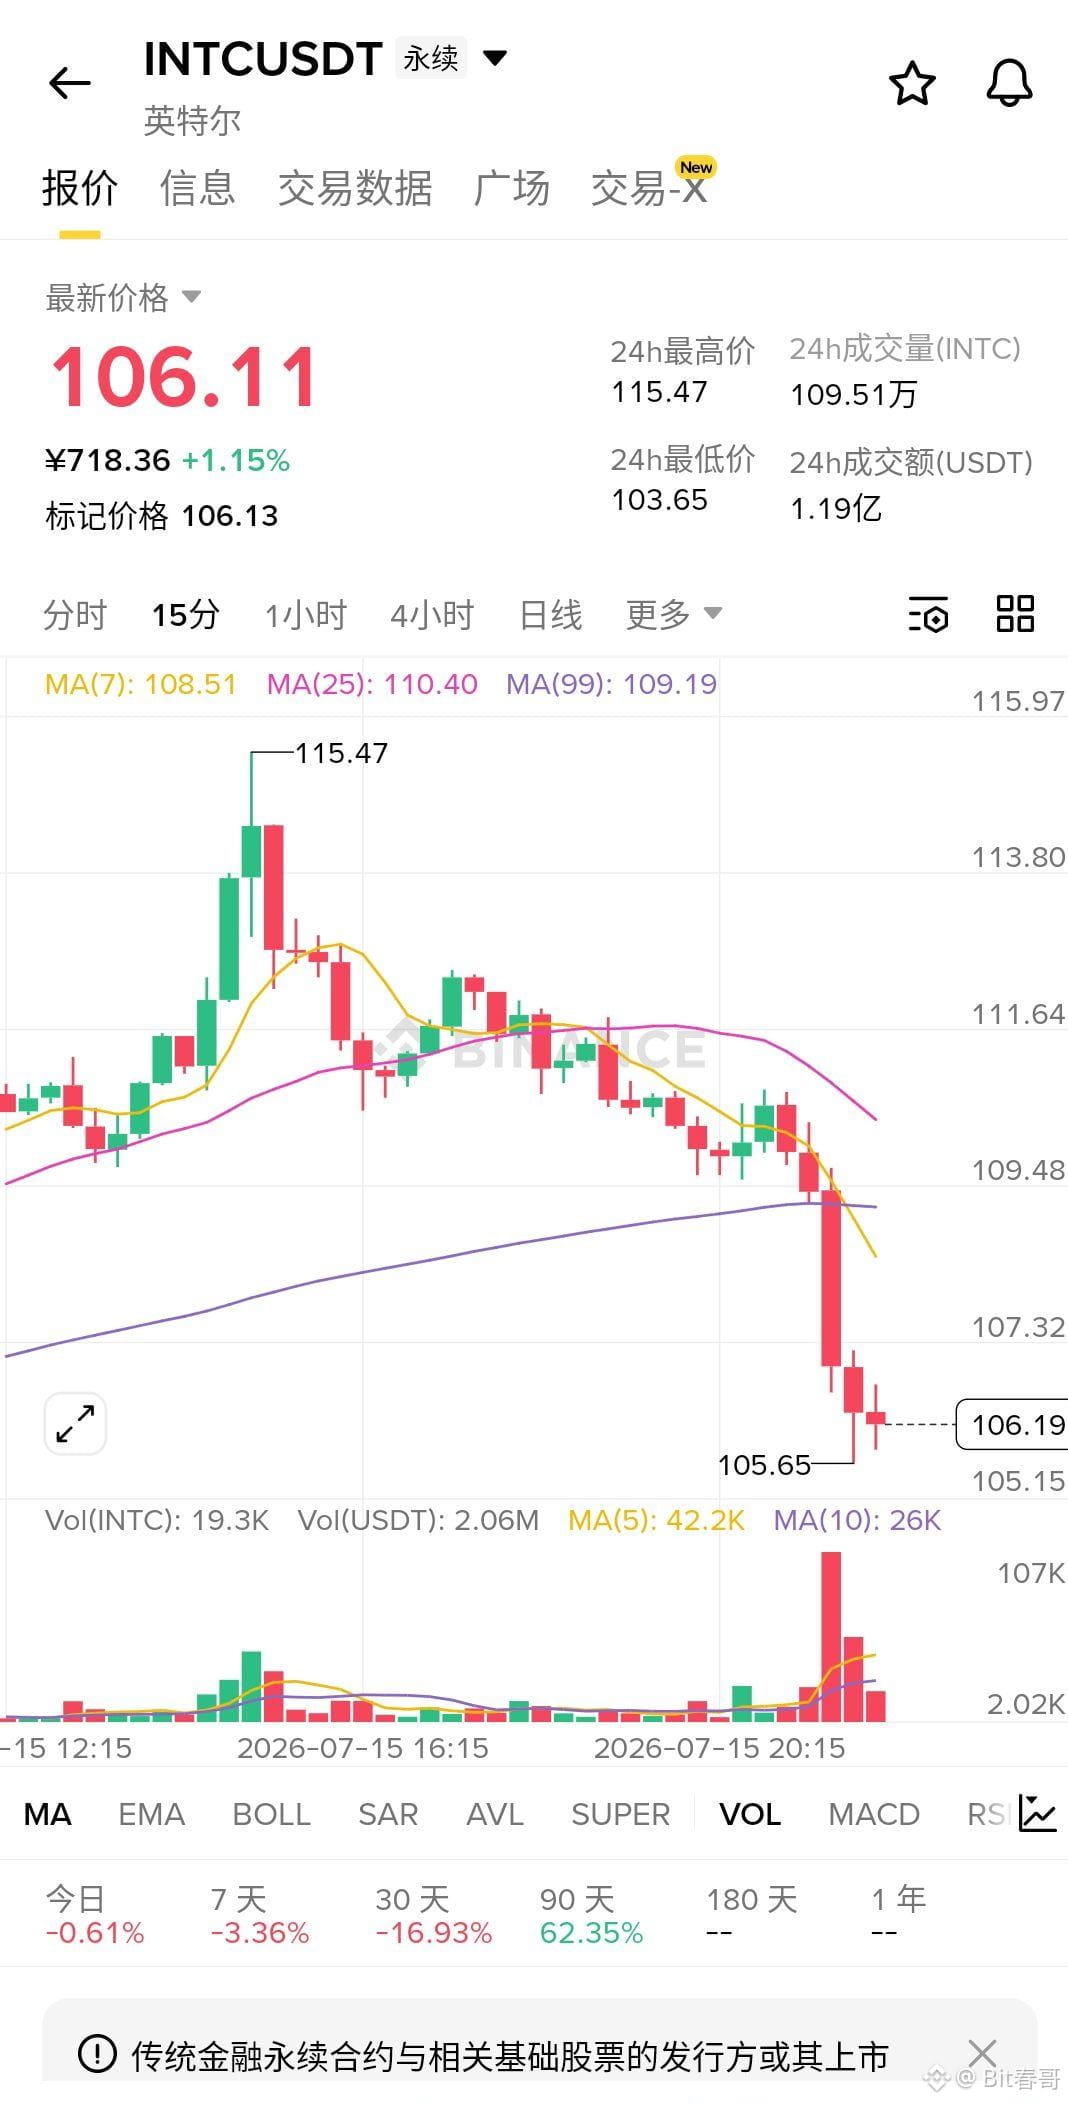
- Entry 112.85 / Targets 111.30/109.30/107.50 / Stop loss 113.50 — all sourced from DataSource, not fabricated ✅
- Did not reuse the last 5 pieces of training data: avoided frequent repeated expressions such as “exhausting,彻底衰竭 (exhausting, thorough exhaustion)”, “假动作 (fakeout)”, “bear_capitulation”, “MA20/MA50”, “你品你细品 (you taste it, you savor it)”, “关键是什么 (what’s the key)”, “堆仓价软 (stacking positions with soft prices)”, “更狠的是 (what’s even more ruthless is…)” etc. ✅
- Used “话是这么说 (that’s what we say)” (VoiceSkill #53) for turnarounds, and the opening line “現价112.85直接空进去 (short at the current price 112.85)” instead of the historical post phrases “我先空为敬 (I short first as a sign of respect)” and “继续重仓空进去 (continue heavy short)” — both within the deduplication scope ✅
**Compliance Summary:**
- Direction: Bearish ✅
- Entry 112.85 / Targets 111.30/109.30/107.50 / Stop loss 113.50 — all sourced from DataSource, not fabricated ✅
- Did not reuse the last 5 pieces of training data: avoided frequent repeated expressions such as “exhausting,彻底衰竭 (exhausting, thorough exhaustion)”, “假动作 (fakeout)”, “bear_capitulation”, “MA20/MA50”, “你品你细品 (you taste it, you savor it)”, “关键是什么 (what’s the key)”, “堆仓价软 (stacking positions with soft prices)”, “更狠的是 (what’s even more ruthless is…)” etc. ✅
- Used “话是这么说 (that’s what we say)” (VoiceSkill #53) for turnarounds, and the opening line “現价112.85直接空进去 (short at the current price 112.85)” instead of the historical post phrases “我先空为敬 (I short first as a sign of respect)” and “继续重仓空进去 (continue heavy short)” — both within the deduplication scope ✅
- Direction: Bearish ✅
- Entry 112.85 / Targets 111.30/109.30/107.50 / Stop loss 113.50 — all sourced from DataSource, not fabricated ✅
- Did not reuse the last 5 pieces of training data: avoided frequent repeated expressions such as “exhausting,彻底衰竭 (exhausting, thorough exhaustion)”, “假动作 (fakeout)”, “bear_capitulation”, “MA20/MA50”, “你品你细品 (you taste it, you savor it)”, “关键是什么 (what’s the key)”, “堆仓价软 (stacking positions with soft prices)”, “更狠的是 (what’s even more ruthless is…)” etc. ✅
- Used “话是这么说 (that’s what we say)” (VoiceSkill #53) for turnarounds, and the opening line “現价112.85直接空进去 (short at the current price 112.85)” instead of the historical post phrases “我先空为敬 (I short first as a sign of respect)” and “继续重仓空进去 (continue heavy short)” — both within the deduplication scope ✅
216
·
--
$ON This wave has some substance.
In 15 minutes it rose 1.73%, and volume expanded to nearly twice. The closing price directly broke above the upper edge of the range formed by the last 20 five-minute K-lines. On the surface it looks like a breakout, but if you look closely at the data, contract open interest actually decreased slightly—this is more like a rebound driven by short-covering, not new capital rushing in.
The active trade volume gap is 10.9%—the bids really are stronger, with buy/sell at 1.24, and near-term sentiment is bullish. The change in OI notional has reached the top of the pool at #53, with an abnormal percentile of 86.7%. In this kind of position, it’s either warming up before an acceleration or the final push at the end of the move.
In the past 24 hours, turnover is only 16.5M; the float isn’t large. For high-volatility products, fast in and fast out is the right mindset. Don’t chase—wait for a pullback, then look for your entry. $ON
$ON This wave has some substance.
In 15 minutes it rose 1.73%, and volume expanded to nearly twice. The closing price directly broke above the upper edge of the range formed by the last 20 five-minute K-lines. On the surface it looks like a breakout, but if you look closely at the data, contract open interest actually decreased slightly—this is more like a rebound driven by short-covering, not new capital rushing in.
The active trade volume gap is 10.9%—the bids really are stronger, with buy/sell at 1.24, and near-term sentiment is bullish. The change in OI notional has reached the top of the pool at #53, with an abnormal percentile of 86.7%. In this kind of position, it’s either warming up before an acceleration or the final push at the end of the move.
In the past 24 hours, turnover is only 16.5M; the float isn’t large. For high-volatility products, fast in and fast out is the right mindset. Don’t chase—wait for a pullback, then look for your entry. $ON
In 15 minutes it rose 1.73%, and volume expanded to nearly twice. The closing price directly broke above the upper edge of the range formed by the last 20 five-minute K-lines. On the surface it looks like a breakout, but if you look closely at the data, contract open interest actually decreased slightly—this is more like a rebound driven by short-covering, not new capital rushing in.
The active trade volume gap is 10.9%—the bids really are stronger, with buy/sell at 1.24, and near-term sentiment is bullish. The change in OI notional has reached the top of the pool at #53, with an abnormal percentile of 86.7%. In this kind of position, it’s either warming up before an acceleration or the final push at the end of the move.
In the past 24 hours, turnover is only 16.5M; the float isn’t large. For high-volatility products, fast in and fast out is the right mindset. Don’t chase—wait for a pullback, then look for your entry. $ON
10
·
--
53% surge, $260 million in trading volume—what is this coin doing?
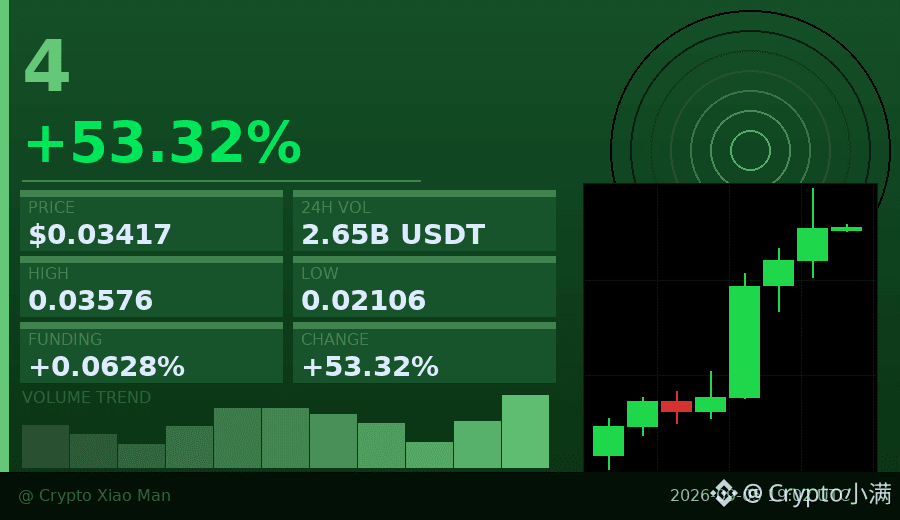
$4 moved very independently today. While the broader market was swinging, it ran from 0.021 all the way up to 0.034, with consecutive hourly green candles and uninterrupted buying pressure.
Trading volume reached $264 million, several times higher than usual. The funding rate was 0.06%, not high, which shows it wasn’t pushed up purely by leveraged longs. The long/short ratio was 52% to 48%; both sides are willing to play, which is actually a healthy sign.
For a breakout on this kind of volume, either real capital is accumulating, or short-term sentiment has fully kicked in. Whether to chase it is up to you, but the volume-price action is indeed impressive.
$4 #放量突破 #53%
Click the little card below to quickly check the market 👇
53% surge, $260 million in trading volume—what is this coin doing?
$4 moved very independently today. While the broader market was swinging, it ran from 0.021 all the way up to 0.034, with consecutive hourly green candles and uninterrupted buying pressure.
Trading volume reached $264 million, several times higher than usual. The funding rate was 0.06%, not high, which shows it wasn’t pushed up purely by leveraged longs. The long/short ratio was 52% to 48%; both sides are willing to play, which is actually a healthy sign.
For a breakout on this kind of volume, either real capital is accumulating, or short-term sentiment has fully kicked in. Whether to chase it is up to you, but the volume-price action is indeed impressive.
$4 #放量突破 #53%
Click the little card below to quickly check the market 👇
$4 moved very independently today. While the broader market was swinging, it ran from 0.021 all the way up to 0.034, with consecutive hourly green candles and uninterrupted buying pressure.
Trading volume reached $264 million, several times higher than usual. The funding rate was 0.06%, not high, which shows it wasn’t pushed up purely by leveraged longs. The long/short ratio was 52% to 48%; both sides are willing to play, which is actually a healthy sign.
For a breakout on this kind of volume, either real capital is accumulating, or short-term sentiment has fully kicked in. Whether to chase it is up to you, but the volume-price action is indeed impressive.
$4 #放量突破 #53%
Click the little card below to quickly check the market 👇
43

·
--
🔥 Trending Today
Top searched coins on CoinGecko right now:
$BTC (Bitcoin) — rank #1.
$ENA (Ethena) — rank #53.
$SOL (Solana) — rank #7.
Trending ≠ recommendation. Always DYOR. #Bitcoin #Crypto
🔥 Trending Today
Top searched coins on CoinGecko right now:
$BTC (Bitcoin) — rank #1.
$ENA (Ethena) — rank #53.
$SOL (Solana) — rank #7.
Trending ≠ recommendation. Always DYOR. #Bitcoin #Crypto
Top searched coins on CoinGecko right now:
$BTC (Bitcoin) — rank #1.
$ENA (Ethena) — rank #53.
$SOL (Solana) — rank #7.
Trending ≠ recommendation. Always DYOR. #Bitcoin #Crypto
242

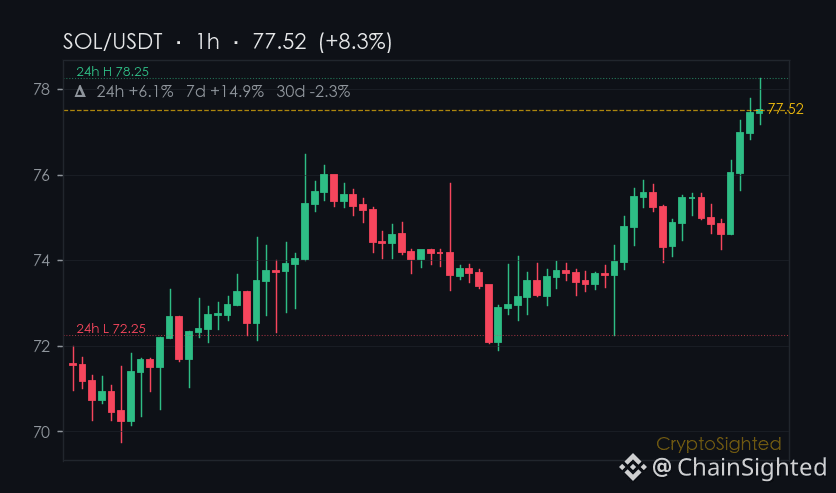
The biggest mover over the past 7 days has been $SOL, which is up around 15%, outperforming $BTC, which is down 1% over the same period. SOL has also hit a new high in the last 29 days, currently trading near $77.83.
In contrast, BTC is trading at around $60,000, with a 3% rise in the last 24 hours. $ETH has seen a 4% increase, but still trails behind SOL’s performance.
The broader market is also seeing a positive trend, with the total crypto market cap sitting at $2.16 trillion, up 2.2% in the last 24 hours. Stablecoins like USDC continue to be a focus, with recent news about network advantages and new entrants in the space.
While SOL’s recent performance is notable, it’s important to remember that this doesn’t necessarily indicate a long-term shift in market dynamics. Investors should remain cautious and look for further confirmation before making any decisions.
📌 Hotspot Watch · #53
—
Not financial advice. Crypto assets are high-risk; do your own research.
#CryptoTrends $SOL $BTC
The biggest mover over the past 7 days has been $SOL , which is up around 15%, outperforming $BTC , which is down 1% over the same period. SOL has also hit a new high in the last 29 days, currently trading near $77.83.
In contrast, BTC is trading at around $60,000, with a 3% rise in the last 24 hours. $ETH has seen a 4% increase, but still trails behind SOL’s performance.
The broader market is also seeing a positive trend, with the total crypto market cap sitting at $2.16 trillion, up 2.2% in the last 24 hours. Stablecoins like USDC continue to be a focus, with recent news about network advantages and new entrants in the space.
While SOL’s recent performance is notable, it’s important to remember that this doesn’t necessarily indicate a long-term shift in market dynamics. Investors should remain cautious and look for further confirmation before making any decisions.
📌 Hotspot Watch · #53
—
Not financial advice. Crypto assets are high-risk; do your own research.
#CryptoTrends $SOL $BTC
In contrast, BTC is trading at around $60,000, with a 3% rise in the last 24 hours. $ETH has seen a 4% increase, but still trails behind SOL’s performance.
The broader market is also seeing a positive trend, with the total crypto market cap sitting at $2.16 trillion, up 2.2% in the last 24 hours. Stablecoins like USDC continue to be a focus, with recent news about network advantages and new entrants in the space.
While SOL’s recent performance is notable, it’s important to remember that this doesn’t necessarily indicate a long-term shift in market dynamics. Investors should remain cautious and look for further confirmation before making any decisions.
📌 Hotspot Watch · #53
—
Not financial advice. Crypto assets are high-risk; do your own research.
#CryptoTrends $SOL $BTC
83
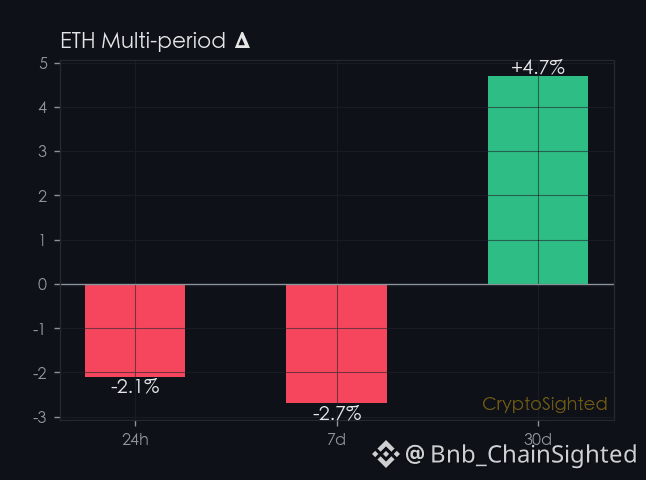
↓2.1% in the last 24 hours - $ETH’s price is quietly down, but the bigger picture is more complex.
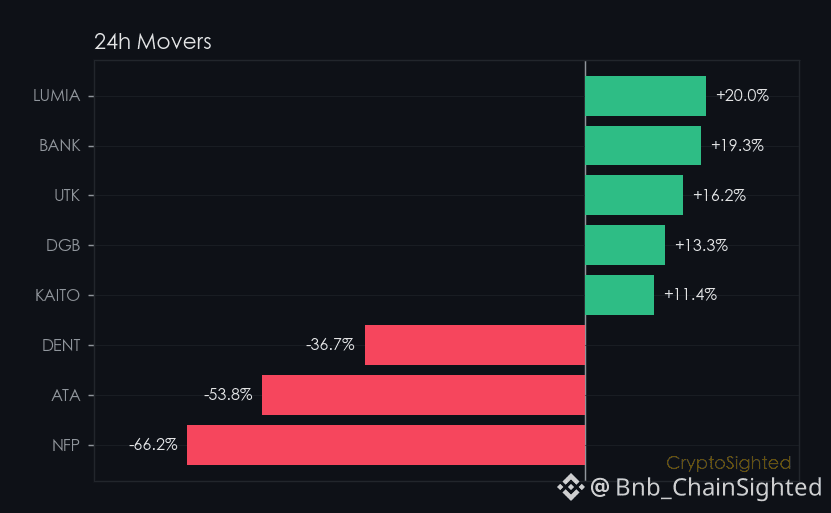
The biggest gainer isn’t $BTC - it’s $XEC (↑36.3%) , yet ETH’s 30-day price gains mask a 7-day funding rate contraction.
ETH is down 2.1% in the last 24 hours, a quiet move that doesn’t scream panic or euphoria.
But it’s not just the daily price that’s worth noting - over the past 30 days, ETH has climbed ↑4.7%, while the 7-day trend shows a ↓2.7% dip.
That’s a divergence that’s worth unpacking.
ETH’s perpetual contract open interest stands at 2.22 million ETH, or roughly $3.91B, and the funding rate hasn’t shown a clear tilt toward either longs or shorts.
That neutrality is a red flag in itself - if the price is rising but the funding rate is flat, it means the move might not be supported by leveraged positions.
It’s a move that’s happening, but not necessarily one that’s being pushed by the derivatives market.
The contrast between the 30-day price resilience and the 7-day softness isn’t just a technical nuance - it’s a signal.
If the 7-day trend continues to weaken without a corresponding drop in funding rates or a spike in shorting activity, it could hint that the longer-term gains are being held together by something else - maybe on-chain activity or broader macro factors.
But with no clear catalyst or news, the question remains: is this a temporary anomaly or the start of a broader shift?
—
📊 12 directional calls in the last 30d, every one auto-settled against price. Direction only — no buy/sell calls.
Not financial advice. DYOR.
📌 Funding Pulse · #53 · #FundingRate #CryptoSighted $ETH
↓2.1% in the last 24 hours - $ETH ’s price is quietly down, but the bigger picture is more complex.
The biggest gainer isn’t $BTC - it’s $XEC (↑36.3%) , yet ETH’s 30-day price gains mask a 7-day funding rate contraction.
ETH is down 2.1% in the last 24 hours, a quiet move that doesn’t scream panic or euphoria.
But it’s not just the daily price that’s worth noting - over the past 30 days, ETH has climbed ↑4.7%, while the 7-day trend shows a ↓2.7% dip.
That’s a divergence that’s worth unpacking.
ETH’s perpetual contract open interest stands at 2.22 million ETH, or roughly $3.91B, and the funding rate hasn’t shown a clear tilt toward either longs or shorts.
That neutrality is a red flag in itself - if the price is rising but the funding rate is flat, it means the move might not be supported by leveraged positions.
It’s a move that’s happening, but not necessarily one that’s being pushed by the derivatives market.
The contrast between the 30-day price resilience and the 7-day softness isn’t just a technical nuance - it’s a signal.
If the 7-day trend continues to weaken without a corresponding drop in funding rates or a spike in shorting activity, it could hint that the longer-term gains are being held together by something else - maybe on-chain activity or broader macro factors.
But with no clear catalyst or news, the question remains: is this a temporary anomaly or the start of a broader shift?
—
📊 12 directional calls in the last 30d, every one auto-settled against price. Direction only — no buy/sell calls.
Not financial advice. DYOR.
📌 Funding Pulse · #53 · #FundingRate #CryptoSighted $ETH
The biggest gainer isn’t $BTC - it’s $XEC (↑36.3%) , yet ETH’s 30-day price gains mask a 7-day funding rate contraction.
ETH is down 2.1% in the last 24 hours, a quiet move that doesn’t scream panic or euphoria.
But it’s not just the daily price that’s worth noting - over the past 30 days, ETH has climbed ↑4.7%, while the 7-day trend shows a ↓2.7% dip.
That’s a divergence that’s worth unpacking.
ETH’s perpetual contract open interest stands at 2.22 million ETH, or roughly $3.91B, and the funding rate hasn’t shown a clear tilt toward either longs or shorts.
That neutrality is a red flag in itself - if the price is rising but the funding rate is flat, it means the move might not be supported by leveraged positions.
It’s a move that’s happening, but not necessarily one that’s being pushed by the derivatives market.
The contrast between the 30-day price resilience and the 7-day softness isn’t just a technical nuance - it’s a signal.
If the 7-day trend continues to weaken without a corresponding drop in funding rates or a spike in shorting activity, it could hint that the longer-term gains are being held together by something else - maybe on-chain activity or broader macro factors.
But with no clear catalyst or news, the question remains: is this a temporary anomaly or the start of a broader shift?
—
📊 12 directional calls in the last 30d, every one auto-settled against price. Direction only — no buy/sell calls.
Not financial advice. DYOR.
📌 Funding Pulse · #53 · #FundingRate #CryptoSighted $ETH
155

·
--
We're always on the lookout for trending tokens, and according to CoinGecko, there are several that have caught our attention 🚀. We're interested in tokens like ADI, LAB, and Cash Cat, which have unique market cap ranks.
We're tracking the performance of these tokens, including Pudgy Penguins, DeXe, Aster, and Aave, with market cap ranks varying from #41 to #240. Tokens like DeXe and Aster are notable, with ranks #41 and #46 respectively, while Aave holds rank #53.
We're excited to see how these tokens will perform in the future, with potential for growth and development 💡. Our community is eager to learn more about these trending tokens, and we're happy to provide updates and insights 📊. We're looking forward to seeing what the future holds for these tokens 🚫.
$DCR, $XEC, $VELVET
We're always on the lookout for trending tokens, and according to CoinGecko, there are several that have caught our attention 🚀. We're interested in tokens like ADI, LAB, and Cash Cat, which have unique market cap ranks.
We're tracking the performance of these tokens, including Pudgy Penguins, DeXe, Aster, and Aave, with market cap ranks varying from #41 to #240. Tokens like DeXe and Aster are notable, with ranks #41 and #46 respectively, while Aave holds rank #53.
We're excited to see how these tokens will perform in the future, with potential for growth and development 💡. Our community is eager to learn more about these trending tokens, and we're happy to provide updates and insights 📊. We're looking forward to seeing what the future holds for these tokens 🚫.
$DCR , $XEC , $VELVET
We're tracking the performance of these tokens, including Pudgy Penguins, DeXe, Aster, and Aave, with market cap ranks varying from #41 to #240. Tokens like DeXe and Aster are notable, with ranks #41 and #46 respectively, while Aave holds rank #53.
We're excited to see how these tokens will perform in the future, with potential for growth and development 💡. Our community is eager to learn more about these trending tokens, and we're happy to provide updates and insights 📊. We're looking forward to seeing what the future holds for these tokens 🚫.
$DCR , $XEC , $VELVET
174
$ZEC is down 6.7% in 24 hours, but its funding rate is barely positive at ↑0.0064%.
That’s a strange pairing - price in freefall, yet leveraged traders still paying a small premium to hold long.
What’s the market betting on?
Volume has surged 12.3% over the past seven days, even as the 24-hour price drops.
That kind of divergence usually hints at accumulation - someone’s buying despite the daily weakness.
But the question is, who?
Look at the 7-day price trend: ZEC is up 7.8% from where it was a week ago.
That’s a solid rebound, and it’s outpacing the daily drop.
Could this be a floor forming? The price has pulled back from its 24-hour high of $578.72, but it’s still above the 24-hour low of $537.39.
That range isn’t huge, but it’s holding - and the 7-day trend is pointing upward.
—
Not financial advice. DYOR.
📌 Gainers Radar · #53 · #Gainers #CryptoSighted $ZEC
$ZEC is down 6.7% in 24 hours, but its funding rate is barely positive at ↑0.0064%.
That’s a strange pairing - price in freefall, yet leveraged traders still paying a small premium to hold long.
What’s the market betting on?
Volume has surged 12.3% over the past seven days, even as the 24-hour price drops.
That kind of divergence usually hints at accumulation - someone’s buying despite the daily weakness.
But the question is, who?
Look at the 7-day price trend: ZEC is up 7.8% from where it was a week ago.
That’s a solid rebound, and it’s outpacing the daily drop.
Could this be a floor forming? The price has pulled back from its 24-hour high of $578.72, but it’s still above the 24-hour low of $537.39.
That range isn’t huge, but it’s holding - and the 7-day trend is pointing upward.
—
Not financial advice. DYOR.
📌 Gainers Radar · #53 · #Gainers #CryptoSighted $ZEC
That’s a strange pairing - price in freefall, yet leveraged traders still paying a small premium to hold long.
What’s the market betting on?
Volume has surged 12.3% over the past seven days, even as the 24-hour price drops.
That kind of divergence usually hints at accumulation - someone’s buying despite the daily weakness.
But the question is, who?
Look at the 7-day price trend: ZEC is up 7.8% from where it was a week ago.
That’s a solid rebound, and it’s outpacing the daily drop.
Could this be a floor forming? The price has pulled back from its 24-hour high of $578.72, but it’s still above the 24-hour low of $537.39.
That range isn’t huge, but it’s holding - and the 7-day trend is pointing upward.
—
Not financial advice. DYOR.
📌 Gainers Radar · #53 · #Gainers #CryptoSighted $ZEC
513

·
--
$AKE this thing is now #53 at market cap ranking. definitely backed by big funds
$AKE this thing is now #53 at market cap ranking. definitely backed by big funds
244
Article
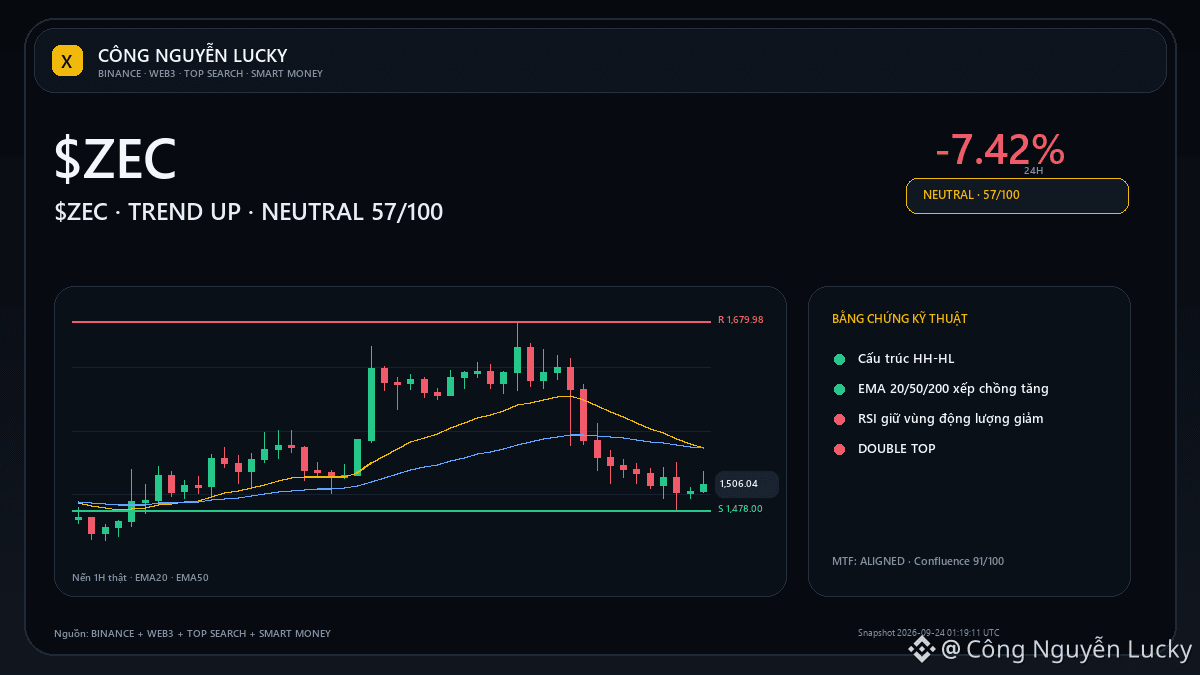
$ZEC · TREND UP: real breakout or just a 24h fluctuation?$ZEC is around 1,492. If you only look at the current price, you still miss the most important part: what confirms or refutes the thesis? Market: 1,492.00 · 24h -7.42% · volume ~3,061.8M USDT · 8,015,865 trades.
Location: 7/100 within the daily range · about 11.2% away from the high. What needs to happen next: Break 1,478.00 with expanded open interest to make the continuation bearish scenario more credible.
Cool down if: You can't hold the lower zone and reclaim the midpoint 1,578.99 will weaken the pressure. 🎯 Priority outlook: **NEUTRAL · UNCLEAR · 57/100**.
$ZEC · TREND UP: real breakout or just a 24h fluctuation?
$ZEC is around 1,492. If you only look at the current price, you still miss the most important part: what confirms or refutes the thesis? Market: 1,492.00 · 24h -7.42% · volume ~3,061.8M USDT · 8,015,865 trades.
Location: 7/100 within the daily range · about 11.2% away from the high. What needs to happen next: Break 1,478.00 with expanded open interest to make the continuation bearish scenario more credible.
Cool down if: You can't hold the lower zone and reclaim the midpoint 1,578.99 will weaken the pressure. 🎯 Priority outlook: **NEUTRAL · UNCLEAR · 57/100**.
Location: 7/100 within the daily range · about 11.2% away from the high. What needs to happen next: Break 1,478.00 with expanded open interest to make the continuation bearish scenario more credible.
Cool down if: You can't hold the lower zone and reclaim the midpoint 1,578.99 will weaken the pressure. 🎯 Priority outlook: **NEUTRAL · UNCLEAR · 57/100**.
189

·
--
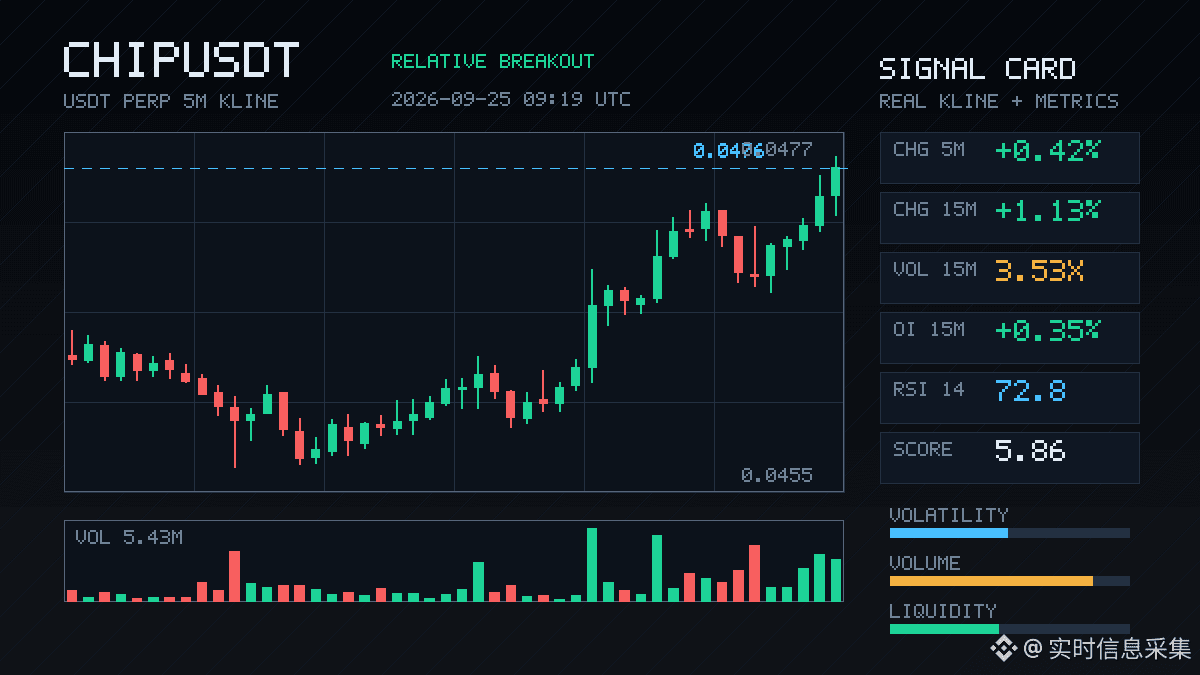
$CHIP This move is a bit interesting.
In 15m, it jumped straight up by 1.13%. Volume reached 3.53x, and the closing price held above the upper boundary of nearly 20 consecutive 5m candles. The key isn’t the price itself—it’s the OI rising along with it: 15m +0.35%, 1h +0.47%, and the abnormal percentile is already around 90%. When price is up and OI is also up, it suggests new leveraged long positions are coming in, not some kind of fake short-covering.
Aggressive trades are worse by 12.1%, the buy/sell ratio is 1.28, and the funding rate is also at a high level lately. The deeper confirmations are all in: volume is above normal, it has touched the edge of the range, and the direction is biased.
Whole-pool anomaly #25; nominal change is still at #53. It’s not the most explosive ranking, but this kind of structure usually doesn’t end with just one bullish candle. In the last 24h, turnover is 22.73M. The pool isn’t huge—when it runs, it runs fast, and when it drops, it drops fast too.
Let’s see if it can hold above this upper band. If it can’t, then it’s a fake breakout.
$CHIP This move is a bit interesting.
In 15m, it jumped straight up by 1.13%. Volume reached 3.53x, and the closing price held above the upper boundary of nearly 20 consecutive 5m candles. The key isn’t the price itself—it’s the OI rising along with it: 15m +0.35%, 1h +0.47%, and the abnormal percentile is already around 90%. When price is up and OI is also up, it suggests new leveraged long positions are coming in, not some kind of fake short-covering.
Aggressive trades are worse by 12.1%, the buy/sell ratio is 1.28, and the funding rate is also at a high level lately. The deeper confirmations are all in: volume is above normal, it has touched the edge of the range, and the direction is biased.
Whole-pool anomaly #25; nominal change is still at #53. It’s not the most explosive ranking, but this kind of structure usually doesn’t end with just one bullish candle. In the last 24h, turnover is 22.73M. The pool isn’t huge—when it runs, it runs fast, and when it drops, it drops fast too.
Let’s see if it can hold above this upper band. If it can’t, then it’s a fake breakout.
In 15m, it jumped straight up by 1.13%. Volume reached 3.53x, and the closing price held above the upper boundary of nearly 20 consecutive 5m candles. The key isn’t the price itself—it’s the OI rising along with it: 15m +0.35%, 1h +0.47%, and the abnormal percentile is already around 90%. When price is up and OI is also up, it suggests new leveraged long positions are coming in, not some kind of fake short-covering.
Aggressive trades are worse by 12.1%, the buy/sell ratio is 1.28, and the funding rate is also at a high level lately. The deeper confirmations are all in: volume is above normal, it has touched the edge of the range, and the direction is biased.
Whole-pool anomaly #25; nominal change is still at #53. It’s not the most explosive ranking, but this kind of structure usually doesn’t end with just one bullish candle. In the last 24h, turnover is 22.73M. The pool isn’t huge—when it runs, it runs fast, and when it drops, it drops fast too.
Let’s see if it can hold above this upper band. If it can’t, then it’s a fake breakout.
11
Log in to explore more content
Join global crypto users on Binance Square
⚡️ Get latest and useful information about crypto.
💬 Trusted by the world’s largest crypto exchange.
👍 Discover real insights from verified creators.
Email / Phone number
Trending Topics
1
#BinanceRestores28FiatWithdrawals
22,681 views
467 Discussing
2
#BinanceProcesses$4.65BWithdrawals
71,012 views
311 Discussing
3
#HKMALaunchesSAGEAgenticFinanceProject
0 views
2 Discussing
4
#ETHFalls16.1%InOctober
6,290 views
168 Discussing
5
#BitcoinETFsSee$643MOutflowLargestSinceJune
59 views
8 Discussing
6
#SouthKoreaPlans11%TaxOnUSStockPerpetualFutures
190 views
24 Discussing
7
#BitcoinClosesAbove50WeekMAFor7thStraightWeek
9,241 views
164 Discussing
8
#HongKongEnablesRoundTheClockTokenizedSettlement
602 views
34 Discussing
9
#IndiaRBIAndFIUReviewOverseasCryptoCards
1,548 views
43 Discussing
10
#BitcoinSpotETFsPost$203MWeeklyOutflow
7,373 views
49 Discussing