
#47
47
32,965 views
73 Discussing
Hot
Latest

·
--
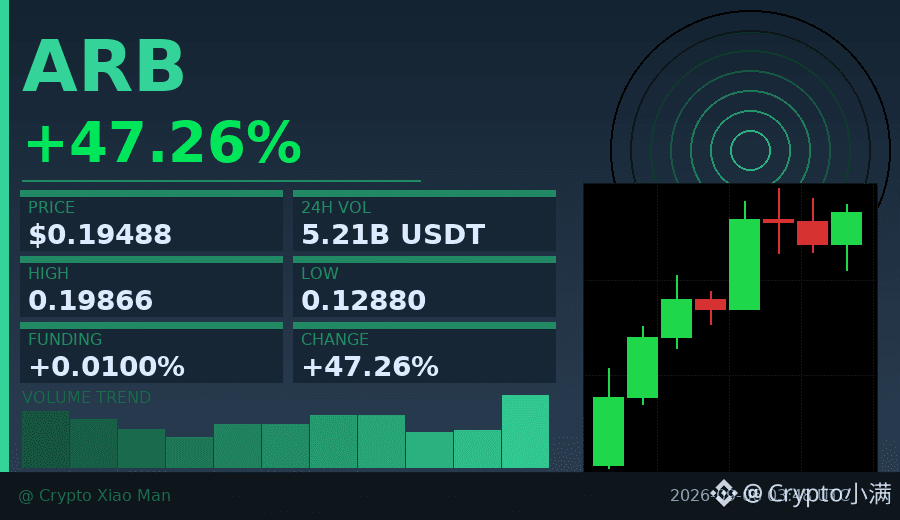
47% gain, and ARB isn’t just following the crowd this time.
Over the past 8 hours, ARB has surged from 0.1288 to 0.1986, with trading volume jumping to 521 million USDT. What matters isn’t how much it rose, but how it rose — every bullish candle came with real buying volume, not a fake pump.
The funding rate is only 0.0001, which means longs haven’t gotten overheated yet. The long/short ratio is 57% to 43%; some traders are bearish, yet the price keeps rising. That kind of divergence is actually a healthy sign.
After the earlier round of meme coin speculation, funds are starting to flow back into Layer 2 projects with real ecosystems. ARB has been down for so long, and now it’s breaking out with strong volume at this level — worth adding to your watchlist.
$ARB #Layer2 Volume breakout #47%
Click the card below to quickly check the market👇
47% gain, and ARB isn’t just following the crowd this time.
Over the past 8 hours, ARB has surged from 0.1288 to 0.1986, with trading volume jumping to 521 million USDT. What matters isn’t how much it rose, but how it rose — every bullish candle came with real buying volume, not a fake pump.
The funding rate is only 0.0001, which means longs haven’t gotten overheated yet. The long/short ratio is 57% to 43%; some traders are bearish, yet the price keeps rising. That kind of divergence is actually a healthy sign.
After the earlier round of meme coin speculation, funds are starting to flow back into Layer 2 projects with real ecosystems. ARB has been down for so long, and now it’s breaking out with strong volume at this level — worth adding to your watchlist.
$ARB #Layer2 Volume breakout #47%
Click the card below to quickly check the market👇
Over the past 8 hours, ARB has surged from 0.1288 to 0.1986, with trading volume jumping to 521 million USDT. What matters isn’t how much it rose, but how it rose — every bullish candle came with real buying volume, not a fake pump.
The funding rate is only 0.0001, which means longs haven’t gotten overheated yet. The long/short ratio is 57% to 43%; some traders are bearish, yet the price keeps rising. That kind of divergence is actually a healthy sign.
After the earlier round of meme coin speculation, funds are starting to flow back into Layer 2 projects with real ecosystems. ARB has been down for so long, and now it’s breaking out with strong volume at this level — worth adding to your watchlist.
$ARB #Layer2 Volume breakout #47%
Click the card below to quickly check the market👇
92
·
--
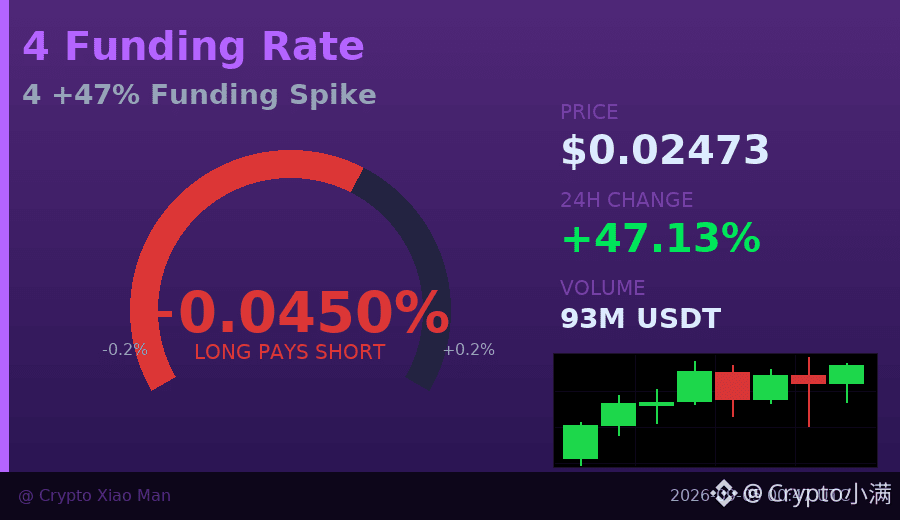
Behind the 47% surge, the funding rate has already risen to 0.045% — this is bulls betting with real money.
Token "4" has continued to strengthen over the past 8 hours, rising steadily from 0.019 to around 0.025, with trading volume of 92.7 million U. Longs account for 60%, which is not extremely crowded, but the rising funding rate shows leverage sentiment is heating up.
In this kind of market, chasing the rally requires paying attention to funding costs. If the funding environment stays hot, there is still room in the short term; once the funding rate rises further, downside correction pressure will also increase.
I will be watching whether support around 0.022 remains firm.
$4 #资金费率预警 #47%
Click the card below to quickly check the market 👇
Behind the 47% surge, the funding rate has already risen to 0.045% — this is bulls betting with real money.
Token "4" has continued to strengthen over the past 8 hours, rising steadily from 0.019 to around 0.025, with trading volume of 92.7 million U. Longs account for 60%, which is not extremely crowded, but the rising funding rate shows leverage sentiment is heating up.
In this kind of market, chasing the rally requires paying attention to funding costs. If the funding environment stays hot, there is still room in the short term; once the funding rate rises further, downside correction pressure will also increase.
I will be watching whether support around 0.022 remains firm.
$4 #资金费率预警 #47%
Click the card below to quickly check the market 👇
Token "4" has continued to strengthen over the past 8 hours, rising steadily from 0.019 to around 0.025, with trading volume of 92.7 million U. Longs account for 60%, which is not extremely crowded, but the rising funding rate shows leverage sentiment is heating up.
In this kind of market, chasing the rally requires paying attention to funding costs. If the funding environment stays hot, there is still room in the short term; once the funding rate rises further, downside correction pressure will also increase.
I will be watching whether support around 0.022 remains firm.
$4 #资金费率预警 #47%
Click the card below to quickly check the market 👇
89
·
--
47% single-day gain, but do you understand the capital battle behind it?
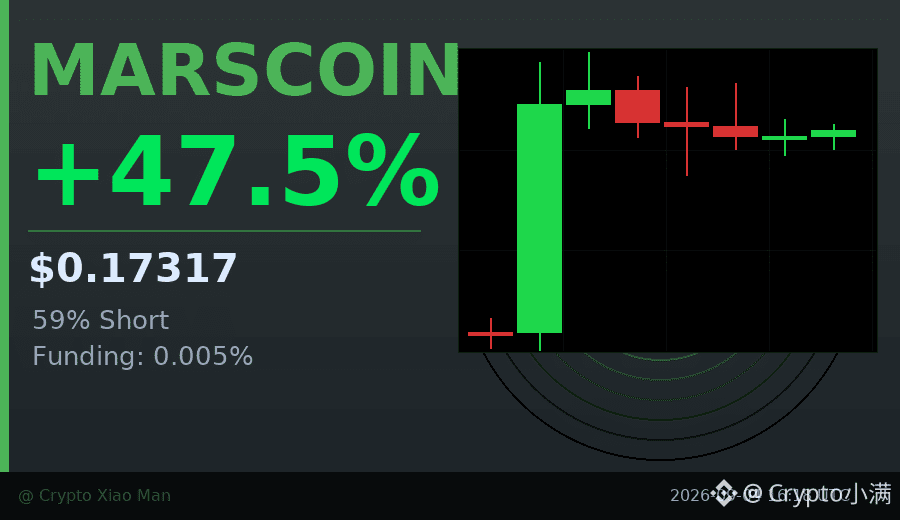
MARS today surged from 0.095 to 0.196, then pulled back to 0.173, a typical high-volatility shakeout. Trading volume reached 755 million USDT, showing that a large amount of short-term capital was chasing the rally and selling into strength.
More importantly, the long/short ratio: shorts account for 59%, yet the price did not drop. This means shorts are being forced to cover, which in turn is helping push the price higher. The hourly chart has been posting consecutive bullish candles, and buying support is still holding.
However, the funding rate is only 0.005%, which means leverage is not extreme and has not yet reached a dangerous zone. What really needs attention is if the next push higher comes with rising volume but weakening momentum, that would be the short-term topping signal.
$MARSCOIN #多空博弈 #47%
Click the card below to quickly check the market 👇
47% single-day gain, but do you understand the capital battle behind it?
MARS today surged from 0.095 to 0.196, then pulled back to 0.173, a typical high-volatility shakeout. Trading volume reached 755 million USDT, showing that a large amount of short-term capital was chasing the rally and selling into strength.
More importantly, the long/short ratio: shorts account for 59%, yet the price did not drop. This means shorts are being forced to cover, which in turn is helping push the price higher. The hourly chart has been posting consecutive bullish candles, and buying support is still holding.
However, the funding rate is only 0.005%, which means leverage is not extreme and has not yet reached a dangerous zone. What really needs attention is if the next push higher comes with rising volume but weakening momentum, that would be the short-term topping signal.
$MARSCOIN #多空博弈 #47%
Click the card below to quickly check the market 👇
MARS today surged from 0.095 to 0.196, then pulled back to 0.173, a typical high-volatility shakeout. Trading volume reached 755 million USDT, showing that a large amount of short-term capital was chasing the rally and selling into strength.
More importantly, the long/short ratio: shorts account for 59%, yet the price did not drop. This means shorts are being forced to cover, which in turn is helping push the price higher. The hourly chart has been posting consecutive bullish candles, and buying support is still holding.
However, the funding rate is only 0.005%, which means leverage is not extreme and has not yet reached a dangerous zone. What really needs attention is if the next push higher comes with rising volume but weakening momentum, that would be the short-term topping signal.
$MARSCOIN #多空博弈 #47%
Click the card below to quickly check the market 👇
12
·
--
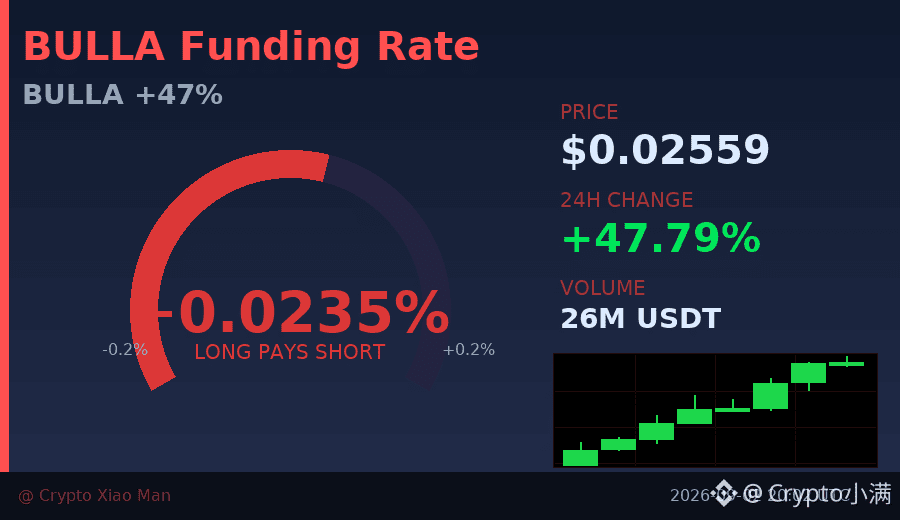
47% single-day rise, but what’s truly worth noting is that the funding rate has already climbed to 0.0235%.
BULLA today moved from 0.017 to 0.0256 now, with trading volume of 25.5 million USDT, and the hourly chart has closed green consecutively.
Long positions make up 62%, indicating that most people are already onboard, and those chasing higher prices are starting to increase.
At times like this, it’s usually not “rush to chase,” but rather to see whether it can hold above 0.024 over the next 1–2 hours.
If it can’t hold, the probability of a short-term pullback will rise; if it can hold, then there’s a chance it will continue testing the prior high upward.
For now, I’m placing it on my watchlist and will consider it after a pullback confirms.
$BULLA #资金费率预警 #47%
Tap the small card below to quickly check the market 👇
47% single-day rise, but what’s truly worth noting is that the funding rate has already climbed to 0.0235%.
BULLA today moved from 0.017 to 0.0256 now, with trading volume of 25.5 million USDT, and the hourly chart has closed green consecutively.
Long positions make up 62%, indicating that most people are already onboard, and those chasing higher prices are starting to increase.
At times like this, it’s usually not “rush to chase,” but rather to see whether it can hold above 0.024 over the next 1–2 hours.
If it can’t hold, the probability of a short-term pullback will rise; if it can hold, then there’s a chance it will continue testing the prior high upward.
For now, I’m placing it on my watchlist and will consider it after a pullback confirms.
$BULLA #资金费率预警 #47%
Tap the small card below to quickly check the market 👇
BULLA today moved from 0.017 to 0.0256 now, with trading volume of 25.5 million USDT, and the hourly chart has closed green consecutively.
Long positions make up 62%, indicating that most people are already onboard, and those chasing higher prices are starting to increase.
At times like this, it’s usually not “rush to chase,” but rather to see whether it can hold above 0.024 over the next 1–2 hours.
If it can’t hold, the probability of a short-term pullback will rise; if it can hold, then there’s a chance it will continue testing the prior high upward.
For now, I’m placing it on my watchlist and will consider it after a pullback confirms.
$BULLA #资金费率预警 #47%
Tap the small card below to quickly check the market 👇
82
·
--
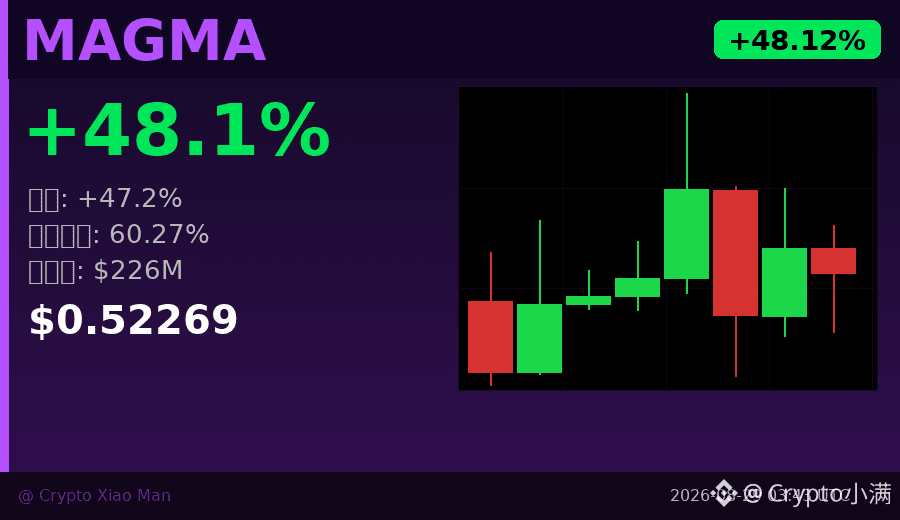
60% of people are shorting, but MAGMA somehow still surged 47%.
This phenomenon today is quite interesting—shorts hold an overwhelming majority (60.27% vs 39.73% longs). In theory, this kind of long/short structure should keep downward pressure on the price. Yet MAGMA was pushed all the way from the intraday low of 0.346 up to 0.580, a gain of nearly 47%.
What’s happening behind the scenes?
Accumulated short positions → the price gets forced upward → a large number of short positions are forced to close → the closing action in turn pushes the price even higher. This is a classic short squeeze. It’s not a market driven by active buying pressure, but rather a passive, “stepping-on-a-landmine” style rally.
Trading volume also confirms it: over the past 8 hours, total volume exceeded $226 million. The 5th and 6th candlesticks show a clear surge in volume (28.5M + 38.5M), matching the period when the price was most violently volatile.
The funding rate is currently 0.036%—bullish but not extreme—suggesting the market hasn’t reached a fully frenzy state yet.
What we need to watch now is: after the short squeeze ends, how much real buying demand remains to support the price? If trading volume starts to shrink rapidly while the price stays elevated, be careful—there could be a reversal.
$MAGMA #空头挤压 #47%暴涨
Click the card below to quickly view the行情👇
60% of people are shorting, but MAGMA somehow still surged 47%.
This phenomenon today is quite interesting—shorts hold an overwhelming majority (60.27% vs 39.73% longs). In theory, this kind of long/short structure should keep downward pressure on the price. Yet MAGMA was pushed all the way from the intraday low of 0.346 up to 0.580, a gain of nearly 47%.
What’s happening behind the scenes?
Accumulated short positions → the price gets forced upward → a large number of short positions are forced to close → the closing action in turn pushes the price even higher. This is a classic short squeeze. It’s not a market driven by active buying pressure, but rather a passive, “stepping-on-a-landmine” style rally.
Trading volume also confirms it: over the past 8 hours, total volume exceeded $226 million. The 5th and 6th candlesticks show a clear surge in volume (28.5M + 38.5M), matching the period when the price was most violently volatile.
The funding rate is currently 0.036%—bullish but not extreme—suggesting the market hasn’t reached a fully frenzy state yet.
What we need to watch now is: after the short squeeze ends, how much real buying demand remains to support the price? If trading volume starts to shrink rapidly while the price stays elevated, be careful—there could be a reversal.
$MAGMA #空头挤压 #47%暴涨
Click the card below to quickly view the行情👇
This phenomenon today is quite interesting—shorts hold an overwhelming majority (60.27% vs 39.73% longs). In theory, this kind of long/short structure should keep downward pressure on the price. Yet MAGMA was pushed all the way from the intraday low of 0.346 up to 0.580, a gain of nearly 47%.
What’s happening behind the scenes?
Accumulated short positions → the price gets forced upward → a large number of short positions are forced to close → the closing action in turn pushes the price even higher. This is a classic short squeeze. It’s not a market driven by active buying pressure, but rather a passive, “stepping-on-a-landmine” style rally.
Trading volume also confirms it: over the past 8 hours, total volume exceeded $226 million. The 5th and 6th candlesticks show a clear surge in volume (28.5M + 38.5M), matching the period when the price was most violently volatile.
The funding rate is currently 0.036%—bullish but not extreme—suggesting the market hasn’t reached a fully frenzy state yet.
What we need to watch now is: after the short squeeze ends, how much real buying demand remains to support the price? If trading volume starts to shrink rapidly while the price stays elevated, be careful—there could be a reversal.
$MAGMA #空头挤压 #47%暴涨
Click the card below to quickly view the行情👇
108


·
--
NEIRO/USDT — No Trade Zone, Wait for Confirmation📊 NEIRO/USDT Technical Analysis — No Trade Zone
NEIRO is a squeeze-and-wait coin. Here's why I'm sitting on my hands:
📉 PRICE: 0.0000894 | -0.67% 24H | Vol $1.2M
📉 Market Cap: ~$30M | Ranked #47 among memes
📐 STRUCTURE
• 1D: BULLISH — Recovered from Aug 18 low 0.000062, pumped 86% to 0.000115 on Aug 21
• 4H: CONSOLIDATING — Range 0.000083-0.000092 for 2 weeks
• 1H: BEARISH — Lower highs 0.0000918 → 0.0000915 → 0.0000911 → 0.0000908
• RSI: 1D neutral / 4H neutral / 1H bearish
No BOS or CHOCH on any timeframe. Compression building.
📍 S/R LEVELS
• Resistance: 0.00009155 (rejected 4x) → 0.00009295 (Sep 3) → 0.000104 (Aug 21)
• Support: 0.00008849 (tested 4x) → 0.00008264 (Sep 4) → 0.00007973 (Aug 30)
📦 DERIVATIVES
• OI: $4.92M — declining from $5.23M peak (positions closing)
• Funding: 0.005% flat — slight long bias, not extreme
• CVD: 🔴 86% SELLERS vs 14% buyers — biggest red flag
🎯 SIGNAL GATE: ❌ REJECTED
• HTF alignment: 1/2 (1D bullish but BTC bearish suppresses)
• MSB: None confirmed on any timeframe
• CVD sellers 86% against any long
• Price inside consolidation, not at structural level
📊 SIMILAR TOKENS
Top memecoins all outperforming NEIRO on stability. DOGE at $27B, SHIB at $3.7B, FLOKI at $295M. NEIRO is smallest at $30M with weakest structure.
🧱 KEY READ
1. Aug 21 spike was pump-and-dump — 86% dump in 2 weeks
2. 86% CVD sell pressure = distribution into every bounce
3. OI declining = no new money, speculators exiting
4. BTC weakness adds more downside risk
🎯 TRADE PLAN — WAIT FOR CONFIRMATION
🟢 LONG: 0.000080-0.000082
• Only if retests Aug 30 low with 1H CHOCH (higher high above 0.000092)
• SL: 0.000078 | TP: 0.000092
🔴 SHORT: 0.000091-0.000092
• Only if price rejects resistance with volume + OI confirmation
• SL: 0.000094 | TP: 0.000085
⚠️ No entry right now. Wait for structure.
#NEIRO #crypto #technicalanalysis #memecoins
NEIRO/USDT — No Trade Zone, Wait for Confirmation
📊 NEIRO/USDT Technical Analysis — No Trade Zone
NEIRO is a squeeze-and-wait coin. Here's why I'm sitting on my hands:
📉 PRICE: 0.0000894 | -0.67% 24H | Vol $1.2M
📉 Market Cap: ~$30M | Ranked #47 among memes
📐 STRUCTURE
• 1D: BULLISH — Recovered from Aug 18 low 0.000062, pumped 86% to 0.000115 on Aug 21
• 4H: CONSOLIDATING — Range 0.000083-0.000092 for 2 weeks
• 1H: BEARISH — Lower highs 0.0000918 → 0.0000915 → 0.0000911 → 0.0000908
• RSI: 1D neutral / 4H neutral / 1H bearish
No BOS or CHOCH on any timeframe. Compression building.
📍 S/R LEVELS
• Resistance: 0.00009155 (rejected 4x) → 0.00009295 (Sep 3) → 0.000104 (Aug 21)
• Support: 0.00008849 (tested 4x) → 0.00008264 (Sep 4) → 0.00007973 (Aug 30)
📦 DERIVATIVES
• OI: $4.92M — declining from $5.23M peak (positions closing)
• Funding: 0.005% flat — slight long bias, not extreme
• CVD: 🔴 86% SELLERS vs 14% buyers — biggest red flag
🎯 SIGNAL GATE: ❌ REJECTED
• HTF alignment: 1/2 (1D bullish but BTC bearish suppresses)
• MSB: None confirmed on any timeframe
• CVD sellers 86% against any long
• Price inside consolidation, not at structural level
📊 SIMILAR TOKENS
Top memecoins all outperforming NEIRO on stability. DOGE at $27B, SHIB at $3.7B, FLOKI at $295M. NEIRO is smallest at $30M with weakest structure.
🧱 KEY READ
1. Aug 21 spike was pump-and-dump — 86% dump in 2 weeks
2. 86% CVD sell pressure = distribution into every bounce
3. OI declining = no new money, speculators exiting
4. BTC weakness adds more downside risk
🎯 TRADE PLAN — WAIT FOR CONFIRMATION
🟢 LONG: 0.000080-0.000082
• Only if retests Aug 30 low with 1H CHOCH (higher high above 0.000092)
• SL: 0.000078 | TP: 0.000092
🔴 SHORT: 0.000091-0.000092
• Only if price rejects resistance with volume + OI confirmation
• SL: 0.000094 | TP: 0.000085
⚠️ No entry right now. Wait for structure.
#NEIRO #crypto #technicalanalysis #memecoins
NEIRO is a squeeze-and-wait coin. Here's why I'm sitting on my hands:
📉 PRICE: 0.0000894 | -0.67% 24H | Vol $1.2M
📉 Market Cap: ~$30M | Ranked #47 among memes
📐 STRUCTURE
• 1D: BULLISH — Recovered from Aug 18 low 0.000062, pumped 86% to 0.000115 on Aug 21
• 4H: CONSOLIDATING — Range 0.000083-0.000092 for 2 weeks
• 1H: BEARISH — Lower highs 0.0000918 → 0.0000915 → 0.0000911 → 0.0000908
• RSI: 1D neutral / 4H neutral / 1H bearish
No BOS or CHOCH on any timeframe. Compression building.
📍 S/R LEVELS
• Resistance: 0.00009155 (rejected 4x) → 0.00009295 (Sep 3) → 0.000104 (Aug 21)
• Support: 0.00008849 (tested 4x) → 0.00008264 (Sep 4) → 0.00007973 (Aug 30)
📦 DERIVATIVES
• OI: $4.92M — declining from $5.23M peak (positions closing)
• Funding: 0.005% flat — slight long bias, not extreme
• CVD: 🔴 86% SELLERS vs 14% buyers — biggest red flag
🎯 SIGNAL GATE: ❌ REJECTED
• HTF alignment: 1/2 (1D bullish but BTC bearish suppresses)
• MSB: None confirmed on any timeframe
• CVD sellers 86% against any long
• Price inside consolidation, not at structural level
📊 SIMILAR TOKENS
Top memecoins all outperforming NEIRO on stability. DOGE at $27B, SHIB at $3.7B, FLOKI at $295M. NEIRO is smallest at $30M with weakest structure.
🧱 KEY READ
1. Aug 21 spike was pump-and-dump — 86% dump in 2 weeks
2. 86% CVD sell pressure = distribution into every bounce
3. OI declining = no new money, speculators exiting
4. BTC weakness adds more downside risk
🎯 TRADE PLAN — WAIT FOR CONFIRMATION
🟢 LONG: 0.000080-0.000082
• Only if retests Aug 30 low with 1H CHOCH (higher high above 0.000092)
• SL: 0.000078 | TP: 0.000092
🔴 SHORT: 0.000091-0.000092
• Only if price rejects resistance with volume + OI confirmation
• SL: 0.000094 | TP: 0.000085
⚠️ No entry right now. Wait for structure.
#NEIRO #crypto #technicalanalysis #memecoins
211
·
--
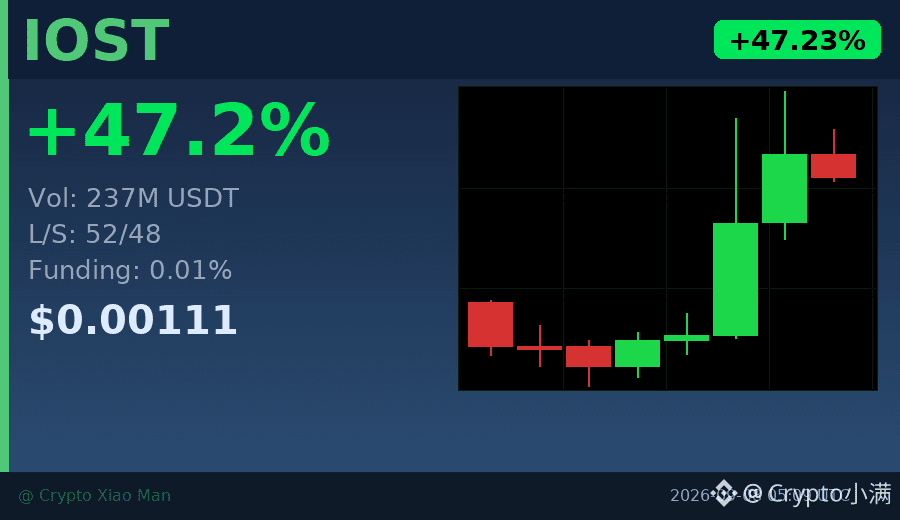
47% rise—behind it, the funding rate is only 0.01%. What does this mean?
Today, IOST moved from 0.00074 to 0.00119, with trading volume surging to 237 million USDT.
But the long/short ratio is 52% to 48%, almost even—no one is overwhelmingly betting one way.
Within 8 hours, the overall trend strengthened, but the latest K-line has started to pull back on shrinking volume.
This kind of “big rally but not much disagreement” situation often means major players are probing overhead sell pressure.
If it can hold above 0.00105 without breaking, there may be momentum for a further short-term push higher.
If it breaks down, it may need to retrace toward around 0.00094 to find support.
$IOST #资金费率极低 #47% rise
Tap the small card below to quickly check the行情👇
47% rise—behind it, the funding rate is only 0.01%. What does this mean?
Today, IOST moved from 0.00074 to 0.00119, with trading volume surging to 237 million USDT.
But the long/short ratio is 52% to 48%, almost even—no one is overwhelmingly betting one way.
Within 8 hours, the overall trend strengthened, but the latest K-line has started to pull back on shrinking volume.
This kind of “big rally but not much disagreement” situation often means major players are probing overhead sell pressure.
If it can hold above 0.00105 without breaking, there may be momentum for a further short-term push higher.
If it breaks down, it may need to retrace toward around 0.00094 to find support.
$IOST #资金费率极低 #47% rise
Tap the small card below to quickly check the行情👇
Today, IOST moved from 0.00074 to 0.00119, with trading volume surging to 237 million USDT.
But the long/short ratio is 52% to 48%, almost even—no one is overwhelmingly betting one way.
Within 8 hours, the overall trend strengthened, but the latest K-line has started to pull back on shrinking volume.
This kind of “big rally but not much disagreement” situation often means major players are probing overhead sell pressure.
If it can hold above 0.00105 without breaking, there may be momentum for a further short-term push higher.
If it breaks down, it may need to retrace toward around 0.00094 to find support.
$IOST #资金费率极低 #47% rise
Tap the small card below to quickly check the行情👇
86

·
--
Bullish
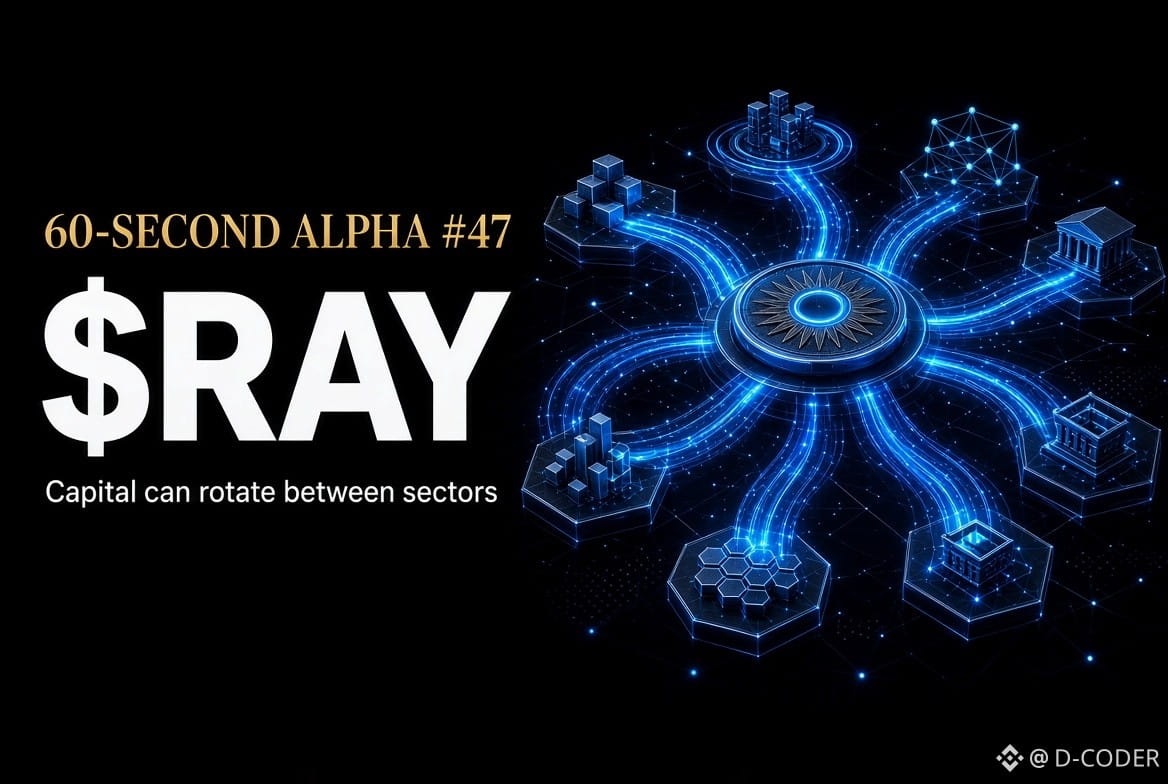
60-SECOND ALPHA #47 | $RAY
$RAY has recently appeared among Binance's strongest movers, showing how quickly capital can rotate into specific DeFi assets even when the overall market is not moving equally.
This is an important market lesson: money doesn't always flow evenly across altcoins. Sometimes one sector or ecosystem suddenly attracts attention while others remain quiet.
The lesson: Watch where capital is rotating, not just which coin is green.
{spot}(RAYUSDT)
60-SECOND ALPHA #47 | $RAY
$RAY has recently appeared among Binance's strongest movers, showing how quickly capital can rotate into specific DeFi assets even when the overall market is not moving equally.
This is an important market lesson: money doesn't always flow evenly across altcoins. Sometimes one sector or ecosystem suddenly attracts attention while others remain quiet.
The lesson: Watch where capital is rotating, not just which coin is green.
$RAY has recently appeared among Binance's strongest movers, showing how quickly capital can rotate into specific DeFi assets even when the overall market is not moving equally.
This is an important market lesson: money doesn't always flow evenly across altcoins. Sometimes one sector or ecosystem suddenly attracts attention while others remain quiet.
The lesson: Watch where capital is rotating, not just which coin is green.
16
·
--
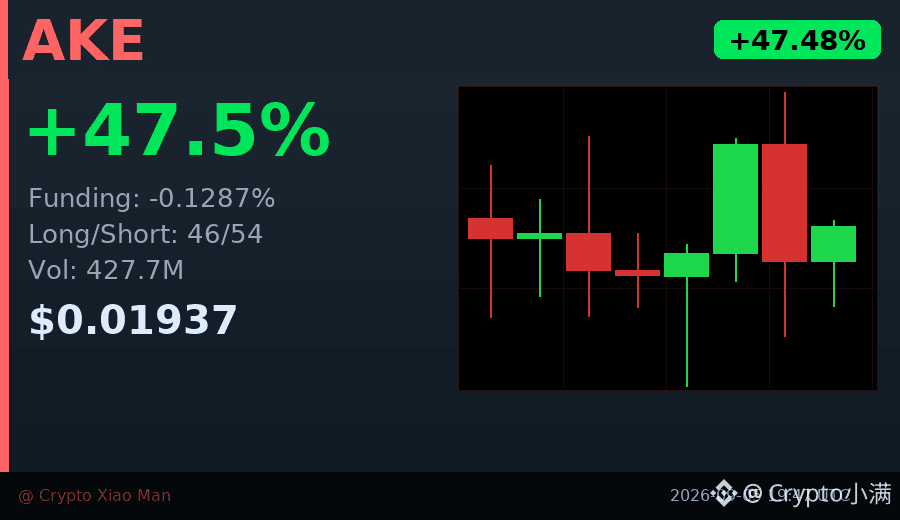
Behind the 47% surge, are shorts actually adding positions?
AKE surged 47.48% today, with trading volume reaching 427 million USDT. It looks like a classic bull frenzy. But the funding rate is -0.1287%, and the long/short ratio is 46% to 54% — meaning there are actually more shorts.
What does this mean? Are big players opening short positions on the rebound, or are retail traders chasing the pump and getting caught on the reversal?
The candlestick chart shows short-term consolidation, with huge volatility from a high of 0.0217 to a low of 0.0127. In this kind of divided market, chasing the rise requires extra caution.
I’m staying on the sidelines and waiting until the direction becomes clearer.
$AKE #资金费率背离 #47%
Click the card below to quickly view the market👇
Behind the 47% surge, are shorts actually adding positions?
AKE surged 47.48% today, with trading volume reaching 427 million USDT. It looks like a classic bull frenzy. But the funding rate is -0.1287%, and the long/short ratio is 46% to 54% — meaning there are actually more shorts.
What does this mean? Are big players opening short positions on the rebound, or are retail traders chasing the pump and getting caught on the reversal?
The candlestick chart shows short-term consolidation, with huge volatility from a high of 0.0217 to a low of 0.0127. In this kind of divided market, chasing the rise requires extra caution.
I’m staying on the sidelines and waiting until the direction becomes clearer.
$AKE #资金费率背离 #47%
Click the card below to quickly view the market👇
AKE surged 47.48% today, with trading volume reaching 427 million USDT. It looks like a classic bull frenzy. But the funding rate is -0.1287%, and the long/short ratio is 46% to 54% — meaning there are actually more shorts.
What does this mean? Are big players opening short positions on the rebound, or are retail traders chasing the pump and getting caught on the reversal?
The candlestick chart shows short-term consolidation, with huge volatility from a high of 0.0217 to a low of 0.0127. In this kind of divided market, chasing the rise requires extra caution.
I’m staying on the sidelines and waiting until the direction becomes clearer.
$AKE #资金费率背离 #47%
Click the card below to quickly view the market👇
95
·
--
There’s one detail I think is worth mentioning—
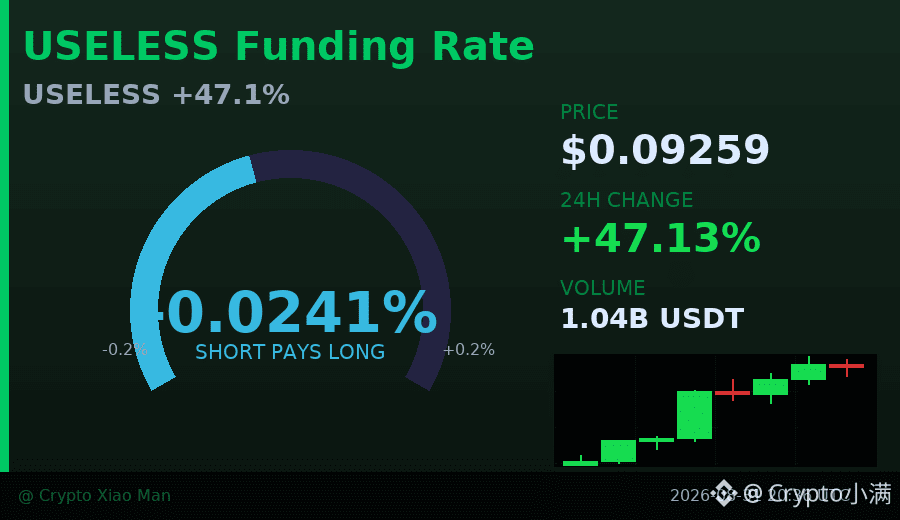
Today, $USELESS is up 47%. It has risen from the low of 0.062 to around 0.094. This kind of move isn’t small on any coin. But what I want to talk about more is the change in trading volume.
At its most intense moment, the volume on a single candlestick surged to 290 million USD (U), then quickly fell back. The most recent one is already down to less than 100 million U. The price is still high, but the capital pushing it higher is quietly decreasing.
In plain terms: when it’s rising, people rush in like a swarm; now the entrants aren’t as many as before. This kind of “volume-price divergence” is very common on small-cap coins—first it spikes, then it waits to be confirmed.
There’s another interesting point: the funding rate is slightly negative (-0.024%). That suggests that the people betting on a drop haven’t been fully liquidated yet—they’re still holding their positions. If the price continues to hold up, those positions will eventually be forced to close, which would push the price up again. But if the volume keeps shrinking and price support can’t hold, then those shorts may end up becoming the very force that suppresses it instead.
I’ll focus on the next few candlesticks to see whether the volume can pick up again, and whether the 0.088–0.09 range can hold.
$USELESS #量价背离 #47%爆涨
Click the small card below to quickly check the market trend👇
There’s one detail I think is worth mentioning—
Today, $USELESS is up 47%. It has risen from the low of 0.062 to around 0.094. This kind of move isn’t small on any coin. But what I want to talk about more is the change in trading volume.
At its most intense moment, the volume on a single candlestick surged to 290 million USD (U), then quickly fell back. The most recent one is already down to less than 100 million U. The price is still high, but the capital pushing it higher is quietly decreasing.
In plain terms: when it’s rising, people rush in like a swarm; now the entrants aren’t as many as before. This kind of “volume-price divergence” is very common on small-cap coins—first it spikes, then it waits to be confirmed.
There’s another interesting point: the funding rate is slightly negative (-0.024%). That suggests that the people betting on a drop haven’t been fully liquidated yet—they’re still holding their positions. If the price continues to hold up, those positions will eventually be forced to close, which would push the price up again. But if the volume keeps shrinking and price support can’t hold, then those shorts may end up becoming the very force that suppresses it instead.
I’ll focus on the next few candlesticks to see whether the volume can pick up again, and whether the 0.088–0.09 range can hold.
$USELESS #量价背离 #47%爆涨
Click the small card below to quickly check the market trend👇
Today, $USELESS is up 47%. It has risen from the low of 0.062 to around 0.094. This kind of move isn’t small on any coin. But what I want to talk about more is the change in trading volume.
At its most intense moment, the volume on a single candlestick surged to 290 million USD (U), then quickly fell back. The most recent one is already down to less than 100 million U. The price is still high, but the capital pushing it higher is quietly decreasing.
In plain terms: when it’s rising, people rush in like a swarm; now the entrants aren’t as many as before. This kind of “volume-price divergence” is very common on small-cap coins—first it spikes, then it waits to be confirmed.
There’s another interesting point: the funding rate is slightly negative (-0.024%). That suggests that the people betting on a drop haven’t been fully liquidated yet—they’re still holding their positions. If the price continues to hold up, those positions will eventually be forced to close, which would push the price up again. But if the volume keeps shrinking and price support can’t hold, then those shorts may end up becoming the very force that suppresses it instead.
I’ll focus on the next few candlesticks to see whether the volume can pick up again, and whether the 0.088–0.09 range can hold.
$USELESS #量价背离 #47%爆涨
Click the small card below to quickly check the market trend👇
32
·
--
A 47% jump—so what now?
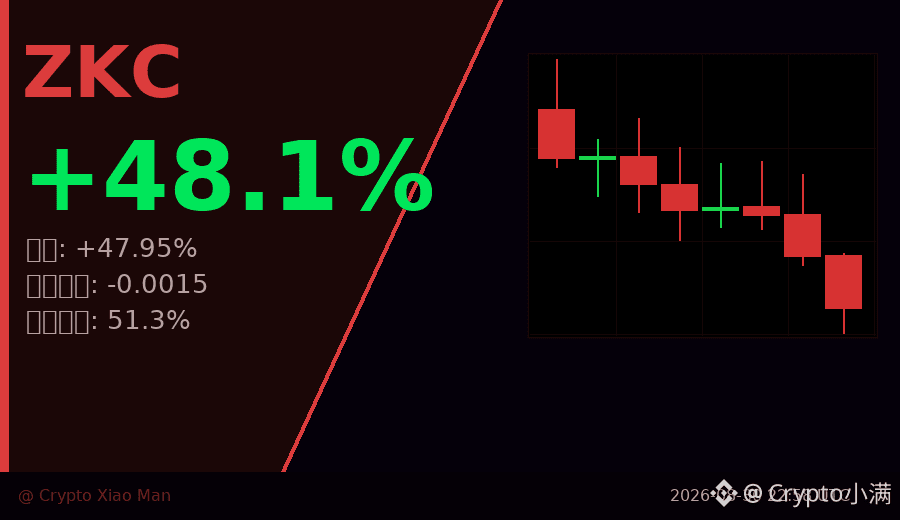
Today ZKC surged to a high of 0.0708, up nearly 48%—sounds pretty wild.
But the current price is 0.0588, which means it has already fallen by almost 17% from the peak.
Three consecutive hourly bearish candles, with volume shrinking candle by candle—each bounce is losing momentum.
This kind of chart pattern is called “volume-price top divergence”—in simple terms, it means there are people selling at the top.
The funding rate is negative (-0.0015), meaning shorts are willing to pay longs.
This usually happens when the market is highly divided on the next move, as both sides test each other.
Shorts vs longs: 51.3% short vs 48.7% long—shorts have a slight edge.
It’s not an overwhelming gap, but combined with the bearish-candle structure, it suggests that short-term selling pressure hasn’t fully been digested.
Today’s low touched 0.0395, with an intraday swing of nearly 80%.
With volatility at this level, if your stop-loss placement is even slightly off, it can be swept through instantly.
If you’re watching this coin, the most important thing to observe right now is:
Can it hold around 0.057? That’s the dense closing-price zone from the past few candles.
If it holds, there may be another push higher. If it doesn’t, today’s big bullish candle could be heavily unwound.
$ZKC #量价背离 #47%暴涨后怎么看
Click the small card below to quickly view the market👇
A 47% jump—so what now?
Today ZKC surged to a high of 0.0708, up nearly 48%—sounds pretty wild.
But the current price is 0.0588, which means it has already fallen by almost 17% from the peak.
Three consecutive hourly bearish candles, with volume shrinking candle by candle—each bounce is losing momentum.
This kind of chart pattern is called “volume-price top divergence”—in simple terms, it means there are people selling at the top.
The funding rate is negative (-0.0015), meaning shorts are willing to pay longs.
This usually happens when the market is highly divided on the next move, as both sides test each other.
Shorts vs longs: 51.3% short vs 48.7% long—shorts have a slight edge.
It’s not an overwhelming gap, but combined with the bearish-candle structure, it suggests that short-term selling pressure hasn’t fully been digested.
Today’s low touched 0.0395, with an intraday swing of nearly 80%.
With volatility at this level, if your stop-loss placement is even slightly off, it can be swept through instantly.
If you’re watching this coin, the most important thing to observe right now is:
Can it hold around 0.057? That’s the dense closing-price zone from the past few candles.
If it holds, there may be another push higher. If it doesn’t, today’s big bullish candle could be heavily unwound.
$ZKC #量价背离 #47%暴涨后怎么看
Click the small card below to quickly view the market👇
Today ZKC surged to a high of 0.0708, up nearly 48%—sounds pretty wild.
But the current price is 0.0588, which means it has already fallen by almost 17% from the peak.
Three consecutive hourly bearish candles, with volume shrinking candle by candle—each bounce is losing momentum.
This kind of chart pattern is called “volume-price top divergence”—in simple terms, it means there are people selling at the top.
The funding rate is negative (-0.0015), meaning shorts are willing to pay longs.
This usually happens when the market is highly divided on the next move, as both sides test each other.
Shorts vs longs: 51.3% short vs 48.7% long—shorts have a slight edge.
It’s not an overwhelming gap, but combined with the bearish-candle structure, it suggests that short-term selling pressure hasn’t fully been digested.
Today’s low touched 0.0395, with an intraday swing of nearly 80%.
With volatility at this level, if your stop-loss placement is even slightly off, it can be swept through instantly.
If you’re watching this coin, the most important thing to observe right now is:
Can it hold around 0.057? That’s the dense closing-price zone from the past few candles.
If it holds, there may be another push higher. If it doesn’t, today’s big bullish candle could be heavily unwound.
$ZKC #量价背离 #47%暴涨后怎么看
Click the small card below to quickly view the market👇
62
·
--
60% of people shorted it, and it still rose 47%—that’s the story of AKE today.
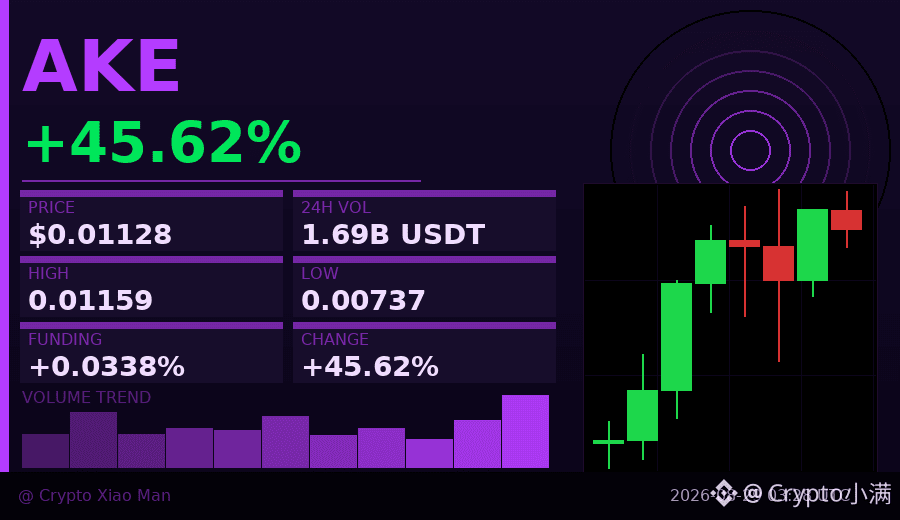
Most people are on the side of the bears, betting that it will fall. But the price doesn’t follow the majority’s script. Instead, it surged from 0.0073 to 0.0116, climbing steadily over just 8 hours.
This situation has a name: a “short squeeze”—short sellers are forced to buy back at higher prices to cut losses. Their buying in turn pushes the price higher. The higher it goes, the more they lose; the more they lose, the more they buy—creating a stampede.
Right now, the funding rate is positive (0.034%), which means longs are paying to maintain their positions, but they’re still in the minority. Under this structure, the price itself is speaking in favor of the longs.
As for volume: today already saw 168 million in trading volume—an active move with real capital involved, not just idle fluctuations.
Watch for possible reversal signals now: if the bears close out their positions at scale, the momentum behind the stampede will fade; or if the funding rate spikes too high, longs may start arbitraging by shorting, and the direction will switch.
High volatility in the short term is still here. Don’t assume “it already jumped 47%, so there’s still room to chase,” and don’t assume “since most people are short, it must fall.” The market doesn’t owe the majority a correct outcome.
$AKE #逼空行情 #47% surge
Click the small card below to quickly check the行情👇
60% of people shorted it, and it still rose 47%—that’s the story of AKE today.
Most people are on the side of the bears, betting that it will fall. But the price doesn’t follow the majority’s script. Instead, it surged from 0.0073 to 0.0116, climbing steadily over just 8 hours.
This situation has a name: a “short squeeze”—short sellers are forced to buy back at higher prices to cut losses. Their buying in turn pushes the price higher. The higher it goes, the more they lose; the more they lose, the more they buy—creating a stampede.
Right now, the funding rate is positive (0.034%), which means longs are paying to maintain their positions, but they’re still in the minority. Under this structure, the price itself is speaking in favor of the longs.
As for volume: today already saw 168 million in trading volume—an active move with real capital involved, not just idle fluctuations.
Watch for possible reversal signals now: if the bears close out their positions at scale, the momentum behind the stampede will fade; or if the funding rate spikes too high, longs may start arbitraging by shorting, and the direction will switch.
High volatility in the short term is still here. Don’t assume “it already jumped 47%, so there’s still room to chase,” and don’t assume “since most people are short, it must fall.” The market doesn’t owe the majority a correct outcome.
$AKE #逼空行情 #47% surge
Click the small card below to quickly check the行情👇
Most people are on the side of the bears, betting that it will fall. But the price doesn’t follow the majority’s script. Instead, it surged from 0.0073 to 0.0116, climbing steadily over just 8 hours.
This situation has a name: a “short squeeze”—short sellers are forced to buy back at higher prices to cut losses. Their buying in turn pushes the price higher. The higher it goes, the more they lose; the more they lose, the more they buy—creating a stampede.
Right now, the funding rate is positive (0.034%), which means longs are paying to maintain their positions, but they’re still in the minority. Under this structure, the price itself is speaking in favor of the longs.
As for volume: today already saw 168 million in trading volume—an active move with real capital involved, not just idle fluctuations.
Watch for possible reversal signals now: if the bears close out their positions at scale, the momentum behind the stampede will fade; or if the funding rate spikes too high, longs may start arbitraging by shorting, and the direction will switch.
High volatility in the short term is still here. Don’t assume “it already jumped 47%, so there’s still room to chase,” and don’t assume “since most people are short, it must fall.” The market doesn’t owe the majority a correct outcome.
$AKE #逼空行情 #47% surge
Click the small card below to quickly check the行情👇
79
·
--
The last candlestick volume was 1.3 billion, the previous one only 100 million—
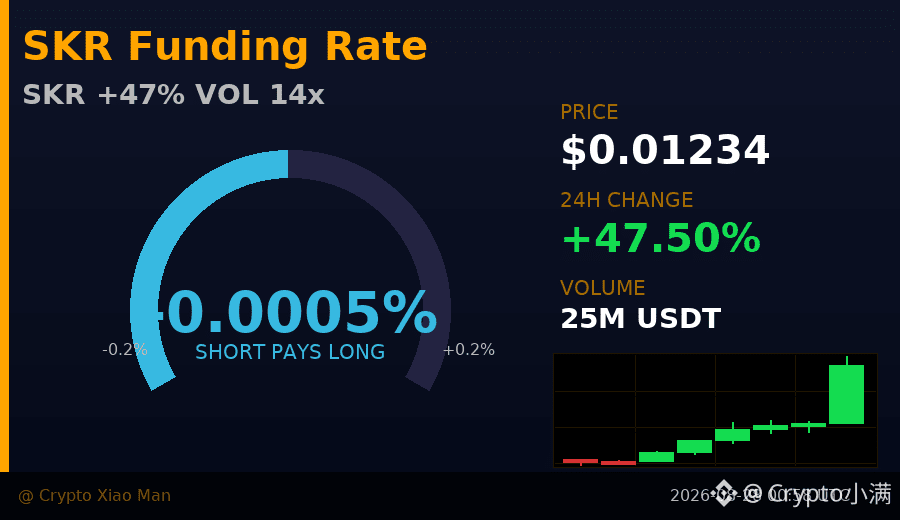
Today’s SKR move has a somewhat extreme volume-price relationship. The price surged from 0.0092 to 0.0124, up 47%, but what really caught my attention wasn’t how much it rose—it was that the volume on the final candlestick expanded by nearly 14x.
This kind of volume structure usually points to two possibilities: either major players are absorbing follower buy orders at high levels and then distributing, or it’s a real breakout signal that triggers a chain reaction of buying.
The long/short ratio is currently 64% longs vs 36% shorts—longs clearly have the upper hand. But the funding rate is negative, meaning there are actually quite a few people shorting in the futures market. These two signals point in opposite directions, so the structure is a bit torn.
Three consecutive hourly candlesticks closing bullish is a good sign, but after a surge to this magnitude of volume, a short-term pullback with reduced volume is normal for digestion. Only if it continues to expand in volume and push upward would it indicate that the buying interest is genuinely solid.
At this level, I’ll be watching how the成交量 (trading volume) changes. Volume is the key to this move.
$SKR #成交量异动 #47% spike up
Click the card below to quickly check the行情👇
The last candlestick volume was 1.3 billion, the previous one only 100 million—
Today’s SKR move has a somewhat extreme volume-price relationship. The price surged from 0.0092 to 0.0124, up 47%, but what really caught my attention wasn’t how much it rose—it was that the volume on the final candlestick expanded by nearly 14x.
This kind of volume structure usually points to two possibilities: either major players are absorbing follower buy orders at high levels and then distributing, or it’s a real breakout signal that triggers a chain reaction of buying.
The long/short ratio is currently 64% longs vs 36% shorts—longs clearly have the upper hand. But the funding rate is negative, meaning there are actually quite a few people shorting in the futures market. These two signals point in opposite directions, so the structure is a bit torn.
Three consecutive hourly candlesticks closing bullish is a good sign, but after a surge to this magnitude of volume, a short-term pullback with reduced volume is normal for digestion. Only if it continues to expand in volume and push upward would it indicate that the buying interest is genuinely solid.
At this level, I’ll be watching how the成交量 (trading volume) changes. Volume is the key to this move.
$SKR #成交量异动 #47% spike up
Click the card below to quickly check the行情👇
Today’s SKR move has a somewhat extreme volume-price relationship. The price surged from 0.0092 to 0.0124, up 47%, but what really caught my attention wasn’t how much it rose—it was that the volume on the final candlestick expanded by nearly 14x.
This kind of volume structure usually points to two possibilities: either major players are absorbing follower buy orders at high levels and then distributing, or it’s a real breakout signal that triggers a chain reaction of buying.
The long/short ratio is currently 64% longs vs 36% shorts—longs clearly have the upper hand. But the funding rate is negative, meaning there are actually quite a few people shorting in the futures market. These two signals point in opposite directions, so the structure is a bit torn.
Three consecutive hourly candlesticks closing bullish is a good sign, but after a surge to this magnitude of volume, a short-term pullback with reduced volume is normal for digestion. Only if it continues to expand in volume and push upward would it indicate that the buying interest is genuinely solid.
At this level, I’ll be watching how the成交量 (trading volume) changes. Volume is the key to this move.
$SKR #成交量异动 #47% spike up
Click the card below to quickly check the行情👇
78
·
--
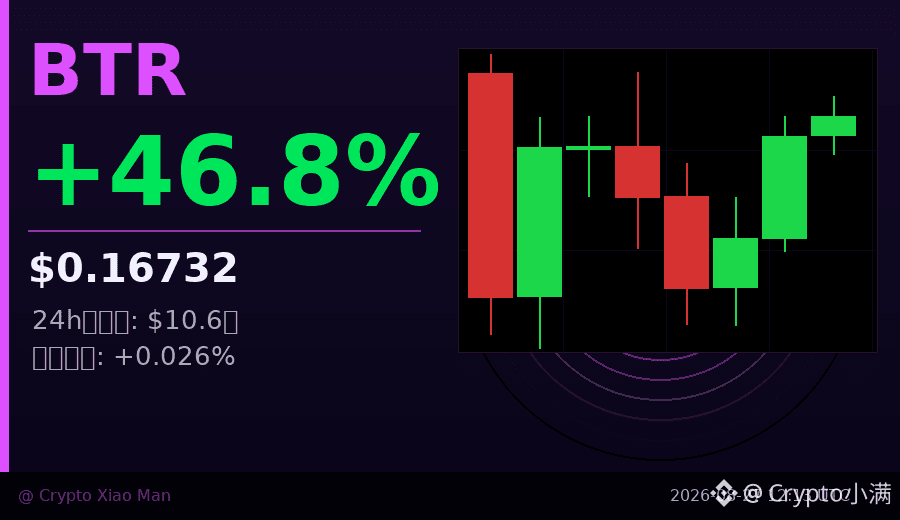
71% of people are shorting, but the price has risen by nearly 50%.
$BTR ’s data today is quite interesting—over the past 24 hours, the price increased by 47.7%, climbing from a low of 0.111 all the way to a high of 0.179. That’s not a small move. But the long/short ratio shows that shorts make up 71.45%, while longs are only 28.55%.
It’s pretty straightforward: most people are betting that it will fall, and the market slapped them in the face.
Technically, this situation is called a “short squeeze”—the more shorts there are, the greater the forced-covering pressure when the price rises, which in turn pushes the price even higher. The candlesticks back this up too: the last three consecutive hourly candles closed bullish, indicating that the buying pressure hasn’t dissipated yet.
Trading volume is also extremely high—over $1.06 billion. For a token priced around 0.16, liquidity is very abundant.
Of course, after this kind of sudden surge, the funding rate is still relatively low (+0.026%), meaning the market hasn’t entered an overheated state. However, the open interest is close to $290 million, and if the direction reverses, volatility could ramp up quickly.
Right now, if shorts don’t cut their losses, there’s still a possibility that the tug-of-war continues. But if you chase the price higher, you need to clearly understand how much drawdown you can tolerate.
$BTR #空头挤压 #47% surge
Click the small card below to quickly view the行情👇
71% of people are shorting, but the price has risen by nearly 50%.
$BTR ’s data today is quite interesting—over the past 24 hours, the price increased by 47.7%, climbing from a low of 0.111 all the way to a high of 0.179. That’s not a small move. But the long/short ratio shows that shorts make up 71.45%, while longs are only 28.55%.
It’s pretty straightforward: most people are betting that it will fall, and the market slapped them in the face.
Technically, this situation is called a “short squeeze”—the more shorts there are, the greater the forced-covering pressure when the price rises, which in turn pushes the price even higher. The candlesticks back this up too: the last three consecutive hourly candles closed bullish, indicating that the buying pressure hasn’t dissipated yet.
Trading volume is also extremely high—over $1.06 billion. For a token priced around 0.16, liquidity is very abundant.
Of course, after this kind of sudden surge, the funding rate is still relatively low (+0.026%), meaning the market hasn’t entered an overheated state. However, the open interest is close to $290 million, and if the direction reverses, volatility could ramp up quickly.
Right now, if shorts don’t cut their losses, there’s still a possibility that the tug-of-war continues. But if you chase the price higher, you need to clearly understand how much drawdown you can tolerate.
$BTR #空头挤压 #47% surge
Click the small card below to quickly view the行情👇
$BTR ’s data today is quite interesting—over the past 24 hours, the price increased by 47.7%, climbing from a low of 0.111 all the way to a high of 0.179. That’s not a small move. But the long/short ratio shows that shorts make up 71.45%, while longs are only 28.55%.
It’s pretty straightforward: most people are betting that it will fall, and the market slapped them in the face.
Technically, this situation is called a “short squeeze”—the more shorts there are, the greater the forced-covering pressure when the price rises, which in turn pushes the price even higher. The candlesticks back this up too: the last three consecutive hourly candles closed bullish, indicating that the buying pressure hasn’t dissipated yet.
Trading volume is also extremely high—over $1.06 billion. For a token priced around 0.16, liquidity is very abundant.
Of course, after this kind of sudden surge, the funding rate is still relatively low (+0.026%), meaning the market hasn’t entered an overheated state. However, the open interest is close to $290 million, and if the direction reverses, volatility could ramp up quickly.
Right now, if shorts don’t cut their losses, there’s still a possibility that the tug-of-war continues. But if you chase the price higher, you need to clearly understand how much drawdown you can tolerate.
$BTR #空头挤压 #47% surge
Click the small card below to quickly view the行情👇
55

·
--
1. Bitcoin (BTC) +3.2% – still #1, 2. Solana (SOL) +2.8% – holding #7.
3. Hyperliquid (HYPE) +4.1% – climbing to #9, 4. Cash Cat (CASHCAT) +5.5% – rising to #167.
5. Pump.fun (PUMP) +6.0% – up at #47. We're watching the market together 🚀 and our community stays ahead 📈.
$ONG, $AMP, $TAC
1. Bitcoin (BTC) +3.2% – still #1, 2. Solana (SOL) +2.8% – holding #7.
3. Hyperliquid (HYPE) +4.1% – climbing to #9, 4. Cash Cat (CASHCAT) +5.5% – rising to #167.
5. Pump.fun (PUMP) +6.0% – up at #47. We're watching the market together 🚀 and our community stays ahead 📈.
$ONG , $AMP , $TAC
3. Hyperliquid (HYPE) +4.1% – climbing to #9, 4. Cash Cat (CASHCAT) +5.5% – rising to #167.
5. Pump.fun (PUMP) +6.0% – up at #47. We're watching the market together 🚀 and our community stays ahead 📈.
$ONG , $AMP , $TAC
139

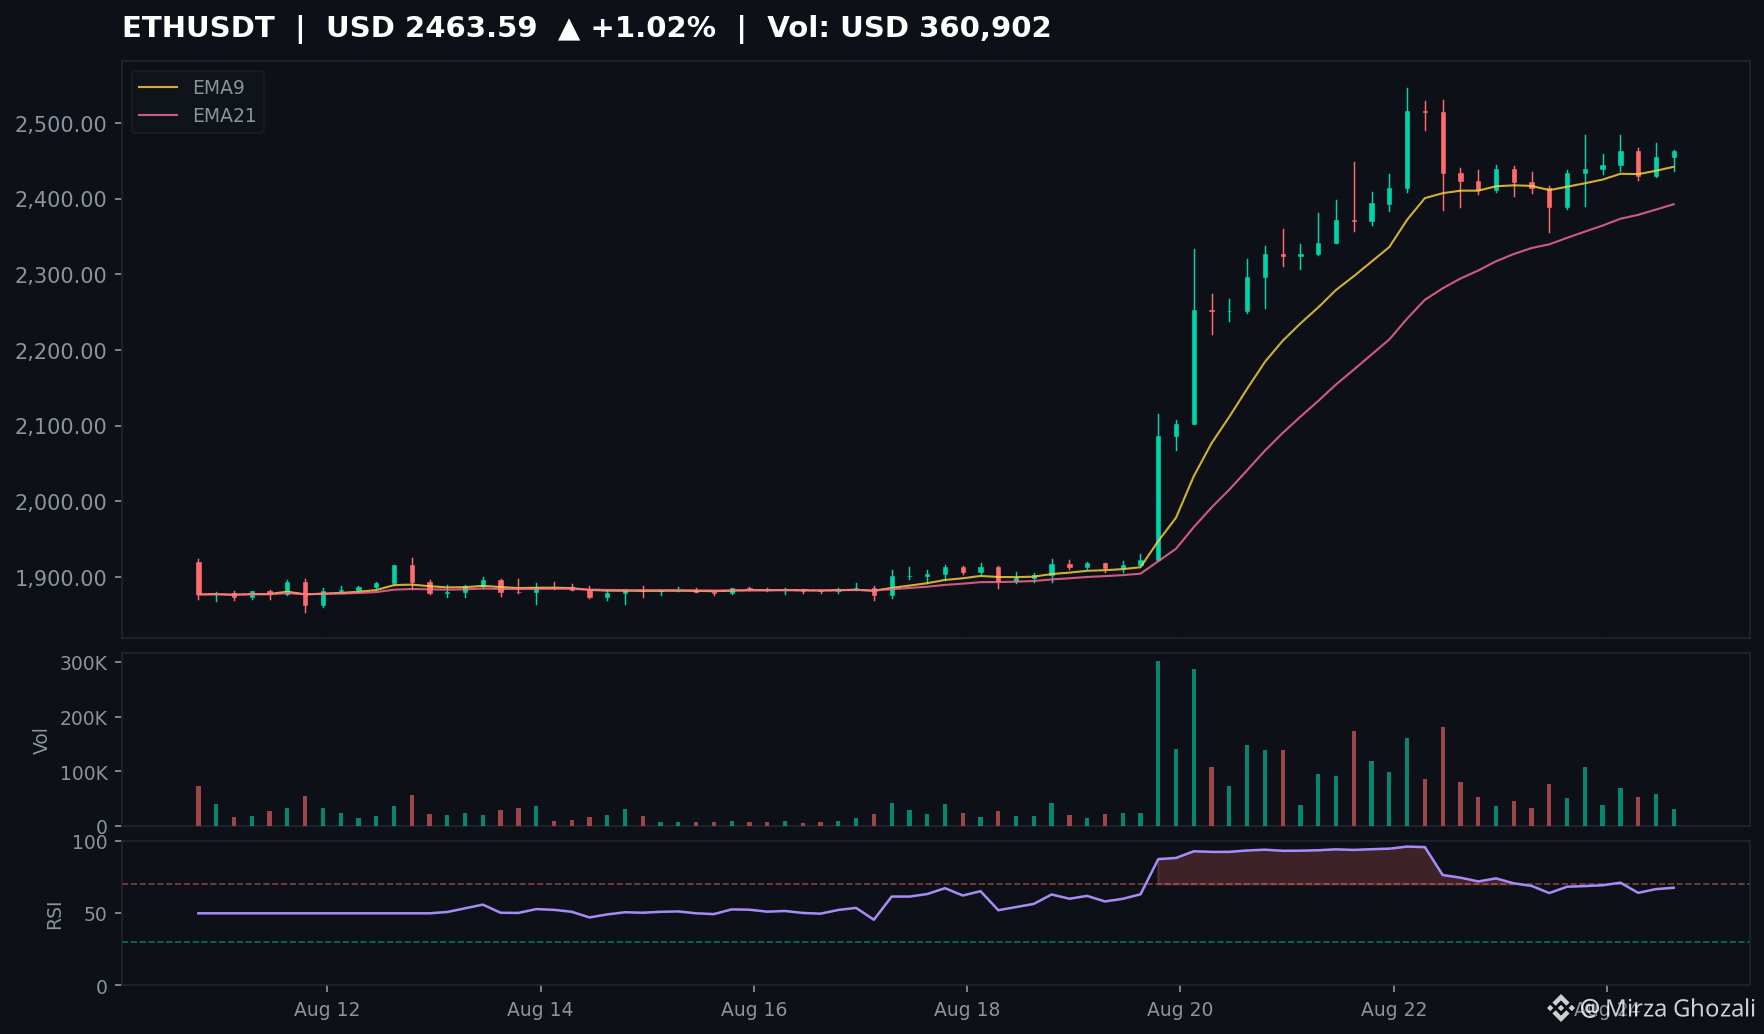
ETH 4h candle analysis:
🔍 Key patterns on the 4h:
• Candle #44: Long-legged doji at $2,484 resistance — tiny body (4.9), massive wicks both sides (45 up / 44 down). Classic indecision after 5-candle rally.
• Candle #47: Bearish rejection at $2,467 — 33 body, closed near low. Buyers absorbed.
• Candle #49: Hammer-ish bullish candle — 7.7 body, 18.3 lower wick. Buyers stepped in at $2,436 support.
📊 Structure:
EMA9 ($2,450) > EMA21 ($2,440) — bullish alignment intact
RSI 58 — neutral, room to run
Volume drying up on pullback — healthy
🎯 Levels:
Resistance: $2,484 (doji high) → $2,500 psych
Support: $2,436 (hammer wick) → $2,403 (swing low)
Bias: Bullish above $2,436. Break of $2,484 opens $2,550+. Loss of $2,403 invalidates.
$ETH #Ethereum #TechnicalAnalysis
ETH 4h candle analysis:
🔍 Key patterns on the 4h:
• Candle #44: Long-legged doji at $2,484 resistance — tiny body (4.9), massive wicks both sides (45 up / 44 down). Classic indecision after 5-candle rally.
• Candle #47: Bearish rejection at $2,467 — 33 body, closed near low. Buyers absorbed.
• Candle #49: Hammer-ish bullish candle — 7.7 body, 18.3 lower wick. Buyers stepped in at $2,436 support.
📊 Structure:
EMA9 ($2,450) > EMA21 ($2,440) — bullish alignment intact
RSI 58 — neutral, room to run
Volume drying up on pullback — healthy
🎯 Levels:
Resistance: $2,484 (doji high) → $2,500 psych
Support: $2,436 (hammer wick) → $2,403 (swing low)
Bias: Bullish above $2,436. Break of $2,484 opens $2,550+. Loss of $2,403 invalidates.
$ETH #Ethereum #TechnicalAnalysis
🔍 Key patterns on the 4h:
• Candle #44: Long-legged doji at $2,484 resistance — tiny body (4.9), massive wicks both sides (45 up / 44 down). Classic indecision after 5-candle rally.
• Candle #47: Bearish rejection at $2,467 — 33 body, closed near low. Buyers absorbed.
• Candle #49: Hammer-ish bullish candle — 7.7 body, 18.3 lower wick. Buyers stepped in at $2,436 support.
📊 Structure:
EMA9 ($2,450) > EMA21 ($2,440) — bullish alignment intact
RSI 58 — neutral, room to run
Volume drying up on pullback — healthy
🎯 Levels:
Resistance: $2,484 (doji high) → $2,500 psych
Support: $2,436 (hammer wick) → $2,403 (swing low)
Bias: Bullish above $2,436. Break of $2,484 opens $2,550+. Loss of $2,403 invalidates.
$ETH #Ethereum #TechnicalAnalysis
64

·
--
If you only see this 24h +5.98% bullish candle from $ONDO , it’s easy to draw two conclusions: either the RWA season in altcoins is starting, or it’s just an oversold rebound. But both of these miss one layer—$ONDO is currently ranked #47 by market cap, meaning the capital hasn’t started discussing it like a macro asset with the kind of “debt ceiling” narrative. It’s still being priced within the crypto framework. Compared with its ATH, it’s down 82.69%—it looks more like a scar than a spring.
Flatten the picture over 30 days: $ONDO fell from $0.41 to $0.32 and then rebounded to $0.37. After trading volume shrank to $40.18M on August 16, starting on day 20 the daily turnover began to expand continuously. Today at $228M, it’s five times the volume in the low-volume zone. The structure is a bit like DeFi blue chips near the end of a cycle: when it can’t fall anymore, the smart money starts renegotiating its cash-flow narrative.
But what’s most easy to misread is the nature of this rally. The RWA logic for $ONDO suggests it functions more like a “allocation token.” Large capital entries aren’t chasing a 24h price move; they’re positioning for its duration value under a certain interest-rate environment. So the bullish crowd is watching the progress of the BlackRock line, while the bearish crowd is also watching the same thing—just believing the long-term positive outlook has already been priced in ahead of time by a $1.80B market cap.
Next, you only need to watch one number: whether daily trading value can stand continuously above $150M for three straight days in the $0.37–$0.38 area. If it holds, the bulls’ turnover logic holds up. If it spikes on low volume and then pulls back, the bears’ high-level distribution speculation will also have data to support it. Same number, two readings—check the results after three days.
If you only see this 24h +5.98% bullish candle from $ONDO , it’s easy to draw two conclusions: either the RWA season in altcoins is starting, or it’s just an oversold rebound. But both of these miss one layer—$ONDO is currently ranked #47 by market cap, meaning the capital hasn’t started discussing it like a macro asset with the kind of “debt ceiling” narrative. It’s still being priced within the crypto framework. Compared with its ATH, it’s down 82.69%—it looks more like a scar than a spring.
Flatten the picture over 30 days: $ONDO fell from $0.41 to $0.32 and then rebounded to $0.37. After trading volume shrank to $40.18M on August 16, starting on day 20 the daily turnover began to expand continuously. Today at $228M, it’s five times the volume in the low-volume zone. The structure is a bit like DeFi blue chips near the end of a cycle: when it can’t fall anymore, the smart money starts renegotiating its cash-flow narrative.
But what’s most easy to misread is the nature of this rally. The RWA logic for $ONDO suggests it functions more like a “allocation token.” Large capital entries aren’t chasing a 24h price move; they’re positioning for its duration value under a certain interest-rate environment. So the bullish crowd is watching the progress of the BlackRock line, while the bearish crowd is also watching the same thing—just believing the long-term positive outlook has already been priced in ahead of time by a $1.80B market cap.
Next, you only need to watch one number: whether daily trading value can stand continuously above $150M for three straight days in the $0.37–$0.38 area. If it holds, the bulls’ turnover logic holds up. If it spikes on low volume and then pulls back, the bears’ high-level distribution speculation will also have data to support it. Same number, two readings—check the results after three days.
Flatten the picture over 30 days: $ONDO fell from $0.41 to $0.32 and then rebounded to $0.37. After trading volume shrank to $40.18M on August 16, starting on day 20 the daily turnover began to expand continuously. Today at $228M, it’s five times the volume in the low-volume zone. The structure is a bit like DeFi blue chips near the end of a cycle: when it can’t fall anymore, the smart money starts renegotiating its cash-flow narrative.
But what’s most easy to misread is the nature of this rally. The RWA logic for $ONDO suggests it functions more like a “allocation token.” Large capital entries aren’t chasing a 24h price move; they’re positioning for its duration value under a certain interest-rate environment. So the bullish crowd is watching the progress of the BlackRock line, while the bearish crowd is also watching the same thing—just believing the long-term positive outlook has already been priced in ahead of time by a $1.80B market cap.
Next, you only need to watch one number: whether daily trading value can stand continuously above $150M for three straight days in the $0.37–$0.38 area. If it holds, the bulls’ turnover logic holds up. If it spikes on low volume and then pulls back, the bears’ high-level distribution speculation will also have data to support it. Same number, two readings—check the results after three days.
67

·
--
Bullish
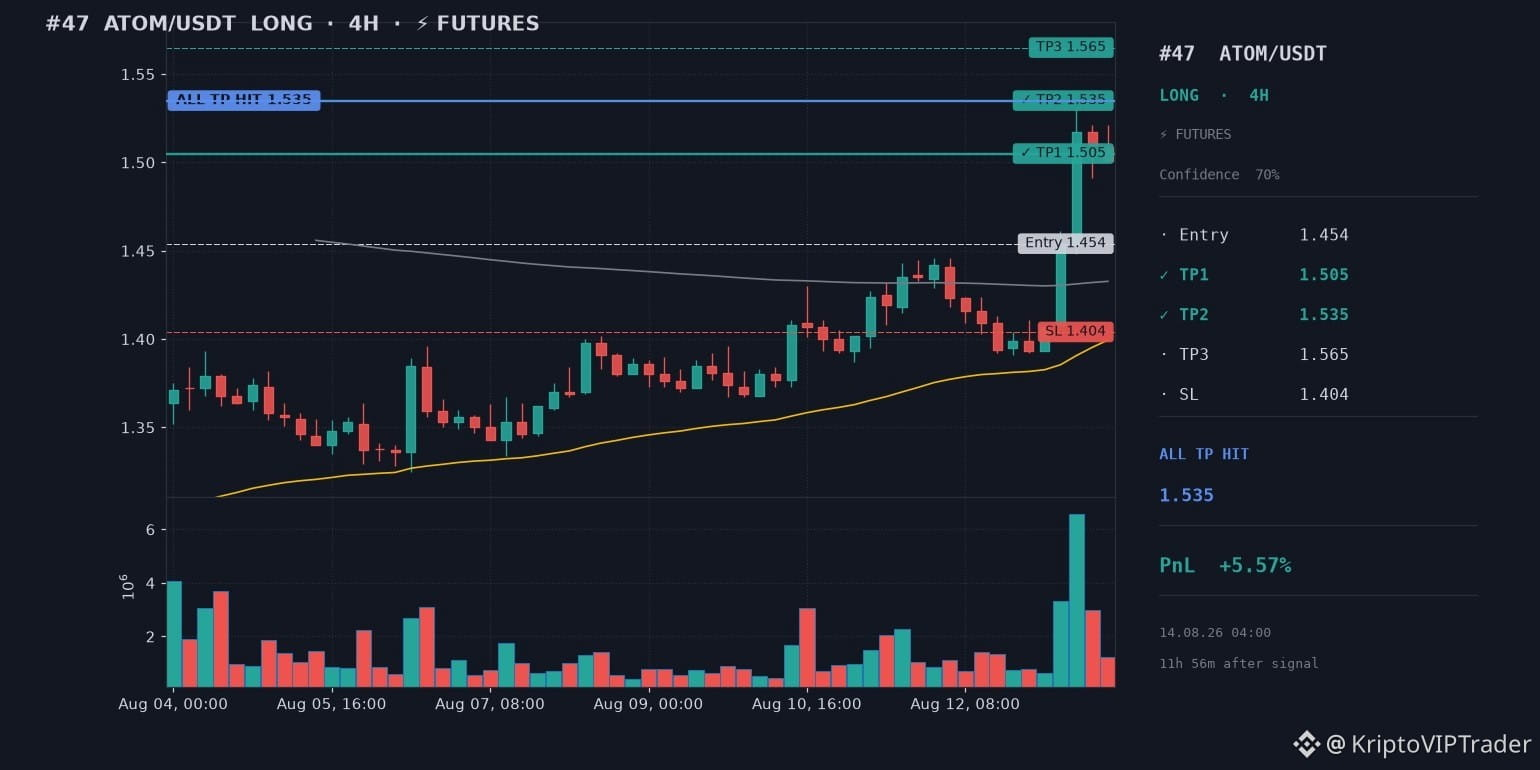
✅ TP2 HIT — TARGET SECURED — $ATOM
↩️ #47
🟢 LONG 🐂 · 4H
📊 Entry: 1.454 → Exit: 1.535
📈 Profit: +5.57%
⏱ 14.08.26 04:00 · 11h 56m after signal
📤 Published to Square:
[First Post](https://app.binance.com/uni-qr/cpos/355258773699937?r=OSVK1NAK&l=ru)
✅ TP2 HIT — TARGET SECURED — $ATOM
↩️ #47
🟢 LONG 🐂 · 4H
📊 Entry: 1.454 → Exit: 1.535
📈 Profit: +5.57%
⏱ 14.08.26 04:00 · 11h 56m after signal
📤 Published to Square:
First Post
↩️ #47
🟢 LONG 🐂 · 4H
📊 Entry: 1.454 → Exit: 1.535
📈 Profit: +5.57%
⏱ 14.08.26 04:00 · 11h 56m after signal
📤 Published to Square:
First Post
KriptoVIPTrader
·
--
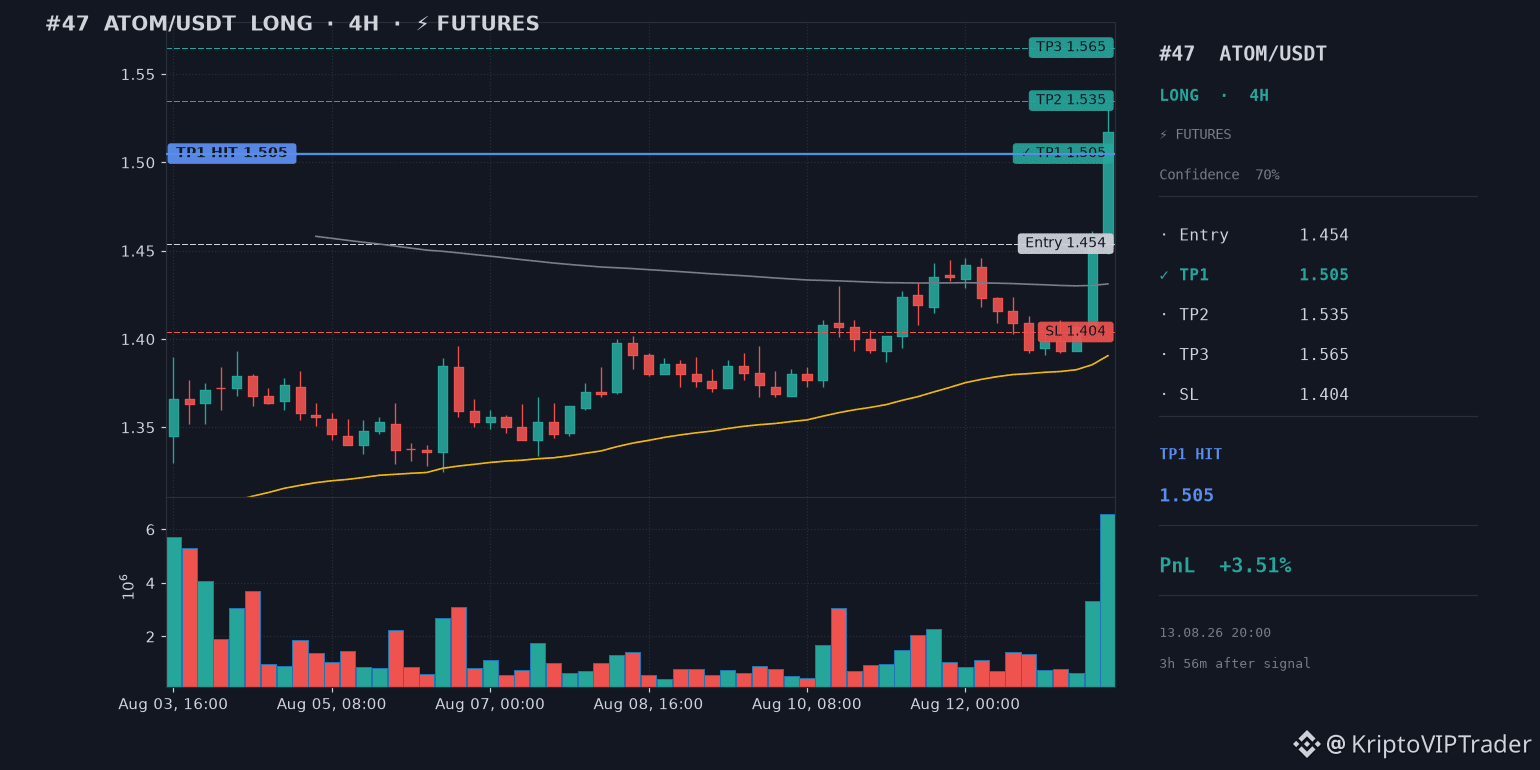
🎯 TP1 REACHED — $ATOM
↩️ #47 · 13.08.26 16:02
🟢 LONG 🐂 · 4H
📊 Entry: 1.454 → TP1: 1.505
📈 Profit: +3.51%
⏱ 13.08.26 20:00 · 3h 56m after signal
Trade still running — 2 target(s) left.
Consider securing part of the position and moving the stop to entry.
↩️ Original post:
First Signal Post
↩️ #47 · 13.08.26 16:02
🟢 LONG 🐂 · 4H
📊 Entry: 1.454 → TP1: 1.505
📈 Profit: +3.51%
⏱ 13.08.26 20:00 · 3h 56m after signal
Trade still running — 2 target(s) left.
Consider securing part of the position and moving the stop to entry.
↩️ Original post:
First Signal Post
143
🎯 TP1 REACHED — $ATOM
{future}(ATOMUSDT)
↩️ #47 · 13.08.26 16:02
🟢 LONG 🐂 · 4H
📊 Entry: 1.454 → TP1: 1.505
📈 Profit: +3.51%
⏱ 13.08.26 20:00 · 3h 56m after signal
Trade still running — 2 target(s) left.
Consider securing part of the position and moving the stop to entry.
↩️ Original post:
[First Signal Post](https://app.binance.com/uni-qr/cpos/355258773699937?r=OSVK1NAK&l=ru)
🎯 TP1 REACHED — $ATOM
↩️ #47 · 13.08.26 16:02
🟢 LONG 🐂 · 4H
📊 Entry: 1.454 → TP1: 1.505
📈 Profit: +3.51%
⏱ 13.08.26 20:00 · 3h 56m after signal
Trade still running — 2 target(s) left.
Consider securing part of the position and moving the stop to entry.
↩️ Original post:
First Signal Post
↩️ #47 · 13.08.26 16:02
🟢 LONG 🐂 · 4H
📊 Entry: 1.454 → TP1: 1.505
📈 Profit: +3.51%
⏱ 13.08.26 20:00 · 3h 56m after signal
Trade still running — 2 target(s) left.
Consider securing part of the position and moving the stop to entry.
↩️ Original post:
First Signal Post
1
71
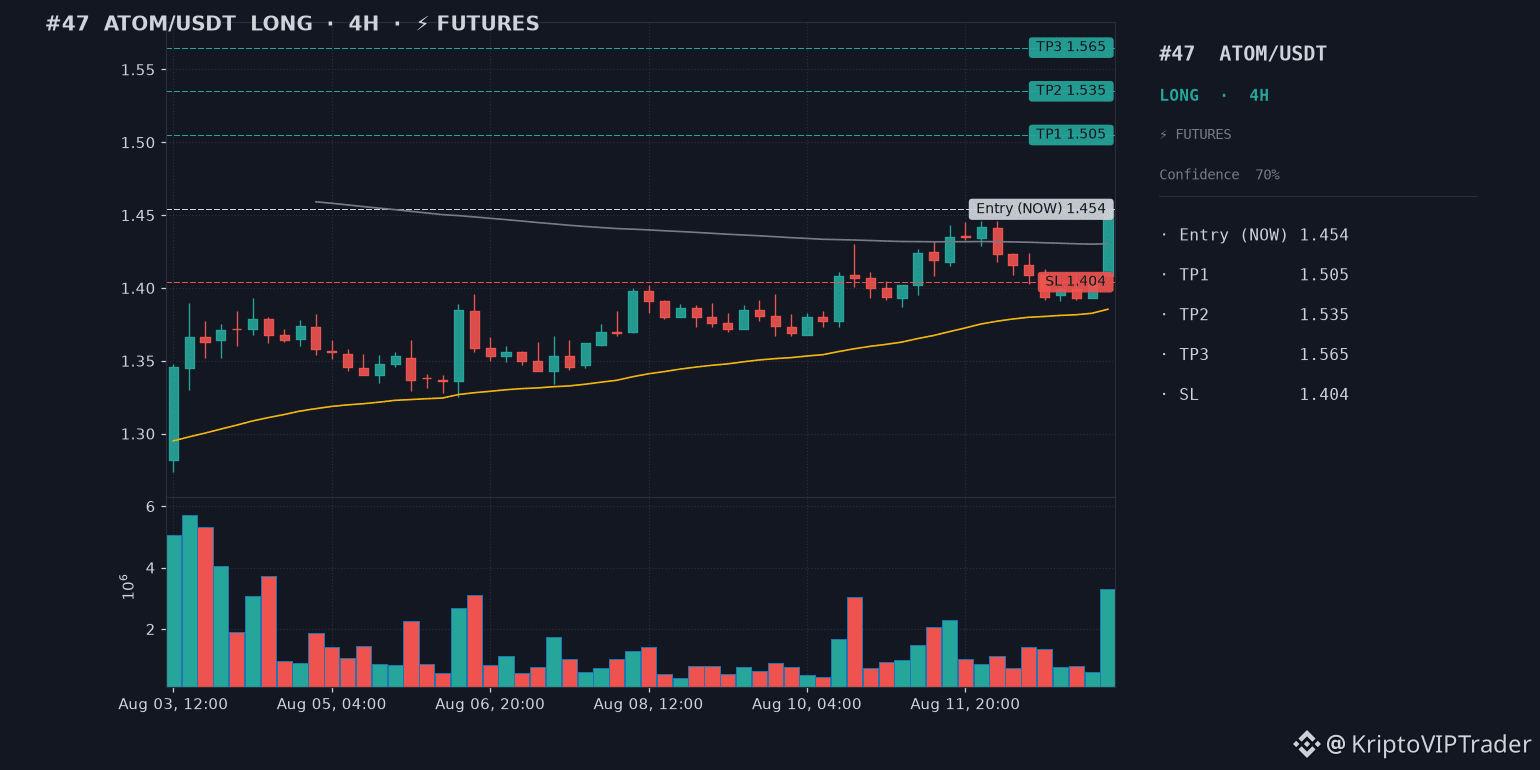
🔖 #47 · 13.08.26 16:02
🟢 LONG 🐂 | $ATOM 💰 | ⏱ Candle: 4H · ⚡️ FUTURES
❗️ Duration: up to 5 days
📊 Entry: 1.454 (Enter NOW)
🎯 TP1: 1.505 (+3.5%)
🎯 TP2: 1.535 (+5.6%)
🎯 TP3: 1.565 (+7.6%) — wait for additional profit
🛡 SL: 1.404 (-3.4%)
⚖️ R/R 1:1.0-2.2
⚡️ Leverage: 3x-5x (isolated)
🧠 Breakout above 1.446 on 3.3M volume, RSI 66, ADX 31, price above EMA200/VWAP
⚠️ Max 5% position · Max 10% stop-loss risk
Not financial advice — personal analysis only.
#ATOMUSDT #long #futures
🔖 #47 · 13.08.26 16:02
🟢 LONG 🐂 | $ATOM 💰 | ⏱ Candle: 4H · ⚡️ FUTURES
❗️ Duration: up to 5 days
📊 Entry: 1.454 (Enter NOW)
🎯 TP1: 1.505 (+3.5%)
🎯 TP2: 1.535 (+5.6%)
🎯 TP3: 1.565 (+7.6%) — wait for additional profit
🛡 SL: 1.404 (-3.4%)
⚖️ R/R 1:1.0-2.2
⚡️ Leverage: 3x-5x (isolated)
🧠 Breakout above 1.446 on 3.3M volume, RSI 66, ADX 31, price above EMA200/VWAP
⚠️ Max 5% position · Max 10% stop-loss risk
Not financial advice — personal analysis only.
#ATOMUSDT #long #futures
🟢 LONG 🐂 | $ATOM 💰 | ⏱ Candle: 4H · ⚡️ FUTURES
❗️ Duration: up to 5 days
📊 Entry: 1.454 (Enter NOW)
🎯 TP1: 1.505 (+3.5%)
🎯 TP2: 1.535 (+5.6%)
🎯 TP3: 1.565 (+7.6%) — wait for additional profit
🛡 SL: 1.404 (-3.4%)
⚖️ R/R 1:1.0-2.2
⚡️ Leverage: 3x-5x (isolated)
🧠 Breakout above 1.446 on 3.3M volume, RSI 66, ADX 31, price above EMA200/VWAP
⚠️ Max 5% position · Max 10% stop-loss risk
Not financial advice — personal analysis only.
#ATOMUSDT #long #futures
1
1
58
Log in to explore more content
Join global crypto users on Binance Square
⚡️ Get latest and useful information about crypto.
💬 Trusted by the world’s largest crypto exchange.
👍 Discover real insights from verified creators.
Email / Phone number
Trending Topics
1
#CPIWatch
86M views
498,281 Discussing
2
#CryptoSectorsFallSecondDay
2,857 views
151 Discussing
3
#BitcoinGoldenCrossConfirms
5,346 views
198 Discussing
4
#AppleRises3.56%AfterIPhoneDuoLaunch
1,061 views
38 Discussing
5
#US10YTreasuryYieldHitsHighestSinceOct2023
1,348 views
42 Discussing
6
#Top7AssetsHold92.1%OfCryptoTop100
3,475 views
97 Discussing
7
#SaudiCrudeOutputHitsLowestSince1990
3,526 views
87 Discussing
8
#IranBlocksStraitOfHormuz
5,126 views
119 Discussing
9
#伊朗封锁霍尔木兹海峡
3,417 views
35 Discussing
10
#USAugustPPIRisesLessThanExpected
94,064 views
1,144 Discussing