
#19
19
16,869 views
119 Discussing
Hot
Latest

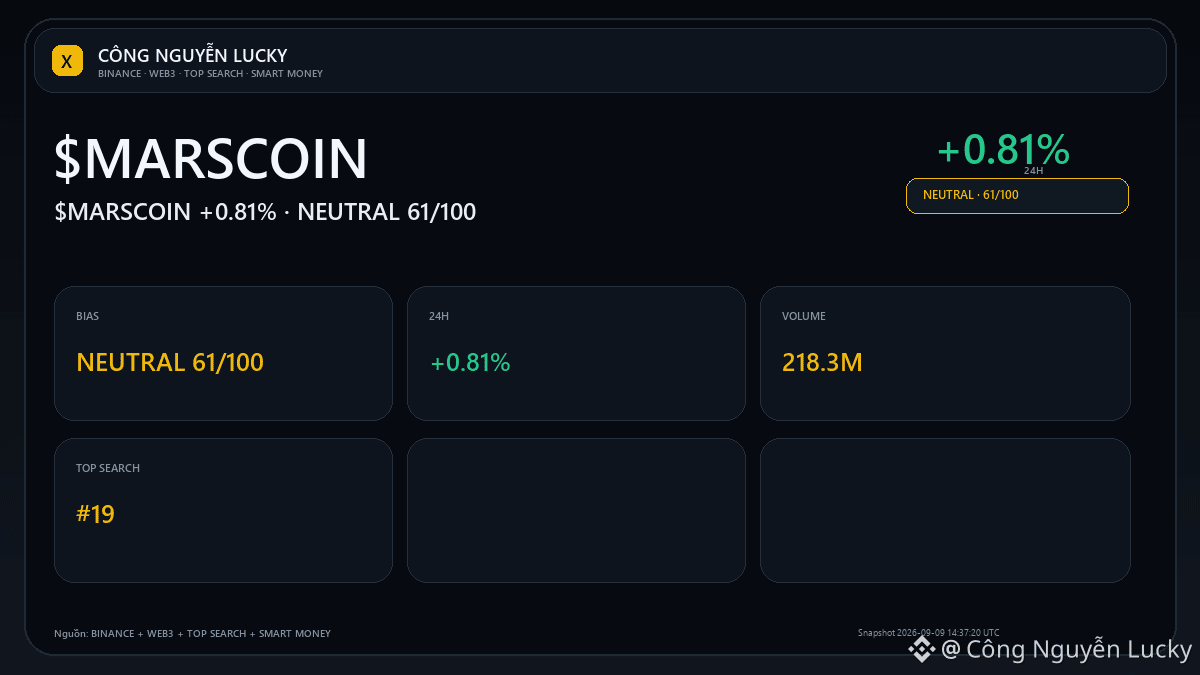
$MARSCOIN added to my watchlist because the data is changing, not because I want to force out a signal.
• 0.13146 · 24h +0.81% · volume ~218.3M USDT · 3,637,129 trades.
Conditions to increase conviction: Breaking above 0.14948 with expanded volume would make the continuation scenario more credible.
What makes me ignore it: Failing to hold the high and dropping back below the midpoint 0.13346 will make the cooldown scenario more evident.
📌 LONG/SHORT perspective: **NEUTRAL · UNCLEAR · 61/100**.
Main basis: Smart Money records net outflows.
Additional confirmation when: price, volume, and fund flows all pick the same direction before raising confidence.
Invalidate/cancel the direction if: you don’t force a LONG/SHORT choice while the data layers are still conflicting.
💬 If you could choose only one piece of data to track $MARSCOIN over the next few hours, what would you pick?
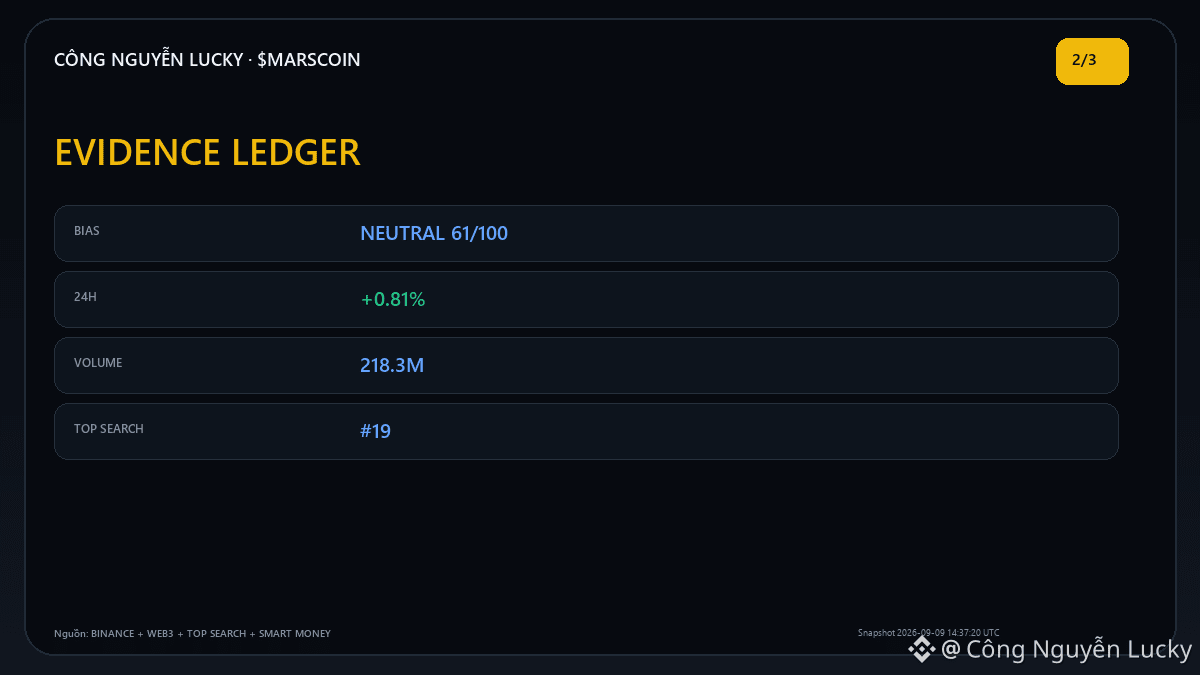
🔎 **Evidence check — NEUTRAL 61/100**
• Price 0.13146; 24h +0.81%; volume 218.3M.
• Binance Top Search #19.
🧭 **Key levels to watch:** confirm: wait for price, volume, and fund flows to align on the same direction before raising confidence · invalidate: don’t force LONG/SHORT when the data layers are still inconsistent
Reference sources: Binance Futures Market + Binance Web3 Trending + Binance Top Search + Binance Social Hype + Binance Smart Money Inflow · snapshot 2026-09-09 14:37:20 UTC
⚠️ Market analysis is for reference only, not a commitment to profits. Everyone should do their own research (DYOR), manage risk themselves, and take responsibility for their trading decisions.
$MARSCOIN
$MARSCOIN added to my watchlist because the data is changing, not because I want to force out a signal.
• 0.13146 · 24h +0.81% · volume ~218.3M USDT · 3,637,129 trades.
Conditions to increase conviction: Breaking above 0.14948 with expanded volume would make the continuation scenario more credible.
What makes me ignore it: Failing to hold the high and dropping back below the midpoint 0.13346 will make the cooldown scenario more evident.
📌 LONG/SHORT perspective: **NEUTRAL · UNCLEAR · 61/100**.
Main basis: Smart Money records net outflows.
Additional confirmation when: price, volume, and fund flows all pick the same direction before raising confidence.
Invalidate/cancel the direction if: you don’t force a LONG/SHORT choice while the data layers are still conflicting.
💬 If you could choose only one piece of data to track $MARSCOIN over the next few hours, what would you pick?
🔎 **Evidence check — NEUTRAL 61/100**
• Price 0.13146; 24h +0.81%; volume 218.3M.
• Binance Top Search #19.
🧭 **Key levels to watch:** confirm: wait for price, volume, and fund flows to align on the same direction before raising confidence · invalidate: don’t force LONG/SHORT when the data layers are still inconsistent
Reference sources: Binance Futures Market + Binance Web3 Trending + Binance Top Search + Binance Social Hype + Binance Smart Money Inflow · snapshot 2026-09-09 14:37:20 UTC
⚠️ Market analysis is for reference only, not a commitment to profits. Everyone should do their own research (DYOR), manage risk themselves, and take responsibility for their trading decisions.
$MARSCOIN
• 0.13146 · 24h +0.81% · volume ~218.3M USDT · 3,637,129 trades.
Conditions to increase conviction: Breaking above 0.14948 with expanded volume would make the continuation scenario more credible.
What makes me ignore it: Failing to hold the high and dropping back below the midpoint 0.13346 will make the cooldown scenario more evident.
📌 LONG/SHORT perspective: **NEUTRAL · UNCLEAR · 61/100**.
Main basis: Smart Money records net outflows.
Additional confirmation when: price, volume, and fund flows all pick the same direction before raising confidence.
Invalidate/cancel the direction if: you don’t force a LONG/SHORT choice while the data layers are still conflicting.
💬 If you could choose only one piece of data to track $MARSCOIN over the next few hours, what would you pick?
🔎 **Evidence check — NEUTRAL 61/100**
• Price 0.13146; 24h +0.81%; volume 218.3M.
• Binance Top Search #19.
🧭 **Key levels to watch:** confirm: wait for price, volume, and fund flows to align on the same direction before raising confidence · invalidate: don’t force LONG/SHORT when the data layers are still inconsistent
Reference sources: Binance Futures Market + Binance Web3 Trending + Binance Top Search + Binance Social Hype + Binance Smart Money Inflow · snapshot 2026-09-09 14:37:20 UTC
⚠️ Market analysis is for reference only, not a commitment to profits. Everyone should do their own research (DYOR), manage risk themselves, and take responsibility for their trading decisions.
$MARSCOIN

17

·
--
DASH—this move is pretty decisive. In just 15m it pulled up 2%+, and the volume also caught up, at 1.6x the normal level. The most important part, though, is the OI side—OI has been adding for several consecutive cycles, and the notional change reached the whole pool’s #19 level, with an abnormal percentile of 97.4%. At a position like this, combined with the price breakout, it’s clearly leverage-long new entries pushing the market—not some sort of short covering inflating it.
The active trading spread is down 27.6%, and the buy/sell ratio is 1.76—directionality is quite consistent.
But honestly, while it’s exciting to see price rising and OI climbing together, it also means potential liquidation/trampling risk is building up. If the trend breaks, the chain liquidation of long positions could feel pretty brutal. Right now it’s a classic setup of “trade with the trend, but keep a string on your mind at all times.”
$DASH
DASH—this move is pretty decisive. In just 15m it pulled up 2%+, and the volume also caught up, at 1.6x the normal level. The most important part, though, is the OI side—OI has been adding for several consecutive cycles, and the notional change reached the whole pool’s #19 level, with an abnormal percentile of 97.4%. At a position like this, combined with the price breakout, it’s clearly leverage-long new entries pushing the market—not some sort of short covering inflating it.
The active trading spread is down 27.6%, and the buy/sell ratio is 1.76—directionality is quite consistent.
But honestly, while it’s exciting to see price rising and OI climbing together, it also means potential liquidation/trampling risk is building up. If the trend breaks, the chain liquidation of long positions could feel pretty brutal. Right now it’s a classic setup of “trade with the trend, but keep a string on your mind at all times.”
$DASH
The active trading spread is down 27.6%, and the buy/sell ratio is 1.76—directionality is quite consistent.
But honestly, while it’s exciting to see price rising and OI climbing together, it also means potential liquidation/trampling risk is building up. If the trend breaks, the chain liquidation of long positions could feel pretty brutal. Right now it’s a classic setup of “trade with the trend, but keep a string on your mind at all times.”
$DASH
141

·
--
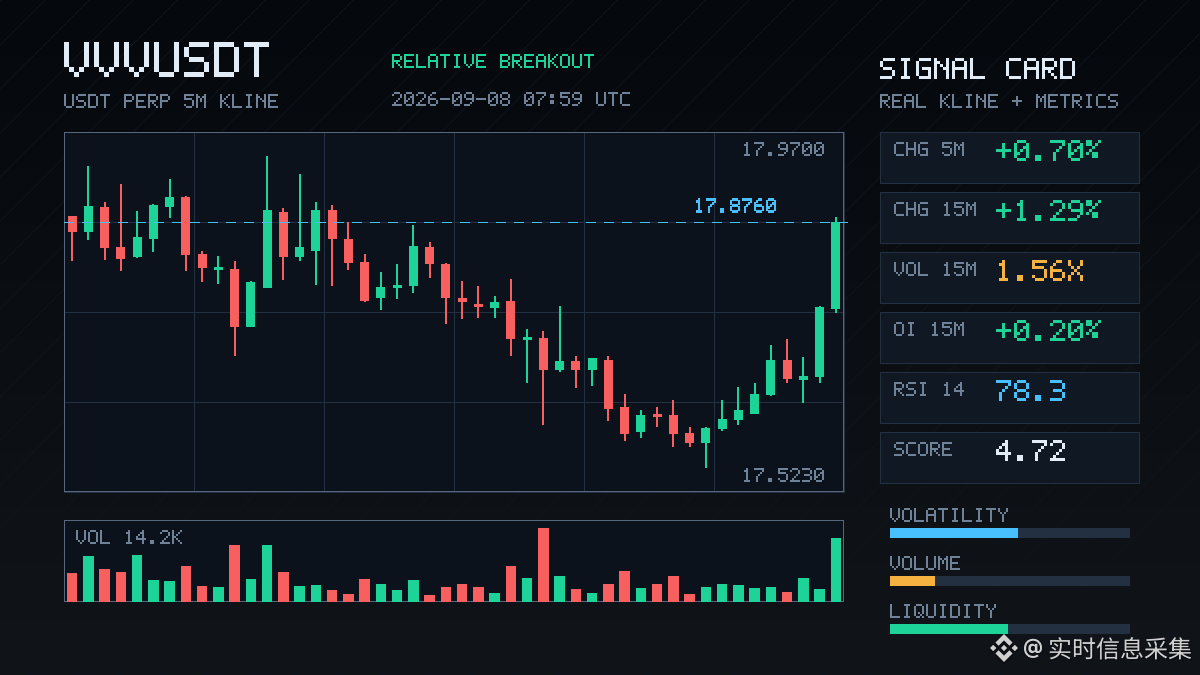
VVV This move is kind of interesting. On the 15-minute timeframe it jumped directly +1.29%, and it even pierced through the highs of 20 five-minute candles. Volume synchronized and expanded to 1.56x—the order book is alive.
The key is that OI is rising along with it: the 15-minute notional change is +246K (+1.45%), and the 1-hour dimension is also adding 335K. This kind of rise isn’t the fake kind like short covering. It looks more like newly added leveraged longs are stepping in to take the baton. The funding rate is also in the higher percentile recently, and market sentiment is rather hot.
On the “abnormal pool” leaderboard it ranks 6th; notional change ranks up to #19. Over the past 24 hours it did $29 million in volume. Liquidity-wise there’s no problem—active buy/sell ratio is 1.87, and the bid side really is dominant. It doesn’t look like that kind of two-sided whipsaw.
But honestly, the OI percentile is already at 92.7%. You’ll need to judge for yourself whether chasing price on the short-term offers a good cost-performance. Direction-wise it’s still bullish, no doubt. However, once you’re in the high-leverage zone, volatility will be amplified—position management matters more than direction judgment.
VVV This move is kind of interesting. On the 15-minute timeframe it jumped directly +1.29%, and it even pierced through the highs of 20 five-minute candles. Volume synchronized and expanded to 1.56x—the order book is alive.
The key is that OI is rising along with it: the 15-minute notional change is +246K (+1.45%), and the 1-hour dimension is also adding 335K. This kind of rise isn’t the fake kind like short covering. It looks more like newly added leveraged longs are stepping in to take the baton. The funding rate is also in the higher percentile recently, and market sentiment is rather hot.
On the “abnormal pool” leaderboard it ranks 6th; notional change ranks up to #19. Over the past 24 hours it did $29 million in volume. Liquidity-wise there’s no problem—active buy/sell ratio is 1.87, and the bid side really is dominant. It doesn’t look like that kind of two-sided whipsaw.
But honestly, the OI percentile is already at 92.7%. You’ll need to judge for yourself whether chasing price on the short-term offers a good cost-performance. Direction-wise it’s still bullish, no doubt. However, once you’re in the high-leverage zone, volatility will be amplified—position management matters more than direction judgment.
The key is that OI is rising along with it: the 15-minute notional change is +246K (+1.45%), and the 1-hour dimension is also adding 335K. This kind of rise isn’t the fake kind like short covering. It looks more like newly added leveraged longs are stepping in to take the baton. The funding rate is also in the higher percentile recently, and market sentiment is rather hot.
On the “abnormal pool” leaderboard it ranks 6th; notional change ranks up to #19. Over the past 24 hours it did $29 million in volume. Liquidity-wise there’s no problem—active buy/sell ratio is 1.87, and the bid side really is dominant. It doesn’t look like that kind of two-sided whipsaw.
But honestly, the OI percentile is already at 92.7%. You’ll need to judge for yourself whether chasing price on the short-term offers a good cost-performance. Direction-wise it’s still bullish, no doubt. However, once you’re in the high-leverage zone, volatility will be amplified—position management matters more than direction judgment.
9

·
--
TST is interesting this time: it pulled up 2.16% in 15 minutes, directly breaking above the upper edge of the 20 five-minute candlesticks. Volume surged to 3.53x, and volatility Z reached 3.64, so this is not the kind of sluggish rise that just grinds higher.
More importantly — OI is rising in sync. The 15-minute notional change is +2.65%, and the 1-hour is also +3.95%. This is genuine new leveraged long positions entering the market, not a fake rally from short covering. The funding rate percentile has already reached 88.7%, and the overall pool anomaly ranking is #19, showing that this symbol is indeed under the spotlight today.
Active buy-side participation accounts for 30.6%, and the buy/sell ratio is already at 1.88, so the direction is very clear. Chips and capital are pushing together, and the short-term momentum is sufficient.
But honestly, with funding rates this high, it also means the cost for the next wave of buyers is rising. If you're chasing it, think it through yourself. Don't look at a limit-up move and shout about 10,000 points; what matters is the rhythm, not faith. $TST
TST is interesting this time: it pulled up 2.16% in 15 minutes, directly breaking above the upper edge of the 20 five-minute candlesticks. Volume surged to 3.53x, and volatility Z reached 3.64, so this is not the kind of sluggish rise that just grinds higher.
More importantly — OI is rising in sync. The 15-minute notional change is +2.65%, and the 1-hour is also +3.95%. This is genuine new leveraged long positions entering the market, not a fake rally from short covering. The funding rate percentile has already reached 88.7%, and the overall pool anomaly ranking is #19, showing that this symbol is indeed under the spotlight today.
Active buy-side participation accounts for 30.6%, and the buy/sell ratio is already at 1.88, so the direction is very clear. Chips and capital are pushing together, and the short-term momentum is sufficient.
But honestly, with funding rates this high, it also means the cost for the next wave of buyers is rising. If you're chasing it, think it through yourself. Don't look at a limit-up move and shout about 10,000 points; what matters is the rhythm, not faith. $TST
More importantly — OI is rising in sync. The 15-minute notional change is +2.65%, and the 1-hour is also +3.95%. This is genuine new leveraged long positions entering the market, not a fake rally from short covering. The funding rate percentile has already reached 88.7%, and the overall pool anomaly ranking is #19, showing that this symbol is indeed under the spotlight today.
Active buy-side participation accounts for 30.6%, and the buy/sell ratio is already at 1.88, so the direction is very clear. Chips and capital are pushing together, and the short-term momentum is sufficient.
But honestly, with funding rates this high, it also means the cost for the next wave of buyers is rising. If you're chasing it, think it through yourself. Don't look at a limit-up move and shout about 10,000 points; what matters is the rhythm, not faith. $TST
125
·
--
$BROCCOLI714 This drop feels pretty uncomfortable.
On the 15-minute chart, it sold off sharply with a surge in volume, nearly 4x normal levels. Active selling pressure was heavy too, and the buy/sell ratio fell to 0.70. This kind of one-sided move doesn’t look like retail sentiment.
What’s even more noteworthy is that open interest in the contracts is continuously shrinking, declining on both the 15-minute and 1-hour timeframes. Long positions are exiting, or more precisely, being forced out by stop-losses, as leverage gets washed out. Funding rates had previously piled up at elevated levels, and now this looks more like the closing phase of a long-side deleveraging move.
The abnormal OI percentile is still on the board at 92%, ranked #19, and has stayed there for several consecutive cycles.
In short:
Longs are deleveraging, price is drifting lower, and volume is expanding.
This is not a panic crash, but pressure caused by shrinking positions.
At this pace, some are cutting losses while others are buying the dip.
Do you think this is the end of the shakeout, or just the beginning?
$BROCCOLI714 This drop feels pretty uncomfortable.
On the 15-minute chart, it sold off sharply with a surge in volume, nearly 4x normal levels. Active selling pressure was heavy too, and the buy/sell ratio fell to 0.70. This kind of one-sided move doesn’t look like retail sentiment.
What’s even more noteworthy is that open interest in the contracts is continuously shrinking, declining on both the 15-minute and 1-hour timeframes. Long positions are exiting, or more precisely, being forced out by stop-losses, as leverage gets washed out. Funding rates had previously piled up at elevated levels, and now this looks more like the closing phase of a long-side deleveraging move.
The abnormal OI percentile is still on the board at 92%, ranked #19, and has stayed there for several consecutive cycles.
In short:
Longs are deleveraging, price is drifting lower, and volume is expanding.
This is not a panic crash, but pressure caused by shrinking positions.
At this pace, some are cutting losses while others are buying the dip.
Do you think this is the end of the shakeout, or just the beginning?
On the 15-minute chart, it sold off sharply with a surge in volume, nearly 4x normal levels. Active selling pressure was heavy too, and the buy/sell ratio fell to 0.70. This kind of one-sided move doesn’t look like retail sentiment.
What’s even more noteworthy is that open interest in the contracts is continuously shrinking, declining on both the 15-minute and 1-hour timeframes. Long positions are exiting, or more precisely, being forced out by stop-losses, as leverage gets washed out. Funding rates had previously piled up at elevated levels, and now this looks more like the closing phase of a long-side deleveraging move.
The abnormal OI percentile is still on the board at 92%, ranked #19, and has stayed there for several consecutive cycles.
In short:
Longs are deleveraging, price is drifting lower, and volume is expanding.
This is not a panic crash, but pressure caused by shrinking positions.
At this pace, some are cutting losses while others are buying the dip.
Do you think this is the end of the shakeout, or just the beginning?
114

·
--
$SNDKB The most awkward part is not that it rose 11.61%, but that spot trading has already pushed into the #19 volume ranking, while the market still carries a bit of a “someone is testing the waters” feel.
Spot 24-hour volume is $40.89M, with 155,958 trades. That tells you this wasn’t a move dragged up by just a few big orders.
The price climbed from $1545.85 to $1744.69, and the current price is still hovering around $1730.93, basically sticking close to the intraday high.
For a move like this, I’d first look at the structure.
If derivatives volume is surging dramatically, funding rates are getting overheated, and open interest is also climbing hard, then it’s probably sentiment getting ahead of itself.
But since it made the ranking today, I’m more inclined to think spot money lit up the heat first, and derivatives followed by amplifying the volatility.
Honestly, coins that get hot first in spot and only later get a boost from futures feel a bit more comfortable than those that are pushed up purely by leverage.
I spent the day revising drawings into three versions, and when I got home at night, Doudou was squatting on the keyboard. While I was shooing it away, I looked at this line and felt that $SNDKB isn’t a level that can’t be watched, but it’s not the kind you should chase blindly.
Because it has already used up a big chunk of its intraday range today.
The gap between the high and low is nearly 200 dollars, which means market sentiment is very heated. Anyone chasing it needs to be able to تحمل the volatility, otherwise one pullback can quickly break your mindset🥲
So my stance is clear: it’s strong, but I’m staying on the sidelines for now.
Unless derivatives volume doesn’t keep expanding absurdly, funding rates don’t suddenly spike too high, and open interest rises only gradually, this coin could easily go from “strong continuation” tomorrow to “the slower ones get punished.”
For coins on the ranking like this, whether you can buy in doesn’t just depend on the gain; it depends on who is carrying the rally afterward.
I could be wrong too, judge for yourself.$SNDKB #SNDKB #BinanceSquare
$SNDKB The most awkward part is not that it rose 11.61%, but that spot trading has already pushed into the #19 volume ranking, while the market still carries a bit of a “someone is testing the waters” feel.
Spot 24-hour volume is $40.89M, with 155,958 trades. That tells you this wasn’t a move dragged up by just a few big orders.
The price climbed from $1545.85 to $1744.69, and the current price is still hovering around $1730.93, basically sticking close to the intraday high.
For a move like this, I’d first look at the structure.
If derivatives volume is surging dramatically, funding rates are getting overheated, and open interest is also climbing hard, then it’s probably sentiment getting ahead of itself.
But since it made the ranking today, I’m more inclined to think spot money lit up the heat first, and derivatives followed by amplifying the volatility.
Honestly, coins that get hot first in spot and only later get a boost from futures feel a bit more comfortable than those that are pushed up purely by leverage.
I spent the day revising drawings into three versions, and when I got home at night, Doudou was squatting on the keyboard. While I was shooing it away, I looked at this line and felt that $SNDKB isn’t a level that can’t be watched, but it’s not the kind you should chase blindly.
Because it has already used up a big chunk of its intraday range today.
The gap between the high and low is nearly 200 dollars, which means market sentiment is very heated. Anyone chasing it needs to be able to تحمل the volatility, otherwise one pullback can quickly break your mindset🥲
So my stance is clear: it’s strong, but I’m staying on the sidelines for now.
Unless derivatives volume doesn’t keep expanding absurdly, funding rates don’t suddenly spike too high, and open interest rises only gradually, this coin could easily go from “strong continuation” tomorrow to “the slower ones get punished.”
For coins on the ranking like this, whether you can buy in doesn’t just depend on the gain; it depends on who is carrying the rally afterward.
I could be wrong too, judge for yourself.$SNDKB #SNDKB #BinanceSquare
Spot 24-hour volume is $40.89M, with 155,958 trades. That tells you this wasn’t a move dragged up by just a few big orders.
The price climbed from $1545.85 to $1744.69, and the current price is still hovering around $1730.93, basically sticking close to the intraday high.
For a move like this, I’d first look at the structure.
If derivatives volume is surging dramatically, funding rates are getting overheated, and open interest is also climbing hard, then it’s probably sentiment getting ahead of itself.
But since it made the ranking today, I’m more inclined to think spot money lit up the heat first, and derivatives followed by amplifying the volatility.
Honestly, coins that get hot first in spot and only later get a boost from futures feel a bit more comfortable than those that are pushed up purely by leverage.
I spent the day revising drawings into three versions, and when I got home at night, Doudou was squatting on the keyboard. While I was shooing it away, I looked at this line and felt that $SNDKB isn’t a level that can’t be watched, but it’s not the kind you should chase blindly.
Because it has already used up a big chunk of its intraday range today.
The gap between the high and low is nearly 200 dollars, which means market sentiment is very heated. Anyone chasing it needs to be able to تحمل the volatility, otherwise one pullback can quickly break your mindset🥲
So my stance is clear: it’s strong, but I’m staying on the sidelines for now.
Unless derivatives volume doesn’t keep expanding absurdly, funding rates don’t suddenly spike too high, and open interest rises only gradually, this coin could easily go from “strong continuation” tomorrow to “the slower ones get punished.”
For coins on the ranking like this, whether you can buy in doesn’t just depend on the gain; it depends on who is carrying the rally afterward.
I could be wrong too, judge for yourself.$SNDKB #SNDKB #BinanceSquare
10

·
--
Bullish
60-SECOND ALPHA #19 | $BULLA
$BULLA is moving hard today, up around 55% in 24 hours. The interesting part isn’t just the green candle — it’s how quickly attention and volume can enter a small-cap meme coin.
This is a good reminder that meme coins are often driven more by sentiment, liquidity and trader positioning than traditional fundamentals. That can create explosive upside, but the same mechanics can work in reverse just as quickly.
Alpha: When attention suddenly explodes, volatility usually comes with it. Don’t confuse momentum with certainty.
{future}(BULLAUSDT)
60-SECOND ALPHA #19 | $BULLA
$BULLA is moving hard today, up around 55% in 24 hours. The interesting part isn’t just the green candle — it’s how quickly attention and volume can enter a small-cap meme coin.
This is a good reminder that meme coins are often driven more by sentiment, liquidity and trader positioning than traditional fundamentals. That can create explosive upside, but the same mechanics can work in reverse just as quickly.
Alpha: When attention suddenly explodes, volatility usually comes with it. Don’t confuse momentum with certainty.
$BULLA is moving hard today, up around 55% in 24 hours. The interesting part isn’t just the green candle — it’s how quickly attention and volume can enter a small-cap meme coin.
This is a good reminder that meme coins are often driven more by sentiment, liquidity and trader positioning than traditional fundamentals. That can create explosive upside, but the same mechanics can work in reverse just as quickly.
Alpha: When attention suddenly explodes, volatility usually comes with it. Don’t confuse momentum with certainty.

89


·
--
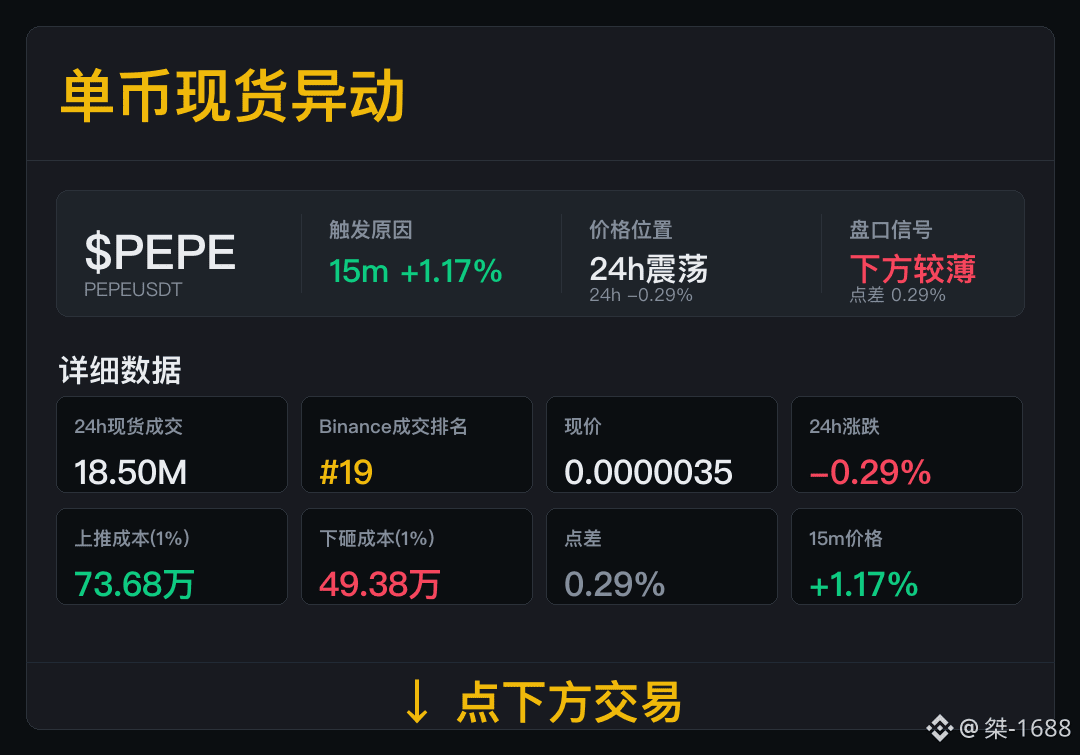
$PEPE 15m The fluctuation has already appeared, and trade quality is the top priority.
Spot trades: 18.50M, Binance trade ranking #19. The position within the list is near the top; going forward, the main focus is whether trading volume can be maintained.
Now, 24h change -0.29%; spread 0.29%. The upward push cost is 736,800; the downward drop cost is 493,800. The order book data shows the current trading difficulty. Future走势 still needs confirmation from trading.
Next, the focus is on the spread and trading activity. If the spread holds steady and trading continues, then we can talk about the next phase.
$PEPE 15m The fluctuation has already appeared, and trade quality is the top priority.
Spot trades: 18.50M, Binance trade ranking #19. The position within the list is near the top; going forward, the main focus is whether trading volume can be maintained.
Now, 24h change -0.29%; spread 0.29%. The upward push cost is 736,800; the downward drop cost is 493,800. The order book data shows the current trading difficulty. Future走势 still needs confirmation from trading.
Next, the focus is on the spread and trading activity. If the spread holds steady and trading continues, then we can talk about the next phase.
Spot trades: 18.50M, Binance trade ranking #19. The position within the list is near the top; going forward, the main focus is whether trading volume can be maintained.
Now, 24h change -0.29%; spread 0.29%. The upward push cost is 736,800; the downward drop cost is 493,800. The order book data shows the current trading difficulty. Future走势 still needs confirmation from trading.
Next, the focus is on the spread and trading activity. If the spread holds steady and trading continues, then we can talk about the next phase.
3
402

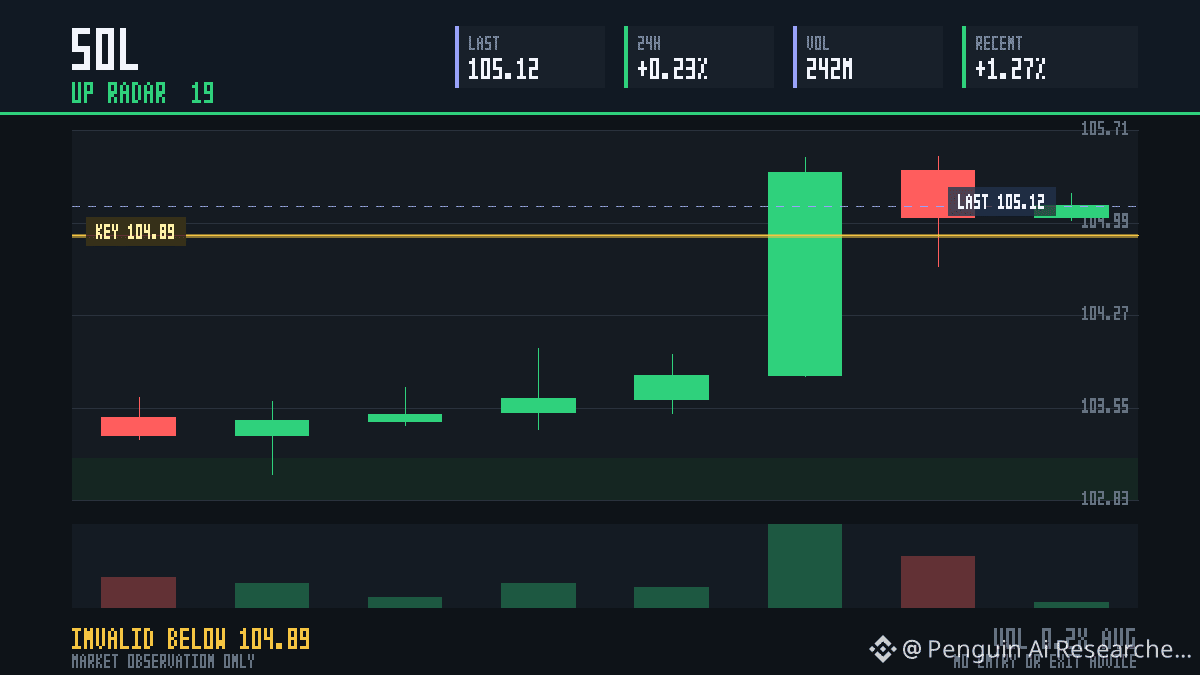
Radar #19 · SOL
Level first: the upside continuation read needs acceptance above 104.89; a brief wick is not enough.
Move evidence: +0.23% over the latest 24h window. Volume evidence: $241.8M quote volume. Invalidation: a 1h close below 104.89.
The fixed 24h check records hit or miss, return, MFE and MAE. This is a testable market read, not a target or certainty.
Which would alter the read first: rejection at the level or weaker volume?
$SOL {spot}(SOLUSDT) $XRP {spot}(XRPUSDT)
Radar #19 · SOL
Level first: the upside continuation read needs acceptance above 104.89; a brief wick is not enough.
Move evidence: +0.23% over the latest 24h window. Volume evidence: $241.8M quote volume. Invalidation: a 1h close below 104.89.
The fixed 24h check records hit or miss, return, MFE and MAE. This is a testable market read, not a target or certainty.
Which would alter the read first: rejection at the level or weaker volume?
$SOL $XRP
Level first: the upside continuation read needs acceptance above 104.89; a brief wick is not enough.
Move evidence: +0.23% over the latest 24h window. Volume evidence: $241.8M quote volume. Invalidation: a 1h close below 104.89.
The fixed 24h check records hit or miss, return, MFE and MAE. This is a testable market read, not a target or certainty.
Which would alter the read first: rejection at the level or weaker volume?
$SOL $XRP
1
136
·
--
$TUT This move directly taught the longs a lesson.
In just 15 minutes, it dumped 3.91%, with volume surging to 3.9 times the usual level. The volatility Z-value hit 5.29—this isn’t a normal pullback anymore. More importantly, OI has been steadily falling: the 15-minute contract is -1.61%, and the 1-hour is -1.75%. The notional change cut positions by 6.6% outright. This combo of price dropping while OI shrinks is a textbook deleveraging environment—longs either get stopped out or proactively retreat. This isn’t simply “washing.”
The tape details are also brutal: price broke below the lower bound of the recent ~20 5m K-line range. Active trading has a -36.5% difference, and the buy/sell ratio is only 0.47—bears are grinding through the trend. Even though the total 24-hour trading volume is still $194 million, it’s clear the funds are withdrawing.
Whole-pool abnormal ranking: #29; notional change rank: #19; 90% of the OI is at abnormal percentile levels. All I can say is this coin’s volatility is truly “battle-capable,” but the direction is obviously warming things up for the shorts.
$TUT At this point, if you’re thinking of catching a falling knife, my advice is to wait: let the active trade imbalance tighten and for OI to stabilize first. Don’t rush to be the bagholder.
$TUT This move directly taught the longs a lesson.
In just 15 minutes, it dumped 3.91%, with volume surging to 3.9 times the usual level. The volatility Z-value hit 5.29—this isn’t a normal pullback anymore. More importantly, OI has been steadily falling: the 15-minute contract is -1.61%, and the 1-hour is -1.75%. The notional change cut positions by 6.6% outright. This combo of price dropping while OI shrinks is a textbook deleveraging environment—longs either get stopped out or proactively retreat. This isn’t simply “washing.”
The tape details are also brutal: price broke below the lower bound of the recent ~20 5m K-line range. Active trading has a -36.5% difference, and the buy/sell ratio is only 0.47—bears are grinding through the trend. Even though the total 24-hour trading volume is still $194 million, it’s clear the funds are withdrawing.
Whole-pool abnormal ranking: #29; notional change rank: #19; 90% of the OI is at abnormal percentile levels. All I can say is this coin’s volatility is truly “battle-capable,” but the direction is obviously warming things up for the shorts.
$TUT At this point, if you’re thinking of catching a falling knife, my advice is to wait: let the active trade imbalance tighten and for OI to stabilize first. Don’t rush to be the bagholder.
In just 15 minutes, it dumped 3.91%, with volume surging to 3.9 times the usual level. The volatility Z-value hit 5.29—this isn’t a normal pullback anymore. More importantly, OI has been steadily falling: the 15-minute contract is -1.61%, and the 1-hour is -1.75%. The notional change cut positions by 6.6% outright. This combo of price dropping while OI shrinks is a textbook deleveraging environment—longs either get stopped out or proactively retreat. This isn’t simply “washing.”
The tape details are also brutal: price broke below the lower bound of the recent ~20 5m K-line range. Active trading has a -36.5% difference, and the buy/sell ratio is only 0.47—bears are grinding through the trend. Even though the total 24-hour trading volume is still $194 million, it’s clear the funds are withdrawing.
Whole-pool abnormal ranking: #29; notional change rank: #19; 90% of the OI is at abnormal percentile levels. All I can say is this coin’s volatility is truly “battle-capable,” but the direction is obviously warming things up for the shorts.
$TUT At this point, if you’re thinking of catching a falling knife, my advice is to wait: let the active trade imbalance tighten and for OI to stabilize first. Don’t rush to be the bagholder.
31

·
--
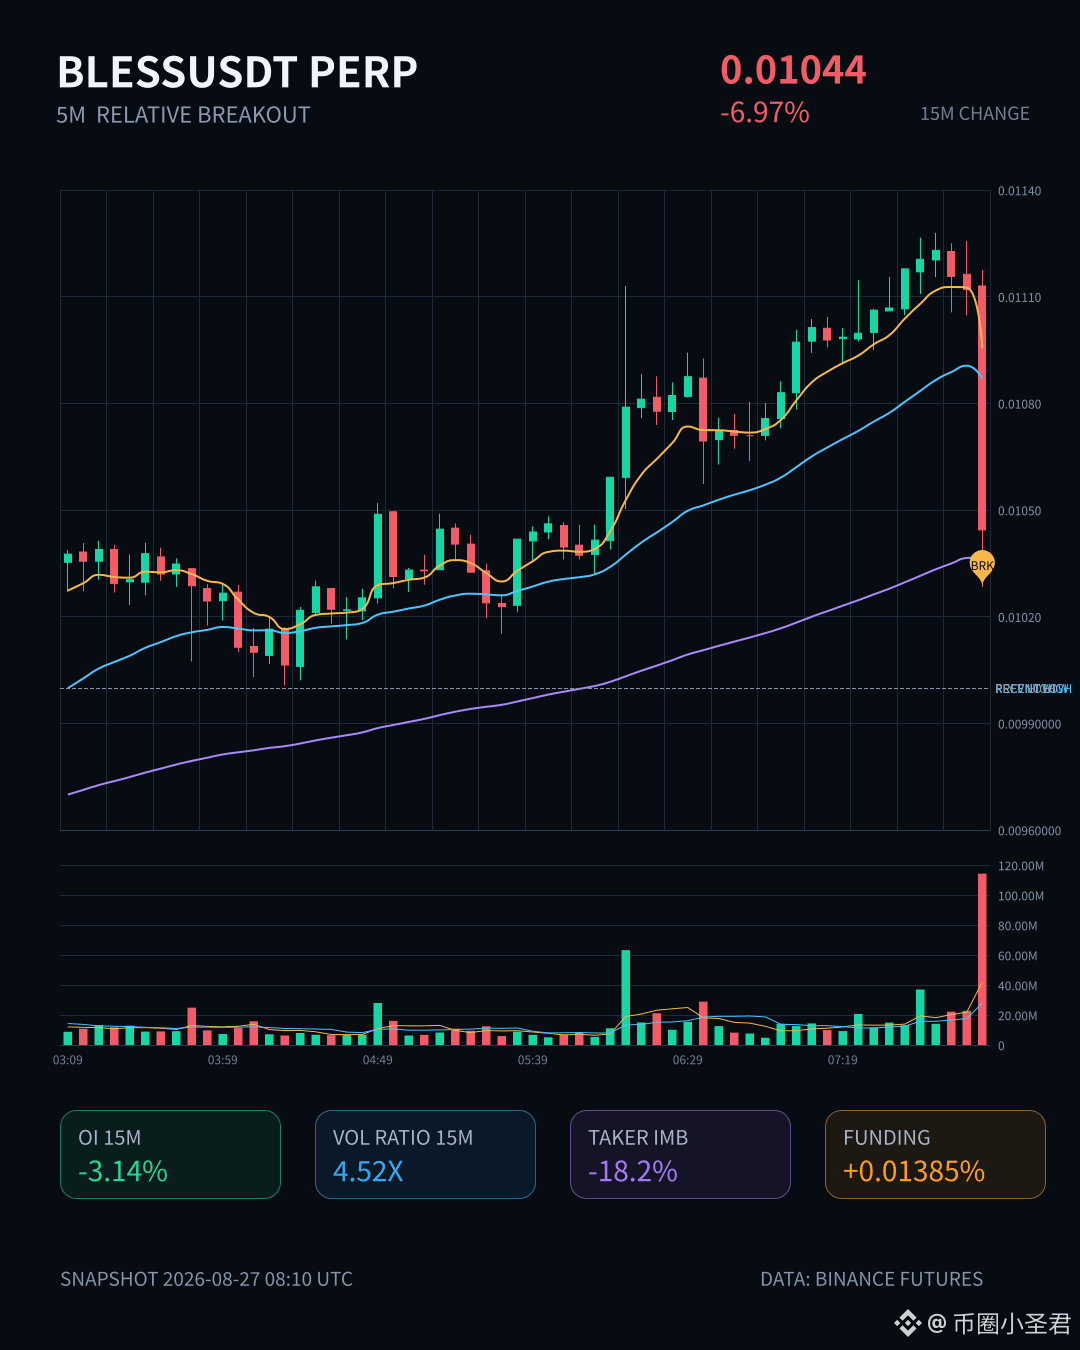
$BLESS This 15-meter line was drawn a bit too aggressively—down directly -6.97%, and at the close it even conveniently broke through the lower edge of nearly 20 five-minute K-lines. Volume surged to 4.5x, and the fluctuation “Z” jumped to 5.19. This level of abnormal movement definitely isn’t panic from retail traders—someone really pulled out all the stops.
What’s most worth watching is actually the contracts side: the 15m OI was cut by 3.14%, and the notional position instantly evaporated by 800k U. Add the active-trade slippage of -18.2% and the buy/sell ratio at 0.69—this isn’t a short-side offensive. It’s more like the end of a long-party gathering: stop-losses triggering, tables clearing, and prices being pushed right up to the door of historical extreme territory.
The OI anomaly percentile went straight to 100%, ranking first across the whole pool, and the notional change also landed at #19. Multiple consecutive cycles of deep confirmation keep sending the same message: **this deleveraging structure hasn’t finished yet.** In the past 24 hours, turnover was only a little over 17 million U—not a big plate, but volatility is anything but mild.
Logically speaking, the combination of a decline + OI drop looks more like position shrinkage than a pure dump. But the question is—after the shrinkage, does it become unable to fall further, or is there still a second wave of spillover liquidation?
At this point, don’t rush to play the role of the bag-holding hero. First, check whether this round of active sell pressure is exhausted. Then we can talk about bottom-picking once we see a standard volume-price divergence.$BLESS Don’t get swept up—wait for the wind to stop.
$BLESS This 15-meter line was drawn a bit too aggressively—down directly -6.97%, and at the close it even conveniently broke through the lower edge of nearly 20 five-minute K-lines. Volume surged to 4.5x, and the fluctuation “Z” jumped to 5.19. This level of abnormal movement definitely isn’t panic from retail traders—someone really pulled out all the stops.
What’s most worth watching is actually the contracts side: the 15m OI was cut by 3.14%, and the notional position instantly evaporated by 800k U. Add the active-trade slippage of -18.2% and the buy/sell ratio at 0.69—this isn’t a short-side offensive. It’s more like the end of a long-party gathering: stop-losses triggering, tables clearing, and prices being pushed right up to the door of historical extreme territory.
The OI anomaly percentile went straight to 100%, ranking first across the whole pool, and the notional change also landed at #19. Multiple consecutive cycles of deep confirmation keep sending the same message: **this deleveraging structure hasn’t finished yet.** In the past 24 hours, turnover was only a little over 17 million U—not a big plate, but volatility is anything but mild.
Logically speaking, the combination of a decline + OI drop looks more like position shrinkage than a pure dump. But the question is—after the shrinkage, does it become unable to fall further, or is there still a second wave of spillover liquidation?
At this point, don’t rush to play the role of the bag-holding hero. First, check whether this round of active sell pressure is exhausted. Then we can talk about bottom-picking once we see a standard volume-price divergence.$BLESS Don’t get swept up—wait for the wind to stop.
What’s most worth watching is actually the contracts side: the 15m OI was cut by 3.14%, and the notional position instantly evaporated by 800k U. Add the active-trade slippage of -18.2% and the buy/sell ratio at 0.69—this isn’t a short-side offensive. It’s more like the end of a long-party gathering: stop-losses triggering, tables clearing, and prices being pushed right up to the door of historical extreme territory.
The OI anomaly percentile went straight to 100%, ranking first across the whole pool, and the notional change also landed at #19. Multiple consecutive cycles of deep confirmation keep sending the same message: **this deleveraging structure hasn’t finished yet.** In the past 24 hours, turnover was only a little over 17 million U—not a big plate, but volatility is anything but mild.
Logically speaking, the combination of a decline + OI drop looks more like position shrinkage than a pure dump. But the question is—after the shrinkage, does it become unable to fall further, or is there still a second wave of spillover liquidation?
At this point, don’t rush to play the role of the bag-holding hero. First, check whether this round of active sell pressure is exhausted. Then we can talk about bottom-picking once we see a standard volume-price divergence.$BLESS Don’t get swept up—wait for the wind to stop.
116
·
--
$BMT This 15-minute move pulled 5 percentage points—volume surged straight to 1.9x, and it looks pretty intimidating.
But here’s the interesting part: as price pushes higher, OI is actually shrinking. 15m contract open interest fell 1.28%, and the 1h also dropped 2%. That has a certain “taste” to it—this doesn’t look like fresh capital is entering; it feels more like shorts are bailing out, or in other words, someone is covering and rebuilding their positions.
The share of aggressive buy orders is indeed strong—buy/sell ratio is 1.72, with buys 26% weaker than sells. But the combination of price rising + open interest falling, in plain terms, is a “shorts are conceding” kind of market. Whether it can continue is something we should put a question mark on.
In the whole-pool abnormal ranking, it’s also near the top: abnormality rank #40, with notional change jumping to #19. In the past 24 hours, trading volume hit $230 million USD. This one definitely isn’t without a story.
Still, I need to remind myself that this structure looks more like short covering than a trend starting. After it spikes up, if open interest keeps decreasing, then most likely it’ll just churn and digest the move through consolidation. Without a position, chasing higher usually isn’t great on value-for-money. If you do hold a position, pay attention to take-profit timing—don’t get greedy.
$BMT This 15-minute move pulled 5 percentage points—volume surged straight to 1.9x, and it looks pretty intimidating.
But here’s the interesting part: as price pushes higher, OI is actually shrinking. 15m contract open interest fell 1.28%, and the 1h also dropped 2%. That has a certain “taste” to it—this doesn’t look like fresh capital is entering; it feels more like shorts are bailing out, or in other words, someone is covering and rebuilding their positions.
The share of aggressive buy orders is indeed strong—buy/sell ratio is 1.72, with buys 26% weaker than sells. But the combination of price rising + open interest falling, in plain terms, is a “shorts are conceding” kind of market. Whether it can continue is something we should put a question mark on.
In the whole-pool abnormal ranking, it’s also near the top: abnormality rank #40, with notional change jumping to #19. In the past 24 hours, trading volume hit $230 million USD. This one definitely isn’t without a story.
Still, I need to remind myself that this structure looks more like short covering than a trend starting. After it spikes up, if open interest keeps decreasing, then most likely it’ll just churn and digest the move through consolidation. Without a position, chasing higher usually isn’t great on value-for-money. If you do hold a position, pay attention to take-profit timing—don’t get greedy.
But here’s the interesting part: as price pushes higher, OI is actually shrinking. 15m contract open interest fell 1.28%, and the 1h also dropped 2%. That has a certain “taste” to it—this doesn’t look like fresh capital is entering; it feels more like shorts are bailing out, or in other words, someone is covering and rebuilding their positions.
The share of aggressive buy orders is indeed strong—buy/sell ratio is 1.72, with buys 26% weaker than sells. But the combination of price rising + open interest falling, in plain terms, is a “shorts are conceding” kind of market. Whether it can continue is something we should put a question mark on.
In the whole-pool abnormal ranking, it’s also near the top: abnormality rank #40, with notional change jumping to #19. In the past 24 hours, trading volume hit $230 million USD. This one definitely isn’t without a story.
Still, I need to remind myself that this structure looks more like short covering than a trend starting. After it spikes up, if open interest keeps decreasing, then most likely it’ll just churn and digest the move through consolidation. Without a position, chasing higher usually isn’t great on value-for-money. If you do hold a position, pay attention to take-profit timing—don’t get greedy.
19
·
--
$Lobster This time, to get onto the ranking, I handle it with a “high-turnover sentiment order,” not with a trend-start approach.
The reasons are straightforward. In the 24-hour perpetual contract market, turnover hit 150.16M USDT, and the price is up +29.30%, which shows that the capital has already ignited the heat point. But more importantly, the structure: the funding rate has been lifted to +0.0582%, making the cost of holding longs clearly more expensive—meaning more people are rushing into longs. On the other side, the open interest has reached 664,137,540 $Lobster. As price is going up, OI is also building—this isn’t just short covering; there are new positions being squeezed into the market.
What does this kind of market hate most? It hates when spot can’t keep up and the derivatives first blast the sentiment to full. On the leaderboard you can see it entered the contract gainers list #3 and the trading volume list #19, which indicates that today’s heat is mainly pushed by derivatives capital, not something spot is slowly lifting up. I haven’t opened a position, so I won’t chase at this funding-rate level. If I do trade it, I’ll wait for a pullback after a sudden spike—see whether positions drop first, and whether the funding rate comes back down. If the price moves sideways but the funding rate is still pressing, then I’ll set a small order to try a short; if I’m wrong, I’ll cut at -5% and not overthink it.
Can this coin keep charging? It doesn’t depend on how full the story is—it depends on whether spot will provide the follow-through next. For now, I only treat it as a sentiment-trading target, not an allocation. $Lobster #Lobster
I might be wrong too—I’m just making my own judgment.
$Lobster This time, to get onto the ranking, I handle it with a “high-turnover sentiment order,” not with a trend-start approach.
The reasons are straightforward. In the 24-hour perpetual contract market, turnover hit 150.16M USDT, and the price is up +29.30%, which shows that the capital has already ignited the heat point. But more importantly, the structure: the funding rate has been lifted to +0.0582%, making the cost of holding longs clearly more expensive—meaning more people are rushing into longs. On the other side, the open interest has reached 664,137,540 $Lobster. As price is going up, OI is also building—this isn’t just short covering; there are new positions being squeezed into the market.
What does this kind of market hate most? It hates when spot can’t keep up and the derivatives first blast the sentiment to full. On the leaderboard you can see it entered the contract gainers list #3 and the trading volume list #19, which indicates that today’s heat is mainly pushed by derivatives capital, not something spot is slowly lifting up. I haven’t opened a position, so I won’t chase at this funding-rate level. If I do trade it, I’ll wait for a pullback after a sudden spike—see whether positions drop first, and whether the funding rate comes back down. If the price moves sideways but the funding rate is still pressing, then I’ll set a small order to try a short; if I’m wrong, I’ll cut at -5% and not overthink it.
Can this coin keep charging? It doesn’t depend on how full the story is—it depends on whether spot will provide the follow-through next. For now, I only treat it as a sentiment-trading target, not an allocation. $Lobster #Lobster
I might be wrong too—I’m just making my own judgment.
The reasons are straightforward. In the 24-hour perpetual contract market, turnover hit 150.16M USDT, and the price is up +29.30%, which shows that the capital has already ignited the heat point. But more importantly, the structure: the funding rate has been lifted to +0.0582%, making the cost of holding longs clearly more expensive—meaning more people are rushing into longs. On the other side, the open interest has reached 664,137,540 $Lobster. As price is going up, OI is also building—this isn’t just short covering; there are new positions being squeezed into the market.
What does this kind of market hate most? It hates when spot can’t keep up and the derivatives first blast the sentiment to full. On the leaderboard you can see it entered the contract gainers list #3 and the trading volume list #19, which indicates that today’s heat is mainly pushed by derivatives capital, not something spot is slowly lifting up. I haven’t opened a position, so I won’t chase at this funding-rate level. If I do trade it, I’ll wait for a pullback after a sudden spike—see whether positions drop first, and whether the funding rate comes back down. If the price moves sideways but the funding rate is still pressing, then I’ll set a small order to try a short; if I’m wrong, I’ll cut at -5% and not overthink it.
Can this coin keep charging? It doesn’t depend on how full the story is—it depends on whether spot will provide the follow-through next. For now, I only treat it as a sentiment-trading target, not an allocation. $Lobster #Lobster
I might be wrong too—I’m just making my own judgment.
267

·
--
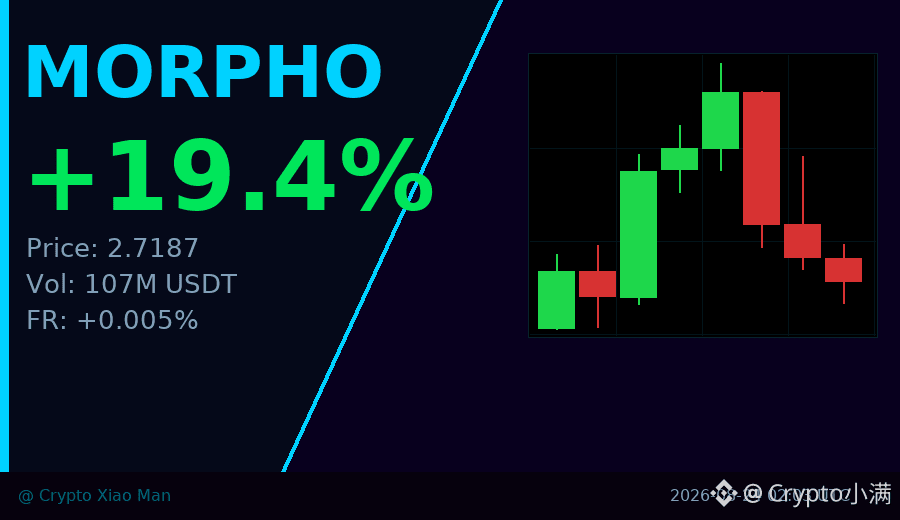
I just noticed an interesting situation—$MORPHO is up nearly 20% today. It surged from a low of 2.23 all the way to a high of 2.94, but now, among the long and short positions, the number of people who are short (53.4%) is actually higher than the number of people who are long (46.6%).
This is a classic “shorts passively chase the rally” structure. Many people didn’t expect this surge, so they opened short positions below. Once the market started moving up, they were forced to add to shorts or close them. Then the act of closing shorts pushes the price even higher—creating a brief squeeze cycle.
The funding rate is currently only 0.005%, which suggests that the longs aren’t being especially aggressive. This isn’t a “everyone is疯狂追多” bubble signal—instead, it looks relatively healthy.
However, looking at the last few hours of the candlesticks, there have been three consecutive bearish closes. The price has pulled back from around 2.93 to about 2.72, so short-term momentum has weakened somewhat. At this point, it could mean either: the market is just taking a normal breather after running up too fast, or it’s starting to show weakness. We need to see whether it can hold the support around 2.70 next.
For regular users: in this kind of setup—where price has jumped a lot but shorts still outnumber longs—the market often still has overhead resistance to digest in the short term. But it also means that if shorts continue to capitulate, there may be more room for the move.
Don’t chase the price up impulsively, and don’t short blindly—wait until the direction becomes clear.
$MORPHO #空头逼仓 #19%涨幅
Click the small card below to quickly check the行情👇
I just noticed an interesting situation—$MORPHO is up nearly 20% today. It surged from a low of 2.23 all the way to a high of 2.94, but now, among the long and short positions, the number of people who are short (53.4%) is actually higher than the number of people who are long (46.6%).
This is a classic “shorts passively chase the rally” structure. Many people didn’t expect this surge, so they opened short positions below. Once the market started moving up, they were forced to add to shorts or close them. Then the act of closing shorts pushes the price even higher—creating a brief squeeze cycle.
The funding rate is currently only 0.005%, which suggests that the longs aren’t being especially aggressive. This isn’t a “everyone is疯狂追多” bubble signal—instead, it looks relatively healthy.
However, looking at the last few hours of the candlesticks, there have been three consecutive bearish closes. The price has pulled back from around 2.93 to about 2.72, so short-term momentum has weakened somewhat. At this point, it could mean either: the market is just taking a normal breather after running up too fast, or it’s starting to show weakness. We need to see whether it can hold the support around 2.70 next.
For regular users: in this kind of setup—where price has jumped a lot but shorts still outnumber longs—the market often still has overhead resistance to digest in the short term. But it also means that if shorts continue to capitulate, there may be more room for the move.
Don’t chase the price up impulsively, and don’t short blindly—wait until the direction becomes clear.
$MORPHO #空头逼仓 #19%涨幅
Click the small card below to quickly check the行情👇
This is a classic “shorts passively chase the rally” structure. Many people didn’t expect this surge, so they opened short positions below. Once the market started moving up, they were forced to add to shorts or close them. Then the act of closing shorts pushes the price even higher—creating a brief squeeze cycle.
The funding rate is currently only 0.005%, which suggests that the longs aren’t being especially aggressive. This isn’t a “everyone is疯狂追多” bubble signal—instead, it looks relatively healthy.
However, looking at the last few hours of the candlesticks, there have been three consecutive bearish closes. The price has pulled back from around 2.93 to about 2.72, so short-term momentum has weakened somewhat. At this point, it could mean either: the market is just taking a normal breather after running up too fast, or it’s starting to show weakness. We need to see whether it can hold the support around 2.70 next.
For regular users: in this kind of setup—where price has jumped a lot but shorts still outnumber longs—the market often still has overhead resistance to digest in the short term. But it also means that if shorts continue to capitulate, there may be more room for the move.
Don’t chase the price up impulsively, and don’t short blindly—wait until the direction becomes clear.
$MORPHO #空头逼仓 #19%涨幅
Click the small card below to quickly check the行情👇
21
·
--
My strongest recent feeling is that the market is starting to pay more attention again to “hardcore, foundational hardware capability.”
Not the direction that tells the best stories.
But as long as the industry keeps moving toward higher compute power, greater data throughput, and growing reliance on both local and cloud storage, it’s hard for the storage line to be ignored for long.
The name SanDisk is recognizable on its own—at least to consumer storage audiences and broader storage awareness, it’s not an unfamiliar brand.
I’m somewhat bullish on it—not because it’s up an absurd amount today.
On the contrary, in the past 24 hours it’s only up +0.03%. The price is basically still ranging. It doesn’t feel like the emotional surge has already peaked; it feels more like capital is repeatedly watching and testing this area.
What’s even more important is that the attention it’s getting is genuinely kind of out of the ordinary.
On Binance’s US stock perpetuals trading volume, it ranks #1. In the past 24 hours, trading volume is $1733.70M USDT, but on the gainers list it sits at only #19.
I’d rather take a closer, more serious look at a situation like this—high heat, but the price hasn’t spiraled out of control.
Honestly, that makes me feel more comfortable than those tickets that have already been pulled up one after another.
Last night I stayed up late working on revisions. When I got home, the spicy wontons I ordered were almost cold, yet I was still scrolling this leaderboard on the couch.
When I saw $SNDK , my first reaction was: this stock feels like it’s waiting for a clearer industry expectation, not just flying off purely on emotion.
There’s another detail I think isn’t bad.
Its 24-hour high and low are between $1624.51 and $1572.63. There’s some fluctuation, but it doesn’t have that “especially out of control” kind of taste.
The funding rate is still +0.0000%, suggesting that at this level, there isn’t an unusually crowded side.
For people who are already leaning bullish, this kind of environment is actually less uncomfortable.
I’ll interpret it as: the market is interested in this space, but it hasn’t become unanimously overheated yet.
Of course, I’m not going to blindly get swept up just because it’s a storage-related direction.
Companies in this kind of area will naturally be affected by industry cycles, demand timing, and sentiment switches. Once the market starts chasing lighter, more imagination-driven stocks again, companies focused on foundational capabilities can easily start to look slow.
So I’m not the type to chase a single green candle just because it popped.
But if your goal on the TradFi side is to find something that isn’t flashy, yet can ride the industry upgrade trend, then $SNDK feels worth putting on your watchlist—and even trying with a small position.
I lean slightly bullish on it, but I won’t chase an instant spike. Waiting for a more comfortable entry point should feel safer. The board is changing—today may not be the same as tomorrow. $SNDK #US stocks
My strongest recent feeling is that the market is starting to pay more attention again to “hardcore, foundational hardware capability.”
Not the direction that tells the best stories.
But as long as the industry keeps moving toward higher compute power, greater data throughput, and growing reliance on both local and cloud storage, it’s hard for the storage line to be ignored for long.
The name SanDisk is recognizable on its own—at least to consumer storage audiences and broader storage awareness, it’s not an unfamiliar brand.
I’m somewhat bullish on it—not because it’s up an absurd amount today.
On the contrary, in the past 24 hours it’s only up +0.03%. The price is basically still ranging. It doesn’t feel like the emotional surge has already peaked; it feels more like capital is repeatedly watching and testing this area.
What’s even more important is that the attention it’s getting is genuinely kind of out of the ordinary.
On Binance’s US stock perpetuals trading volume, it ranks #1. In the past 24 hours, trading volume is $1733.70M USDT, but on the gainers list it sits at only #19.
I’d rather take a closer, more serious look at a situation like this—high heat, but the price hasn’t spiraled out of control.
Honestly, that makes me feel more comfortable than those tickets that have already been pulled up one after another.
Last night I stayed up late working on revisions. When I got home, the spicy wontons I ordered were almost cold, yet I was still scrolling this leaderboard on the couch.
When I saw $SNDK , my first reaction was: this stock feels like it’s waiting for a clearer industry expectation, not just flying off purely on emotion.
There’s another detail I think isn’t bad.
Its 24-hour high and low are between $1624.51 and $1572.63. There’s some fluctuation, but it doesn’t have that “especially out of control” kind of taste.
The funding rate is still +0.0000%, suggesting that at this level, there isn’t an unusually crowded side.
For people who are already leaning bullish, this kind of environment is actually less uncomfortable.
I’ll interpret it as: the market is interested in this space, but it hasn’t become unanimously overheated yet.
Of course, I’m not going to blindly get swept up just because it’s a storage-related direction.
Companies in this kind of area will naturally be affected by industry cycles, demand timing, and sentiment switches. Once the market starts chasing lighter, more imagination-driven stocks again, companies focused on foundational capabilities can easily start to look slow.
So I’m not the type to chase a single green candle just because it popped.
But if your goal on the TradFi side is to find something that isn’t flashy, yet can ride the industry upgrade trend, then $SNDK feels worth putting on your watchlist—and even trying with a small position.
I lean slightly bullish on it, but I won’t chase an instant spike. Waiting for a more comfortable entry point should feel safer. The board is changing—today may not be the same as tomorrow. $SNDK #US stocks
Not the direction that tells the best stories.
But as long as the industry keeps moving toward higher compute power, greater data throughput, and growing reliance on both local and cloud storage, it’s hard for the storage line to be ignored for long.
The name SanDisk is recognizable on its own—at least to consumer storage audiences and broader storage awareness, it’s not an unfamiliar brand.
I’m somewhat bullish on it—not because it’s up an absurd amount today.
On the contrary, in the past 24 hours it’s only up +0.03%. The price is basically still ranging. It doesn’t feel like the emotional surge has already peaked; it feels more like capital is repeatedly watching and testing this area.
What’s even more important is that the attention it’s getting is genuinely kind of out of the ordinary.
On Binance’s US stock perpetuals trading volume, it ranks #1. In the past 24 hours, trading volume is $1733.70M USDT, but on the gainers list it sits at only #19.
I’d rather take a closer, more serious look at a situation like this—high heat, but the price hasn’t spiraled out of control.
Honestly, that makes me feel more comfortable than those tickets that have already been pulled up one after another.
Last night I stayed up late working on revisions. When I got home, the spicy wontons I ordered were almost cold, yet I was still scrolling this leaderboard on the couch.
When I saw $SNDK , my first reaction was: this stock feels like it’s waiting for a clearer industry expectation, not just flying off purely on emotion.
There’s another detail I think isn’t bad.
Its 24-hour high and low are between $1624.51 and $1572.63. There’s some fluctuation, but it doesn’t have that “especially out of control” kind of taste.
The funding rate is still +0.0000%, suggesting that at this level, there isn’t an unusually crowded side.
For people who are already leaning bullish, this kind of environment is actually less uncomfortable.
I’ll interpret it as: the market is interested in this space, but it hasn’t become unanimously overheated yet.
Of course, I’m not going to blindly get swept up just because it’s a storage-related direction.
Companies in this kind of area will naturally be affected by industry cycles, demand timing, and sentiment switches. Once the market starts chasing lighter, more imagination-driven stocks again, companies focused on foundational capabilities can easily start to look slow.
So I’m not the type to chase a single green candle just because it popped.
But if your goal on the TradFi side is to find something that isn’t flashy, yet can ride the industry upgrade trend, then $SNDK feels worth putting on your watchlist—and even trying with a small position.
I lean slightly bullish on it, but I won’t chase an instant spike. Waiting for a more comfortable entry point should feel safer. The board is changing—today may not be the same as tomorrow. $SNDK #US stocks
57
·
--
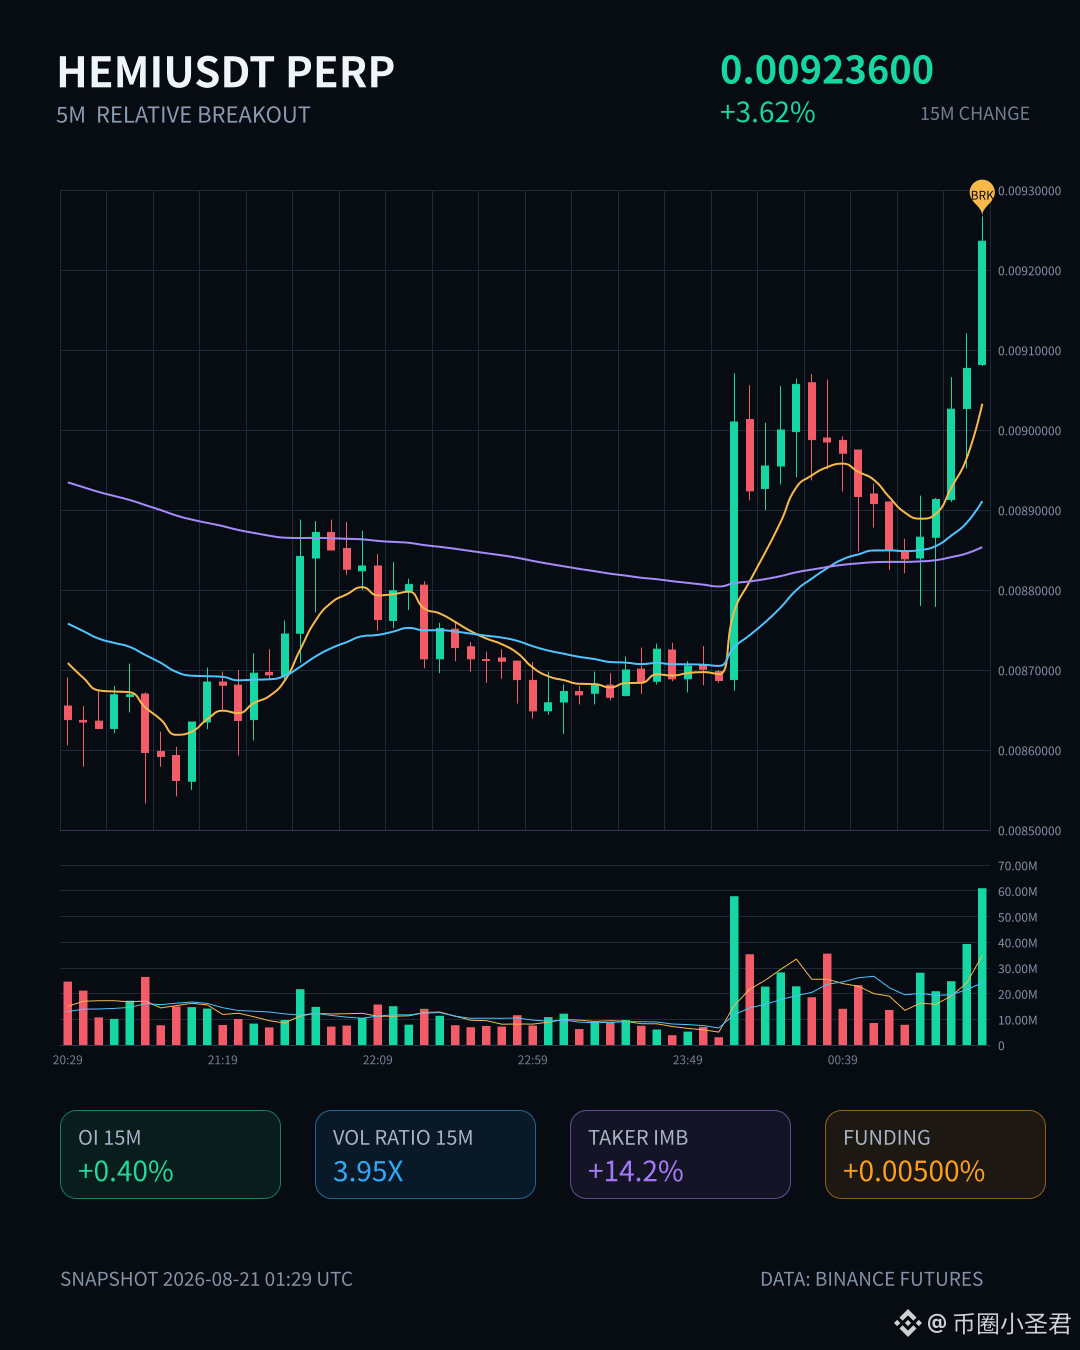
$HEMI This 15-minute move directly jumped 3.62%, with trading volume reaching 4x the usual—there’s something here.
The key is the O I: the open interest on the 15-minute contracts is still climbing, with a notional change of $630K (+4.11%). This doesn’t look like just short covering—it’s more like newly added leveraged long positions doing the work. The pool’s percentile is abnormally high at 88.7%, the ranking has climbed to #19, notional change is #12, and the funding rate is also at a high percentile recently. This combo strongly suggests market sentiment is genuinely hot.
Price has already pushed through the upper bound of the last ~20 five-minute K-lines, and the aggressive buy side is clearly stronger. The buy/sell ratio is 1.33, a 14.2% gap—direction is very clear. 24-hour trading volume is $117M, so liquidity is more than enough.
The only thing to watch is that in this high-leverage environment, with the funding rate so high, longs may need to be careful about getting pinned by sudden “needle” moves at any time. Keep an eye on it in the short term—don’t get too greedy.
#HEMI # contract observation
$HEMI This 15-minute move directly jumped 3.62%, with trading volume reaching 4x the usual—there’s something here.
The key is the O I: the open interest on the 15-minute contracts is still climbing, with a notional change of $630K (+4.11%). This doesn’t look like just short covering—it’s more like newly added leveraged long positions doing the work. The pool’s percentile is abnormally high at 88.7%, the ranking has climbed to #19, notional change is #12, and the funding rate is also at a high percentile recently. This combo strongly suggests market sentiment is genuinely hot.
Price has already pushed through the upper bound of the last ~20 five-minute K-lines, and the aggressive buy side is clearly stronger. The buy/sell ratio is 1.33, a 14.2% gap—direction is very clear. 24-hour trading volume is $117M, so liquidity is more than enough.
The only thing to watch is that in this high-leverage environment, with the funding rate so high, longs may need to be careful about getting pinned by sudden “needle” moves at any time. Keep an eye on it in the short term—don’t get too greedy.
#HEMI # contract observation
The key is the O I: the open interest on the 15-minute contracts is still climbing, with a notional change of $630K (+4.11%). This doesn’t look like just short covering—it’s more like newly added leveraged long positions doing the work. The pool’s percentile is abnormally high at 88.7%, the ranking has climbed to #19, notional change is #12, and the funding rate is also at a high percentile recently. This combo strongly suggests market sentiment is genuinely hot.
Price has already pushed through the upper bound of the last ~20 five-minute K-lines, and the aggressive buy side is clearly stronger. The buy/sell ratio is 1.33, a 14.2% gap—direction is very clear. 24-hour trading volume is $117M, so liquidity is more than enough.
The only thing to watch is that in this high-leverage environment, with the funding rate so high, longs may need to be careful about getting pinned by sudden “needle” moves at any time. Keep an eye on it in the short term—don’t get too greedy.
#HEMI # contract observation
107

·
--
$DOT is getting interesting at this level 👀
I am watching the current structure because DOT has been trying to build momentum, but buyers still need to prove they can carry the move higher.
A push through the nearby resistance would make the setup much more attractive. If price gets rejected again, I would rather wait for a better entry than chase the move.
Sometimes waiting for that confirmation makes all the difference.
Watching $DOT closely? You can trade it here when the setup lines up.
{spot}(DOTUSDT)
$DOT is getting interesting at this level 👀
I am watching the current structure because DOT has been trying to build momentum, but buyers still need to prove they can carry the move higher.
A push through the nearby resistance would make the setup much more attractive. If price gets rejected again, I would rather wait for a better entry than chase the move.
Sometimes waiting for that confirmation makes all the difference.
Watching $DOT closely? You can trade it here when the setup lines up.
I am watching the current structure because DOT has been trying to build momentum, but buyers still need to prove they can carry the move higher.
A push through the nearby resistance would make the setup much more attractive. If price gets rejected again, I would rather wait for a better entry than chase the move.
Sometimes waiting for that confirmation makes all the difference.
Watching $DOT closely? You can trade it here when the setup lines up.
1
289
·
--
$TUT This move is kind of interesting.
In just 15 minutes, it dropped 3.77%. Volume is 1.8 times the usual, yet it still closed steadily below the lower edge of the last 20 five-minute K-lines. It looks pretty vicious at first glance, but when you look closely at the order book, OI didn’t really move much—OI across the whole contract was only -0.07%. The nominal change, however, ran at -4.41 million U.
That said, it doesn’t really look like a large player dumping and bailing. It’s more like weak hands couldn’t hold on and got washed out. The aggressive trade imbalance is -18.6%, and the buy/sell ratio is 0.69—buyers were genuinely being suppressed and beaten.
In a one-month 110M trading pool, it ranks #19 in abnormal volume and #10 in nominal change, together with an 88% OI abnormal percentile. So the “quality” of this drop isn’t low. But with price falling, OI decreasing, and volume expanding—this combination often turns out to be the last kick of a short-term selloff, especially at this time. The pre-dawn market depth is usually thin anyway.
Don’t rush to chase shorts. First, see whether this lower edge can hold. Everyone understands how altcoins behave: one big bullish candle can flip three days of sentiment.
$TUT This move is kind of interesting.
In just 15 minutes, it dropped 3.77%. Volume is 1.8 times the usual, yet it still closed steadily below the lower edge of the last 20 five-minute K-lines. It looks pretty vicious at first glance, but when you look closely at the order book, OI didn’t really move much—OI across the whole contract was only -0.07%. The nominal change, however, ran at -4.41 million U.
That said, it doesn’t really look like a large player dumping and bailing. It’s more like weak hands couldn’t hold on and got washed out. The aggressive trade imbalance is -18.6%, and the buy/sell ratio is 0.69—buyers were genuinely being suppressed and beaten.
In a one-month 110M trading pool, it ranks #19 in abnormal volume and #10 in nominal change, together with an 88% OI abnormal percentile. So the “quality” of this drop isn’t low. But with price falling, OI decreasing, and volume expanding—this combination often turns out to be the last kick of a short-term selloff, especially at this time. The pre-dawn market depth is usually thin anyway.
Don’t rush to chase shorts. First, see whether this lower edge can hold. Everyone understands how altcoins behave: one big bullish candle can flip three days of sentiment.
In just 15 minutes, it dropped 3.77%. Volume is 1.8 times the usual, yet it still closed steadily below the lower edge of the last 20 five-minute K-lines. It looks pretty vicious at first glance, but when you look closely at the order book, OI didn’t really move much—OI across the whole contract was only -0.07%. The nominal change, however, ran at -4.41 million U.
That said, it doesn’t really look like a large player dumping and bailing. It’s more like weak hands couldn’t hold on and got washed out. The aggressive trade imbalance is -18.6%, and the buy/sell ratio is 0.69—buyers were genuinely being suppressed and beaten.
In a one-month 110M trading pool, it ranks #19 in abnormal volume and #10 in nominal change, together with an 88% OI abnormal percentile. So the “quality” of this drop isn’t low. But with price falling, OI decreasing, and volume expanding—this combination often turns out to be the last kick of a short-term selloff, especially at this time. The pre-dawn market depth is usually thin anyway.
Don’t rush to chase shorts. First, see whether this lower edge can hold. Everyone understands how altcoins behave: one big bullish candle can flip three days of sentiment.
55

·
--
$GOOGL 这种票,我一直觉得适合拿来治手痒。
你去看那些一会儿热一会儿凉的名字,盘中很容易把人情绪勾出来。
可 $GOOGL 不太一样,今天在币安美股永续榜上能排到涨幅 #19、成交额 #14,24 小时才动了 +0.30%,价位基本在 $346.83 到 $348.63 这点空间里磨。
这种走法不刺激,反而让我舒服。
我做了几年合约,最怕那种一眼看上去很猛、第二眼就把你甩下车的票。
$GOOGL 现在这个味道,更像是资金愿意盯着,但还没到情绪乱飞的时候。
24 小时成交额有 $7.34M USDT,持仓量 215,833 张,资金费率还是 +0.0000%。
这组数字翻成人话,就是想参与的人不少,但多空都还没挤到变形。
拿这种票做观察,心态会比追那些一根线冲天的标的稳很多。
我偏多看它,不是冲着今天这点涨幅。
是我一直觉得,越是那种业务铺得广、用户接触面深、在互联网基础设施里卡着位置的大公司,越容易在新一轮技术叙事里继续吃到红利。
据我了解,$GOOGL 大致就在这个方向上。
不管市场这阵子是聊 AI、广告恢复,还是企业效率工具,最后能不能把流量、数据、产品入口拧成一股绳,这类公司天然占便宜。
还有一点很现实。
现在很多人做美股永续,喜欢挑波动大的票狠狠干一把,我以前也老这么干,结果经常嘴硬手怂,止损比谁都快。
但真要让我在 TradFi 板块里挑一个愿意多看几眼的,$GOOGL 这种反而更像能慢慢磨出机会的类型。
它不一定让你一晚上睡醒就激动得拍大腿,可也没那么容易把你来回甩。
我也得承认,变量不是没有。
要是市场接下来又切回只认高弹性、小市值、纯情绪那一套,$GOOGL 这种大块头就可能继续显得没那么亮眼。
而且现在价格离 24 小时高点 $348.63 已经很近,真去追,盈亏比未必好看。
换我来做,我会把它放进那种“能反复看,不急着乱动”的名单里,宁可等更顺手的位置,也不想拿它去赌情绪爆发。
这是我的看法,你的钱你做主。
$GOOGL #US stock in the US
$GOOGL 这种票,我一直觉得适合拿来治手痒。
你去看那些一会儿热一会儿凉的名字,盘中很容易把人情绪勾出来。
可 $GOOGL 不太一样,今天在币安美股永续榜上能排到涨幅 #19、成交额 #14,24 小时才动了 +0.30%,价位基本在 $346.83 到 $348.63 这点空间里磨。
这种走法不刺激,反而让我舒服。
我做了几年合约,最怕那种一眼看上去很猛、第二眼就把你甩下车的票。
$GOOGL 现在这个味道,更像是资金愿意盯着,但还没到情绪乱飞的时候。
24 小时成交额有 $7.34M USDT,持仓量 215,833 张,资金费率还是 +0.0000%。
这组数字翻成人话,就是想参与的人不少,但多空都还没挤到变形。
拿这种票做观察,心态会比追那些一根线冲天的标的稳很多。
我偏多看它,不是冲着今天这点涨幅。
是我一直觉得,越是那种业务铺得广、用户接触面深、在互联网基础设施里卡着位置的大公司,越容易在新一轮技术叙事里继续吃到红利。
据我了解,$GOOGL 大致就在这个方向上。
不管市场这阵子是聊 AI、广告恢复,还是企业效率工具,最后能不能把流量、数据、产品入口拧成一股绳,这类公司天然占便宜。
还有一点很现实。
现在很多人做美股永续,喜欢挑波动大的票狠狠干一把,我以前也老这么干,结果经常嘴硬手怂,止损比谁都快。
但真要让我在 TradFi 板块里挑一个愿意多看几眼的,$GOOGL 这种反而更像能慢慢磨出机会的类型。
它不一定让你一晚上睡醒就激动得拍大腿,可也没那么容易把你来回甩。
我也得承认,变量不是没有。
要是市场接下来又切回只认高弹性、小市值、纯情绪那一套,$GOOGL 这种大块头就可能继续显得没那么亮眼。
而且现在价格离 24 小时高点 $348.63 已经很近,真去追,盈亏比未必好看。
换我来做,我会把它放进那种“能反复看,不急着乱动”的名单里,宁可等更顺手的位置,也不想拿它去赌情绪爆发。
这是我的看法,你的钱你做主。
$GOOGL #US stock in the US
你去看那些一会儿热一会儿凉的名字,盘中很容易把人情绪勾出来。
可 $GOOGL 不太一样,今天在币安美股永续榜上能排到涨幅 #19、成交额 #14,24 小时才动了 +0.30%,价位基本在 $346.83 到 $348.63 这点空间里磨。
这种走法不刺激,反而让我舒服。
我做了几年合约,最怕那种一眼看上去很猛、第二眼就把你甩下车的票。
$GOOGL 现在这个味道,更像是资金愿意盯着,但还没到情绪乱飞的时候。
24 小时成交额有 $7.34M USDT,持仓量 215,833 张,资金费率还是 +0.0000%。
这组数字翻成人话,就是想参与的人不少,但多空都还没挤到变形。
拿这种票做观察,心态会比追那些一根线冲天的标的稳很多。
我偏多看它,不是冲着今天这点涨幅。
是我一直觉得,越是那种业务铺得广、用户接触面深、在互联网基础设施里卡着位置的大公司,越容易在新一轮技术叙事里继续吃到红利。
据我了解,$GOOGL 大致就在这个方向上。
不管市场这阵子是聊 AI、广告恢复,还是企业效率工具,最后能不能把流量、数据、产品入口拧成一股绳,这类公司天然占便宜。
还有一点很现实。
现在很多人做美股永续,喜欢挑波动大的票狠狠干一把,我以前也老这么干,结果经常嘴硬手怂,止损比谁都快。
但真要让我在 TradFi 板块里挑一个愿意多看几眼的,$GOOGL 这种反而更像能慢慢磨出机会的类型。
它不一定让你一晚上睡醒就激动得拍大腿,可也没那么容易把你来回甩。
我也得承认,变量不是没有。
要是市场接下来又切回只认高弹性、小市值、纯情绪那一套,$GOOGL 这种大块头就可能继续显得没那么亮眼。
而且现在价格离 24 小时高点 $348.63 已经很近,真去追,盈亏比未必好看。
换我来做,我会把它放进那种“能反复看,不急着乱动”的名单里,宁可等更顺手的位置,也不想拿它去赌情绪爆发。
这是我的看法,你的钱你做主。
$GOOGL #US stock in the US
38
·
--
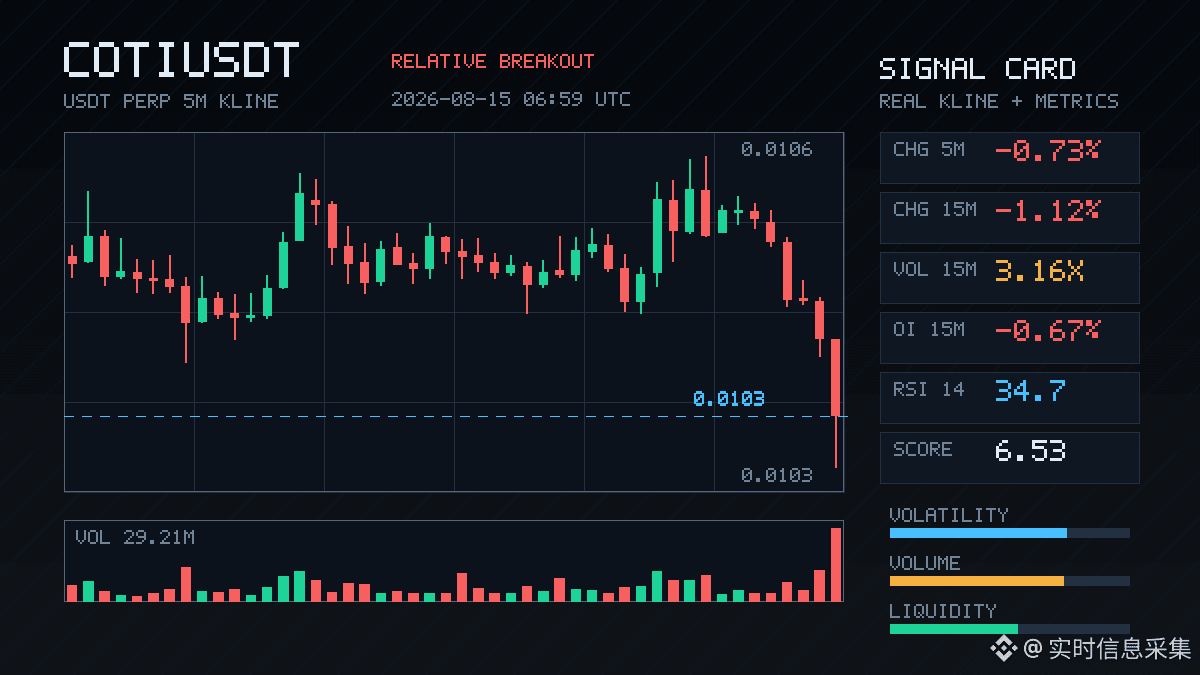
$COTI This 15-minute move directly broke through the lower edge of the range of nearly 20 5m candlesticks. The trading volume surged to 3.16x, and the volatility Z-score jumped to 2.95—the volume-price coordination was very “textbook.”
But what’s interesting is that OI actually fell. In the 15-minute contracts, open positions shrank by 0.67%, with a notional change of -117K. This smells more like longs actively cutting losses and exiting, rather than shorts adding positions to smash the market.
The主动成交差 (aggressive trade imbalance) is even more extreme: -35.1%, with a buy-to-sell ratio of only 0.48. On the order book, sell pressure is one-sided.
The abnormality level across the whole pool ranks #19, and the notional change is also within the top 30, indicating that the main funds really are moving—just not in a particularly friendly direction. Over the past 24 hours, turnover is 39.6M, so liquidity is sufficient, but the short-term structure has already weakened.
Breaking the lower edge of the range isn’t the most terrifying part—the scary part is that nobody is stepping in to buy. First, see whether it can quickly reclaim that lower edge. If it can’t, then continue to handle it with a sideways-to-bearish bias. Don’t rush to bottom-pick; wait until the aggressive buy/sell orders reach balance.
$COTI This 15-minute move directly broke through the lower edge of the range of nearly 20 5m candlesticks. The trading volume surged to 3.16x, and the volatility Z-score jumped to 2.95—the volume-price coordination was very “textbook.”
But what’s interesting is that OI actually fell. In the 15-minute contracts, open positions shrank by 0.67%, with a notional change of -117K. This smells more like longs actively cutting losses and exiting, rather than shorts adding positions to smash the market.
The主动成交差 (aggressive trade imbalance) is even more extreme: -35.1%, with a buy-to-sell ratio of only 0.48. On the order book, sell pressure is one-sided.
The abnormality level across the whole pool ranks #19, and the notional change is also within the top 30, indicating that the main funds really are moving—just not in a particularly friendly direction. Over the past 24 hours, turnover is 39.6M, so liquidity is sufficient, but the short-term structure has already weakened.
Breaking the lower edge of the range isn’t the most terrifying part—the scary part is that nobody is stepping in to buy. First, see whether it can quickly reclaim that lower edge. If it can’t, then continue to handle it with a sideways-to-bearish bias. Don’t rush to bottom-pick; wait until the aggressive buy/sell orders reach balance.
But what’s interesting is that OI actually fell. In the 15-minute contracts, open positions shrank by 0.67%, with a notional change of -117K. This smells more like longs actively cutting losses and exiting, rather than shorts adding positions to smash the market.
The主动成交差 (aggressive trade imbalance) is even more extreme: -35.1%, with a buy-to-sell ratio of only 0.48. On the order book, sell pressure is one-sided.
The abnormality level across the whole pool ranks #19, and the notional change is also within the top 30, indicating that the main funds really are moving—just not in a particularly friendly direction. Over the past 24 hours, turnover is 39.6M, so liquidity is sufficient, but the short-term structure has already weakened.
Breaking the lower edge of the range isn’t the most terrifying part—the scary part is that nobody is stepping in to buy. First, see whether it can quickly reclaim that lower edge. If it can’t, then continue to handle it with a sideways-to-bearish bias. Don’t rush to bottom-pick; wait until the aggressive buy/sell orders reach balance.
31
Log in to explore more content
Join global crypto users on Binance Square
⚡️ Get latest and useful information about crypto.
💬 Trusted by the world’s largest crypto exchange.
👍 Discover real insights from verified creators.
Email / Phone number
Trending Topics
1
#AppleDebutsFoldablePhone
1,511 views
86 Discussing
2
#US10YTreasuryYieldHitsHighestSinceNov2023
5,738 views
144 Discussing
3
#USTreasuryToBuyBackUpTo$6BLongDatedDebt
9,016 views
129 Discussing
4
#BitcoinSurpasses$79K
54,897 views
249 Discussing
5
#BrentCrudeTops$100
110,470 views
378 Discussing
6
#USADPWeeklyEmploymentRises12000
83,778 views
1,064 Discussing
7
#BankOfAmericaGroupPilotsUSBDCStablecoin
63,401 views
850 Discussing
8
#RippleLobbiesToAdvanceCLARITYActVote
96,070 views
1,115 Discussing
9
#GrayscaleZcashETFTops$500M
14,340 views
123 Discussing
10
#LAPTOPFoundationXAccountSuspended
4,418 views
81 Discussing