

#18
18
15,615 views
287 Discussing
Hot
Latest

·
--
$AIN Live Short Trade Report! 10X leverage, average entry price 0.0477, target price 0.0432576. The current unrealized profit has already made solid progress, with ROE charging toward the +18% circuit-breaker threshold 🔥
🎯 Live Trade
$AIN (AINUSDT perpetual) · SHORT · 10X
Average entry price 0.0477 → target/current price 0.0432576
Holding window: 15–30 minutes. TP1 set at 0.0432576, TP2 at 0.0402605, stop-loss at 0.0497513. Risk/reward ratio: 2.8:1
🧠 Why take the short? LLM strategy #18 : fivefold right-side top confirmation
【Watchlist setup】24h surge of +21.88%, 1h +2.87%. RSI (5m/15m) = 64.7/78.0, in overbought territory. Wait for a confirmed breakdown before acting to avoid getting trapped in a short squeeze.
【Right-side reversal】Pulled back -3.72% from the high of 0.04908 (≥ dynamic threshold of 3.40%)|5m long-upper-wick Pin Bar, wick ratio 3.6x|5m MACD bearish expansion, with growing green bars|5m RSI pulled back to 62.2|Aggressive buying faded to 45.0% (≤48.5%, sellers in control)|Funding rate +0.0254%, no short-squeeze signal
【Market check】NEUTRAL, 53 points, aligned with the trend. If a sharp drop exceeds 2.25%, automatically switch to a LIMIT order at the rebound level of 0.0475372—don't chase the short.
🛡️ Risk Management
If ROE is below +18% after 30 minutes, trigger a timeout circuit-breaker and close the position. Positions with substantial profit are exempt and may be held. Don't hold losing positions, add to the position, or try to call the bottom.
Was the right-side confirmation for this trade strong enough? Which do you think will come first: TP1 or a rebound? Check in in the comments 👇
#币安合约 #实盘战报 #量化交易 #AINUSDT
$AIN Live Short Trade Report! 10X leverage, average entry price 0.0477, target price 0.0432576. The current unrealized profit has already made solid progress, with ROE charging toward the +18% circuit-breaker threshold 🔥
🎯 Live Trade
$AIN (AINUSDT perpetual) · SHORT · 10X
Average entry price 0.0477 → target/current price 0.0432576
Holding window: 15–30 minutes. TP1 set at 0.0432576, TP2 at 0.0402605, stop-loss at 0.0497513. Risk/reward ratio: 2.8:1
🧠 Why take the short? LLM strategy #18 : fivefold right-side top confirmation
【Watchlist setup】24h surge of +21.88%, 1h +2.87%. RSI (5m/15m) = 64.7/78.0, in overbought territory. Wait for a confirmed breakdown before acting to avoid getting trapped in a short squeeze.
【Right-side reversal】Pulled back -3.72% from the high of 0.04908 (≥ dynamic threshold of 3.40%)|5m long-upper-wick Pin Bar, wick ratio 3.6x|5m MACD bearish expansion, with growing green bars|5m RSI pulled back to 62.2|Aggressive buying faded to 45.0% (≤48.5%, sellers in control)|Funding rate +0.0254%, no short-squeeze signal
【Market check】NEUTRAL, 53 points, aligned with the trend. If a sharp drop exceeds 2.25%, automatically switch to a LIMIT order at the rebound level of 0.0475372—don't chase the short.
🛡️ Risk Management
If ROE is below +18% after 30 minutes, trigger a timeout circuit-breaker and close the position. Positions with substantial profit are exempt and may be held. Don't hold losing positions, add to the position, or try to call the bottom.
Was the right-side confirmation for this trade strong enough? Which do you think will come first: TP1 or a rebound? Check in in the comments 👇
#币安合约 #实盘战报 #量化交易 #AINUSDT
🎯 Live Trade
$AIN (AINUSDT perpetual) · SHORT · 10X
Average entry price 0.0477 → target/current price 0.0432576
Holding window: 15–30 minutes. TP1 set at 0.0432576, TP2 at 0.0402605, stop-loss at 0.0497513. Risk/reward ratio: 2.8:1
🧠 Why take the short? LLM strategy #18 : fivefold right-side top confirmation
【Watchlist setup】24h surge of +21.88%, 1h +2.87%. RSI (5m/15m) = 64.7/78.0, in overbought territory. Wait for a confirmed breakdown before acting to avoid getting trapped in a short squeeze.
【Right-side reversal】Pulled back -3.72% from the high of 0.04908 (≥ dynamic threshold of 3.40%)|5m long-upper-wick Pin Bar, wick ratio 3.6x|5m MACD bearish expansion, with growing green bars|5m RSI pulled back to 62.2|Aggressive buying faded to 45.0% (≤48.5%, sellers in control)|Funding rate +0.0254%, no short-squeeze signal
【Market check】NEUTRAL, 53 points, aligned with the trend. If a sharp drop exceeds 2.25%, automatically switch to a LIMIT order at the rebound level of 0.0475372—don't chase the short.
🛡️ Risk Management
If ROE is below +18% after 30 minutes, trigger a timeout circuit-breaker and close the position. Positions with substantial profit are exempt and may be held. Don't hold losing positions, add to the position, or try to call the bottom.
Was the right-side confirmation for this trade strong enough? Which do you think will come first: TP1 or a rebound? Check in in the comments 👇
#币安合约 #实盘战报 #量化交易 #AINUSDT
146

·
--
$DODOX This sell-off looks deliberate. The 15m chart dropped 3.5%, volume expanded to 1.86x, and the close decisively broke below the lows of the last 20 5m candles. But OI fell at the same time, and 1h notional shrank by over 5%—so this wasn’t fresh shorts piling in to drive the price down. It looks more like longs capitulating and deleveraging, triggering a round of stop-losses. Aggressive trade delta was -11.6%, with a buy/sell ratio of 0.79, so the selling pressure is real. But the anomaly percentile has already reached 92.5%, ranking #18 across the entire pool, which suggests short-term sentiment may be overdone. I generally wouldn’t chase shorts in this kind of setup. I’d wait for OI to stop falling and stabilize, then see if there’s a chance of a rebound. The first retest after the breakdown is the key.
$DODOX This sell-off looks deliberate. The 15m chart dropped 3.5%, volume expanded to 1.86x, and the close decisively broke below the lows of the last 20 5m candles. But OI fell at the same time, and 1h notional shrank by over 5%—so this wasn’t fresh shorts piling in to drive the price down. It looks more like longs capitulating and deleveraging, triggering a round of stop-losses. Aggressive trade delta was -11.6%, with a buy/sell ratio of 0.79, so the selling pressure is real. But the anomaly percentile has already reached 92.5%, ranking #18 across the entire pool, which suggests short-term sentiment may be overdone. I generally wouldn’t chase shorts in this kind of setup. I’d wait for OI to stop falling and stabilize, then see if there’s a chance of a rebound. The first retest after the breakdown is the key.
4
·
--
$IRYS Long Position 20X Live Trading Recap 🔥
🎯 Average entry price 0.0294 → current price 0.0325189
ROE has reached +21.2% unrealized profit, captured within the 15–30 minute short-term trading window
📊 Live Trade Details
$IRYS (IRYSUSDT Perpetual) · LONG · 20X
LIMIT order placed at the 0.0293605 pullback level; no chasing the price
TP1 0.0325189 / TP2 0.0347549 / SL 0.0276744 · R:R 2.8:1
🧠 Earlier LLM Strategy Analysis (#18 : right-side rebound after oversold conditions stabilized)
Sharp 24h drop of -17.82%, 1h -2.45%; 5m/15m RSI at 30.4/24.8, deeply oversold
Rebounded +3.97% from the 0.02841 low (threshold 3.79%); right-side reversal confirmed
5m long-lower-wick Pin Bar, lower-wick ratio 4.4x; aggressive buying returned at 53.6%
MACD red bars expanding + five-stage market state NEUTRAL; 54-point trend-following check passed
🛡️ Risk Management Discipline
Limit orders prevent chasing a reversal; the 0.0276744 stop-loss is non-negotiable
If ROE is < +18% after 30 minutes in the position, the timeout circuit breaker is triggered; exempt if profit is substantial
This trade’s rhythm was to watchlist it on the left side and confirm on the right side—did you catch it? Check in in the comments 👇
#币安合约 #实盘战报 #量化交易 #IRYS
$IRYS Long Position 20X Live Trading Recap 🔥
🎯 Average entry price 0.0294 → current price 0.0325189
ROE has reached +21.2% unrealized profit, captured within the 15–30 minute short-term trading window
📊 Live Trade Details
$IRYS (IRYSUSDT Perpetual) · LONG · 20X
LIMIT order placed at the 0.0293605 pullback level; no chasing the price
TP1 0.0325189 / TP2 0.0347549 / SL 0.0276744 · R:R 2.8:1
🧠 Earlier LLM Strategy Analysis (#18 : right-side rebound after oversold conditions stabilized)
Sharp 24h drop of -17.82%, 1h -2.45%; 5m/15m RSI at 30.4/24.8, deeply oversold
Rebounded +3.97% from the 0.02841 low (threshold 3.79%); right-side reversal confirmed
5m long-lower-wick Pin Bar, lower-wick ratio 4.4x; aggressive buying returned at 53.6%
MACD red bars expanding + five-stage market state NEUTRAL; 54-point trend-following check passed
🛡️ Risk Management Discipline
Limit orders prevent chasing a reversal; the 0.0276744 stop-loss is non-negotiable
If ROE is < +18% after 30 minutes in the position, the timeout circuit breaker is triggered; exempt if profit is substantial
This trade’s rhythm was to watchlist it on the left side and confirm on the right side—did you catch it? Check in in the comments 👇
#币安合约 #实盘战报 #量化交易 #IRYS
🎯 Average entry price 0.0294 → current price 0.0325189
ROE has reached +21.2% unrealized profit, captured within the 15–30 minute short-term trading window
📊 Live Trade Details
$IRYS (IRYSUSDT Perpetual) · LONG · 20X
LIMIT order placed at the 0.0293605 pullback level; no chasing the price
TP1 0.0325189 / TP2 0.0347549 / SL 0.0276744 · R:R 2.8:1
🧠 Earlier LLM Strategy Analysis (#18 : right-side rebound after oversold conditions stabilized)
Sharp 24h drop of -17.82%, 1h -2.45%; 5m/15m RSI at 30.4/24.8, deeply oversold
Rebounded +3.97% from the 0.02841 low (threshold 3.79%); right-side reversal confirmed
5m long-lower-wick Pin Bar, lower-wick ratio 4.4x; aggressive buying returned at 53.6%
MACD red bars expanding + five-stage market state NEUTRAL; 54-point trend-following check passed
🛡️ Risk Management Discipline
Limit orders prevent chasing a reversal; the 0.0276744 stop-loss is non-negotiable
If ROE is < +18% after 30 minutes in the position, the timeout circuit breaker is triggered; exempt if profit is substantial
This trade’s rhythm was to watchlist it on the left side and confirm on the right side—did you catch it? Check in in the comments 👇
#币安合约 #实盘战报 #量化交易 #IRYS
193

Observed $SOL is currently ranked #18 on the CoinMarketCap trending list. In the current environment of a tightening cycle and macro liquidity pressure, the short-term hype of high-beta assets can easily mask deeper downside risks. Chasing gains blindly requires caution against valuation corrections brought by a retreating tide of liquidity. #Solana #Layer1
Observed $SOL is currently ranked #18 on the CoinMarketCap trending list. In the current environment of a tightening cycle and macro liquidity pressure, the short-term hype of high-beta assets can easily mask deeper downside risks. Chasing gains blindly requires caution against valuation corrections brought by a retreating tide of liquidity. #Solana #Layer1
26

·
--
$PUMP This 15m move is pretty interesting: price fell 0.94%, while volume jumped to 2.32x. But OI is still declining on the 1h timeframe, with only a slight increase on 15m—this looks more like short-term leveraged shorts dipping their toes in than big money positioning.
The closing price broke below the lows of the last 20 or so 5m candles. Notional change ranks #18 across the whole pool, and liquidity is solid. The active trade delta is +8.2% and the buy/sell ratio is 1.18, which suggests aggressive buying hasn't really collapsed. It looks a bit like passive selling getting absorbed by active buyers.
24h trading volume is 88M, so liquidity isn't bad. I wouldn't want to chase shorts at this level; I'll wait for leverage to get flushed out a bit before reassessing.
$PUMP This 15m move is pretty interesting: price fell 0.94%, while volume jumped to 2.32x. But OI is still declining on the 1h timeframe, with only a slight increase on 15m—this looks more like short-term leveraged shorts dipping their toes in than big money positioning.
The closing price broke below the lows of the last 20 or so 5m candles. Notional change ranks #18 across the whole pool, and liquidity is solid. The active trade delta is +8.2% and the buy/sell ratio is 1.18, which suggests aggressive buying hasn't really collapsed. It looks a bit like passive selling getting absorbed by active buyers.
24h trading volume is 88M, so liquidity isn't bad. I wouldn't want to chase shorts at this level; I'll wait for leverage to get flushed out a bit before reassessing.
The closing price broke below the lows of the last 20 or so 5m candles. Notional change ranks #18 across the whole pool, and liquidity is solid. The active trade delta is +8.2% and the buy/sell ratio is 1.18, which suggests aggressive buying hasn't really collapsed. It looks a bit like passive selling getting absorbed by active buyers.
24h trading volume is 88M, so liquidity isn't bad. I wouldn't want to chase shorts at this level; I'll wait for leverage to get flushed out a bit before reassessing.

·
--
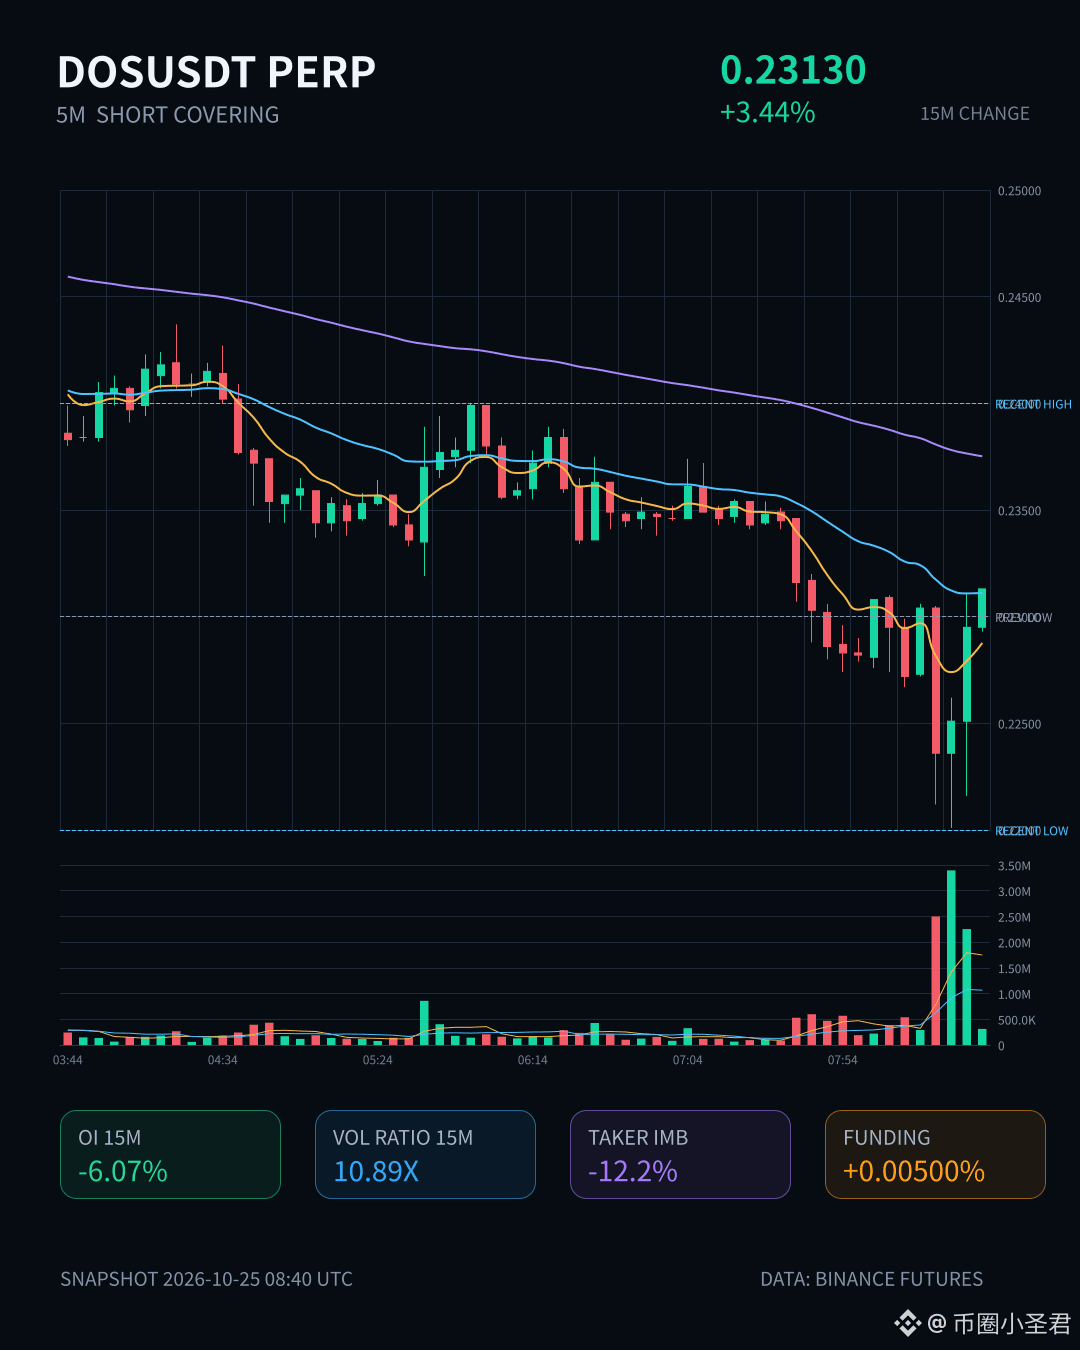
$DOS is up 3.44% over 15m, with volume surging to 10.89x, but OI is down 6% over 15m and 5.65% over 1h—price is moving sharply higher, yet positions are being closed. This is a classic short-covering rally, not fresh longs entering.
The OI anomaly percentile is 93.8%, ranking #18 across the entire pool, and it has persisted for several consecutive periods. This kind of setup is usually driven by shorts being forced to close, pushing the price up without fresh capital to support it. Net aggressive volume is -12.2% and the buy/sell ratio is 0.78, indicating that aggressive selling is actually dominant. Be careful about chasing longs—you could end up catching a falling knife.
24h trading volume is 33.62M, so liquidity is sufficient. But whether this move has legs depends on whether new longs step in after OI stops falling. At this point, it looks more like the tail end of a short-covering rally than the start of a trend.
$DOS is up 3.44% over 15m, with volume surging to 10.89x, but OI is down 6% over 15m and 5.65% over 1h—price is moving sharply higher, yet positions are being closed. This is a classic short-covering rally, not fresh longs entering.
The OI anomaly percentile is 93.8%, ranking #18 across the entire pool, and it has persisted for several consecutive periods. This kind of setup is usually driven by shorts being forced to close, pushing the price up without fresh capital to support it. Net aggressive volume is -12.2% and the buy/sell ratio is 0.78, indicating that aggressive selling is actually dominant. Be careful about chasing longs—you could end up catching a falling knife.
24h trading volume is 33.62M, so liquidity is sufficient. But whether this move has legs depends on whether new longs step in after OI stops falling. At this point, it looks more like the tail end of a short-covering rally than the start of a trend.
The OI anomaly percentile is 93.8%, ranking #18 across the entire pool, and it has persisted for several consecutive periods. This kind of setup is usually driven by shorts being forced to close, pushing the price up without fresh capital to support it. Net aggressive volume is -12.2% and the buy/sell ratio is 0.78, indicating that aggressive selling is actually dominant. Be careful about chasing longs—you could end up catching a falling knife.
24h trading volume is 33.62M, so liquidity is sufficient. But whether this move has legs depends on whether new longs step in after OI stops falling. At this point, it looks more like the tail end of a short-covering rally than the start of a trend.
·
--
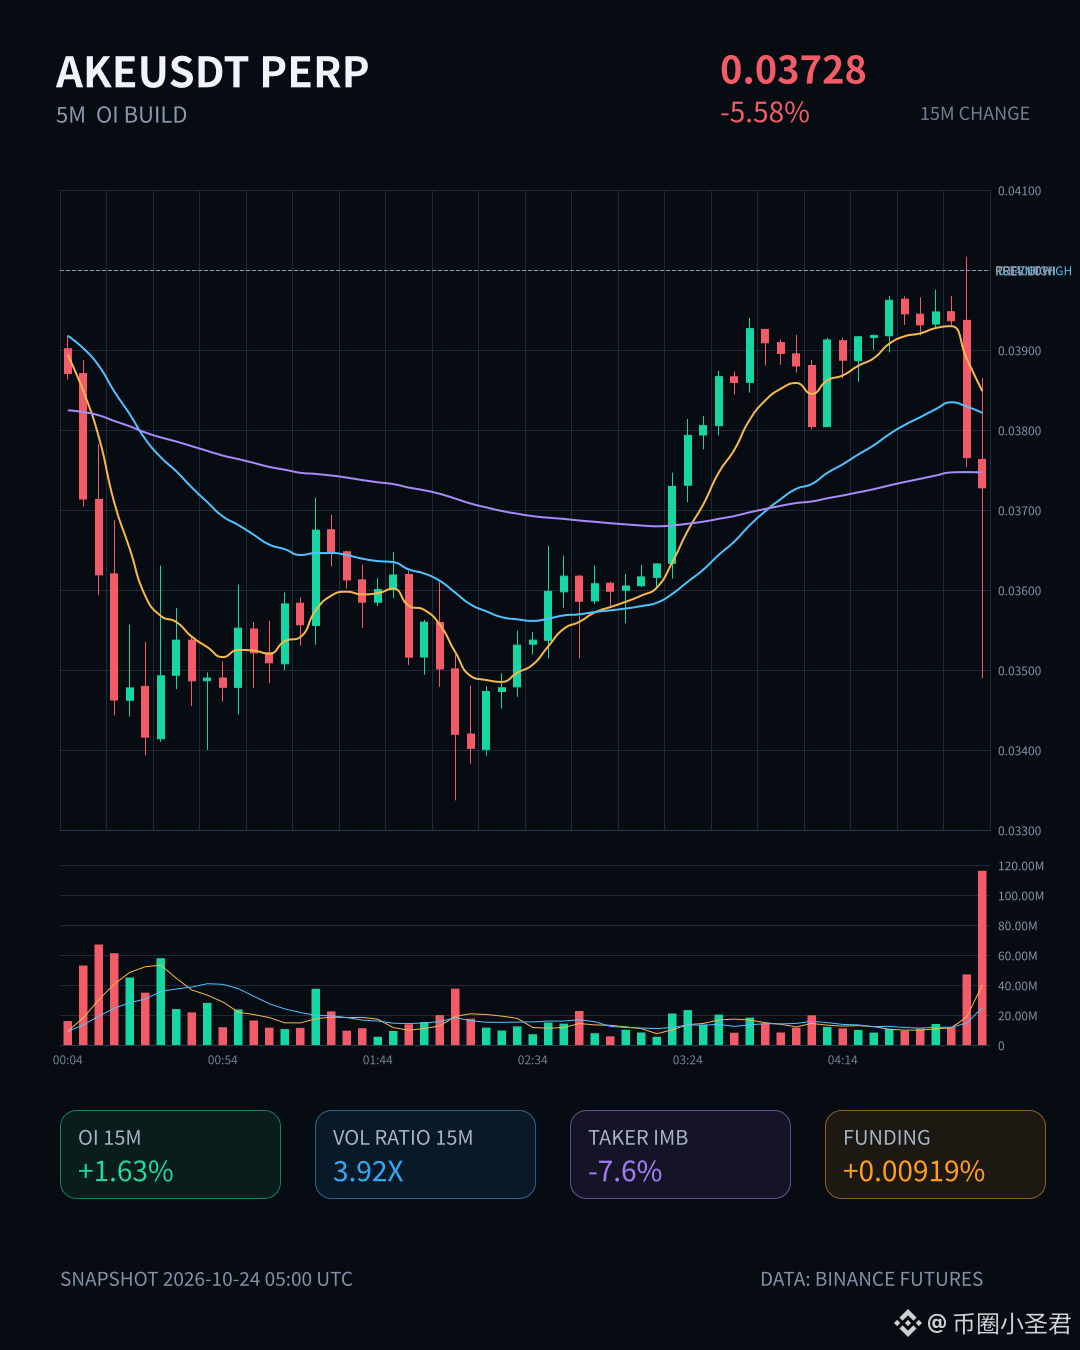
$AKE fell 5.58% in 15 minutes, with volume surging to 3.92x and OI still rising—price down and open interest up, a classic sign of leveraged shorts adding positions, not just a sell-off. The active trade delta is -7.6%, and the buy/sell ratio is 0.86, so sellers are clearly in control. The OI anomaly is at the 80.6th percentile, ranking #18 across the entire pool, while notional change ranks #8; both depth and volume confirm the move. 24-hour trading volume is 288 million, so liquidity is ample, but with this setup, don't rush to buy the dip in the short term—the shorts are still building positions.
$AKE fell 5.58% in 15 minutes, with volume surging to 3.92x and OI still rising—price down and open interest up, a classic sign of leveraged shorts adding positions, not just a sell-off. The active trade delta is -7.6%, and the buy/sell ratio is 0.86, so sellers are clearly in control. The OI anomaly is at the 80.6th percentile, ranking #18 across the entire pool, while notional change ranks #8; both depth and volume confirm the move. 24-hour trading volume is 288 million, so liquidity is ample, but with this setup, don't rush to buy the dip in the short term—the shorts are still building positions.
7

·
--
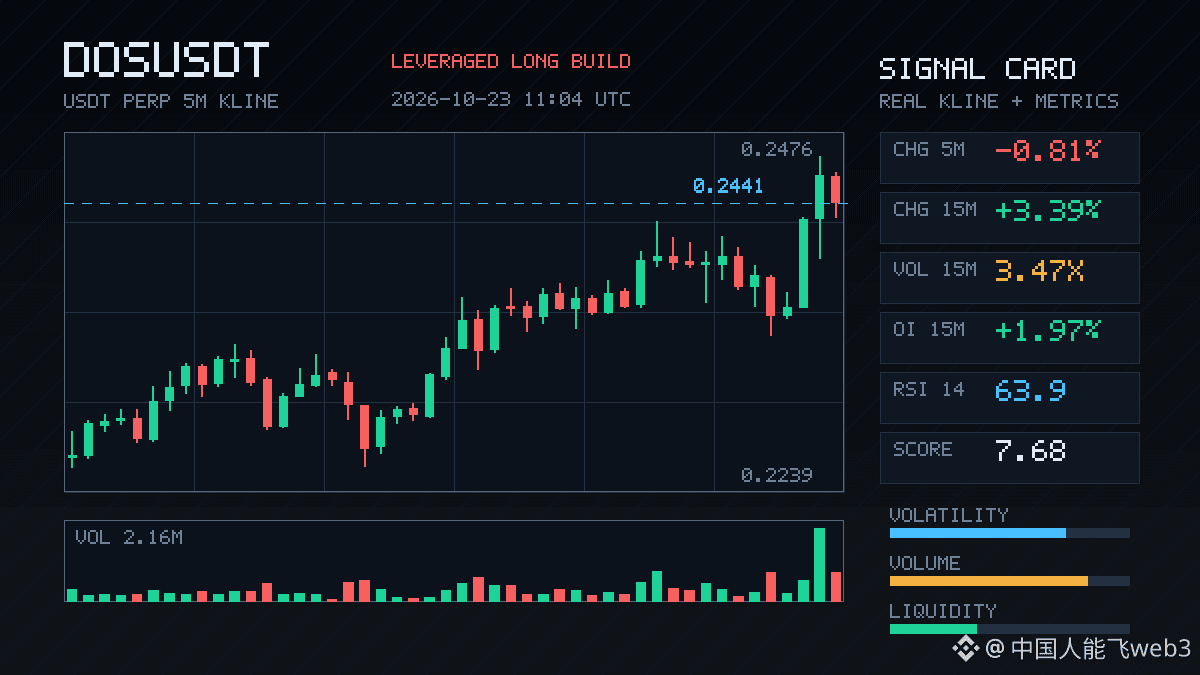
$DOS This move is getting interesting. It jumped 3.39% in 15m, with volume surging to 3.47x its usual level. OI is up 1.97% over 15m and 1.00% over 1h, so price and open interest are rising together—not the hollow bounce you get from short covering, but more like fresh leveraged longs piling in.
The OI anomaly percentile has hit 100%, ranking #3 across the entire pool, while notional change ranks #18. The move has also continued for several consecutive periods. Aggressive trade imbalance is 17.7%, and the buy/sell ratio is 1.43, showing a clear directional bias. 24h trading volume is only a little over 12M, so liquidity isn't particularly deep. With leveraged longs piling in at these levels, it could either accelerate or wick sharply. I'm not chasing it; first I'll see whether it can hold.
$DOS This move is getting interesting. It jumped 3.39% in 15m, with volume surging to 3.47x its usual level. OI is up 1.97% over 15m and 1.00% over 1h, so price and open interest are rising together—not the hollow bounce you get from short covering, but more like fresh leveraged longs piling in.
The OI anomaly percentile has hit 100%, ranking #3 across the entire pool, while notional change ranks #18. The move has also continued for several consecutive periods. Aggressive trade imbalance is 17.7%, and the buy/sell ratio is 1.43, showing a clear directional bias. 24h trading volume is only a little over 12M, so liquidity isn't particularly deep. With leveraged longs piling in at these levels, it could either accelerate or wick sharply. I'm not chasing it; first I'll see whether it can hold.
The OI anomaly percentile has hit 100%, ranking #3 across the entire pool, while notional change ranks #18. The move has also continued for several consecutive periods. Aggressive trade imbalance is 17.7%, and the buy/sell ratio is 1.43, showing a clear directional bias. 24h trading volume is only a little over 12M, so liquidity isn't particularly deep. With leveraged longs piling in at these levels, it could either accelerate or wick sharply. I'm not chasing it; first I'll see whether it can hold.
6
·
--
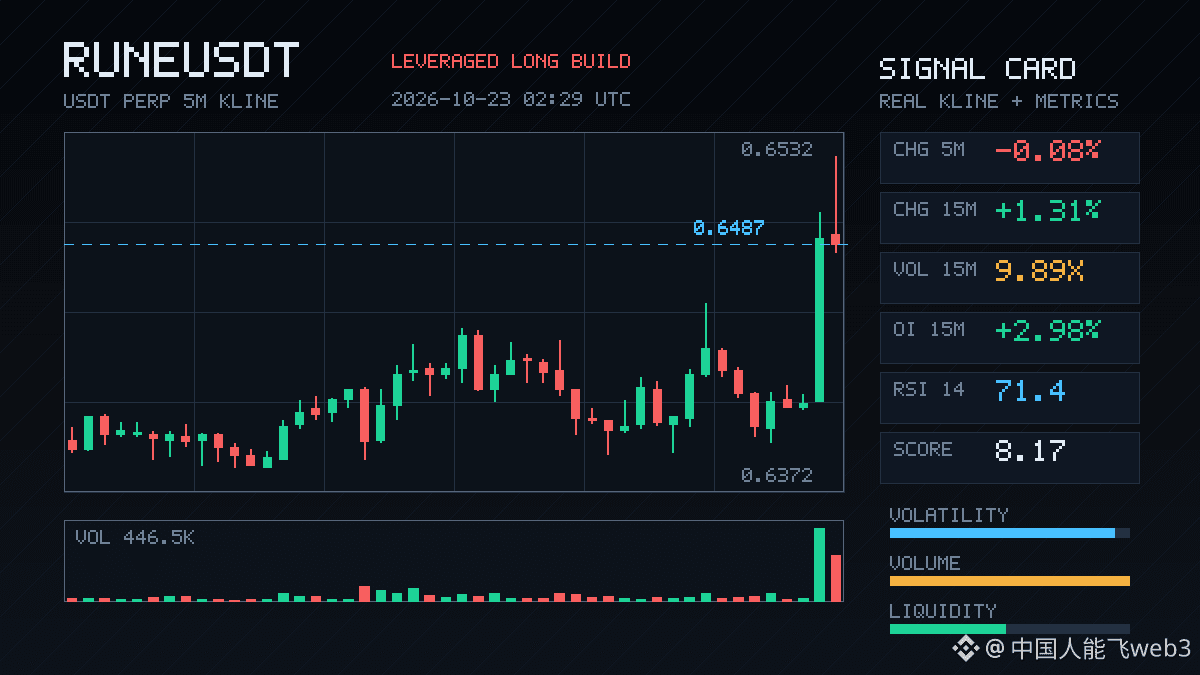
RUNE is making moves over the past 15 minutes: volume has surged to 9.89x, and the taker buy/sell ratio is 2.46, showing a clear tilt toward aggressive buying. The price is up 1.31%—nothing outrageous—but OI is up 3.61% over the past hour and 2.98% over 15 minutes, suggesting new leveraged longs are entering, rather than this being a hollow rally driven by short covering. OI is now at the 95th percentile for abnormal activity, ranking #18 across the entire pool, and the funding rate is also approaching a recent high percentile. Structurally, leveraged longs are piling in. From here, we could see a continued short squeeze—or this could be setting the stage for a pullback. If you're chasing the move, keep a close eye on it.
RUNE is making moves over the past 15 minutes: volume has surged to 9.89x, and the taker buy/sell ratio is 2.46, showing a clear tilt toward aggressive buying. The price is up 1.31%—nothing outrageous—but OI is up 3.61% over the past hour and 2.98% over 15 minutes, suggesting new leveraged longs are entering, rather than this being a hollow rally driven by short covering. OI is now at the 95th percentile for abnormal activity, ranking #18 across the entire pool, and the funding rate is also approaching a recent high percentile. Structurally, leveraged longs are piling in. From here, we could see a continued short squeeze—or this could be setting the stage for a pullback. If you're chasing the move, keep a close eye on it.
33
·
--
$PONS This 15m move has some real substance: volume jumped to 3.5x normal, the active buy/sell ratio hit 1.30, and the close broke above the highs of the last 20 5m candles. OI rose along with it, up 0.59% over 1h. The notional change isn’t huge, but structurally this looks like new leveraged longs—not flimsy short covering. It ranked #18 among anomalies across the whole pool, and depth confirmation also passed, so it’s worth keeping an eye on in the short term.
$PONS This 15m move has some real substance: volume jumped to 3.5x normal, the active buy/sell ratio hit 1.30, and the close broke above the highs of the last 20 5m candles. OI rose along with it, up 0.59% over 1h. The notional change isn’t huge, but structurally this looks like new leveraged longs—not flimsy short covering. It ranked #18 among anomalies across the whole pool, and depth confirmation also passed, so it’s worth keeping an eye on in the short term.
·
--
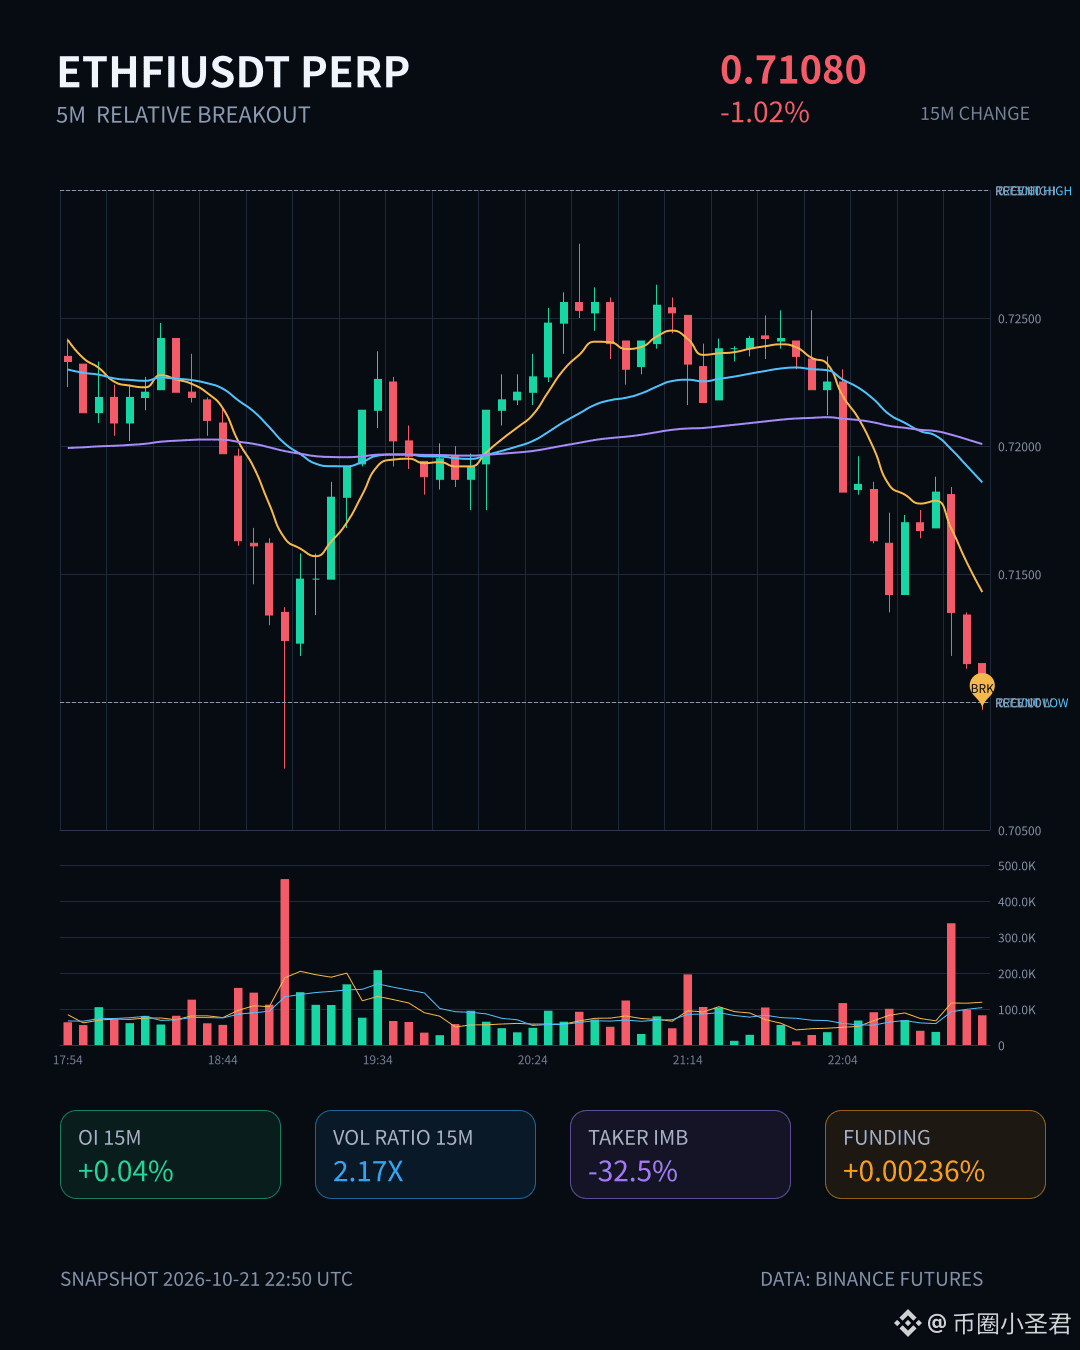
$ETHFI These 15 minutes have been something. Price fell 1%, volume shot straight up to 2.17x, the Z-score hit 2.44, and the close broke below the lows of nearly 20 5m candles—this wasn't just a little wobble; someone was really dumping.
But the OI tells an interesting story: 15m futures OI only rose 0.04%, while notional OI actually dropped by 164K net. On the 1h timeframe, it was even more pronounced: -0.20%, or -478K. When price falls and OI rises, that usually means new shorts are entering, but with notional OI shrinking, this looks more like leverage changing hands than one-sided position building. The anomaly percentile is 83.7%, ranking #18 across the whole pool. The volume is there, but aggressive order flow is -32.5%, with a buy/sell ratio of 0.51—sellers are in control.
I usually stay out when the structure looks like this. The breakdown is real, but shorts haven't built up their positions, so chasing the move could get caught in a bounce. I'll wait until OI and price move in sync.
$ETHFI These 15 minutes have been something. Price fell 1%, volume shot straight up to 2.17x, the Z-score hit 2.44, and the close broke below the lows of nearly 20 5m candles—this wasn't just a little wobble; someone was really dumping.
But the OI tells an interesting story: 15m futures OI only rose 0.04%, while notional OI actually dropped by 164K net. On the 1h timeframe, it was even more pronounced: -0.20%, or -478K. When price falls and OI rises, that usually means new shorts are entering, but with notional OI shrinking, this looks more like leverage changing hands than one-sided position building. The anomaly percentile is 83.7%, ranking #18 across the whole pool. The volume is there, but aggressive order flow is -32.5%, with a buy/sell ratio of 0.51—sellers are in control.
I usually stay out when the structure looks like this. The breakdown is real, but shorts haven't built up their positions, so chasing the move could get caught in a bounce. I'll wait until OI and price move in sync.
But the OI tells an interesting story: 15m futures OI only rose 0.04%, while notional OI actually dropped by 164K net. On the 1h timeframe, it was even more pronounced: -0.20%, or -478K. When price falls and OI rises, that usually means new shorts are entering, but with notional OI shrinking, this looks more like leverage changing hands than one-sided position building. The anomaly percentile is 83.7%, ranking #18 across the whole pool. The volume is there, but aggressive order flow is -32.5%, with a buy/sell ratio of 0.51—sellers are in control.
I usually stay out when the structure looks like this. The breakdown is real, but shorts haven't built up their positions, so chasing the move could get caught in a bounce. I'll wait until OI and price move in sync.
2
·
--
$STRK made a clean move up over 15m. The 1.50% gain may not look like much, but volume surged to 2.5 times normal, the Z-score hit 2.95, and the close held above the highs of the last 20 5m candles. Interestingly, OI fell rather than rose: 1h futures OI was down 0.32% as price moved higher—a classic short-covering pattern, not a rally driven by new longs entering.
The aggressive trade imbalance was 35.2%, and the buy/sell ratio was 2.09, so buyers clearly had the upper hand in the short term. It ranked #18 across the pool for anomalies, with notional change also near the top, and depth has confirmed the move. Still, keep an eye on the OI reduction: short-covering rallies can happen fast, but without new positions stepping in afterward, they can fizzle just as quickly.
24h trading volume is a little over 87M, and the pool isn't particularly deep. With liquidity at this level, don't chase a sharp spike; it's safer to wait for a pullback and see whether buyers step in. For now, keep watching.
$STRK made a clean move up over 15m. The 1.50% gain may not look like much, but volume surged to 2.5 times normal, the Z-score hit 2.95, and the close held above the highs of the last 20 5m candles. Interestingly, OI fell rather than rose: 1h futures OI was down 0.32% as price moved higher—a classic short-covering pattern, not a rally driven by new longs entering.
The aggressive trade imbalance was 35.2%, and the buy/sell ratio was 2.09, so buyers clearly had the upper hand in the short term. It ranked #18 across the pool for anomalies, with notional change also near the top, and depth has confirmed the move. Still, keep an eye on the OI reduction: short-covering rallies can happen fast, but without new positions stepping in afterward, they can fizzle just as quickly.
24h trading volume is a little over 87M, and the pool isn't particularly deep. With liquidity at this level, don't chase a sharp spike; it's safer to wait for a pullback and see whether buyers step in. For now, keep watching.
The aggressive trade imbalance was 35.2%, and the buy/sell ratio was 2.09, so buyers clearly had the upper hand in the short term. It ranked #18 across the pool for anomalies, with notional change also near the top, and depth has confirmed the move. Still, keep an eye on the OI reduction: short-covering rallies can happen fast, but without new positions stepping in afterward, they can fizzle just as quickly.
24h trading volume is a little over 87M, and the pool isn't particularly deep. With liquidity at this level, don't chase a sharp spike; it's safer to wait for a pullback and see whether buyers step in. For now, keep watching.
6
·
--
🎯 $PARTI Live Short Trade Update|25X, Unrealized ROE +13.9%
$PARTI perpetual · SHORT · 25X
Average entry 0.0392 → Current price 0.037029
Approx. +5.5% unrealized price gain, ROE approx. +138% (amplified by 25X)
TP1 hit; half the position closed. The remaining position is held with a breakeven stop, targeting TP2 at 0.03536.
🧠 This trade wasn’t a guess—it was derived from five layers of right-side confirmation by LLM strategy #18 :
• Up +33.73% in 24h, with another +1.55% surge in 1h; 15m RSI at 77.5, severely overbought
• Pulled back -3.02% from the high of 0.04047, breaking through the dynamic threshold of 2.91%
• 5m price broke below EMA20; the MACD histogram’s green bars are growing, signaling expanding bearish momentum
• 5m RSI pulled back to 51.6; aggressive buying cooled to 48.5%, with sellers in control
• Funding rate +0.0050%—positive, with no fuel for a short squeeze
The broader market is strongly bullish, with a BULL score of 76, but this asset’s exhaustion confidence is 94% ≥ 90%, triggering permission to trade against the trend with high confidence—that’s what gave me the conviction to open a short against the trend.
🛡️ Discipline: If, 30 minutes after entering, the price hasn’t moved away from the entry zone or rises back above the previous high of 0.04047, apply an unconditional time-based stop. The SL at 0.04064 is non-negotiable.
Wait for confirmation on the left; pull the trigger only on the right. Would you dare to follow a right-side short on this kind of exhaustion after a huge rally? Share your thoughts in the comments 👇
#币安合约 #实盘战报 #量化交易 #PARTI
🎯 $PARTI Live Short Trade Update|25X, Unrealized ROE +13.9%
$PARTI perpetual · SHORT · 25X
Average entry 0.0392 → Current price 0.037029
Approx. +5.5% unrealized price gain, ROE approx. +138% (amplified by 25X)
TP1 hit; half the position closed. The remaining position is held with a breakeven stop, targeting TP2 at 0.03536.
🧠 This trade wasn’t a guess—it was derived from five layers of right-side confirmation by LLM strategy #18 :
• Up +33.73% in 24h, with another +1.55% surge in 1h; 15m RSI at 77.5, severely overbought
• Pulled back -3.02% from the high of 0.04047, breaking through the dynamic threshold of 2.91%
• 5m price broke below EMA20; the MACD histogram’s green bars are growing, signaling expanding bearish momentum
• 5m RSI pulled back to 51.6; aggressive buying cooled to 48.5%, with sellers in control
• Funding rate +0.0050%—positive, with no fuel for a short squeeze
The broader market is strongly bullish, with a BULL score of 76, but this asset’s exhaustion confidence is 94% ≥ 90%, triggering permission to trade against the trend with high confidence—that’s what gave me the conviction to open a short against the trend.
🛡️ Discipline: If, 30 minutes after entering, the price hasn’t moved away from the entry zone or rises back above the previous high of 0.04047, apply an unconditional time-based stop. The SL at 0.04064 is non-negotiable.
Wait for confirmation on the left; pull the trigger only on the right. Would you dare to follow a right-side short on this kind of exhaustion after a huge rally? Share your thoughts in the comments 👇
#币安合约 #实盘战报 #量化交易 #PARTI
$PARTI perpetual · SHORT · 25X
Average entry 0.0392 → Current price 0.037029
Approx. +5.5% unrealized price gain, ROE approx. +138% (amplified by 25X)
TP1 hit; half the position closed. The remaining position is held with a breakeven stop, targeting TP2 at 0.03536.
🧠 This trade wasn’t a guess—it was derived from five layers of right-side confirmation by LLM strategy #18 :
• Up +33.73% in 24h, with another +1.55% surge in 1h; 15m RSI at 77.5, severely overbought
• Pulled back -3.02% from the high of 0.04047, breaking through the dynamic threshold of 2.91%
• 5m price broke below EMA20; the MACD histogram’s green bars are growing, signaling expanding bearish momentum
• 5m RSI pulled back to 51.6; aggressive buying cooled to 48.5%, with sellers in control
• Funding rate +0.0050%—positive, with no fuel for a short squeeze
The broader market is strongly bullish, with a BULL score of 76, but this asset’s exhaustion confidence is 94% ≥ 90%, triggering permission to trade against the trend with high confidence—that’s what gave me the conviction to open a short against the trend.
🛡️ Discipline: If, 30 minutes after entering, the price hasn’t moved away from the entry zone or rises back above the previous high of 0.04047, apply an unconditional time-based stop. The SL at 0.04064 is non-negotiable.
Wait for confirmation on the left; pull the trigger only on the right. Would you dare to follow a right-side short on this kind of exhaustion after a huge rally? Share your thoughts in the comments 👇
#币安合约 #实盘战报 #量化交易 #PARTI
95
·
--
$QNT Here, the 15m candle closed above the upper boundary of the previous 20 5m candles’ range. Price rose 0.62%, volume was 1.37x, and volatility Z reached 1.64—showing some signs of an emerging move.
More interestingly, OI rose in sync on both the 15m and 1h timeframes. 1h contracts were up 0.34%, with notional open interest increasing by 384K USDT. This doesn’t look like mere short covering; it looks more like new leveraged longs are piling in. The OI anomaly percentile was 85.9%, ranking #10 across the entire pool, while the notional change ranked #18. By the depth-confirmation measure, the signal from price touching the range boundary appears to have been amplified.
The one thing that doesn’t quite fit is the active trade delta at -4.6%, with a buy/sell ratio of 0.91. Sell orders were still applying light pressure during the breakout, so this move looks more like leverage is leading, while we’ll have to wait and see whether spot follows. 24h trading volume of 66M isn’t particularly substantial; for the move to continue, we’ll need to see whether the next 15m candle can absorb these small orders.
$QNT Here, the 15m candle closed above the upper boundary of the previous 20 5m candles’ range. Price rose 0.62%, volume was 1.37x, and volatility Z reached 1.64—showing some signs of an emerging move.
More interestingly, OI rose in sync on both the 15m and 1h timeframes. 1h contracts were up 0.34%, with notional open interest increasing by 384K USDT. This doesn’t look like mere short covering; it looks more like new leveraged longs are piling in. The OI anomaly percentile was 85.9%, ranking #10 across the entire pool, while the notional change ranked #18. By the depth-confirmation measure, the signal from price touching the range boundary appears to have been amplified.
The one thing that doesn’t quite fit is the active trade delta at -4.6%, with a buy/sell ratio of 0.91. Sell orders were still applying light pressure during the breakout, so this move looks more like leverage is leading, while we’ll have to wait and see whether spot follows. 24h trading volume of 66M isn’t particularly substantial; for the move to continue, we’ll need to see whether the next 15m candle can absorb these small orders.
More interestingly, OI rose in sync on both the 15m and 1h timeframes. 1h contracts were up 0.34%, with notional open interest increasing by 384K USDT. This doesn’t look like mere short covering; it looks more like new leveraged longs are piling in. The OI anomaly percentile was 85.9%, ranking #10 across the entire pool, while the notional change ranked #18. By the depth-confirmation measure, the signal from price touching the range boundary appears to have been amplified.
The one thing that doesn’t quite fit is the active trade delta at -4.6%, with a buy/sell ratio of 0.91. Sell orders were still applying light pressure during the breakout, so this move looks more like leverage is leading, while we’ll have to wait and see whether spot follows. 24h trading volume of 66M isn’t particularly substantial; for the move to continue, we’ll need to see whether the next 15m candle can absorb these small orders.
5

·
--
$BTW This drop accompanied by a simultaneous decline in open interest looks more like a wave of longs hitting stop-losses and exiting than an outright short attack, so it shouldn’t be simply classified as aggressive selling by shorts.
Over 15m, price fell 2.02% on 1.49x volume, with the close breaking below the lower bound of the last 20 5m candles. The aggressive trade delta was -17%, and the buy/sell ratio was 0.71, so selling pressure is indeed present. But OI was down 0.21% over 15m and 0.74% over 1h, while notional value shrank by nearly 4M USDT—a typical deleveraging pattern in which prices fall as leverage contracts at the same time.
Notably, the OI anomaly percentile has reached 81.7%, ranking #18 across the full pool for anomalies and #3 for notional change, while the funding rate remains in a high percentile relative to recent levels. This kind of setup often means a batch of crowded long positions has been flushed out, though the market has not yet been completely cleared. If OI continues to decline without price making new lows, it may be worth watching for signs of stabilization. If funding stays elevated and OI starts building back up, extra caution is warranted. For now, let’s see how the market develops.
$BTW This drop accompanied by a simultaneous decline in open interest looks more like a wave of longs hitting stop-losses and exiting than an outright short attack, so it shouldn’t be simply classified as aggressive selling by shorts.
Over 15m, price fell 2.02% on 1.49x volume, with the close breaking below the lower bound of the last 20 5m candles. The aggressive trade delta was -17%, and the buy/sell ratio was 0.71, so selling pressure is indeed present. But OI was down 0.21% over 15m and 0.74% over 1h, while notional value shrank by nearly 4M USDT—a typical deleveraging pattern in which prices fall as leverage contracts at the same time.
Notably, the OI anomaly percentile has reached 81.7%, ranking #18 across the full pool for anomalies and #3 for notional change, while the funding rate remains in a high percentile relative to recent levels. This kind of setup often means a batch of crowded long positions has been flushed out, though the market has not yet been completely cleared. If OI continues to decline without price making new lows, it may be worth watching for signs of stabilization. If funding stays elevated and OI starts building back up, extra caution is warranted. For now, let’s see how the market develops.
Over 15m, price fell 2.02% on 1.49x volume, with the close breaking below the lower bound of the last 20 5m candles. The aggressive trade delta was -17%, and the buy/sell ratio was 0.71, so selling pressure is indeed present. But OI was down 0.21% over 15m and 0.74% over 1h, while notional value shrank by nearly 4M USDT—a typical deleveraging pattern in which prices fall as leverage contracts at the same time.
Notably, the OI anomaly percentile has reached 81.7%, ranking #18 across the full pool for anomalies and #3 for notional change, while the funding rate remains in a high percentile relative to recent levels. This kind of setup often means a batch of crowded long positions has been flushed out, though the market has not yet been completely cleared. If OI continues to decline without price making new lows, it may be worth watching for signs of stabilization. If funding stays elevated and OI starts building back up, extra caution is warranted. For now, let’s see how the market develops.
·
--
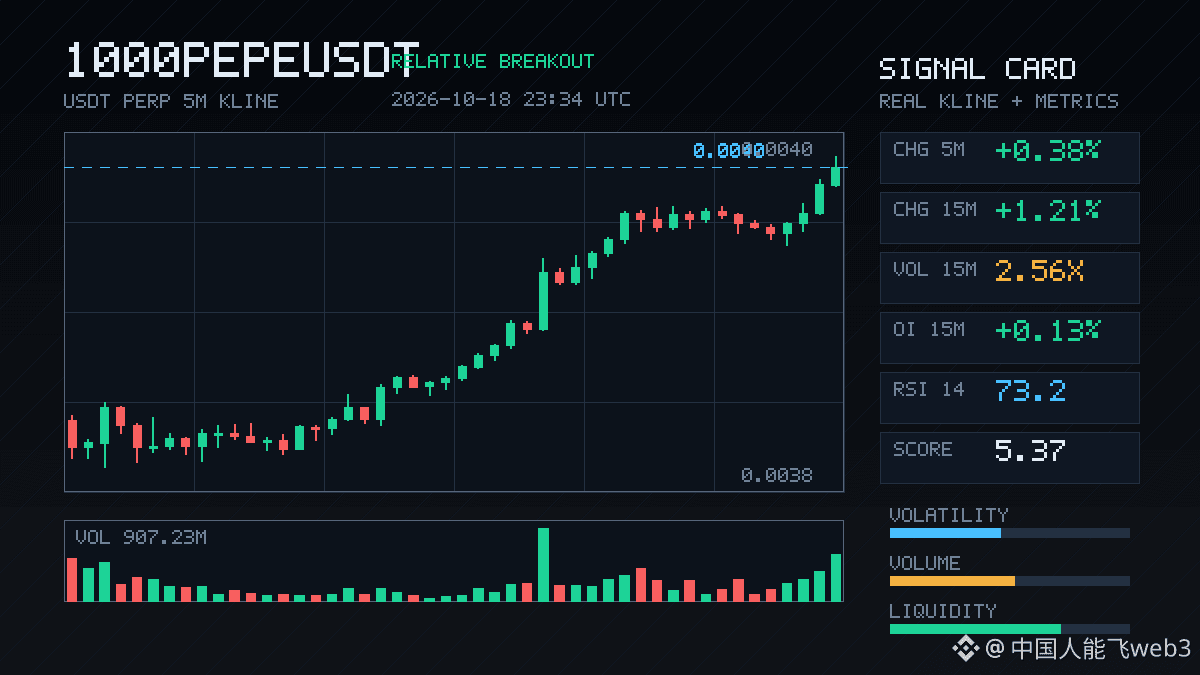
$1000PEPE’s rally has some real strength behind it. On the 15m chart, volume surged 2.56x and price pushed higher, with the close breaking above the highs of the last 20 5m candles. The taker buy/sell imbalance is 22.1%, and the buy/sell ratio is 1.57—buyers are genuinely chasing.
More interestingly, its OI anomaly percentile hit 97.4%, ranking #18 across the pool and #12 for notional change. OI is rising along with price, which looks less like short covering and more like new leveraged longs entering. OI dipped slightly on the 1h chart, but notional change is still positive, so the structure remains intact.
24h trading volume is 135 million, so there’s enough liquidity. The question is whether this move keeps squeezing shorts higher or first shakes out the late buyers before continuing. Keep an eye on how price reacts around the previous high.
$1000PEPE’s rally has some real strength behind it. On the 15m chart, volume surged 2.56x and price pushed higher, with the close breaking above the highs of the last 20 5m candles. The taker buy/sell imbalance is 22.1%, and the buy/sell ratio is 1.57—buyers are genuinely chasing.
More interestingly, its OI anomaly percentile hit 97.4%, ranking #18 across the pool and #12 for notional change. OI is rising along with price, which looks less like short covering and more like new leveraged longs entering. OI dipped slightly on the 1h chart, but notional change is still positive, so the structure remains intact.
24h trading volume is 135 million, so there’s enough liquidity. The question is whether this move keeps squeezing shorts higher or first shakes out the late buyers before continuing. Keep an eye on how price reacts around the previous high.
More interestingly, its OI anomaly percentile hit 97.4%, ranking #18 across the pool and #12 for notional change. OI is rising along with price, which looks less like short covering and more like new leveraged longs entering. OI dipped slightly on the 1h chart, but notional change is still positive, so the structure remains intact.
24h trading volume is 135 million, so there’s enough liquidity. The question is whether this move keeps squeezing shorts higher or first shakes out the late buyers before continuing. Keep an eye on how price reacts around the previous high.
5
·
--
$LIT This drop is looking pretty serious. On the 15m chart, volume surged to more than 6 times its usual level, and price broke below the lows of the past 20 5m candles. Aggressive trade delta was -11.5%, and the buy/sell ratio fell to just 0.79—clear signs that sellers are driving the move.
What’s more interesting is OI: price fell, but OI kept rising over several consecutive periods—up 0.49% on the 1h, with an anomaly percentile of 87.9%, and the pool-wide notional change ranked #18. This structure looks less like a cascade of long stop-outs and more like new leveraged shorts entering. The funding rate is also still at a high percentile relative to recent levels, suggesting shorts are willing to pay to hold their positions.
However, notional change is negative (-539K / -841K USDT), which means the increase in positions also includes some notional shrinkage from positions being closed. Whether new shorts are in control or both sides are adding to a wager remains to be seen—watch whether the next candle can hold above the lower end of the range. The breakdown has happened; continuation still needs confirmation. Don’t rush to chase it.
$LIT This drop is looking pretty serious. On the 15m chart, volume surged to more than 6 times its usual level, and price broke below the lows of the past 20 5m candles. Aggressive trade delta was -11.5%, and the buy/sell ratio fell to just 0.79—clear signs that sellers are driving the move.
What’s more interesting is OI: price fell, but OI kept rising over several consecutive periods—up 0.49% on the 1h, with an anomaly percentile of 87.9%, and the pool-wide notional change ranked #18. This structure looks less like a cascade of long stop-outs and more like new leveraged shorts entering. The funding rate is also still at a high percentile relative to recent levels, suggesting shorts are willing to pay to hold their positions.
However, notional change is negative (-539K / -841K USDT), which means the increase in positions also includes some notional shrinkage from positions being closed. Whether new shorts are in control or both sides are adding to a wager remains to be seen—watch whether the next candle can hold above the lower end of the range. The breakdown has happened; continuation still needs confirmation. Don’t rush to chase it.
What’s more interesting is OI: price fell, but OI kept rising over several consecutive periods—up 0.49% on the 1h, with an anomaly percentile of 87.9%, and the pool-wide notional change ranked #18. This structure looks less like a cascade of long stop-outs and more like new leveraged shorts entering. The funding rate is also still at a high percentile relative to recent levels, suggesting shorts are willing to pay to hold their positions.
However, notional change is negative (-539K / -841K USDT), which means the increase in positions also includes some notional shrinkage from positions being closed. Whether new shorts are in control or both sides are adding to a wager remains to be seen—watch whether the next candle can hold above the lower end of the range. The breakdown has happened; continuation still needs confirmation. Don’t rush to chase it.
1
·
--
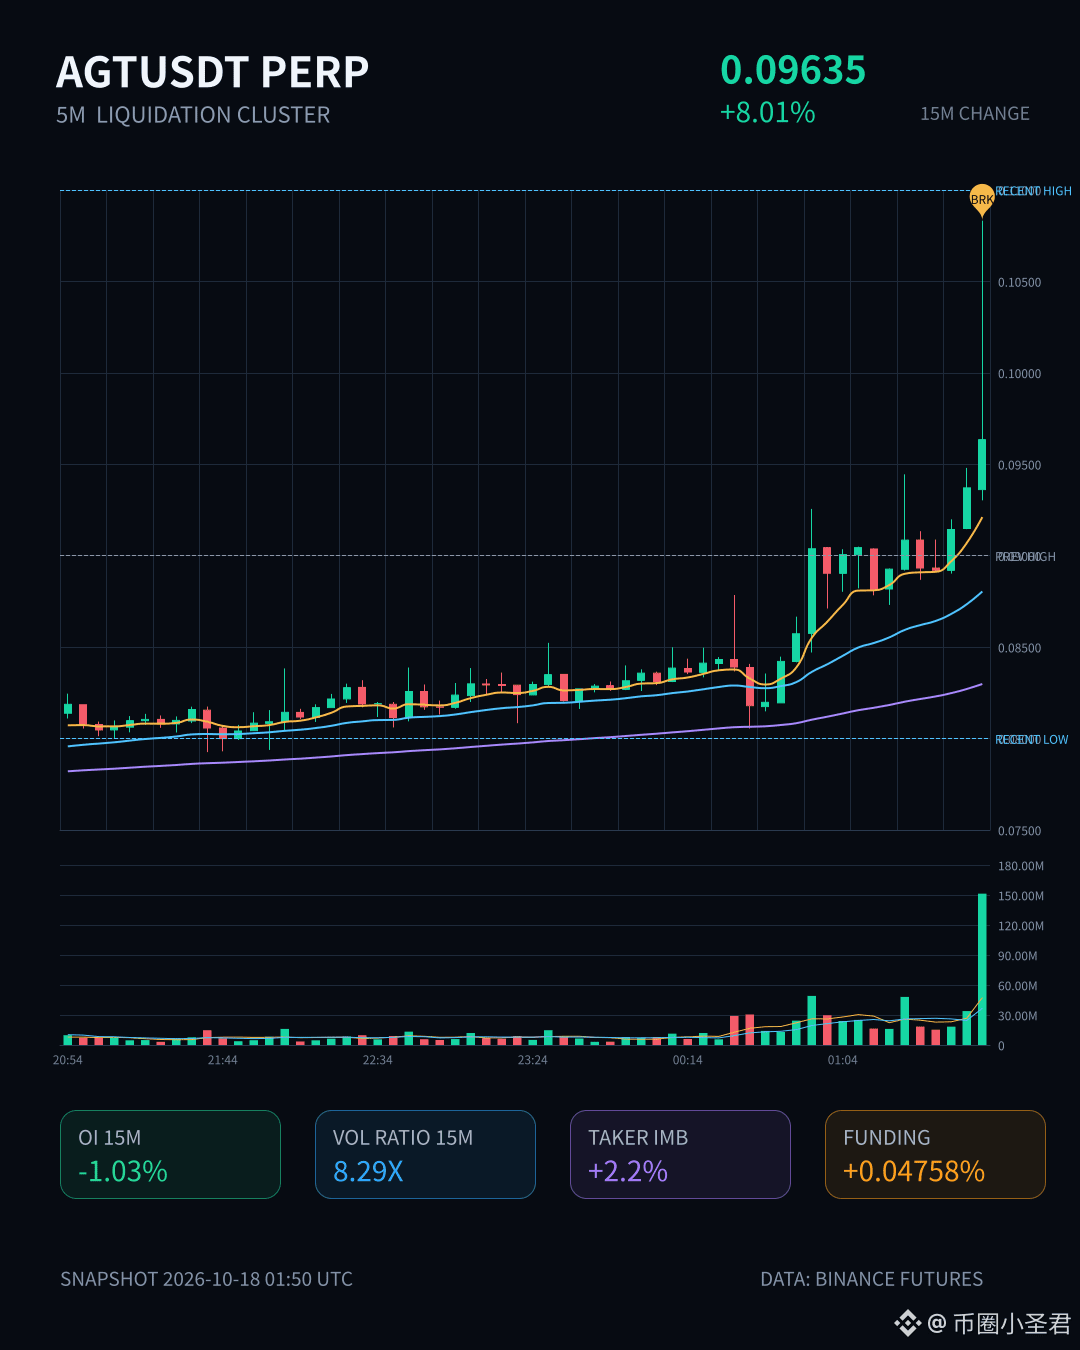
$AGT made a pretty aggressive move here, ripping straight up 8 points on the 15m chart. The volume speaks for itself—over 8x normal volume is no joke. But look closely and OI is actually falling. Price up, open interest down—that pattern feels all too familiar: shorts are getting squeezed, with short covering driving the move, rather than healthy gains from new longs entering.
Liquidations are concentrated on the buy side. The 245K in proxy volume isn't particularly huge, but there's a clear sign of forced closing. 24h trading volume is 842M, so liquidity is sufficient, but given this structure, be careful chasing longs—a short-covering rally can come and go fast. OI is at an anomalous 93rd percentile, ranking #18 across the entire pool. That's not a signal you can ignore.
$AGT made a pretty aggressive move here, ripping straight up 8 points on the 15m chart. The volume speaks for itself—over 8x normal volume is no joke. But look closely and OI is actually falling. Price up, open interest down—that pattern feels all too familiar: shorts are getting squeezed, with short covering driving the move, rather than healthy gains from new longs entering.
Liquidations are concentrated on the buy side. The 245K in proxy volume isn't particularly huge, but there's a clear sign of forced closing. 24h trading volume is 842M, so liquidity is sufficient, but given this structure, be careful chasing longs—a short-covering rally can come and go fast. OI is at an anomalous 93rd percentile, ranking #18 across the entire pool. That's not a signal you can ignore.
Liquidations are concentrated on the buy side. The 245K in proxy volume isn't particularly huge, but there's a clear sign of forced closing. 24h trading volume is 842M, so liquidity is sufficient, but given this structure, be careful chasing longs—a short-covering rally can come and go fast. OI is at an anomalous 93rd percentile, ranking #18 across the entire pool. That's not a signal you can ignore.
32
·
--
ICP’s 15m move is looking interesting: the price is up 0.64%, breaking above the top of the recent 20-bar 5m range. Volume has expanded to 1.62x, and the aggressive buy/sell ratio has surged to 3.97, with buying clearly dominating. But OI is falling—negative on both the 15m and 1h timeframes—even as notional change is slightly positive. That’s a classic short-covering pattern: the move is being driven by shorts being forced to cover, not by new longs entering. The anomaly percentile is 76.2%, ranking #18 across the whole pool. Not top-tier, but still worth watching. 24h trading volume is only $16M, so liquidity is thin. Be cautious when chasing this volume spike, and don’t mistake short covering for the start of a trend.
ICP’s 15m move is looking interesting: the price is up 0.64%, breaking above the top of the recent 20-bar 5m range. Volume has expanded to 1.62x, and the aggressive buy/sell ratio has surged to 3.97, with buying clearly dominating. But OI is falling—negative on both the 15m and 1h timeframes—even as notional change is slightly positive. That’s a classic short-covering pattern: the move is being driven by shorts being forced to cover, not by new longs entering. The anomaly percentile is 76.2%, ranking #18 across the whole pool. Not top-tier, but still worth watching. 24h trading volume is only $16M, so liquidity is thin. Be cautious when chasing this volume spike, and don’t mistake short covering for the start of a trend.
3
·
--
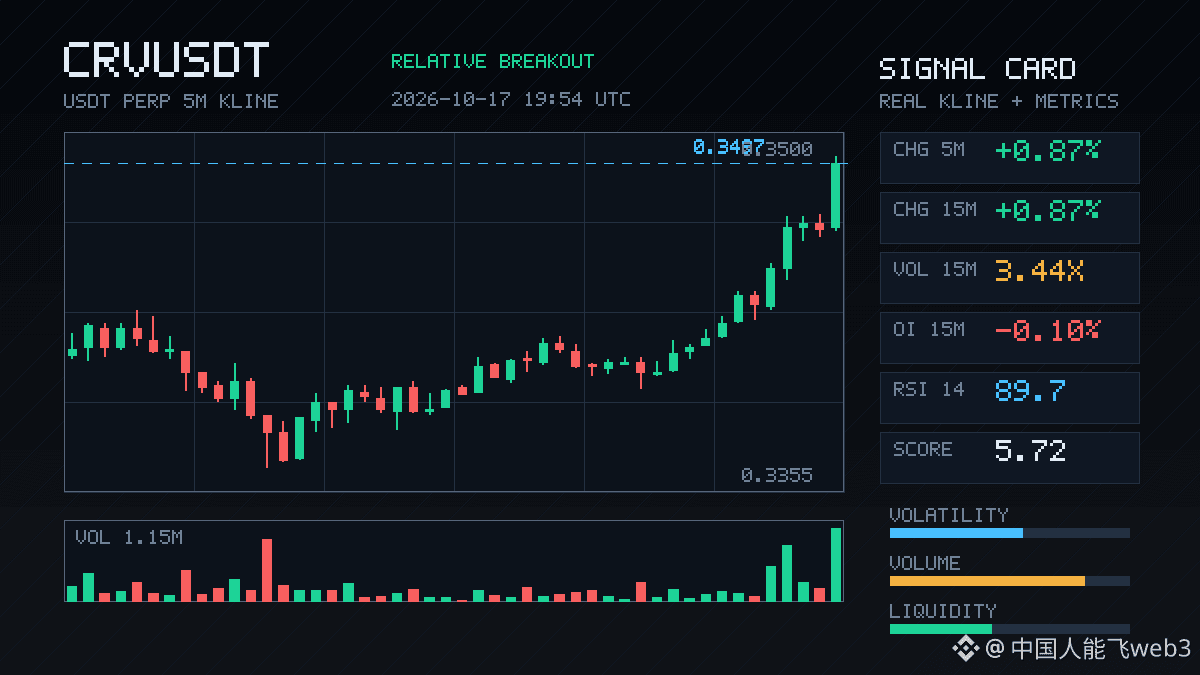
$CRV rallied 0.87% at 3:30 a.m., with volume surging to 3.44 times its previous level. But OI on the 15m timeframe edged down slightly—price up, open interest down. This isn’t fresh longs entering; it looks more like shorts covering or positions being closed out involuntarily.
The taker flow delta was +20.3%, the buy/sell ratio was 1.51, and the funding rate was also in a high percentile recently. This suggests the buying was biased in one direction, but OI didn’t rise along with price, so there’s limited appetite among bulls to add to their positions. OI on the 1h timeframe did tick up slightly (+0.05%, notional +457K), with decent consistency. Its anomaly percentile across the full pool was 73.6%, ranking #18; notional change ranked #37—toward the upper end of the middle tier.
The close broke above the upper boundary of the recent 20-bar 5m range, with volume confirming the move, but the structure isn’t very strong. With this combination of rising volume and price but falling OI, I’d lean toward waiting and seeing—let’s wait for OI and price to move in sync before making a call. Otherwise, the price could easily pull back once the short covering ends.
$CRV rallied 0.87% at 3:30 a.m., with volume surging to 3.44 times its previous level. But OI on the 15m timeframe edged down slightly—price up, open interest down. This isn’t fresh longs entering; it looks more like shorts covering or positions being closed out involuntarily.
The taker flow delta was +20.3%, the buy/sell ratio was 1.51, and the funding rate was also in a high percentile recently. This suggests the buying was biased in one direction, but OI didn’t rise along with price, so there’s limited appetite among bulls to add to their positions. OI on the 1h timeframe did tick up slightly (+0.05%, notional +457K), with decent consistency. Its anomaly percentile across the full pool was 73.6%, ranking #18; notional change ranked #37—toward the upper end of the middle tier.
The close broke above the upper boundary of the recent 20-bar 5m range, with volume confirming the move, but the structure isn’t very strong. With this combination of rising volume and price but falling OI, I’d lean toward waiting and seeing—let’s wait for OI and price to move in sync before making a call. Otherwise, the price could easily pull back once the short covering ends.
The taker flow delta was +20.3%, the buy/sell ratio was 1.51, and the funding rate was also in a high percentile recently. This suggests the buying was biased in one direction, but OI didn’t rise along with price, so there’s limited appetite among bulls to add to their positions. OI on the 1h timeframe did tick up slightly (+0.05%, notional +457K), with decent consistency. Its anomaly percentile across the full pool was 73.6%, ranking #18; notional change ranked #37—toward the upper end of the middle tier.
The close broke above the upper boundary of the recent 20-bar 5m range, with volume confirming the move, but the structure isn’t very strong. With this combination of rising volume and price but falling OI, I’d lean toward waiting and seeing—let’s wait for OI and price to move in sync before making a call. Otherwise, the price could easily pull back once the short covering ends.
1
Log in to explore more content
Join global crypto users on Binance Square
⚡️ Get latest and useful information about crypto.
💬 Trusted by the world’s largest crypto exchange.
👍 Discover real insights from verified creators.
Email / Phone number
Trending Topics
1
#BinancePick
3M views
152,382 Discussing
2
#EarningsSeason
5.3M views
25,899 Discussing
3
#AnthropicTTMRevenueGrewAbout1200%
25,481 views
376 Discussing
4
#AnthropicS1ExpectedToday
23,997 views
316 Discussing
5
#SouthKoreaReportedlyWeighsFourthCryptoTaxDelay
28,653 views
439 Discussing
6
#FranklinTempletonFilesForTwoDividendToBitcoinETFs
37,732 views
521 Discussing
7
#StrategyMSTRSurpassesNasdaqInMarketCap
28,370 views
377 Discussing
8
#CanadaProposesStablecoinRedemptionWithin3BusinessDays
1,266 views
36 Discussing
9
#ElectrumWalletBugLetRogueServersStealFunds
29,769 views
455 Discussing
10
#ArgentineCourtDismissesLIBRACaseAgainstMilei
44,714 views
560 Discussing