

#13
13
64,515 views
412 Discussing
Hot
Latest

·
--
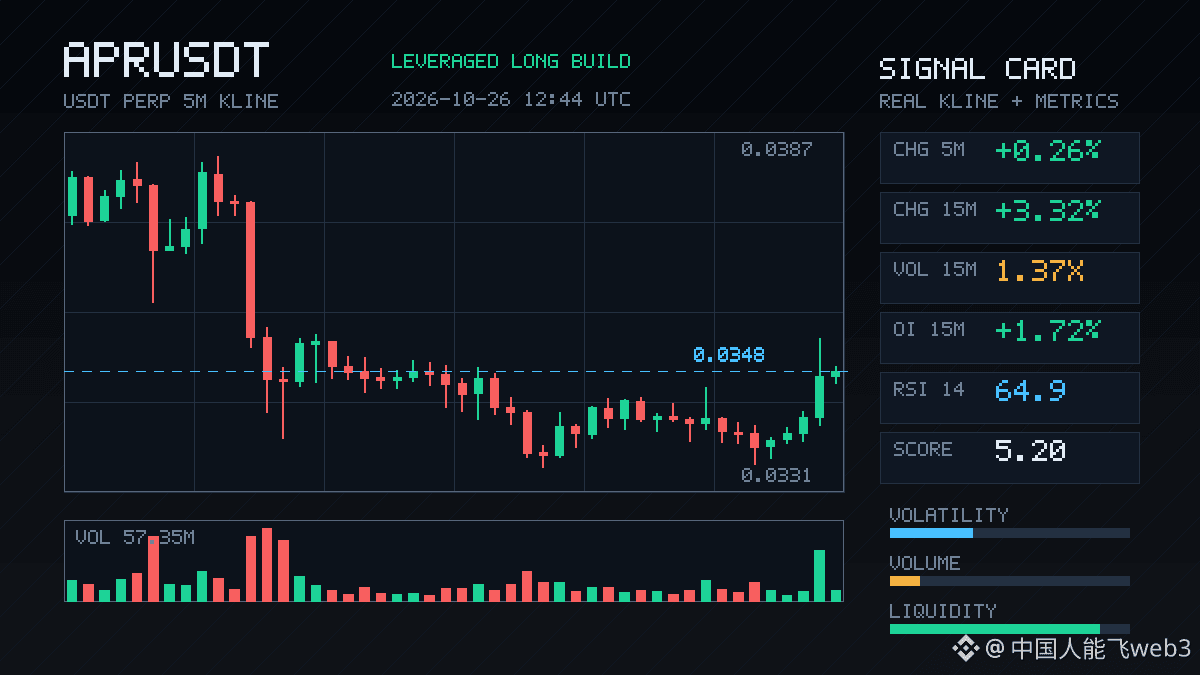
$APR has seen some action over the past 15 minutes: price is up 3.32%, while OI rose in tandem by 1.72%. Its notional change ranks #13 across the entire pool. This doesn’t look like short covering; it looks more like new leveraged longs entering the market. The active trade imbalance is 11.3%, and the buy/sell ratio is 1.26, indicating short-term buying pressure is dominant. However, the OI anomaly percentile is already at 74.8%, so leverage is elevated. If price stalls from here, watch out for crowded longs turning against the market. First, let’s see if this move can hold.
$APR has seen some action over the past 15 minutes: price is up 3.32%, while OI rose in tandem by 1.72%. Its notional change ranks #13 across the entire pool. This doesn’t look like short covering; it looks more like new leveraged longs entering the market. The active trade imbalance is 11.3%, and the buy/sell ratio is 1.26, indicating short-term buying pressure is dominant. However, the OI anomaly percentile is already at 74.8%, so leverage is elevated. If price stalls from here, watch out for crowded longs turning against the market. First, let’s see if this move can hold.
2

·
--
$ARIA LONG · 10X · ROE +66.6% 🚀
Just wrapped up a live trade—here’s the fresh play-by-play!
🎯 Average entry: 0.0886 → Current price: 0.0945
At 10X leverage, unrealized gains have reached +66.6% ROE
TP1 at 0.09447 is within reach; TP2 target: 0.09925; hard stop: 0.08411
🧠 This trade wasn’t a guess—it was automatically laid out by strategy #13 :
15m moving averages aligned bullishly (price > EMA20 > EMA60); entered long on a pullback to EMA20 support
MACD histogram bars are shrinking but still in bullish territory; RSI at 61.23, so no chasing
Volume ratio 1.98x, aggressive buying at 50.7%—buyers are providing support
OI signal: “price down, OI down”—long stops cleared out and leverage flushed, which may actually create a dip-buying opportunity
Trade value score: 95.5/100; risk/reward ratio: 2.8:1
🛡️ Same rules as always: hold for 39–120 minutes. If after 33 minutes price hasn’t moved at least +0.3% beyond the cost basis, or the 5m/15m moving averages cross against the position, exit at market without hesitation. No holding and hoping, no adding to the position, no calling the top.
Did you catch this pullback long? Is ARIA headed for TP2 next, or will it shake out first? Check in below and share your entry 👇
#币安合约 #实盘战报 #量化交易 #ARIA
1
·
--
$ARIA Long trade live update! 10X leverage, current unrealized ROE has reached +6.3% 📈
🎯 Live trade details
$ARIA (ARIAUSDT Perpetual) · LONG · 10X
Average entry price 0.08888 → current price 0.0944754
TP1 hit, TP2 at 0.099257, stop loss at 0.0841154
Risk-reward ratio R:R 2.8:1, holding window 39~120 minutes
🧠 Why I dared to take this trade
Triggered by automated orchestration from LLM strategy #13 , with confidence from multi-timeframe confluence:
· 15m moving averages are aligned bullishly: price > EMA20 > EMA60; buying the pullback to the moving averages
· 15m volume ratio 1.98x, aggressive buying 50.7%, score 95.5/100
· OI signal: “price down, OI down”—long stops are being flushed and leverage is coming off; this isn't major players dumping
· MACD histogram bars are shrinking, RSI 61.23; momentum is fading, but the structure is intact—an ideal dip-buying opportunity
🛡️ Risk management discipline
If, 33 minutes after entry, price hasn't moved at least +0.3% beyond the entry-cost zone, or if the 5m/15m moving averages cross in the opposite direction, the strict time-stop rule requires an unconditional market close. No holding through losses, no adding to the position.
Did you catch this trade? Now that TP1 has hit, would you take profit on half or hold the whole position? Share your entry price in the comments—I want to see whose average price is best 👇
#币安合约 #实盘战报 #量化交易 #ARIA
3
·
--
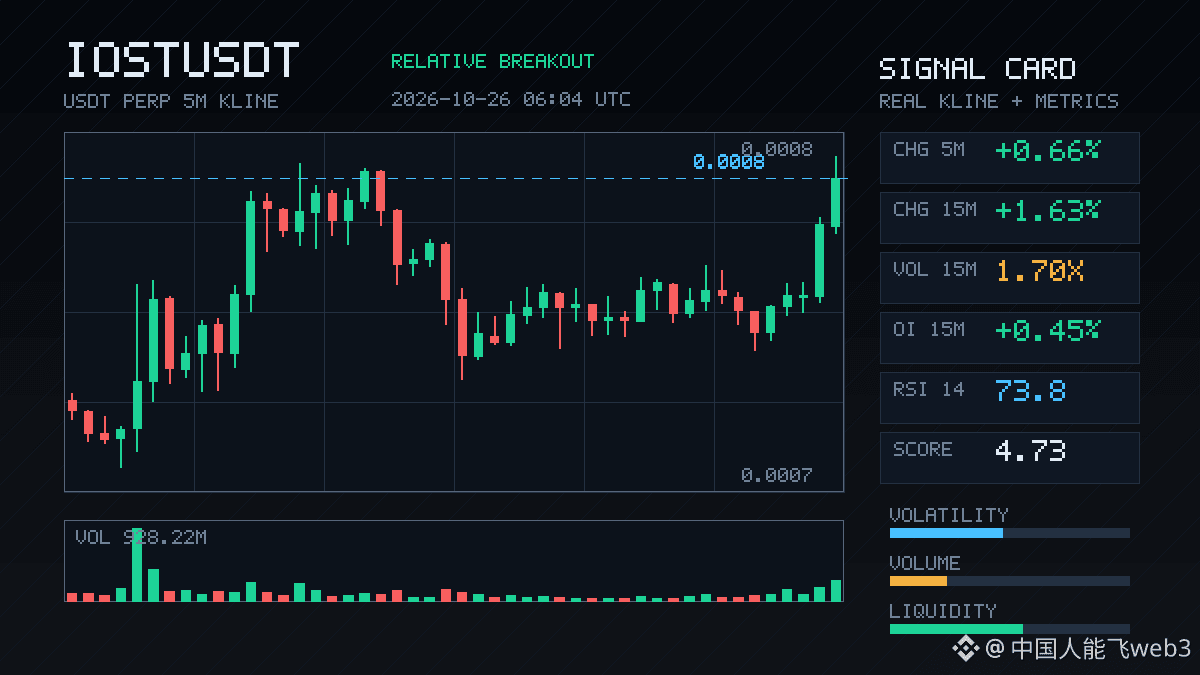
This 15m move in $IOST is interesting. The gain of 1.63% isn't huge, but volume surged to 1.70x, with a buy/sell ratio of 2.02 and an aggressive trade imbalance of 33.8%—clearly, buyers are driving the move. OI is up 0.45% over 15m and 0.21% over 1h. With price rising as leveraged longs enter, the structure points more toward new leveraged participation than a short-covering squeeze. The closing price has just broken above the highs of the last 20 5m candles, reaching the edge of the recent range. Its anomaly percentile across the full pool is 89.3%, ranking #13, and it also passes the depth confirmation: volume is above normal and aggressive trades are skewed to the buy side. 24h trading volume is 45.4M, so liquidity isn't especially deep. An anomaly of this size is worth watching to see whether the price can hold.
This 15m move in $IOST is interesting. The gain of 1.63% isn't huge, but volume surged to 1.70x, with a buy/sell ratio of 2.02 and an aggressive trade imbalance of 33.8%—clearly, buyers are driving the move. OI is up 0.45% over 15m and 0.21% over 1h. With price rising as leveraged longs enter, the structure points more toward new leveraged participation than a short-covering squeeze. The closing price has just broken above the highs of the last 20 5m candles, reaching the edge of the recent range. Its anomaly percentile across the full pool is 89.3%, ranking #13, and it also passes the depth confirmation: volume is above normal and aggressive trades are skewed to the buy side. 24h trading volume is 45.4M, so liquidity isn't especially deep. An anomaly of this size is worth watching to see whether the price can hold.

·
--
$USELESS This move came down on 4.7x the usual 15m volume, with aggressive trade flow at -46% and a buy/sell ratio of 0.37—clear selling pressure. But the OI is more interesting: down 0.49% over 15m, with nearly 300K less notional over 1h. Price down + OI down looks more like long deleveraging and stop-outs than fresh shorts entering. The closing price has already broken below the lower bound of the recent 20-bar 5m range. The anomaly percentile is 87.5%, ranking #13 across the whole pool. With this kind of setup, I usually don’t rush to chase the short; first I watch to see whether anyone steps in after this round of leverage gets flushed.
$USELESS This move came down on 4.7x the usual 15m volume, with aggressive trade flow at -46% and a buy/sell ratio of 0.37—clear selling pressure. But the OI is more interesting: down 0.49% over 15m, with nearly 300K less notional over 1h. Price down + OI down looks more like long deleveraging and stop-outs than fresh shorts entering. The closing price has already broken below the lower bound of the recent 20-bar 5m range. The anomaly percentile is 87.5%, ranking #13 across the whole pool. With this kind of setup, I usually don’t rush to chase the short; first I watch to see whether anyone steps in after this round of leverage gets flushed.

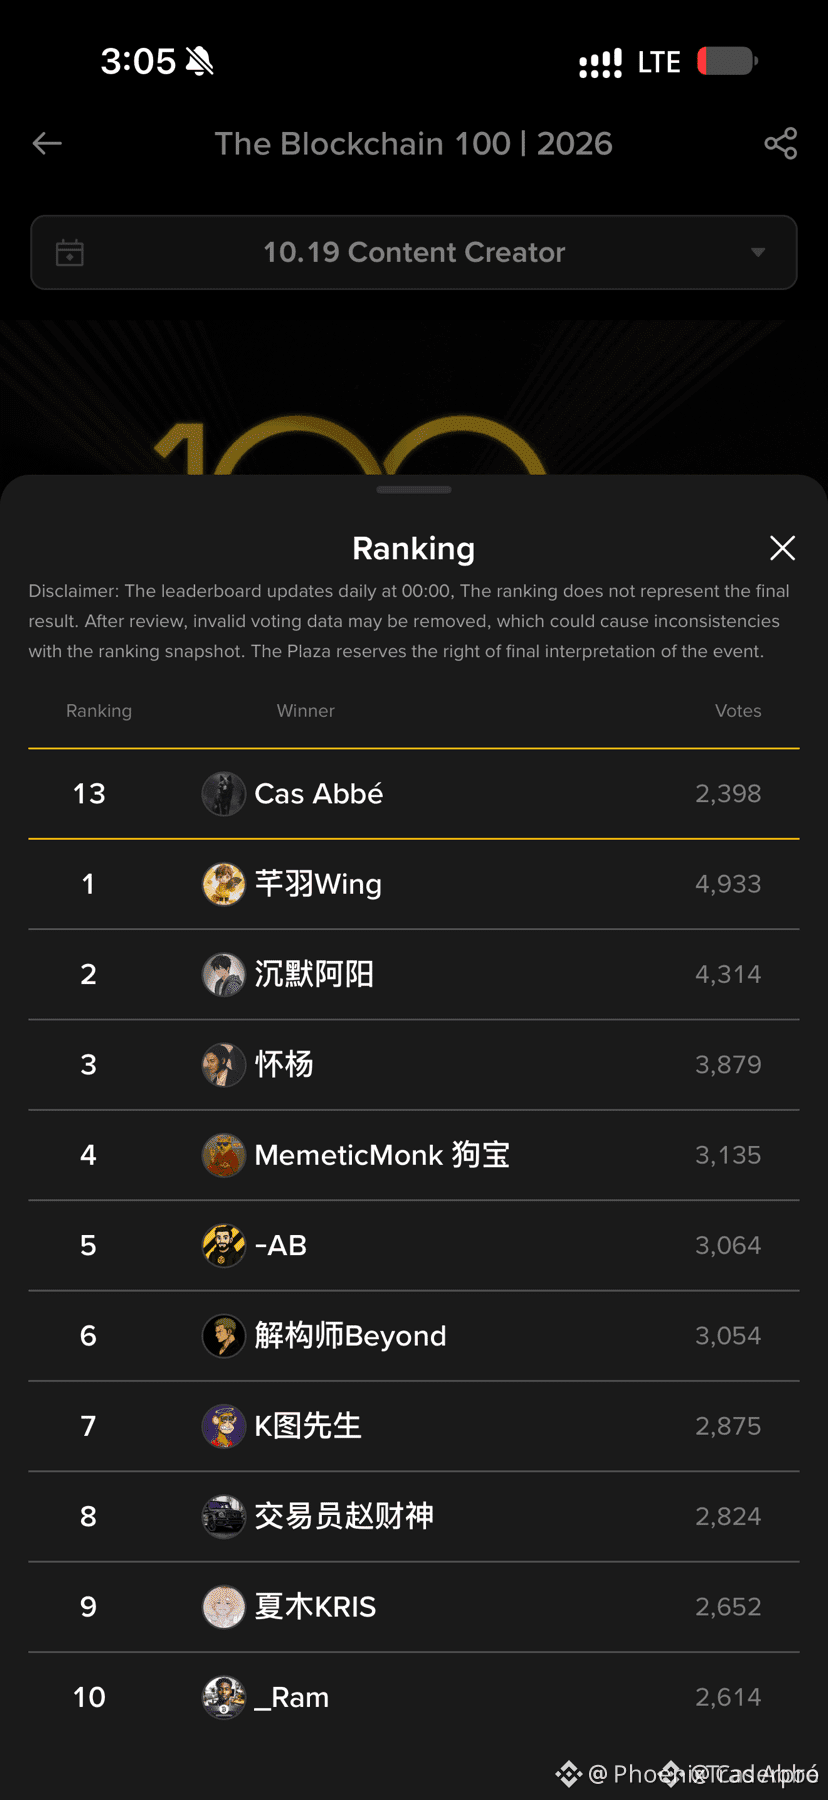
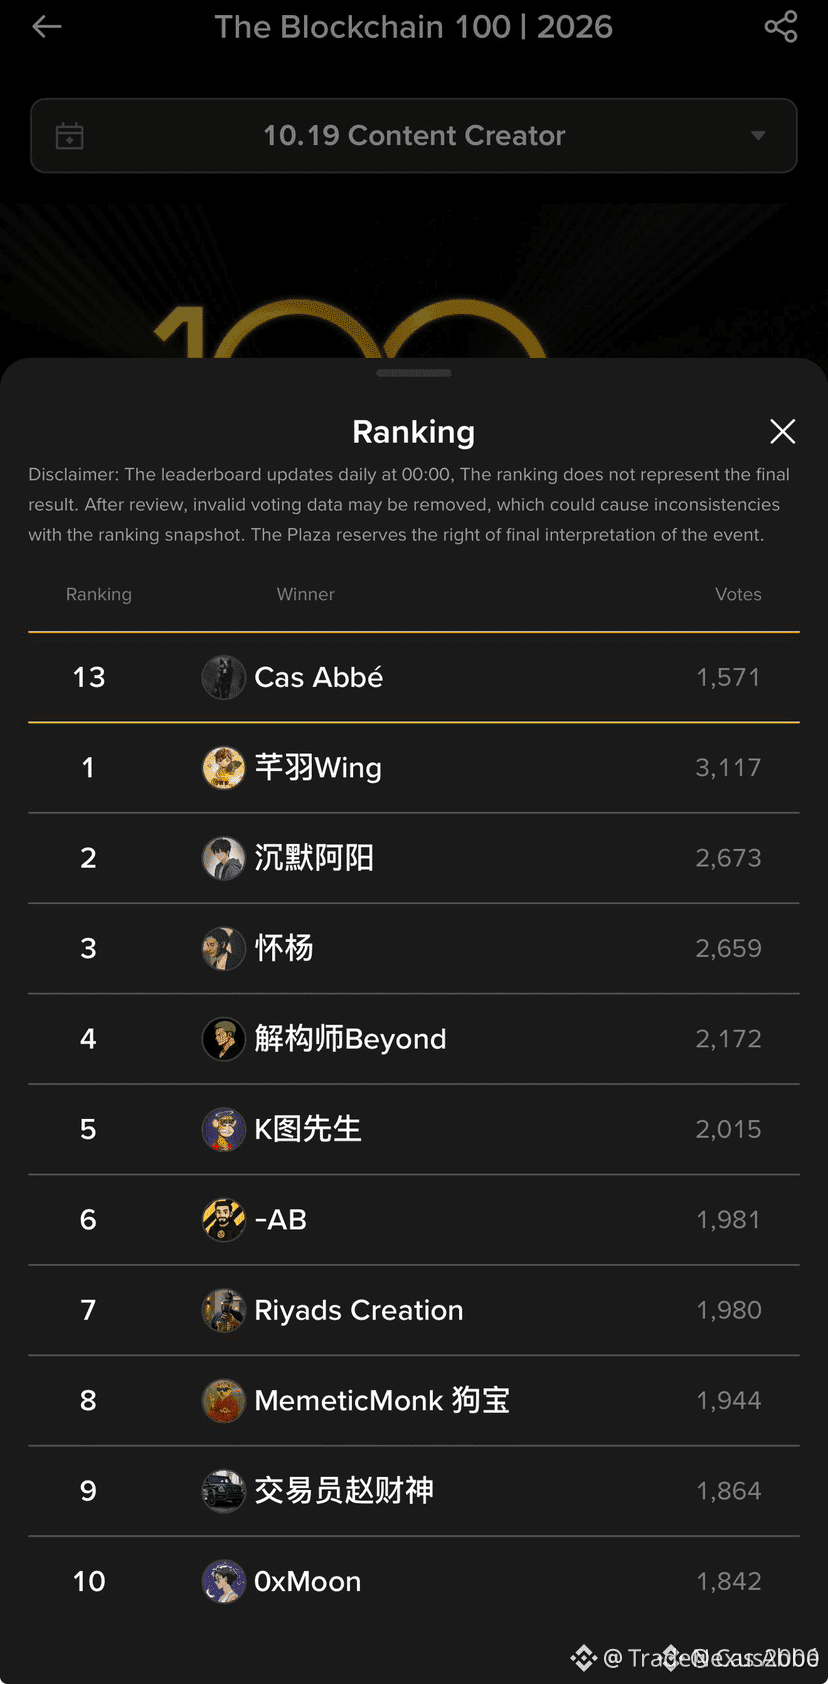
🚀 $BNB CLIMBS TO #13 IN BLOCKCHAIN 100 VOTE RACE! 🟢
The community is rallying, and $BNB just punched its way to #13 in the Blockchain 100 Awards 2026. Every daily vote is a fresh wave of liquidity pushing us toward the podium. 📊
Your vote is the catalyst—think of it as a front‑run on the next breakout. Keep the momentum alive, hit that button, and let’s lock in the top spot together. 🟢🚀💬 Ready to lock in the win with your daily vote? 👇
⚠️ Not financial advice. Always manage your risk. 🛡️
🏷️ #BNB #CommunityVote #Blockchain100 #Crypto
🔥 💎

6

·
--
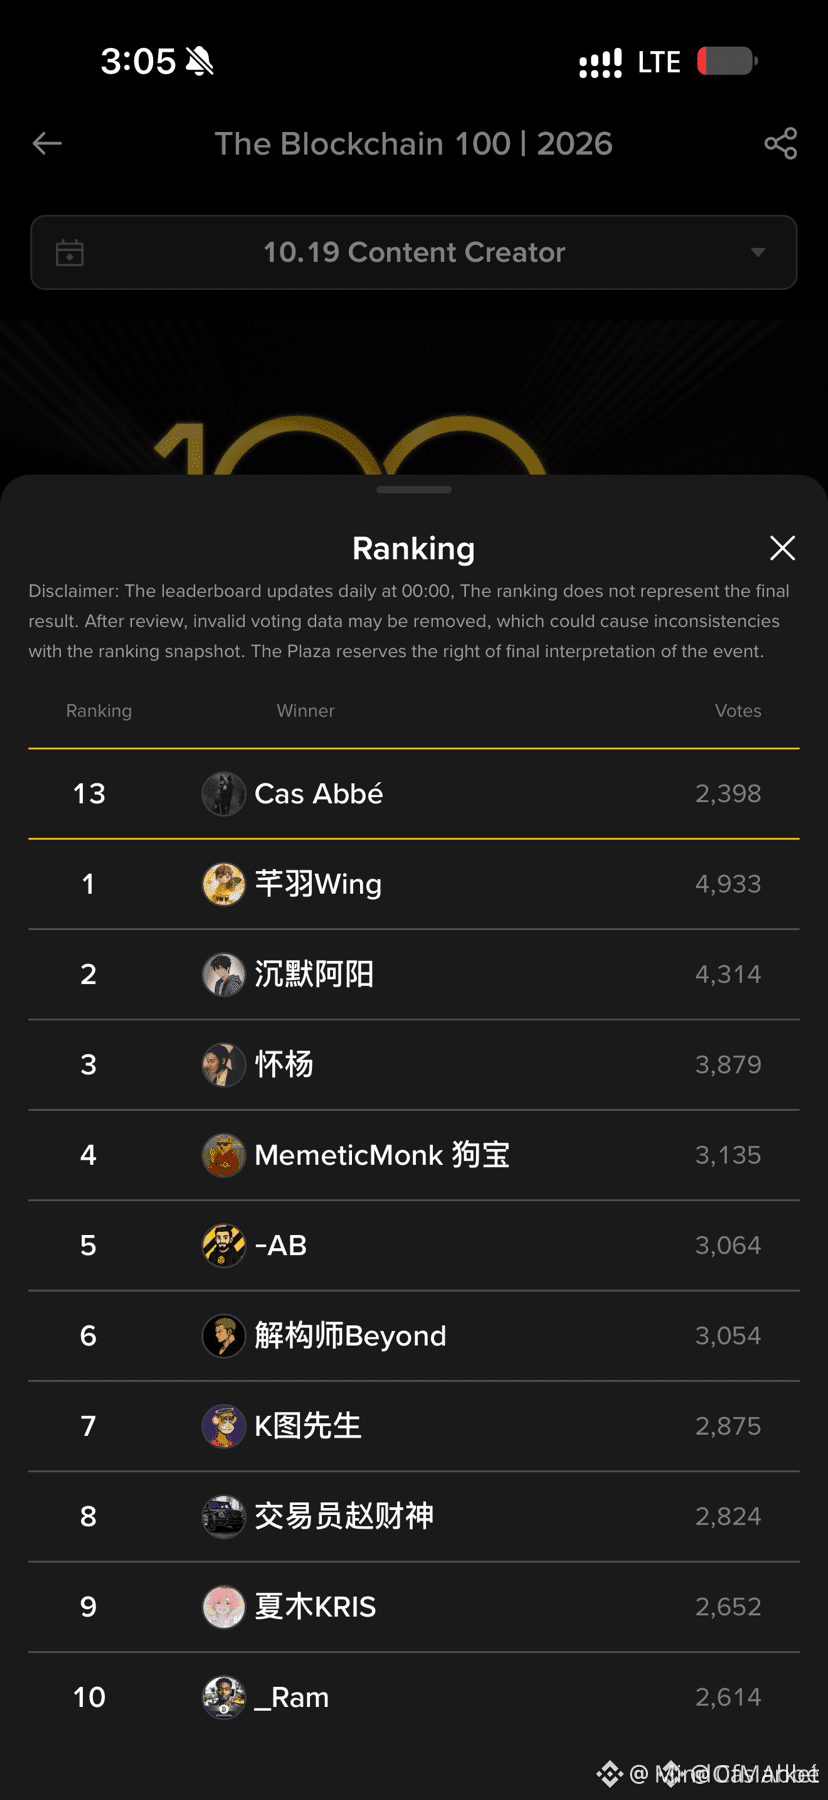
🚀 $BNB CLIMBS TO #13 IN BLOCKCHAIN 100 AWARDS 2026! 📈
📊 The community’s pulse is unmistakable—voters are rallying like smart‑money whales, pushing us into the top‑quarter of the leaderboard. 🦈 Every daily tap fuels a liquidity surge that could catapult us past the competition. 💡 Your vote isn’t just a click; it’s a strategic endorsement that signals institutional confidence.
💬 Are you ready to amplify the signal and help us break into the top 5? 👇
⚠️ Not financial advice. Always manage your risk. 🛡️
🏷️ #BNB #AwardPush #CommunityVote #Crypto
🔥 💎

2
·
--
$WLD This 15m plunge is something else: volume shot up to 9.42x, with a Z-score of 4.57—clearly not normal volatility. OI actually edged up while notional exposure continued to shrink. This price-down/OI-up combination looks more like new shorts entering with leverage, rather than a simple long squeeze. The 5m Binance Futures liquidation proxy is 184K, concentrated on the sell side; taker flow is -13.4% and the buy/sell ratio is 0.76, so selling pressure is indeed relatively heavy. 24h trading volume is 177M, liquidity is sufficient, and the notional change across the whole pool ranks #13. The key thing to watch now is whether this level can hold—if it doesn't, there could be another leg down.
$WLD This 15m plunge is something else: volume shot up to 9.42x, with a Z-score of 4.57—clearly not normal volatility. OI actually edged up while notional exposure continued to shrink. This price-down/OI-up combination looks more like new shorts entering with leverage, rather than a simple long squeeze. The 5m Binance Futures liquidation proxy is 184K, concentrated on the sell side; taker flow is -13.4% and the buy/sell ratio is 0.76, so selling pressure is indeed relatively heavy. 24h trading volume is 177M, liquidity is sufficient, and the notional change across the whole pool ranks #13. The key thing to watch now is whether this level can hold—if it doesn't, there could be another leg down.
·
--
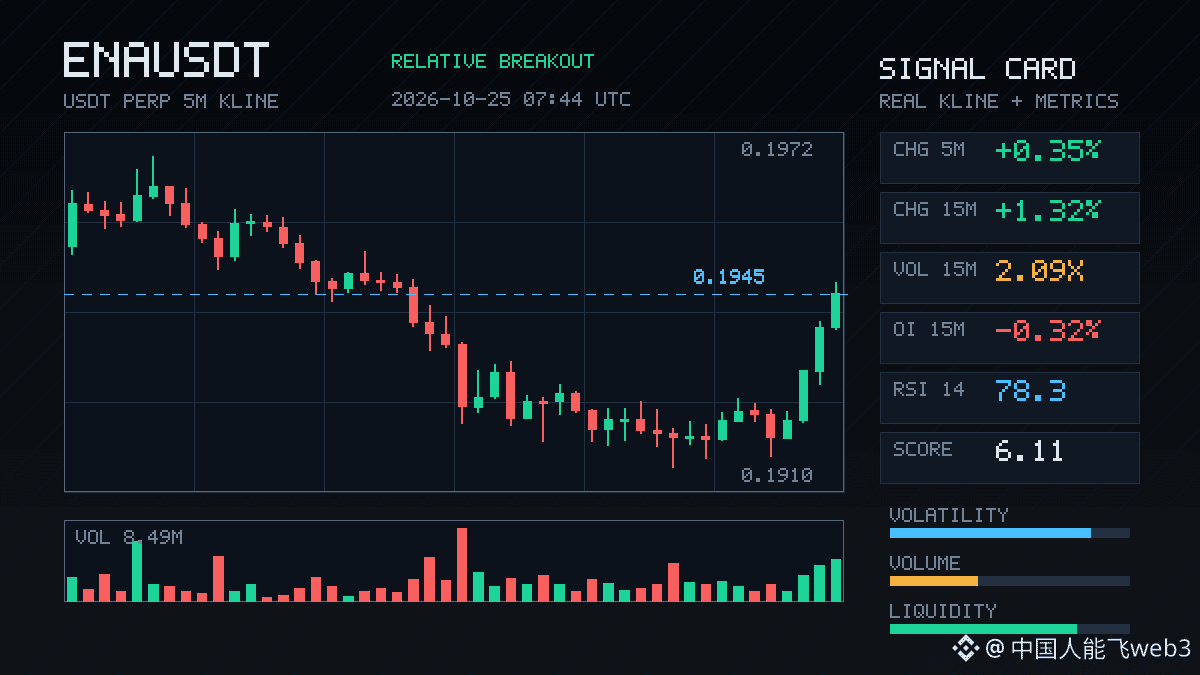
ENA’s 15m move is pretty interesting—price is up 1.32%, volume has jumped to 2.09x, but OI is down 0.32% over 15m and 0.41% over 1h. Price and volume are up while open interest is falling: a classic short-covering scenario, not the reassuring sign of fresh longs piling in.
The closing price just broke above the highs of the last 20 5m candles. The taker volume delta is 34.3%, and the buy/sell ratio is 2.04, so buyers are definitely pushing. But the funding rate is already in a high percentile for recent levels, and with the OI anomaly percentile at 79.4%—ranking #13 across the whole pool—be cautious about chasing longs here. Short-covering rallies can come and go fast.
24h turnover is 213 million, and liquidity is sufficient. Now it’s a matter of whether price can hold above the top of this range. If it can’t, this move is just giving shorts a chance to get out.
8
·
--
$MAGMA plunged 6.67% in this 15m candle, with volume surging to 14.35x and a Z-score of 11.65—not an ordinary pullback; someone got carried out. OI is falling, and price is falling too: classic crowding out, more consistent with longs de-leveraging, stop-losses, or positions being cut. 1h OI notional fell by nearly 300k U, aggressive trade delta is -12.3%, and the buy/sell ratio is 0.78—selling pressure is driving the move.
Price has now broken below the lower boundary of the past 20 or so 5m candles, and the liquidity in that stretch just got swept clean. 24h volume is 115M; it ranks #16 for anomalies in the pool and #13 for notional change—not the worst, but high enough to stand out.
With this kind of structure, I usually don't try to catch the first 15m candle. I'll wait for OI to stabilize and aggressive selling to fade, then see if there's a rebound. Is this the final stage of de-leveraging or just the beginning? Watch whether price can reclaim the lower boundary of the range in the next hour. $MAGMA
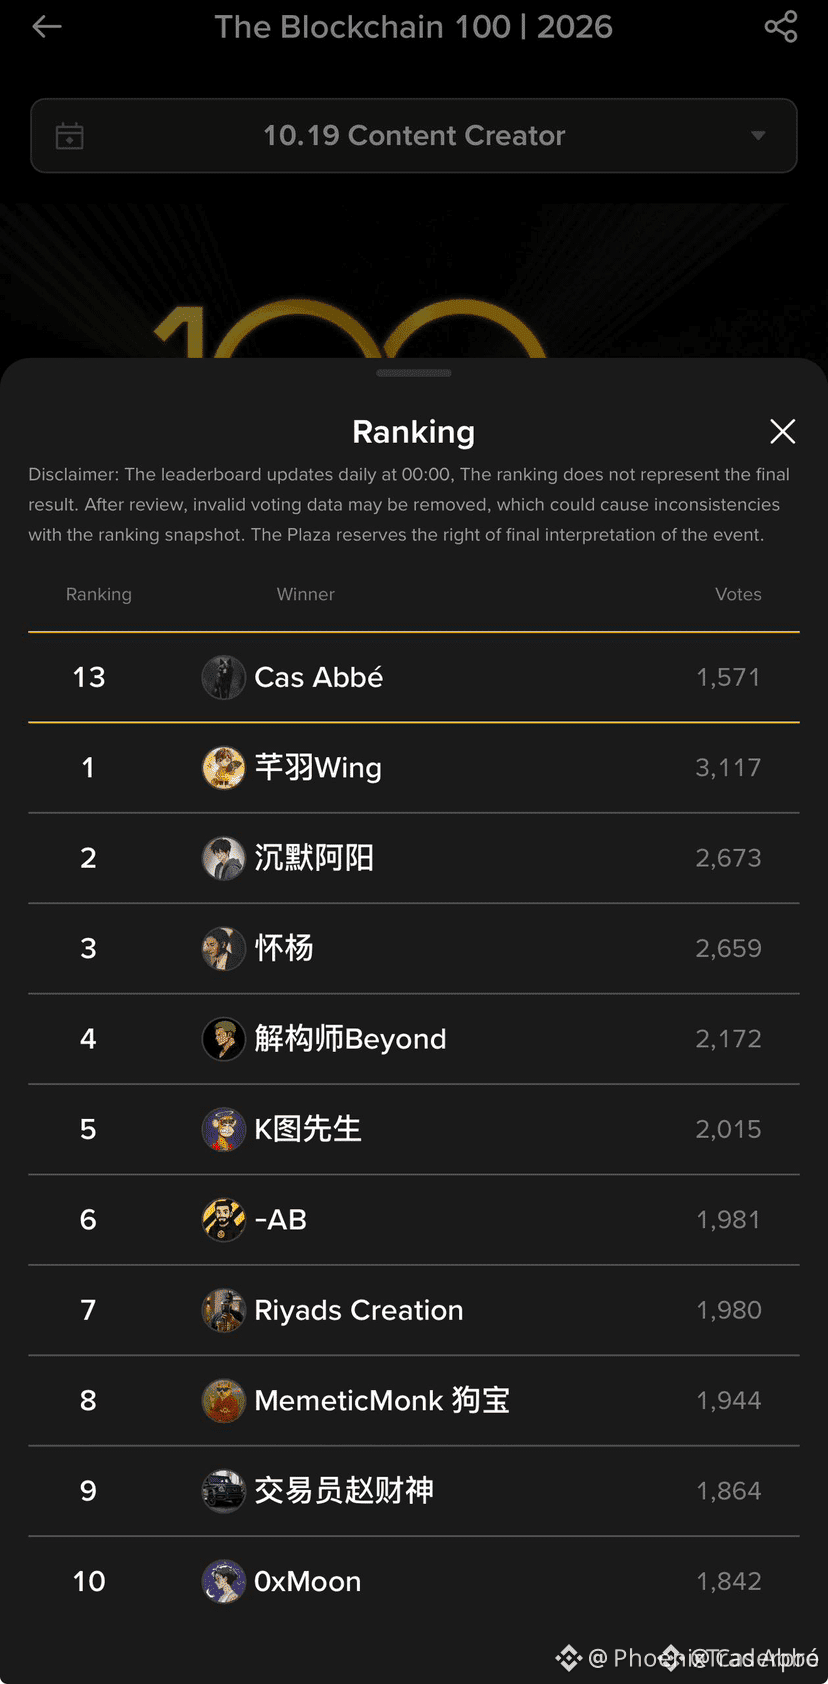
🚀 $BNB VOTE POWER DRIVING US TO TOP 10! 🟢
The momentum behind our #13 spot is pure community fire. Every vote is a bid that fuels the liquidity of $BNB 's ecosystem, pushing us closer to the elite tier. 🔥
If we lock in enough support, we can surge into the Top 10, maybe even crack the Top 3. Your single click is a front‑run on the next wave of recognition. 🦈 🚀
💬 Ready to flip the rank and claim the top slot together?
⚠️ Not financial advice. Always manage your risk. 🛡️
🏷️ #BNB #Vote #Blockchain100 #Top10
🚀 🔥
16
·
--
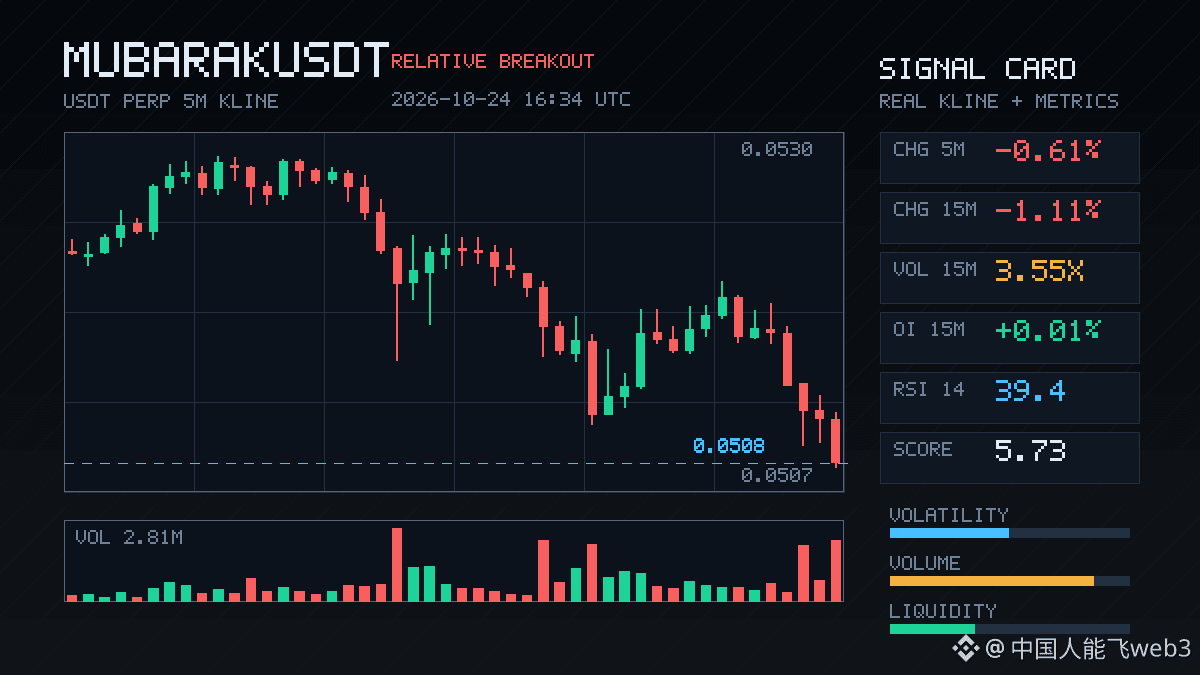
$MUBARAK This drop is getting interesting. 15m volume surged to 3.55x normal, while price fell 1.11% and the OI percentile hit 96.4%, ranking #13 among all pool anomalies. Price down, OI up—that’s not longs closing; it looks more like new leveraged shorts piling in.
Looking at the aggressive trade imbalance, it’s -42.3%, with a buy/sell ratio of 0.41. The close also broke below the lower end of the range formed by the last 20 5m candles—this is real selling pressure, not just order-book intimidation. The funding rate is also in a high percentile lately, so shorts are paying to keep pushing the price down. Hard to say how long this setup can last.
24h trading volume is only 11.52M, and the pool is shallow, so this is exactly the kind of spot where sharp wicks are most likely. OI anomalies have persisted across several consecutive periods. I’m not chasing the short; I’ll wait for it to show its own weakness.
3
·
--
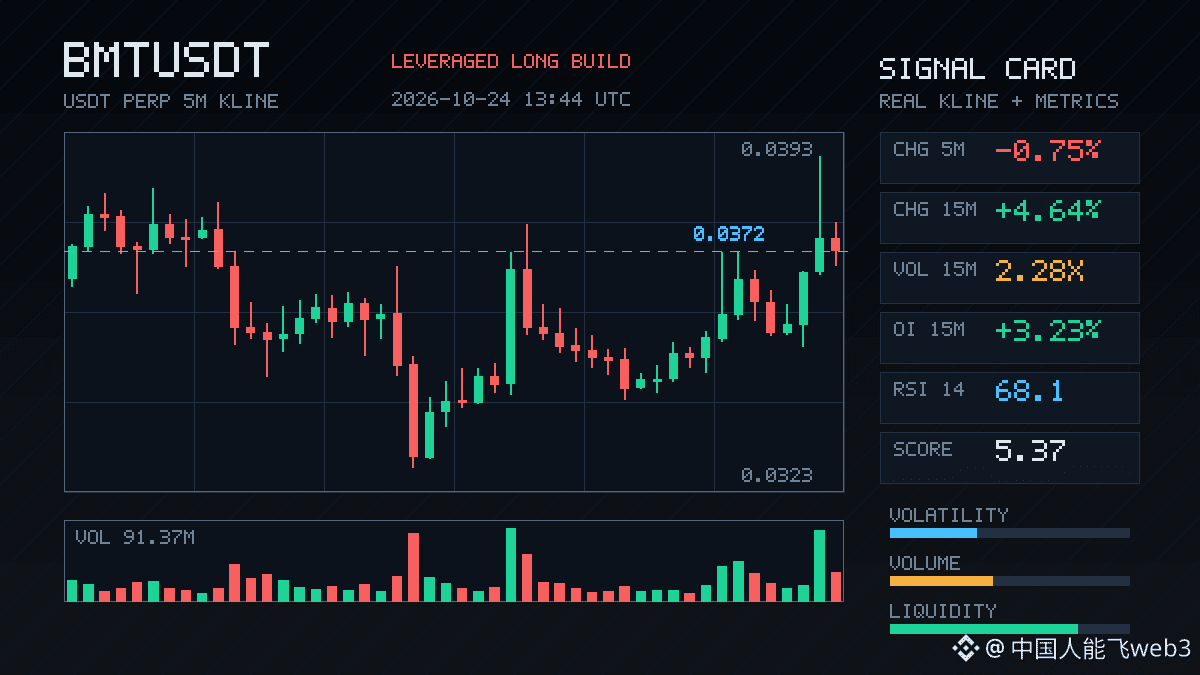
$BMT has made a pretty sharp move up here: up 4.64% in 15m, with volume rising to 2.28x—not a fake move on shrinking volume.
What’s more worth watching is OI: +3.23% in 15m and +6.17% in 1h, with over 1M USDT in notional value added in just one hour. Price and OI are rising together, which strongly suggests new leveraged longs are entering—not just a short-covering bounce. The OI anomaly percentile is already at 94%, ranking #13 across the whole pool, and the funding rate is also in a high percentile relative to recent levels—the sentiment is getting overheated.
The aggressive trade imbalance is only 1.2%, and the buy/sell ratio is 1.02, so buyers still have a slight edge, but it’s not a full-on chase yet. 24h trading volume is 221M, so liquidity isn’t a concern. But when OI anomalies keep piling up for several periods at a level like this, I usually don’t chase the first candle. I’d wait for a pullback, see if it finds support, then decide whether to enter. When leveraged longs get too crowded, one wick can wipe them all out.
$BMT
7

🚨 $BNB RANKED #13 IN BLOCKCHAIN 100 – PUSH TO TOP 10! 💥
📊 The current #13 slot signals a bullish order block for $BNB , with institutional eyes tracking the community pulse. 🦈 Each vote acts like a liquidity sweep, nudging the token closer to a top‑tier breakout zone.
⚡ Momentum builds as the vote count climbs; a sustained surge could trigger a rapid climb into the Top 3, mirroring a classic liquidity hunt reversal. 📌 Your single vote is a micro‑order that fuels this structural shift.
💬 Are you ready to add your vote and help $BNB capture that next liquidity pocket? 👇
⚠️ Not financial advice. Always manage your risk. 🛡️
🏷️ #BNB #CommunityVote #Blockchain100 #Crypto
🔥 🦈
13
·
--
$DOS This move came on a bit suddenly: it surged 3.84% in 15m, with volume reaching 2.45 times normal, and the price broke above the highs of the last 20 5m candles. OI moved up alongside it: +1.62% over 15m and +2.53% over 1h, with nearly 500K U in added notional value. This clearly looks like new leveraged longs coming in, rather than a move driven purely by spot buying. Its anomaly percentile is 89.5%, ranking #9 across the whole pool, while its notional change ranks #13—at the very least, this isn't some minor blip in a corner of the market.
That said, one detail makes me uneasy: the taker flow imbalance is -1.2%, and the buy/sell ratio is 0.98. The price went up, but aggressive buying didn't follow through. It feels like the move may have been driven by passive price lifting or short covering. 24h trading volume of 80M isn't especially deep either. If you're thinking of chasing it, watch whether OI and volume can keep up—don't get baited into buying the very top on a breakout like this. For now, I'll keep an eye on it and wait for a pullback to confirm.
That said, one detail makes me uneasy: the taker flow imbalance is -1.2%, and the buy/sell ratio is 0.98. The price went up, but aggressive buying didn't follow through. It feels like the move may have been driven by passive price lifting or short covering. 24h trading volume of 80M isn't especially deep either. If you're thinking of chasing it, watch whether OI and volume can keep up—don't get baited into buying the very top on a breakout like this. For now, I'll keep an eye on it and wait for a pullback to confirm.
5
·
--
$AGT has made a pretty sharp move here, up 13.77% in 15m, with volume surging to 4.25 times normal. But looking closely, OI is falling—down 0.78% in 15m and 0.25% in 1h. Price is up while open interest is down, a classic short-covering rally rather than a move driven by new longs entering.
Over 5m, Binance futures liquidations totaled 282K, concentrated on the buy side, putting shorts under considerable pressure. The taker trade delta is 30.5%, and the buy/sell ratio is 1.88, so buyers are clearly in control. The OI anomaly percentile is 98%, ranking #13 across the entire pool, while nominal change ranks #7. This is already close to historically extreme levels.
24h trading volume is 182M, and liquidity is sufficient. But be careful about chasing this kind of short-covering rally—the buying pressure may fade once positions have been covered. Watch to see whether price can hold on a pullback.

·
--
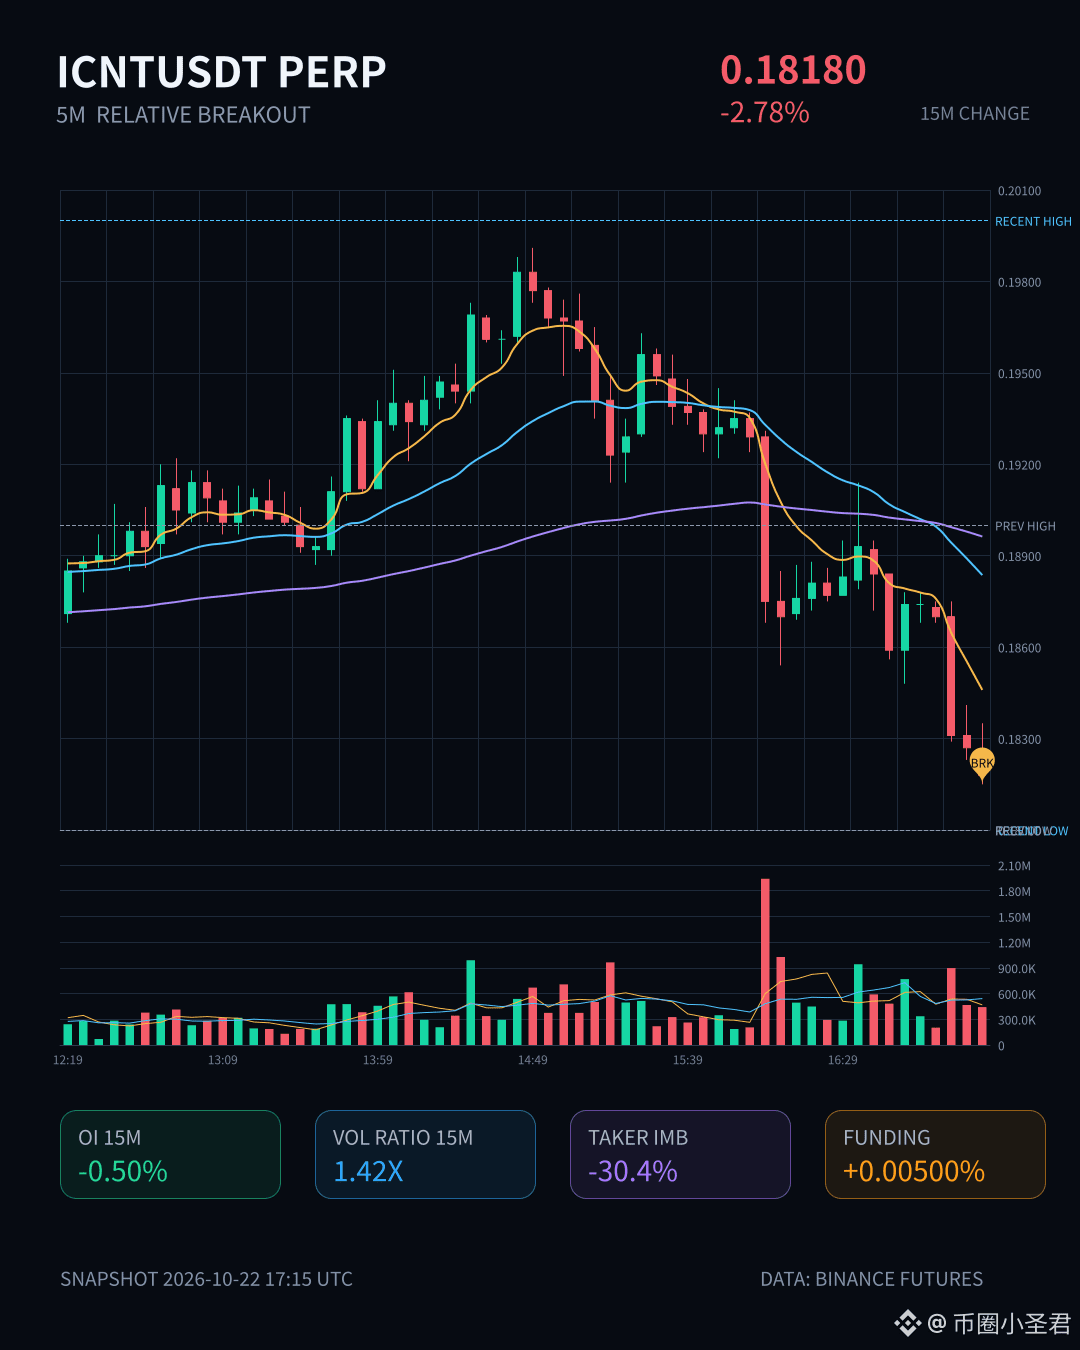
The 15-minute drop for $ICNT isn’t especially sharp at 2.78%, but the structure is interesting: price is falling and OI is falling along with it, down 0.50% over 15m and 0.92% over 1h. The notional change is only a few hundred thousand U, but the anomaly percentile is 91.5%, ranking #13 across the entire pool. This looks more like longs deleveraging and stopping out than shorts actively pushing the price down. Taker flow is -30.4%, with a buy/sell ratio of 0.53, indicating clear selling pressure. The close also fell below the lows of the last 20 or so 5m candles, so short-term momentum is weak. The 24h trading volume of 19M isn’t particularly large, and depth is average. Don’t rush to buy the dip here—wait for OI to stabilize and the trading structure to improve.
The 15-minute drop for $ICNT isn’t especially sharp at 2.78%, but the structure is interesting: price is falling and OI is falling along with it, down 0.50% over 15m and 0.92% over 1h. The notional change is only a few hundred thousand U, but the anomaly percentile is 91.5%, ranking #13 across the entire pool. This looks more like longs deleveraging and stopping out than shorts actively pushing the price down. Taker flow is -30.4%, with a buy/sell ratio of 0.53, indicating clear selling pressure. The close also fell below the lows of the last 20 or so 5m candles, so short-term momentum is weak. The 24h trading volume of 19M isn’t particularly large, and depth is average. Don’t rush to buy the dip here—wait for OI to stabilize and the trading structure to improve.
1

Article
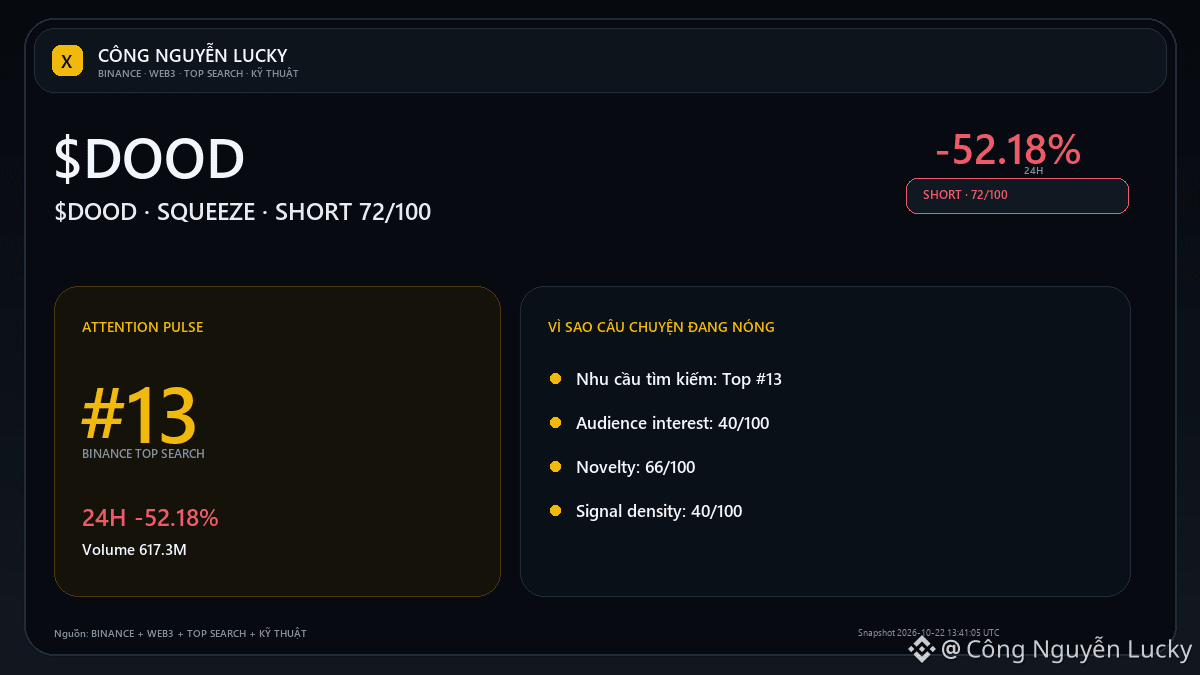
$DOOD -52.18%: What data confirms this sharp move?$DOOD It’s on my watchlist because the data is changing, not because I’m trying to force a signal. • 0.002209 · 24h -52.18% · volume ~617.3M USDT · 5,967,484 transactions. Condition for increasing conviction: A break below 0.00208 with expanding volume would make the continuation of the downtrend more credible.
What would make me pass: Failing to hold the lows and reclaim the midpoint at 0.003518 would weaken downward pressure. 📌 LONG/SHORT view: **SHORT · MEDIUM · 72/100**.
$DOOD -52.18%: What data confirms this sharp move?
$DOOD It’s on my watchlist because the data is changing, not because I’m trying to force a signal. • 0.002209 · 24h -52.18% · volume ~617.3M USDT · 5,967,484 transactions. Condition for increasing conviction: A break below 0.00208 with expanding volume would make the continuation of the downtrend more credible.
What would make me pass: Failing to hold the lows and reclaim the midpoint at 0.003518 would weaken downward pressure. 📌 LONG/SHORT view: **SHORT · MEDIUM · 72/100**.
What would make me pass: Failing to hold the lows and reclaim the midpoint at 0.003518 would weaken downward pressure. 📌 LONG/SHORT view: **SHORT · MEDIUM · 72/100**.
149

·
--
$ARIA : This 15m move is brutal—it plunged 5.34%, breaking below the lows of the last 20 5m candles. Volume hit 3.7x, with a Z-score of 4.24. This clearly isn’t the slow, steady bleed of a “boiling frog” move. Aggressive order-flow delta is -19.4%, and the buy/sell ratio is 0.68, so sellers are firmly in control.
But the OI data is interesting: 15m OI is down 0.51%, or -219K in notional terms. On the 1h timeframe, OI is actually up 0.65%, but notional is still down 134K. Price falling while OI declines looks more like longs deleveraging and stop-losses getting triggered than new shorts piling in to drive the price down. In other words, this sell-off is driven by positions shrinking, not shorts adding exposure.
Its anomaly percentile across the full pool is 85.3%, ranking #13, while its notional change ranks #29—making it one of the more eye-catching names in today’s pool. 24h trading volume is 61M, and depth isn’t particularly thin. Still, with a breakdown on heavy volume like this, don’t rush to catch a falling knife; wait for OI to stabilize, then see if there’s a chance of a rebound.
45
·
--
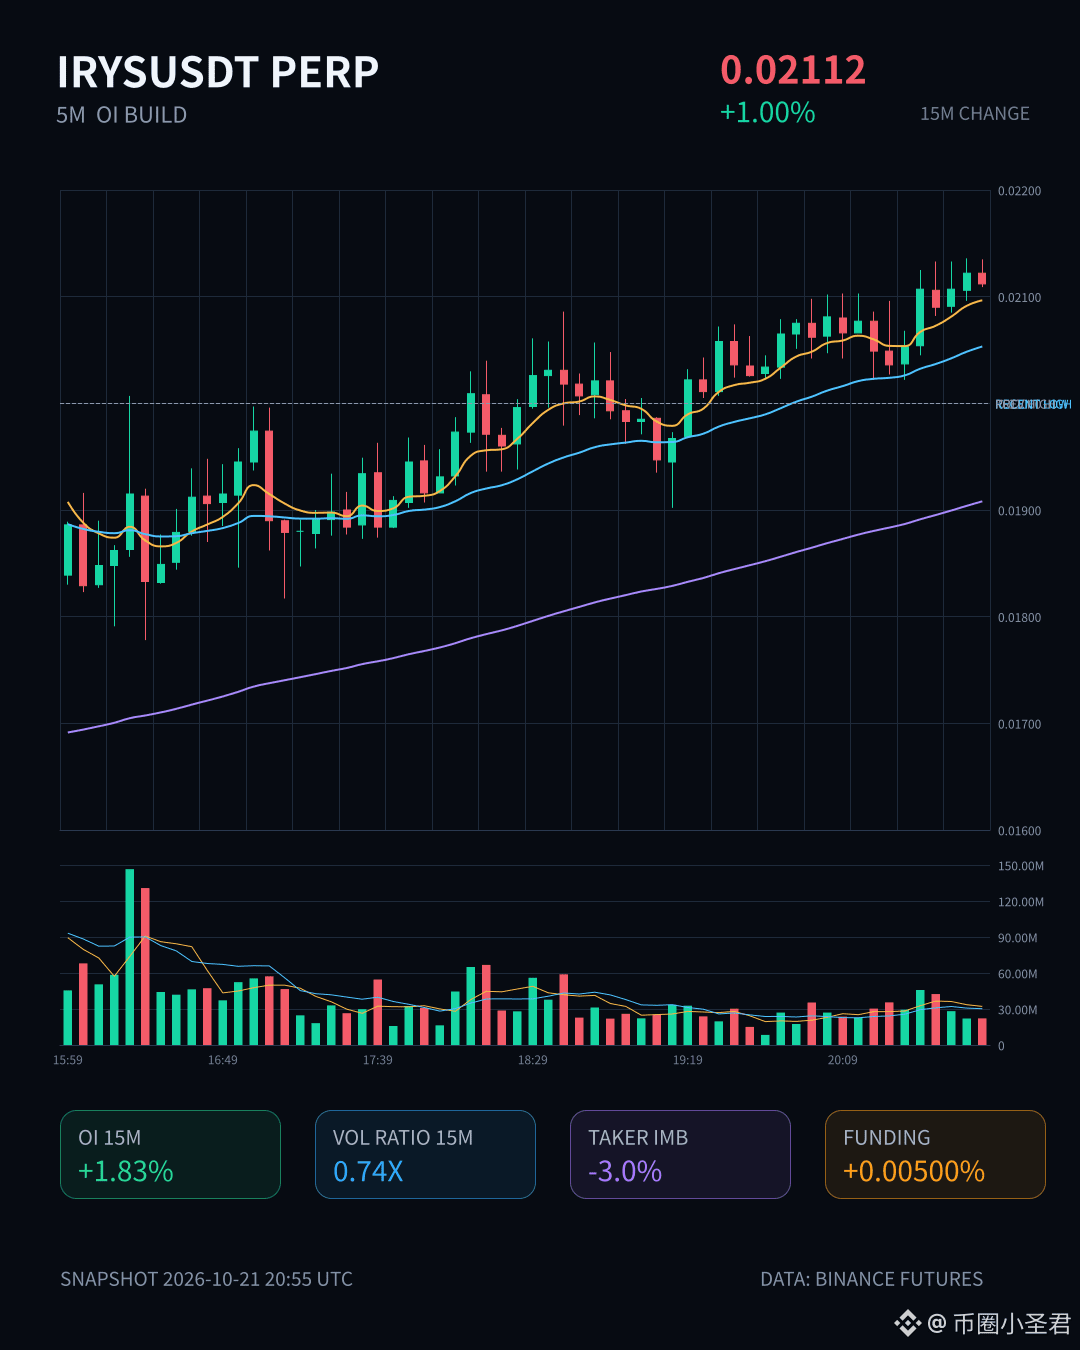
$IRYS This move is pretty interesting: price is up just 1% over 15m, while OI keeps stacking higher period after period. It’s already +2.75% over 1h, with $429K in notional. New leveraged longs are coming in, but volume is only 0.74x, and the taker flow imbalance is still negative—so the rally doesn’t look all that convincing.
The anomaly percentile is 88.3%, ranked #13 across the entire pool, and it’s persisted for several consecutive periods. With this kind of setup, either someone is positioning early or they’re building fuel for what comes next. Nearly $100M in 24h trading volume means the pool isn’t too shallow, but I generally don’t chase the first leg of a rally when volume isn’t confirming it.
Keep an eye on OI. If the price goes flat while OI keeps rising, that’s when it’s really time to be careful.
4
Log in to explore more content
Join global crypto users on Binance Square
⚡️ Get latest and useful information about crypto.
💬 Trusted by the world’s largest crypto exchange.
👍 Discover real insights from verified creators.
Email / Phone number
Trending Topics
1
#BinancePick
2.8M views
146,038 Discussing
2
#EarningsSeason
5.1M views
24,982 Discussing
3
#AnthropicTTMRevenueGrewAbout1200%
0 views
14 Discussing
4
#AnthropicS1ExpectedToday
684 views
45 Discussing
5
#SouthKoreaReportedlyWeighsFourthCryptoTaxDelay
8,405 views
222 Discussing
6
#FranklinTempletonFilesForTwoDividendToBitcoinETFs
14,513 views
337 Discussing
7
#StrategyMSTRSurpassesNasdaqInMarketCap
12,644 views
273 Discussing
8
#CanadaProposesStablecoinRedemptionWithin3BusinessDays
525 views
29 Discussing
9
#ElectrumWalletBugLetRogueServersStealFunds
17,127 views
389 Discussing
10
#ArgentineCourtDismissesLIBRACaseAgainstMilei
27,841 views
462 Discussing