
CryptoZeno
5.7k Posts

CryptoZeno
Verified Creator on #BinanceSquare #CoinMarketCap and #CryptoQuant | On Chain Research and Market Insights with Smart Trading Signals

NES Holder
High-Frequency Trader
5.4 Years
31 Following
8.5K+ Followers
33.8K+ Liked
Posts
All
Quotes
Videos
PINNED
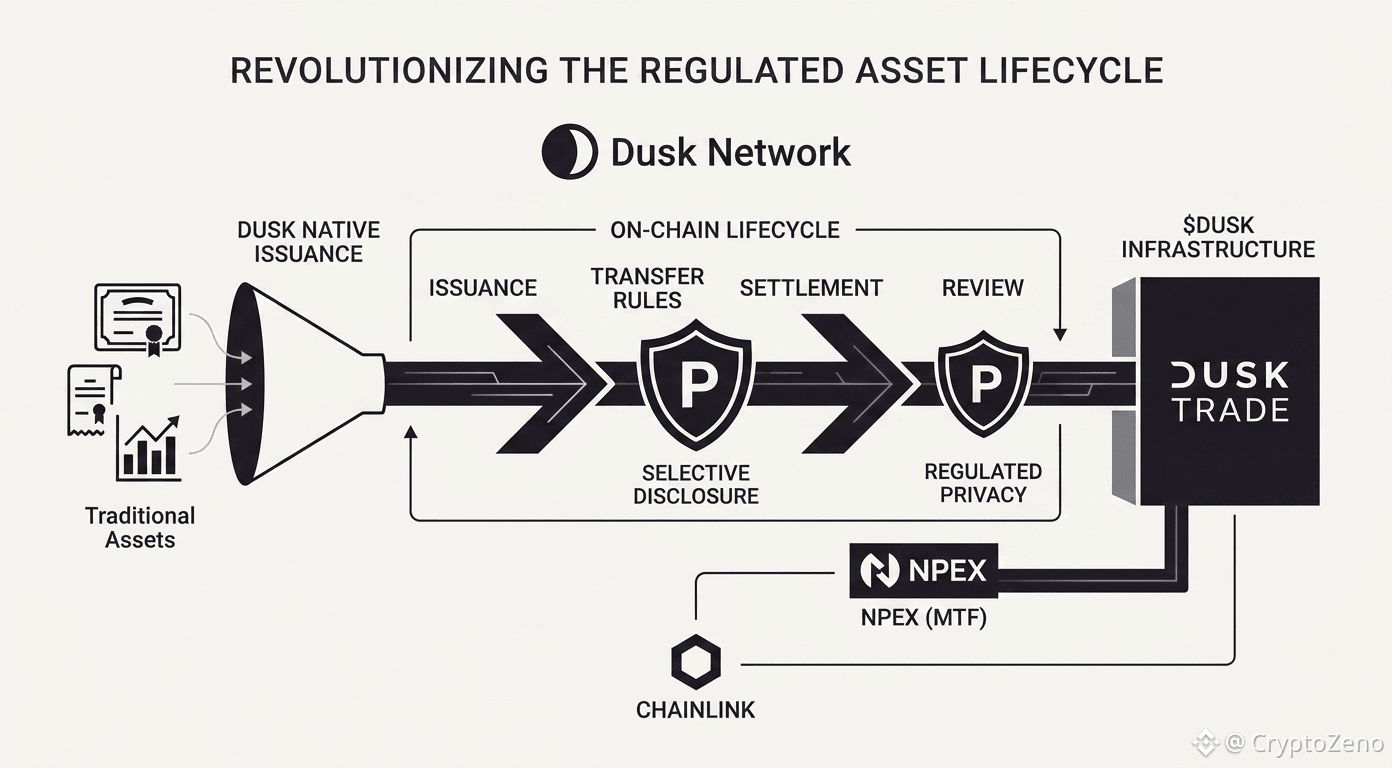
Dusk Is Bringing More Of The Regulated Asset Lifecycle Onchain, Not Just The Asset Itself
Tokenization usually gets the attention because it is the easiest part to show. Put a bond or fund onchain and suddenly there is something visible to point at.
Dusk native issuance model goes further by targeting parts of the lifecycle that normally remain outside the token itself: issuance, transfer rules, settlement, review and servicing. That makes the blockchain responsible for more than representing an existing security. @Dusk is trying to make the asset’s operating rules part of the infrastructure.
The same idea shows up in Dusk Trade. Its workflow covers onboarding, wallet connection, asset discovery, buying and selling, payment coordination and settlement, with MMFs, ETFs and bonds among the intended products. Underneath that, the $DUSK stack is also designed for regulated privacy, where sensitive information can stay protected while selective disclosure gives authorized parties a way to review it.
There is already a concrete institutional angle behind this architecture. NPEX is an AFM-regulated exchange licensed as an MTF, Broker and ECSP, and its partnership with Dusk targets more than €300M in assets being brought onchain. Chainlink is also part of the infrastructure picture, strengthening the connection between Dusk and external data and interoperability.
What I’d like to see from the Dusk team next is how far this model can go as more regulated assets come onchain. With native issuance, Dusk Trade, selective disclosure and deterministic settlement developing together, the next step could be supporting more complex asset lifecycles without adding extra layers around the investor. That would make the work Dusk is already doing even more relevant to regulated markets.
@Dusk #DUSK
Tokenization usually gets the attention because it is the easiest part to show. Put a bond or fund onchain and suddenly there is something visible to point at.
Dusk native issuance model goes further by targeting parts of the lifecycle that normally remain outside the token itself: issuance, transfer rules, settlement, review and servicing. That makes the blockchain responsible for more than representing an existing security. @Dusk is trying to make the asset’s operating rules part of the infrastructure.
The same idea shows up in Dusk Trade. Its workflow covers onboarding, wallet connection, asset discovery, buying and selling, payment coordination and settlement, with MMFs, ETFs and bonds among the intended products. Underneath that, the $DUSK stack is also designed for regulated privacy, where sensitive information can stay protected while selective disclosure gives authorized parties a way to review it.
There is already a concrete institutional angle behind this architecture. NPEX is an AFM-regulated exchange licensed as an MTF, Broker and ECSP, and its partnership with Dusk targets more than €300M in assets being brought onchain. Chainlink is also part of the infrastructure picture, strengthening the connection between Dusk and external data and interoperability.
What I’d like to see from the Dusk team next is how far this model can go as more regulated assets come onchain. With native issuance, Dusk Trade, selective disclosure and deterministic settlement developing together, the next step could be supporting more complex asset lifecycles without adding extra layers around the investor. That would make the work Dusk is already doing even more relevant to regulated markets.
@Dusk #DUSK
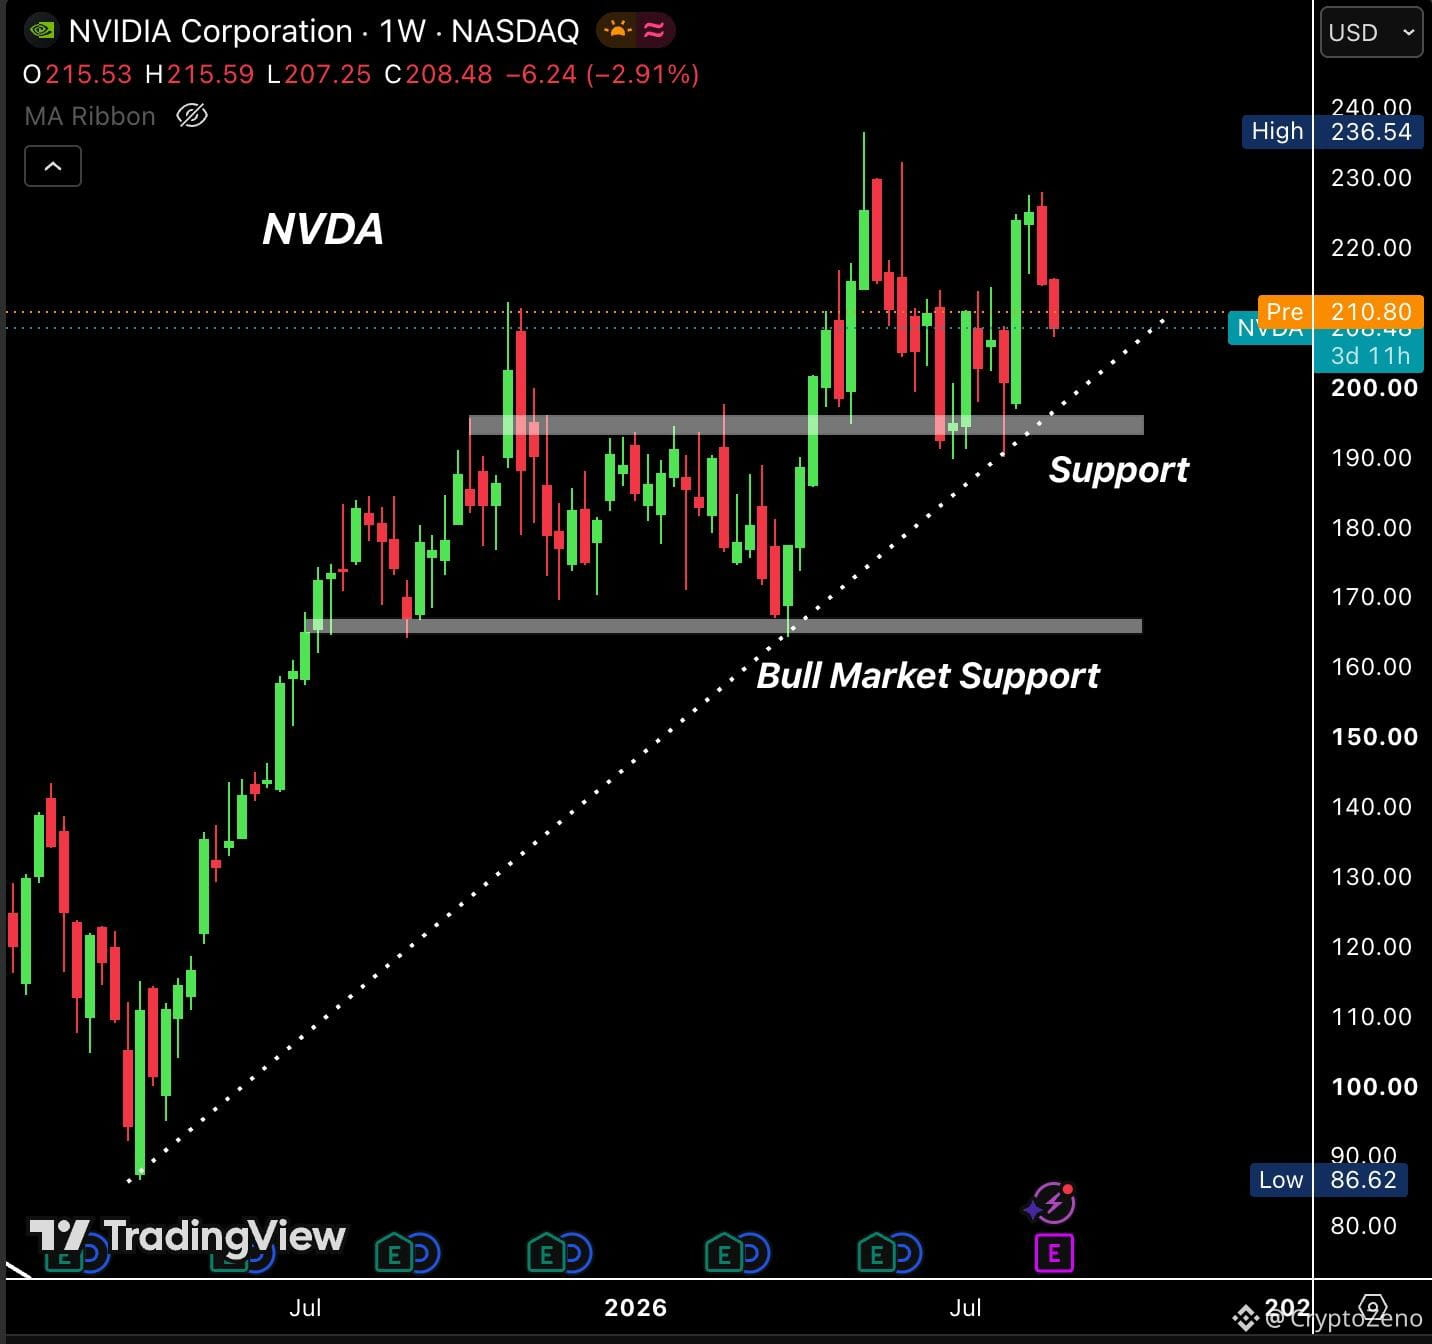
NVIDIA EARNINGS TOMORROW COULD DECIDE WHETHER THE AI BULL MARKET CONTINUES OR NOT.
Nvidia reports Q2 results tomorrow, with Wall Street expecting roughly $92 billion in revenue, almost double last year.
That matters because Nvidia is the largest U.S. company and one of the biggest weights in the S&P 500.
It is also one of the clearest indicators of whether the hundreds of billions being spent on AI infrastructure are actually translating into demand.
Last quarter, Nvidia reported $81.6 billion in revenue, while Data Center revenue jumped 92% YoY.
Tomorrow, the market will be watching revenue, margins, Rubin demand, China sales and, most importantly, guidance.
At the same time, the chart shows NVDA approaching the $195–$200 support zone, with the larger bull-market support around $165–$170.
A strong report and a hold of support would keep the AI trade intact, while a major breakdown could hit semiconductors and other AI-heavy stocks with it.
With Nvidia now deeply tied to S&P 500 earnings and performance, this is much bigger than just one company’s earnings report.
Nvidia reports Q2 results tomorrow, with Wall Street expecting roughly $92 billion in revenue, almost double last year.
That matters because Nvidia is the largest U.S. company and one of the biggest weights in the S&P 500.
It is also one of the clearest indicators of whether the hundreds of billions being spent on AI infrastructure are actually translating into demand.
Last quarter, Nvidia reported $81.6 billion in revenue, while Data Center revenue jumped 92% YoY.
Tomorrow, the market will be watching revenue, margins, Rubin demand, China sales and, most importantly, guidance.
At the same time, the chart shows NVDA approaching the $195–$200 support zone, with the larger bull-market support around $165–$170.
A strong report and a hold of support would keep the AI trade intact, while a major breakdown could hit semiconductors and other AI-heavy stocks with it.
With Nvidia now deeply tied to S&P 500 earnings and performance, this is much bigger than just one company’s earnings report.
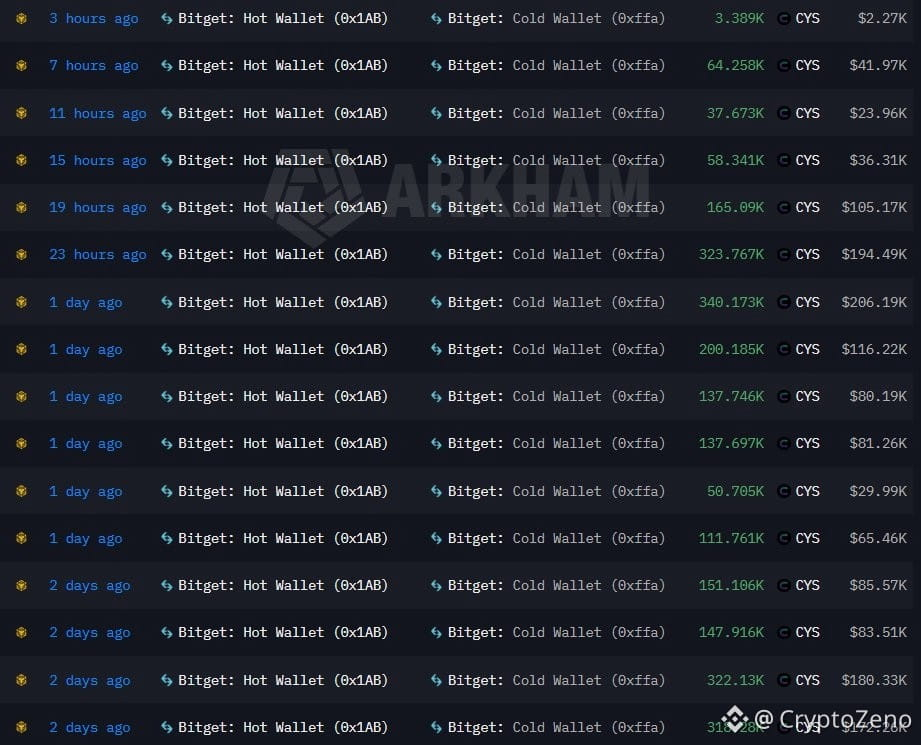
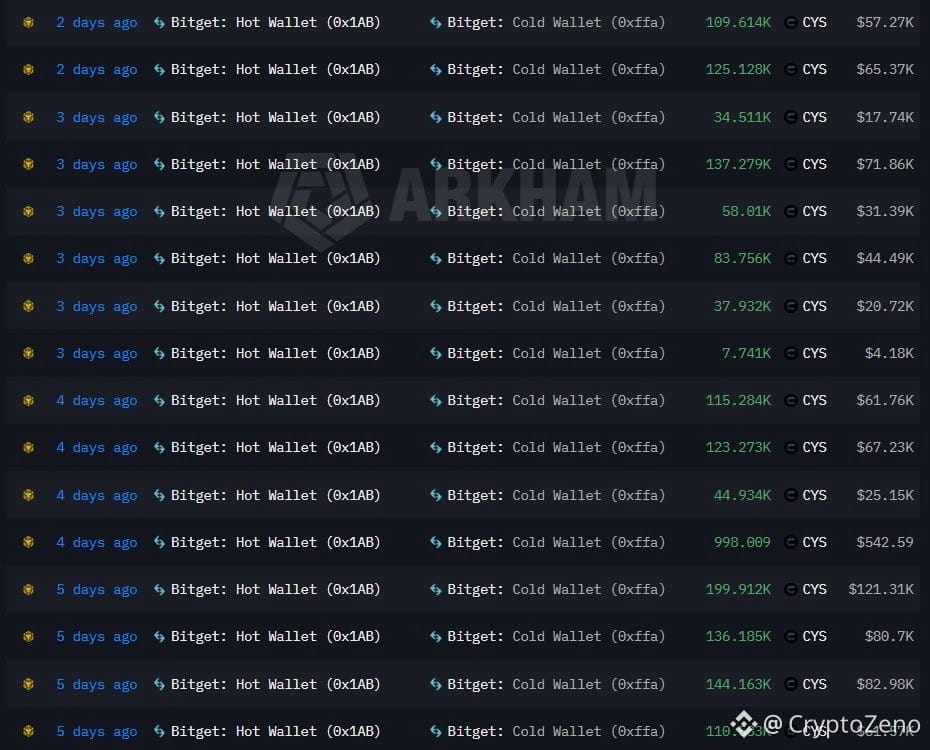
$CYS Cold wallet activity on two separate exchanges broke a week of silence on the same day.
3.74M CYS ($2.39M) moved into Gate’s cold wallet today. That wallet had seen zero movement for a full week.
At the same time Bitget’s cold wallet has climbed steadily from 3.8M to 8.5M over the past week, with the pace accelerating in recent days.
Liquidation map
Price sat in the 0.2-0.3 range for a long stretch, then spiked near-vertically to 1.8 around August 4 before dropping to 0.4-0.5.
Now at 0.7128, sitting directly on the 0.71 cluster.
Another cluster remains at 1.01 from the same spike, with a visible gap between 0.71 and 1.01.
Derivatives
OI 11.3% of mcap, futures 6.3x spot → healthy range.
Top traders 1.43 long vs crowd 0.98 → clear split.
Taker 1.05, buyers slightly aggressive.
How I read it
Holding above the 0.71 cluster suggests the bottom of the earlier drop has settled for now.
The gap to 1.01, healthy structure, and simultaneous cold wallet activity on two exchanges make this worth watching.
3.74M CYS ($2.39M) moved into Gate’s cold wallet today. That wallet had seen zero movement for a full week.
At the same time Bitget’s cold wallet has climbed steadily from 3.8M to 8.5M over the past week, with the pace accelerating in recent days.
Liquidation map
Price sat in the 0.2-0.3 range for a long stretch, then spiked near-vertically to 1.8 around August 4 before dropping to 0.4-0.5.
Now at 0.7128, sitting directly on the 0.71 cluster.
Another cluster remains at 1.01 from the same spike, with a visible gap between 0.71 and 1.01.
Derivatives
OI 11.3% of mcap, futures 6.3x spot → healthy range.
Top traders 1.43 long vs crowd 0.98 → clear split.
Taker 1.05, buyers slightly aggressive.
How I read it
Holding above the 0.71 cluster suggests the bottom of the earlier drop has settled for now.
The gap to 1.01, healthy structure, and simultaneous cold wallet activity on two exchanges make this worth watching.
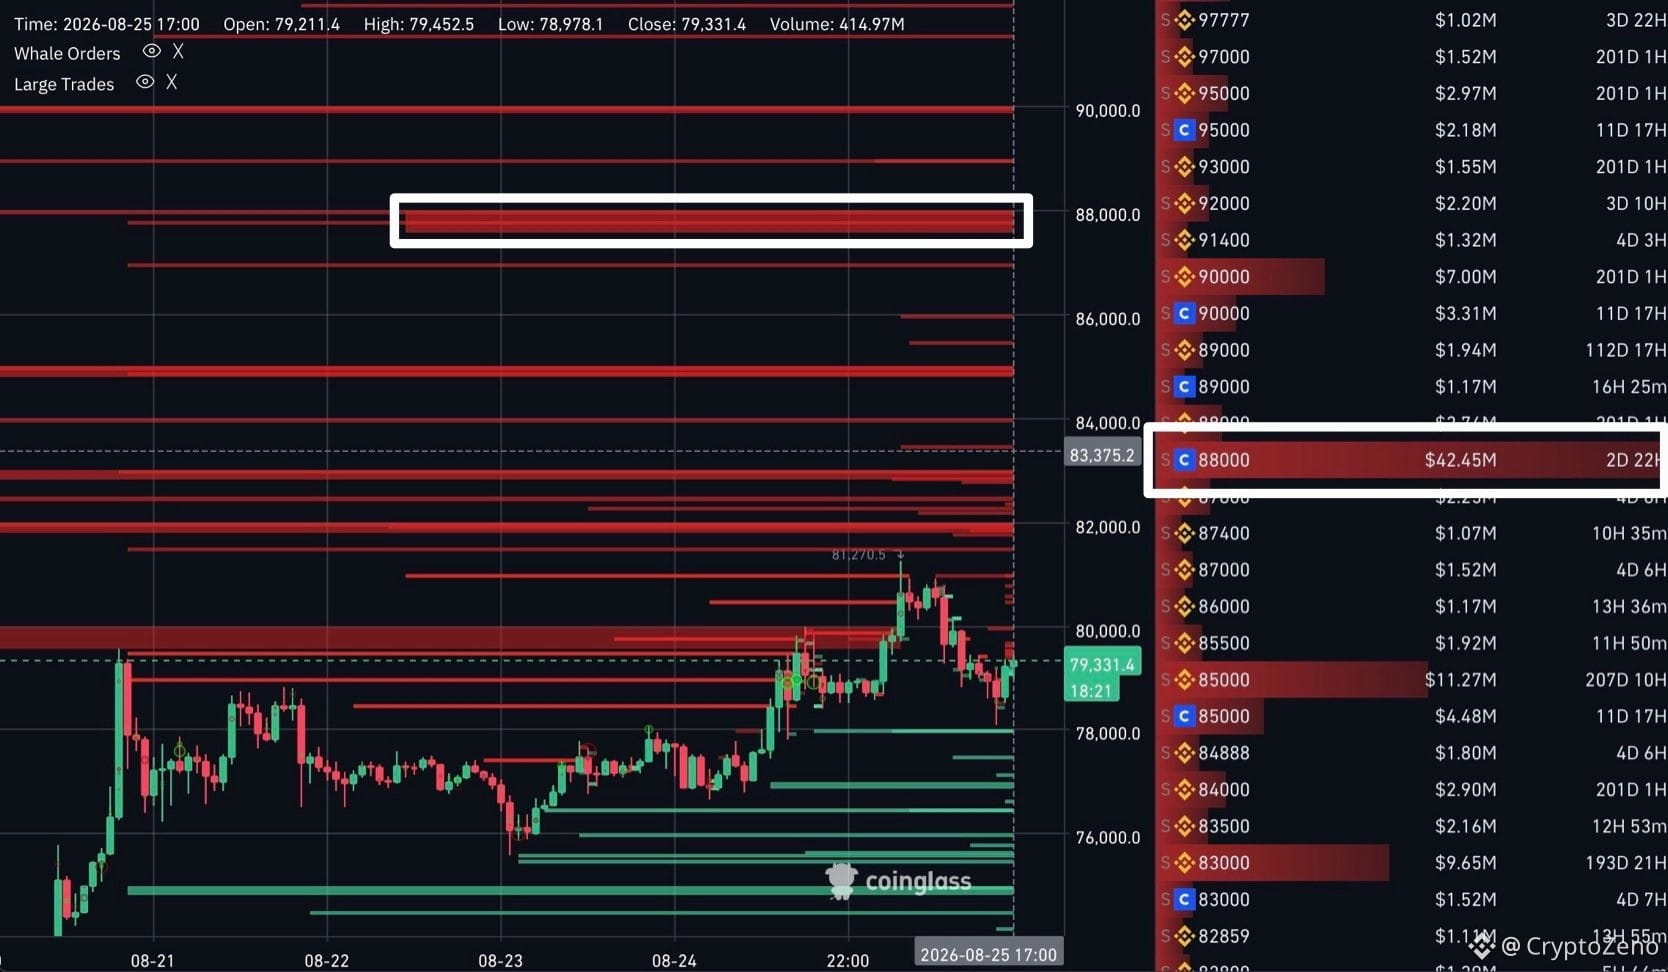
$BTC Whales are currently positioning for a reversal around 88K.
Looking at whale orders, the largest cluster of activity from large players is currently concentrated around 88K.
Apparently, being a whale doesn’t automatically make you smart.
Looking at whale orders, the largest cluster of activity from large players is currently concentrated around 88K.
Apparently, being a whale doesn’t automatically make you smart.
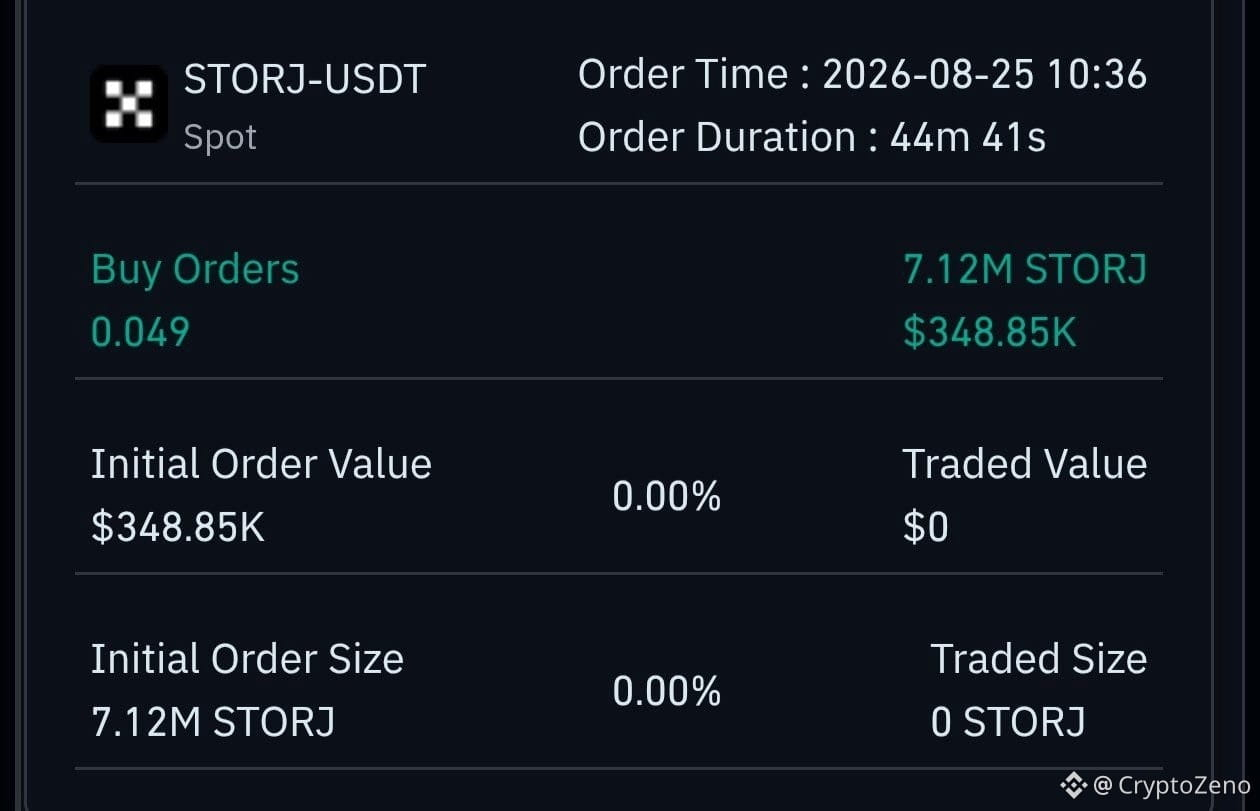
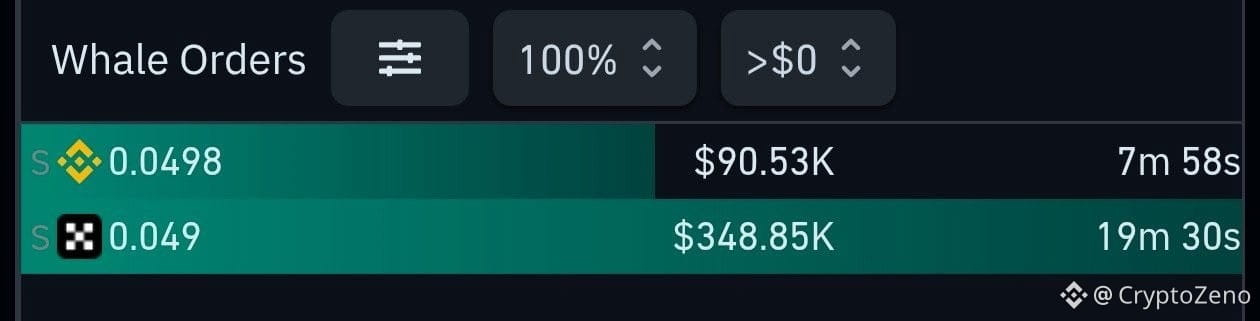
Buy order at $0.049. Price hasn't reached there yet. Don't get misled by the futures price, this is a spot order.
Funding rate is high and there's a price gap between spot and futures.
This order could support the price above $0.049 but worth keeping in mind it can be cancelled.
Bottom line I wouldn't recommend going in heavy on this. Futures delisting is tomorrow. Treat these kinds of tokens like lottery tickets. $STORJ
Funding rate is high and there's a price gap between spot and futures.
This order could support the price above $0.049 but worth keeping in mind it can be cancelled.
Bottom line I wouldn't recommend going in heavy on this. Futures delisting is tomorrow. Treat these kinds of tokens like lottery tickets. $STORJ
CryptoZeno
·
--
Whale orders keep building at $0.049. $STORJ
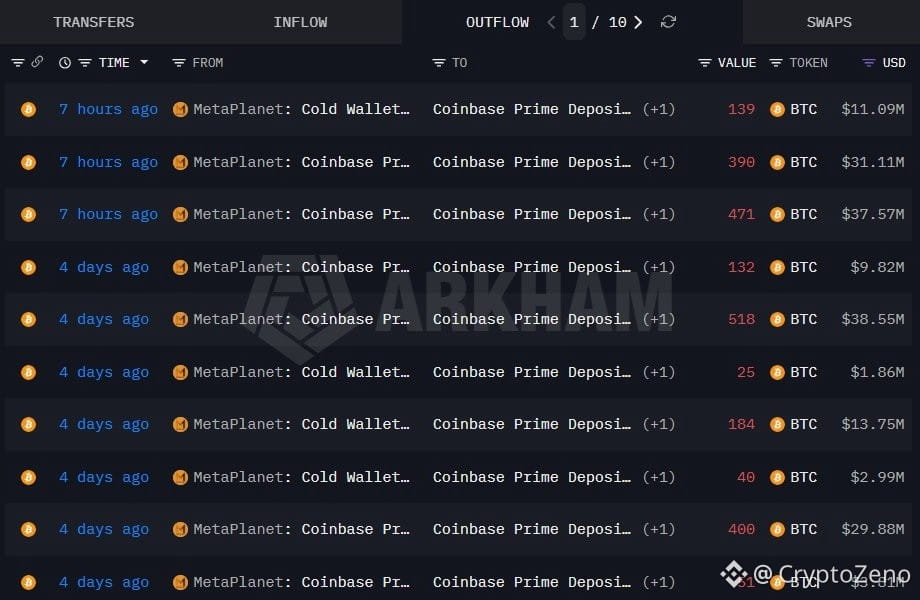
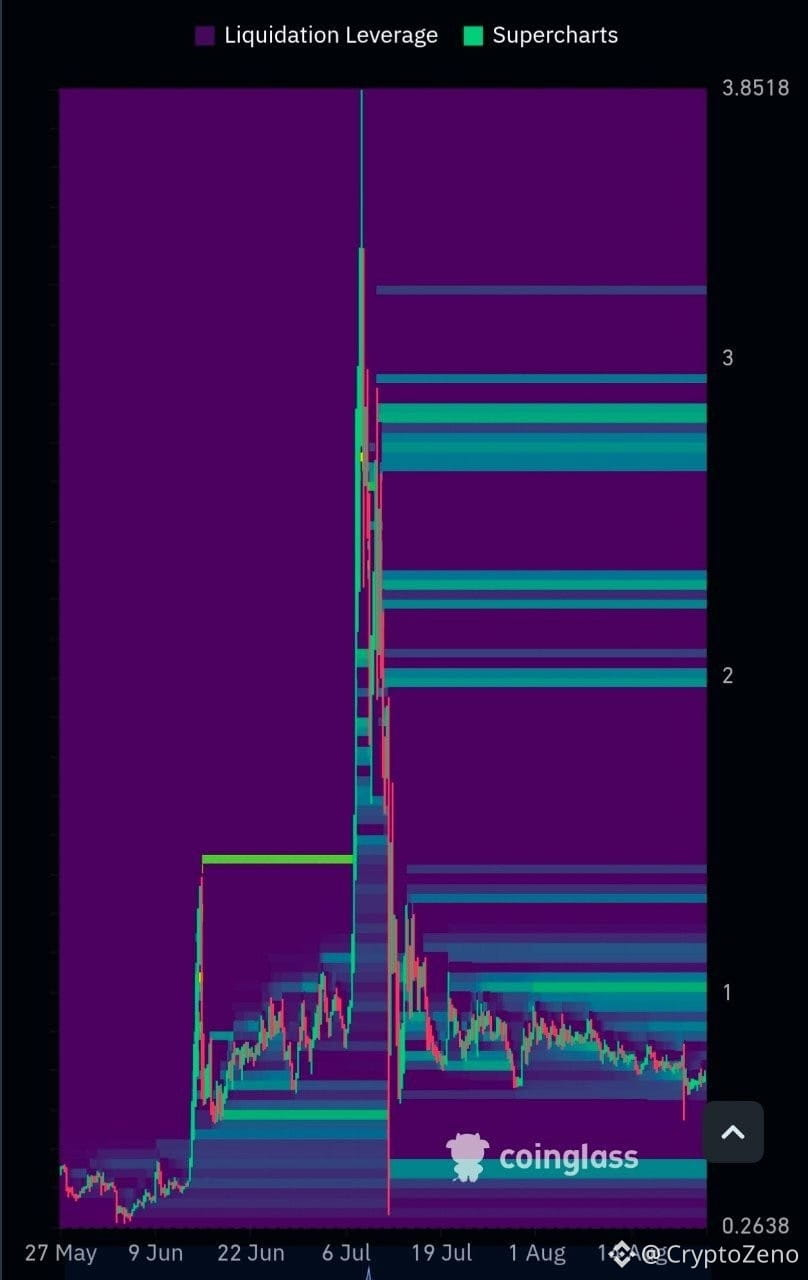
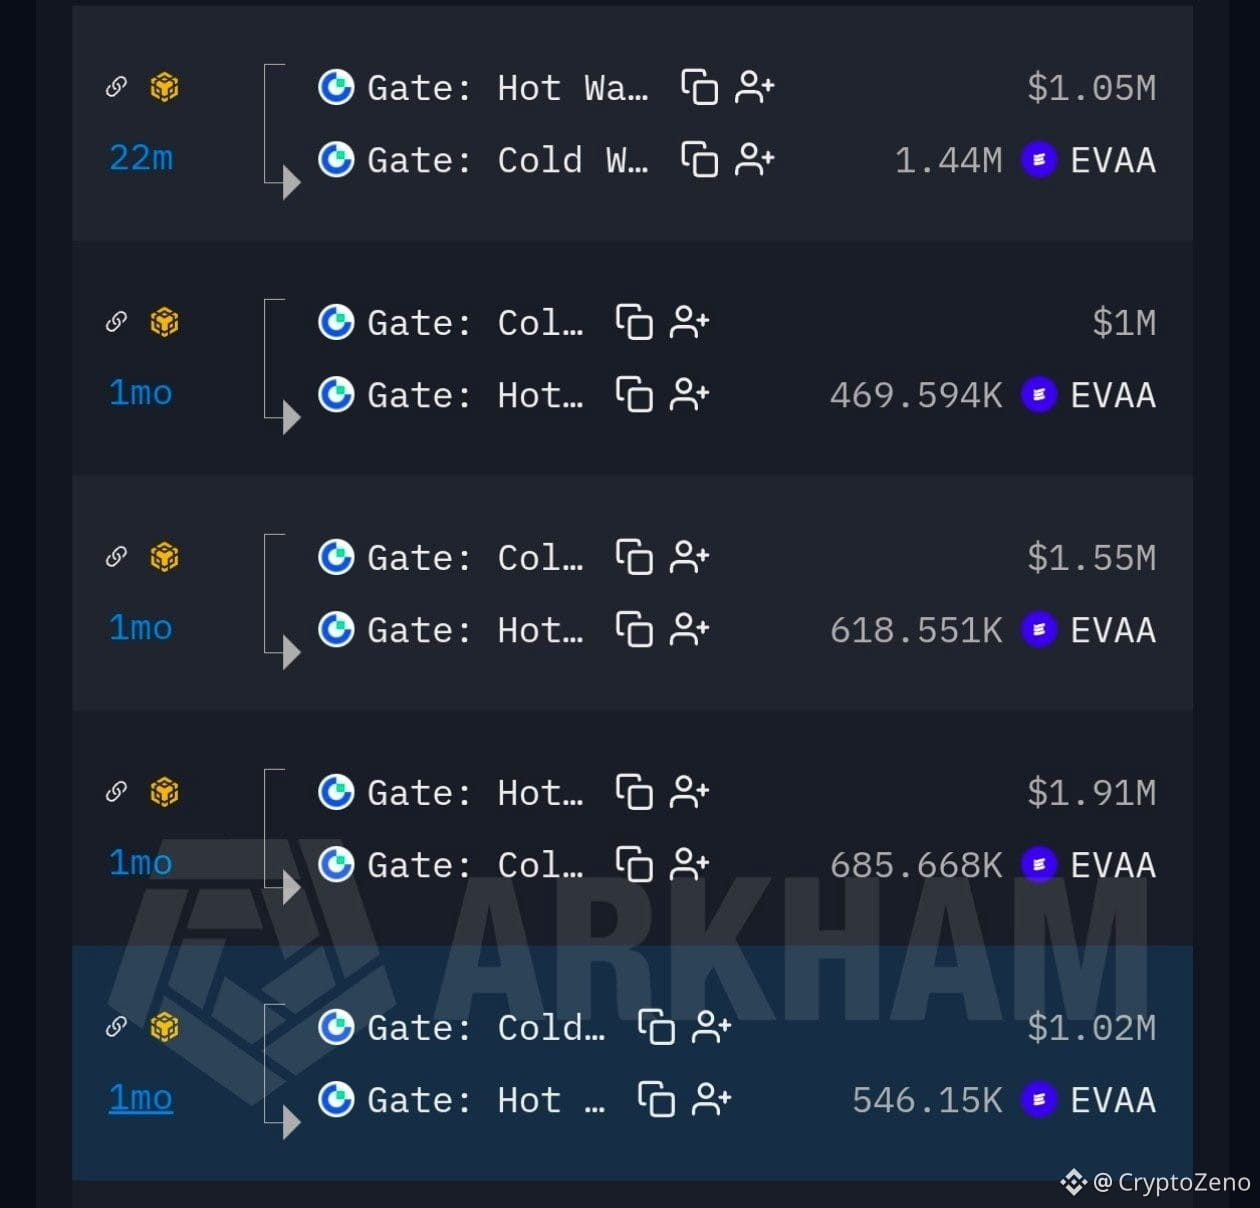
The pattern matching the transfers from 1 month ago is very interesting. $EVAA
Onchain has been quiet since then. Hopefully volume picks up and we start talking about the liq heatmap levels.
Onchain has been quiet since then. Hopefully volume picks up and we start talking about the liq heatmap levels.
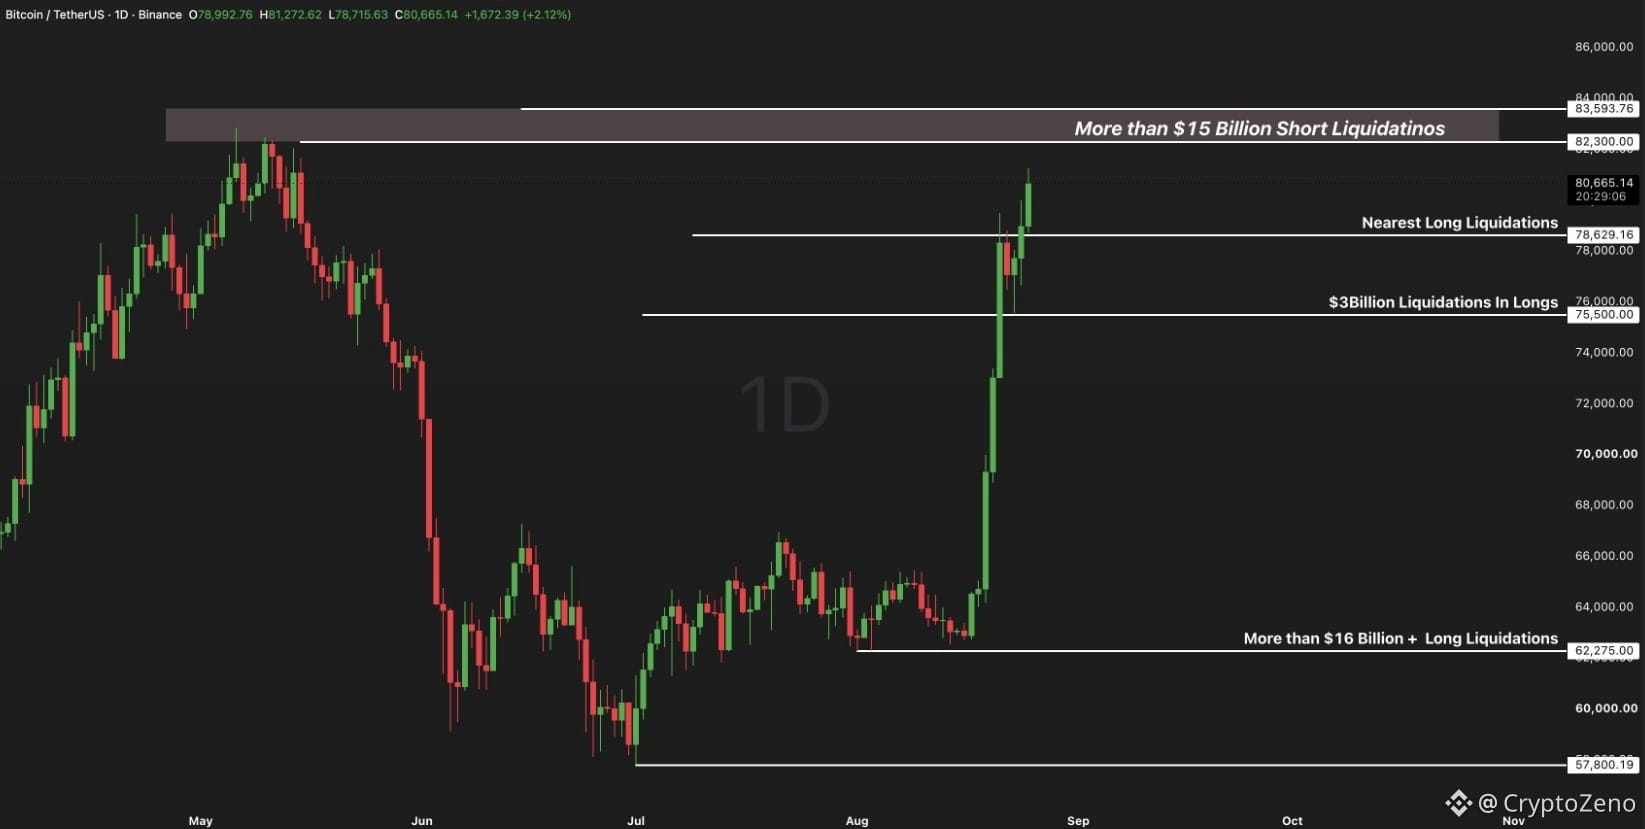
$BTC Liquidations on The Chart.
The nearest Big Shorts Liquidation cluster sits around $82k to $83k whereas nearest long liquidations cluster sit around $78k and $75k respectively.
The most liquidations we see on the chart is around the level of $62.2k where most people were left not hunted.
The nearest Big Shorts Liquidation cluster sits around $82k to $83k whereas nearest long liquidations cluster sit around $78k and $75k respectively.
The most liquidations we see on the chart is around the level of $62.2k where most people were left not hunted.
Partly True
A recent Dusk developer update had a detail I found more interesting than another market announcement: the team is tightening the tooling around Groth16 verification in Solidity. The new zk-tools work adds tooling to generate and validate a Groth16 verifier for Solidity, which makes the privacy stack easier to connect with EVM applications.
That may sound like a small developer improvement, but I think these are the pieces that decide whether a technical architecture is actually usable. A privacy primitive can be impressive on paper, but if developers have to build complicated verification infrastructure around it themselves, adoption becomes much harder.
The other thing I noticed in the same update was the work on PLONK validation, with stricter checks for malformed proofs and edge cases. That is not the kind of update that creates much noise, but I prefer seeing this kind of engineering progress because regulated applications need predictable failure handling just as much as they need privacy.
I hope Dusk keeps pushing this developer tooling further. If Solidity developers can eventually use Dusk’s ZK infrastructure without needing to become cryptography specialists first, that could make the whole stack considerably more practical.
Would better tooling end up being just as important as the underlying privacy technology for $DUSK ?
#dusk @Dusk
That may sound like a small developer improvement, but I think these are the pieces that decide whether a technical architecture is actually usable. A privacy primitive can be impressive on paper, but if developers have to build complicated verification infrastructure around it themselves, adoption becomes much harder.
The other thing I noticed in the same update was the work on PLONK validation, with stricter checks for malformed proofs and edge cases. That is not the kind of update that creates much noise, but I prefer seeing this kind of engineering progress because regulated applications need predictable failure handling just as much as they need privacy.
I hope Dusk keeps pushing this developer tooling further. If Solidity developers can eventually use Dusk’s ZK infrastructure without needing to become cryptography specialists first, that could make the whole stack considerably more practical.
Would better tooling end up being just as important as the underlying privacy technology for $DUSK ?
#dusk @Dusk
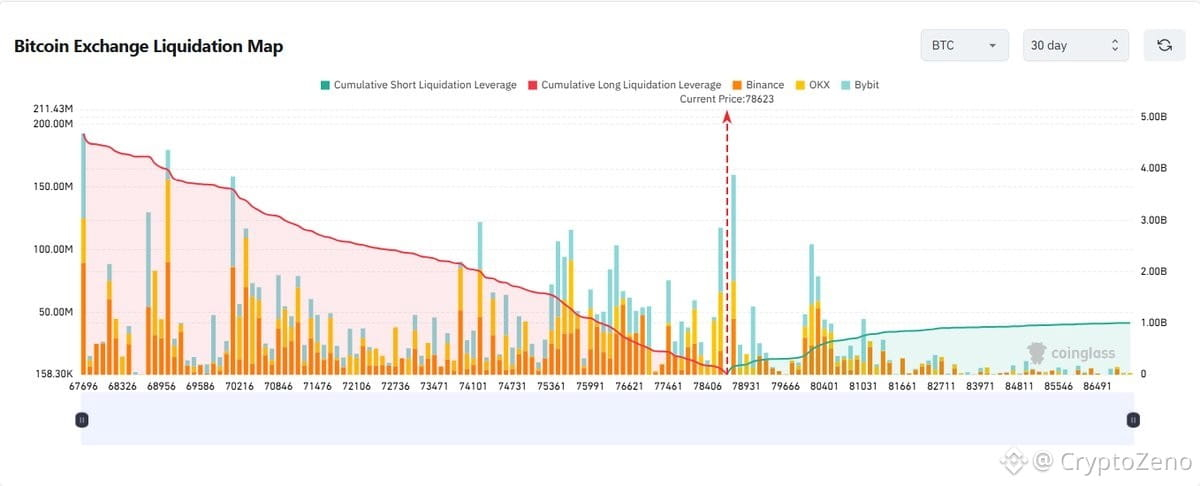
$BTC reached $80,000 in a massive short liquidation event.
Billions of reasons why price could retrace to $69,000.
Daily chart currently remains ultra bullish, weekly is bullish, but pullbacks are healthy.
Billions of reasons why price could retrace to $69,000.
Daily chart currently remains ultra bullish, weekly is bullish, but pullbacks are healthy.
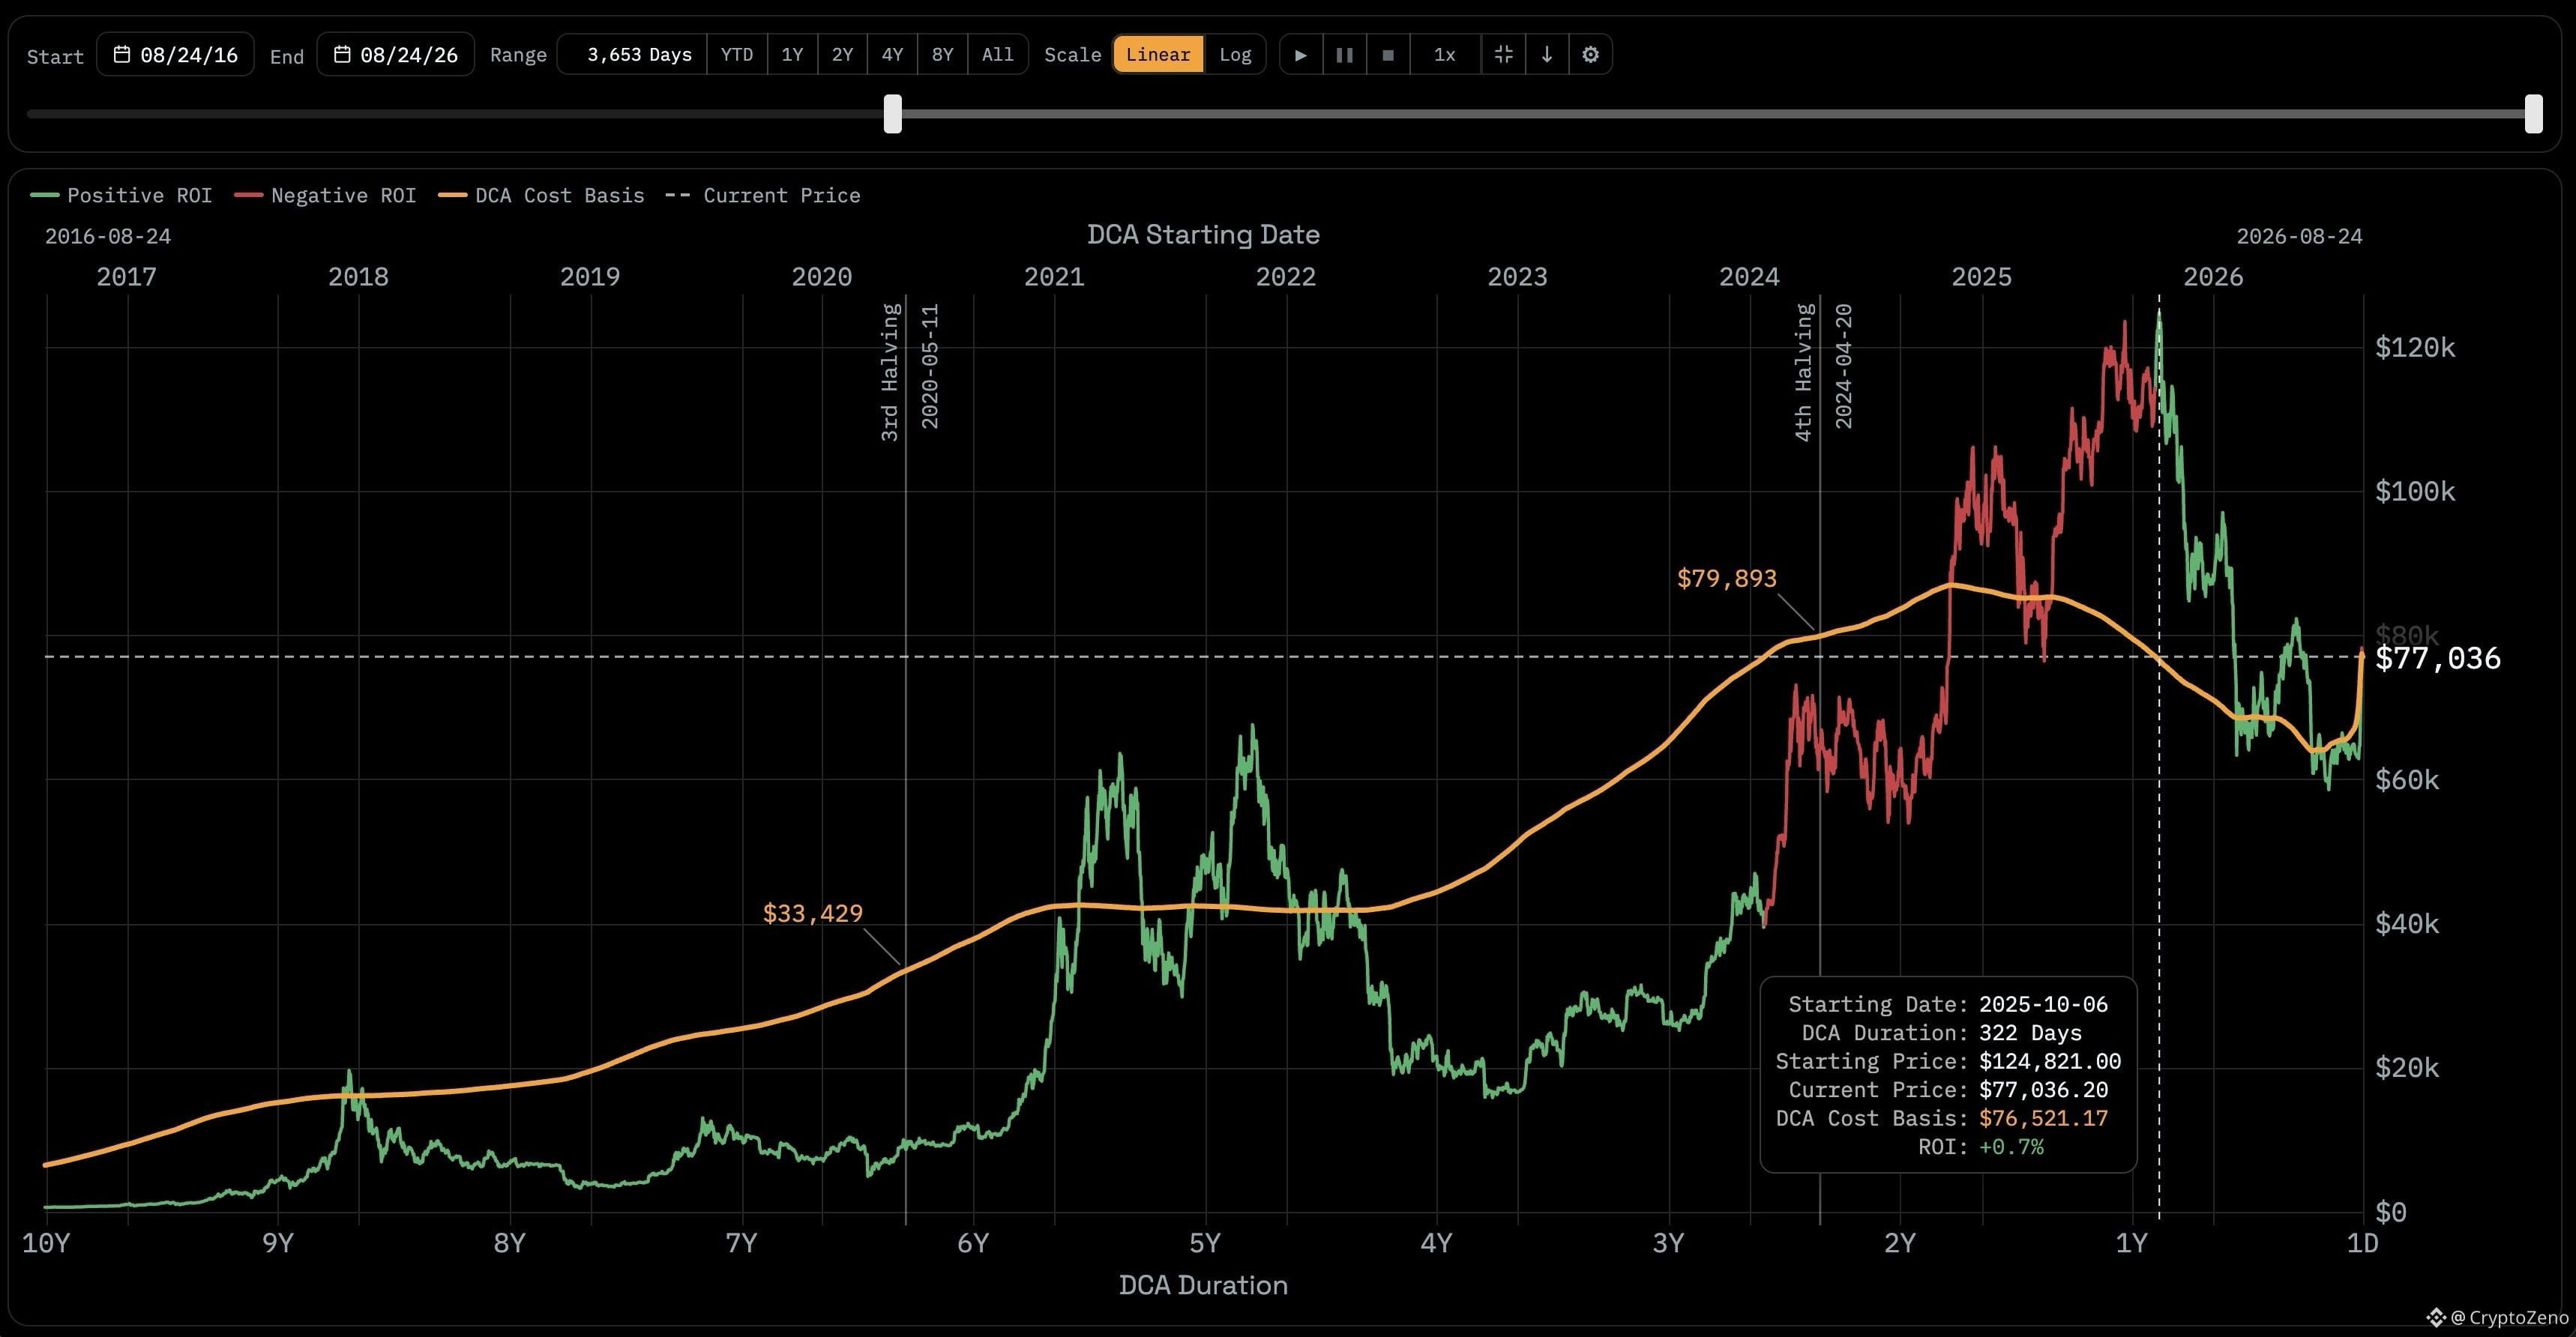
Those who started DCA'ing at the all time high are now in profit.
The power of dollar cost averaging.
The power of dollar cost averaging.
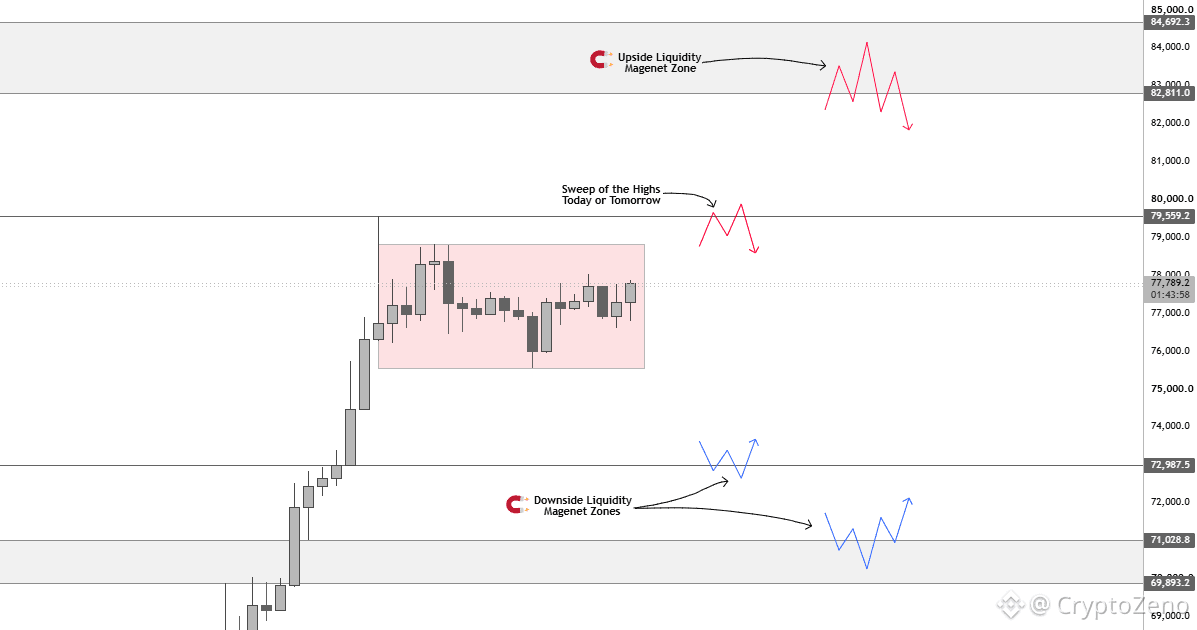
$BTC The new weekly candle just opened after we had a strong 26% impulsive pump last week. Usually, what follows these kinds of impulses is a slow, boring market as liquidity rebalances.
That's exactly what we're seeing inside this Red Box. PA is extremely slow at the moment, but we have liquidity building up on both sides.
Towards the upside, we have the weekend liquidity above the current high around the 79.5k region. A sweep of this high today or tomorrow would likely confirm the local top if it's not already in.
However, if we continue pushing through that weekend liquidity, the next POI is going to be the 82.6k-82.8k region, where we currently have the HTF Liquidity Magnet Zone.
If we do get a move into these upper levels, I will look to trigger into a Short position targeting the 72.9k region, where we have an untapped Daily imbalance zone.
In case we push through that Daily imbalance zone, the next POI for a bounce will be the 71k-69k region. However, a pullback into this zone is somewhat unlikely, as we mostly see flat/shallow retracements after a strong impulsive move.
These are pretty much the areas I'm currently interested in. I don't see many worthy setups forming on the LTF as of now.
For now, It's best to let the market tap into the HTF Key Zones first before triggering into any new positions.
That's exactly what we're seeing inside this Red Box. PA is extremely slow at the moment, but we have liquidity building up on both sides.
Towards the upside, we have the weekend liquidity above the current high around the 79.5k region. A sweep of this high today or tomorrow would likely confirm the local top if it's not already in.
However, if we continue pushing through that weekend liquidity, the next POI is going to be the 82.6k-82.8k region, where we currently have the HTF Liquidity Magnet Zone.
If we do get a move into these upper levels, I will look to trigger into a Short position targeting the 72.9k region, where we have an untapped Daily imbalance zone.
In case we push through that Daily imbalance zone, the next POI for a bounce will be the 71k-69k region. However, a pullback into this zone is somewhat unlikely, as we mostly see flat/shallow retracements after a strong impulsive move.
These are pretty much the areas I'm currently interested in. I don't see many worthy setups forming on the LTF as of now.
For now, It's best to let the market tap into the HTF Key Zones first before triggering into any new positions.
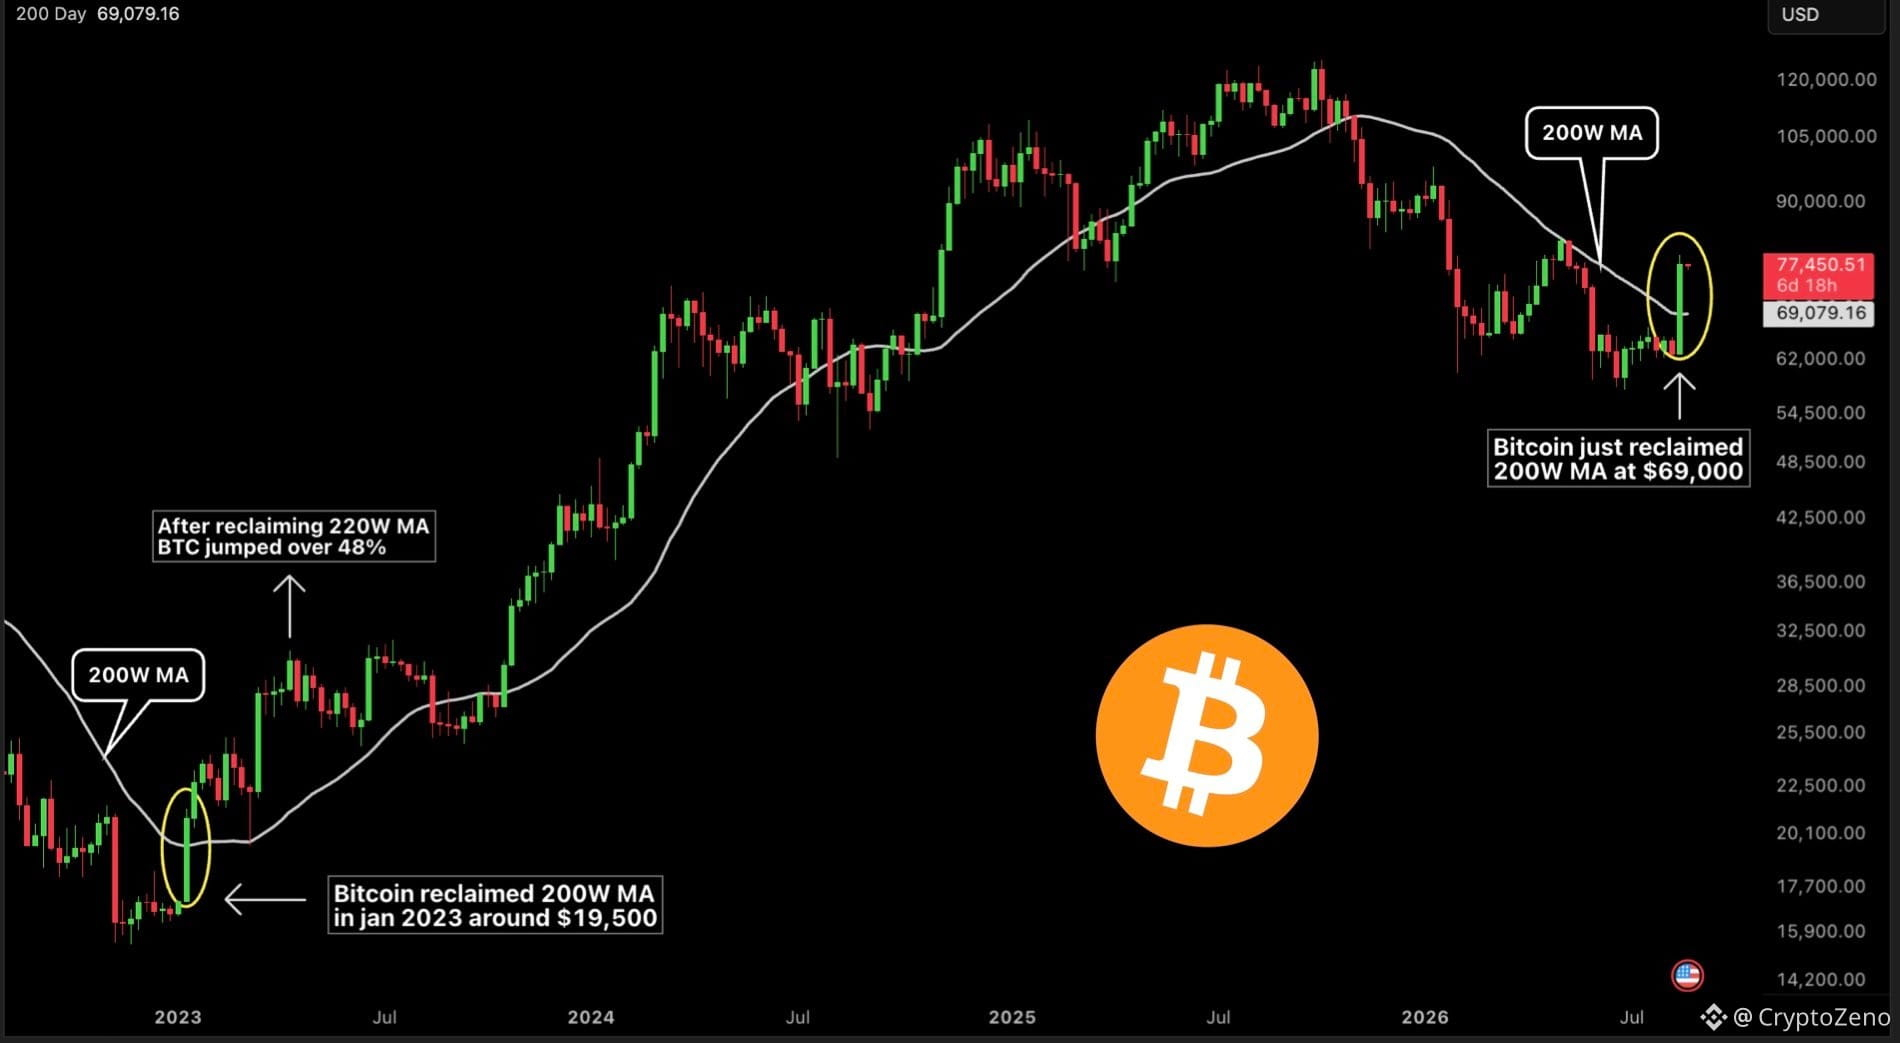
Bitcoin is going to $100k+ in 3 months?
BTC just reclaimed the 200W MA this week, the most important level for a trend reversal.
When BTC reclaimed 200W MA last bear market, it pumped +48% in the next 90 days and started a new bull run.
If history repeats, the bottom is in and the biggest bull run starts now.
BTC just reclaimed the 200W MA this week, the most important level for a trend reversal.
When BTC reclaimed 200W MA last bear market, it pumped +48% in the next 90 days and started a new bull run.
If history repeats, the bottom is in and the biggest bull run starts now.
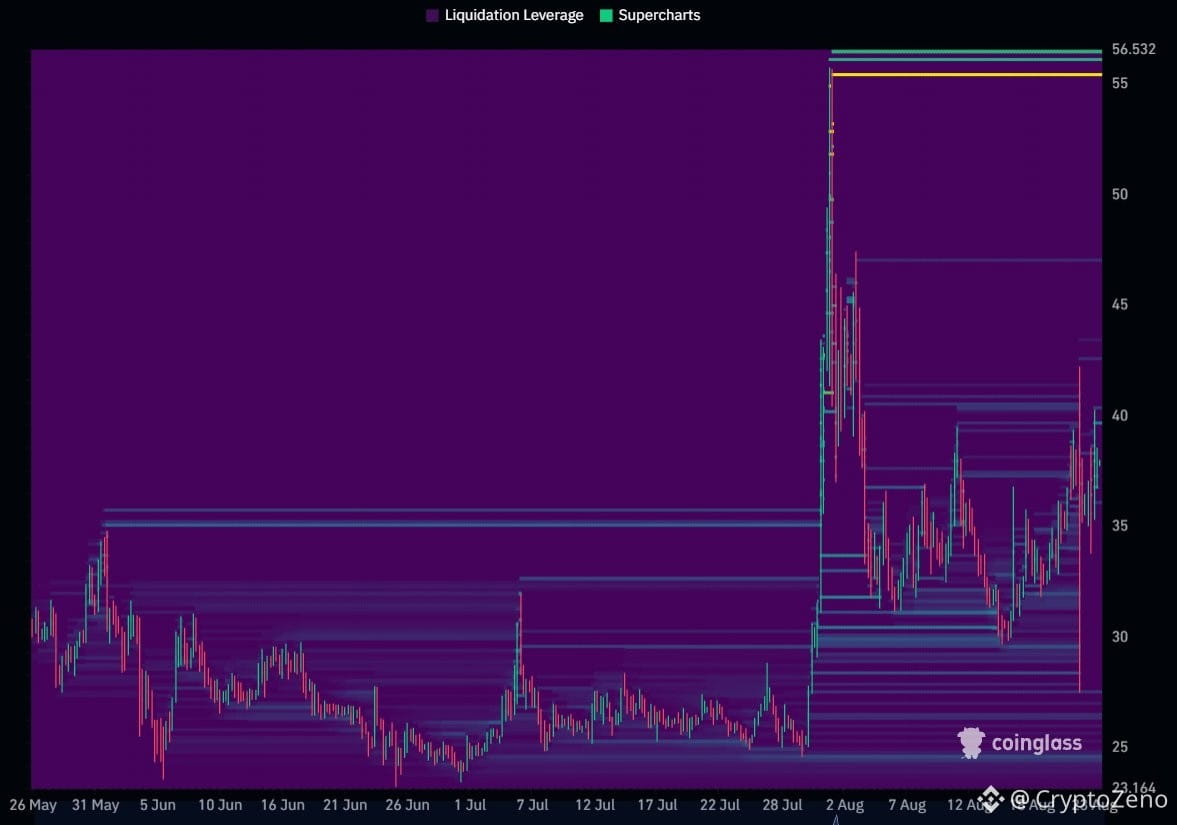
CZ posted about Giggle Academy donations again today, does it move $GIGGLE
Giggle Fund's own treasury wallet sits first on the donation list with 11,326 BNB (roughly $7.9M). The address CZ mentioned sits second with 1,435 BNB (roughly $1M), raised over two weeks.
On the derivatives side there's a strong split. L/S at 0.71, the crowd is short. Top trader position ratio at 3.31, big accounts are clearly long. One of the widest splits we've looked at.
But taker buy/sell is 0.82, the aggressive side is net selling. Even with price up, whoever's hitting the market is selling into it.
Futures at 10.8x spot, spot volume is just $8.75M, not even a quarter of market cap. Leverage is carrying most of this move.
The liquidation map shows two clear levels
There was a near-vertical spike from 25 to 56 on August 2. Above, a strong cluster still sits at the 55-56 range. Below, a base has formed around 35, current price (37.9) sits right above that band.
CZ bringing it back into the spotlight keeps community attention alive, and the split is strong. But spot support is still thin, this isn't yet a structure that can carry itself to the 55-56 range on its own.
Giggle Fund's own treasury wallet sits first on the donation list with 11,326 BNB (roughly $7.9M). The address CZ mentioned sits second with 1,435 BNB (roughly $1M), raised over two weeks.
On the derivatives side there's a strong split. L/S at 0.71, the crowd is short. Top trader position ratio at 3.31, big accounts are clearly long. One of the widest splits we've looked at.
But taker buy/sell is 0.82, the aggressive side is net selling. Even with price up, whoever's hitting the market is selling into it.
Futures at 10.8x spot, spot volume is just $8.75M, not even a quarter of market cap. Leverage is carrying most of this move.
The liquidation map shows two clear levels
There was a near-vertical spike from 25 to 56 on August 2. Above, a strong cluster still sits at the 55-56 range. Below, a base has formed around 35, current price (37.9) sits right above that band.
CZ bringing it back into the spotlight keeps community attention alive, and the split is strong. But spot support is still thin, this isn't yet a structure that can carry itself to the 55-56 range on its own.
Verified
A detail in Dusk that I keep finding more interesting is the two different paths developers can take.
A team building directly on the native layer can use Rust, WASM, DuskVM and native ZK functionality. Another team can come through DuskEVM with Solidity, Foundry, Hardhat, viem or ethers, while still using DUSK for gas and DuskDS for settlement and data availability.
That separation makes sense to me because regulated finance probably does not need every application built in exactly the same way. Some teams may want maximum control over privacy and execution, while others would rather keep the tooling they already know. Dusk seems to be trying to accommodate both instead of forcing developers into one route.
The interesting part is that DuskEVM is still on testnet while the native Dusk layer is already live. I actually like seeing that distinction clearly because it makes the roadmap easier to judge. The EVM compatibility story is still something that has to prove itself through real applications, not just documentation.
I am curious what the developer ecosystem will look like once both paths mature. Will builders mostly choose the familiar EVM route, or will the native Dusk stack become the more interesting option for applications where privacy and regulated assets really matter?
$DUSK @Dusk #dusk
A team building directly on the native layer can use Rust, WASM, DuskVM and native ZK functionality. Another team can come through DuskEVM with Solidity, Foundry, Hardhat, viem or ethers, while still using DUSK for gas and DuskDS for settlement and data availability.
That separation makes sense to me because regulated finance probably does not need every application built in exactly the same way. Some teams may want maximum control over privacy and execution, while others would rather keep the tooling they already know. Dusk seems to be trying to accommodate both instead of forcing developers into one route.
The interesting part is that DuskEVM is still on testnet while the native Dusk layer is already live. I actually like seeing that distinction clearly because it makes the roadmap easier to judge. The EVM compatibility story is still something that has to prove itself through real applications, not just documentation.
I am curious what the developer ecosystem will look like once both paths mature. Will builders mostly choose the familiar EVM route, or will the native Dusk stack become the more interesting option for applications where privacy and regulated assets really matter?
$DUSK @Dusk #dusk
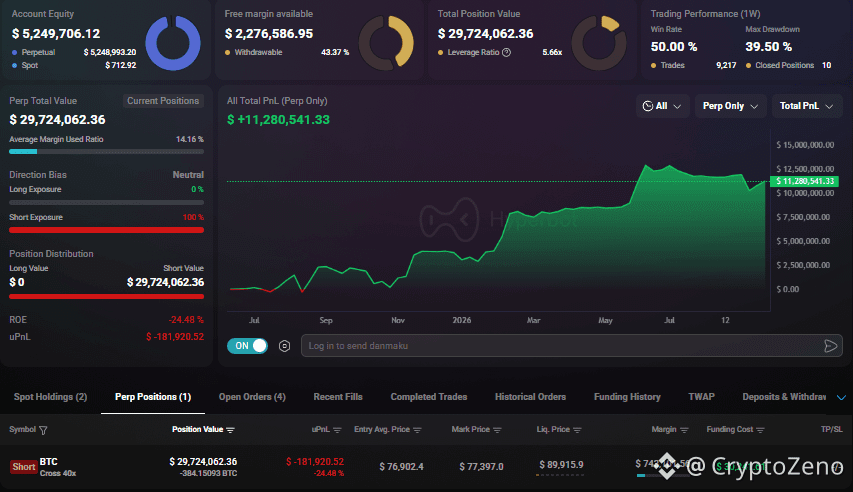
This trader opened a 40x $BTC short worth $30 million.
His total PNL over the past year: +$11.3 million.
Does he know something?
His total PNL over the past year: +$11.3 million.
Does he know something?
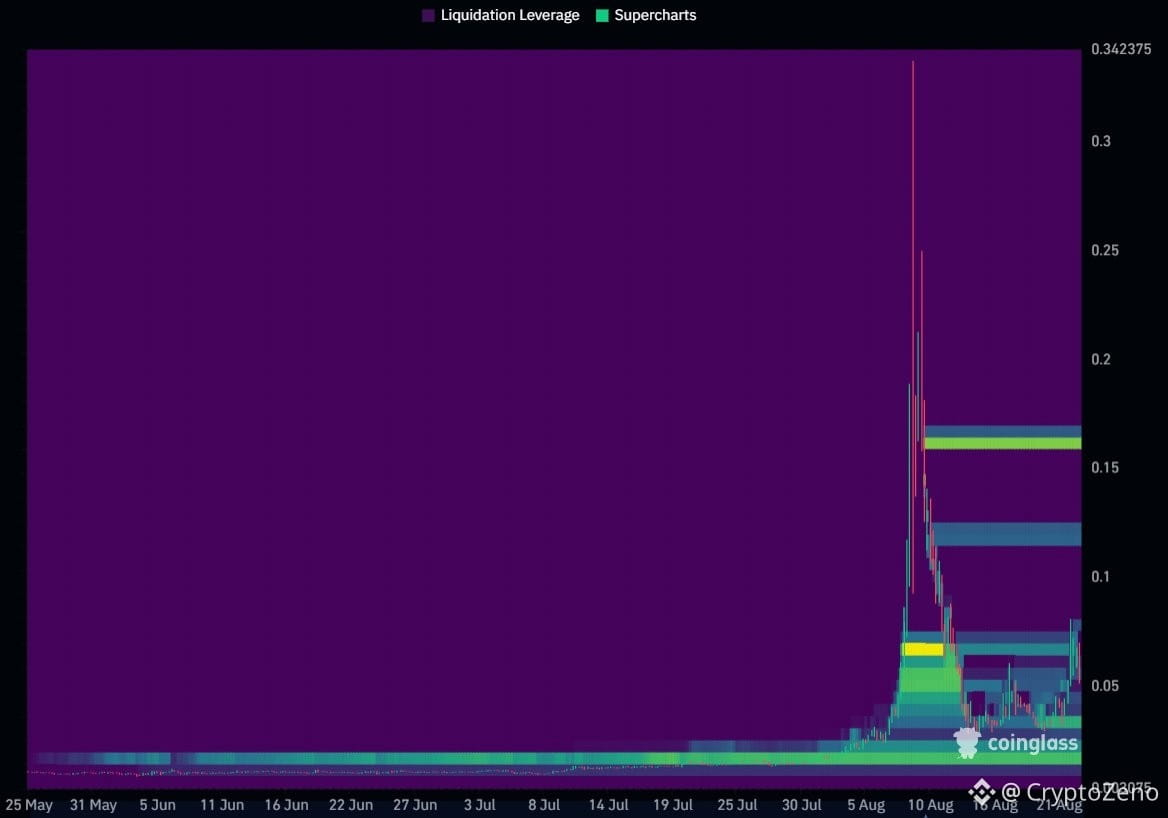
$TUT the wreckage of the August spike, and the liquidation map points down.
Price made a near-vertical spike around August 1, from 0.003 to 0.34. Then it collapsed just as fast. It's sitting at 0.0587 now, a small fraction of that peak.
Structure is still stretched
OI at 42.4% of mcap, high. Futures at 8.6x spot. Spot volume is solid ($114.89M), but futures has grown even faster. Taker at 0.97, the aggressive side leans slightly seller, even with price up 26%.
There's a split: L/S at 0.88, the crowd leans slightly short. Top trader positions at 1.59, big accounts are clearly long.
The liquidation map shows three levels
$1M sitting at 0.16. Just below the August peak, roughly 2.7x above current price. Too far out to be a near-term target.
$723K at 0.03. Below current price, the first point of contact on the way down, roughly 49% away.
$875K at 0.014. Lines up with the long flat base that held for months across June and July, a thick, well-established zone, roughly 76% below current price.
How I read it
The cluster above isn't an attractive target, it would take a 170% move to get there, not a realistic near-term scenario. The side that matters is below: 0.03 first, and if that breaks, the thick base at 0.014 comes into play.
Combined with the stretched derivatives picture (high OI, seller-leaning taker), those are the more relevant reference points in the near term.
What I'm watching
How price reacts on any approach to 0.03.
Whether it holds the 0.05-0.06 range, if it does, a new base is forming on top of this wreckage.
You can follow this data in real time in the private group. Pinned post for details.
Price made a near-vertical spike around August 1, from 0.003 to 0.34. Then it collapsed just as fast. It's sitting at 0.0587 now, a small fraction of that peak.
Structure is still stretched
OI at 42.4% of mcap, high. Futures at 8.6x spot. Spot volume is solid ($114.89M), but futures has grown even faster. Taker at 0.97, the aggressive side leans slightly seller, even with price up 26%.
There's a split: L/S at 0.88, the crowd leans slightly short. Top trader positions at 1.59, big accounts are clearly long.
The liquidation map shows three levels
$1M sitting at 0.16. Just below the August peak, roughly 2.7x above current price. Too far out to be a near-term target.
$723K at 0.03. Below current price, the first point of contact on the way down, roughly 49% away.
$875K at 0.014. Lines up with the long flat base that held for months across June and July, a thick, well-established zone, roughly 76% below current price.
How I read it
The cluster above isn't an attractive target, it would take a 170% move to get there, not a realistic near-term scenario. The side that matters is below: 0.03 first, and if that breaks, the thick base at 0.014 comes into play.
Combined with the stretched derivatives picture (high OI, seller-leaning taker), those are the more relevant reference points in the near term.
What I'm watching
How price reacts on any approach to 0.03.
Whether it holds the 0.05-0.06 range, if it does, a new base is forming on top of this wreckage.
You can follow this data in real time in the private group. Pinned post for details.
Log in to explore more content