


Head and Shoulders Pattern and Inverted Head and Shoulders Pattern are two technical chart patterns used in financial analysis to predict future price movements of assets such as stocks, currencies, and commodities. These patterns are named for their distinctive shape that resembles a human head and shoulders, or an inverted head and shoulders.
Bearish Head & Shoulder Pattern
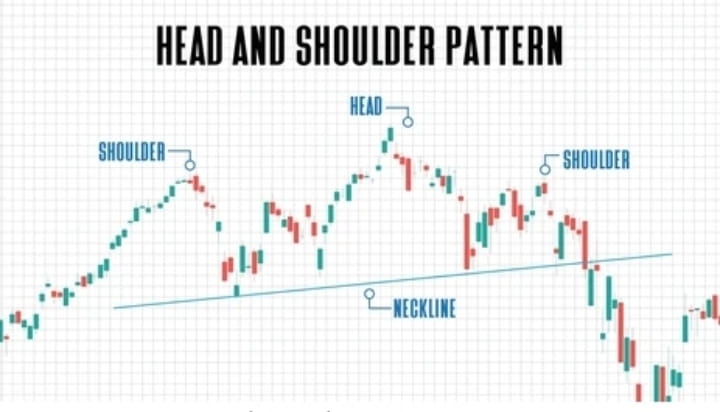
Head and Shoulders Pattern is a bearish pattern that indicates a possible trend reversal from an uptrend to a downtrend. The pattern consists of three peaks, with the middle peak being the highest, and the two outer peaks being almost equal in height. The middle peak is called the head, while the two outer peaks are called the shoulders. The neckline, which is drawn across the lows of the pattern, acts as a support level. When the price breaks below the neckline, it is a signal that the trend has reversed, and the price is likely to continue downward.
Bullish Head & Shoulder Pattern
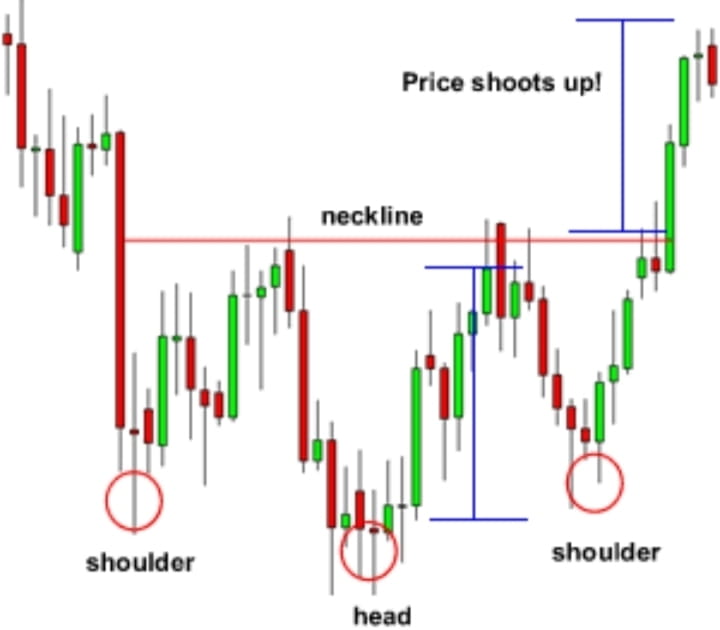
On the other hand, the Inverted Head and Shoulders Pattern is a bullish pattern that indicates a possible trend reversal from a downtrend to an uptrend. This pattern is the opposite of the Head and Shoulders Pattern, with three troughs instead of peaks. The middle trough is the lowest, and the two outer troughs are almost equal in depth. The neckline, which is drawn across the highs of the pattern, acts as a resistance level. When the price breaks above the neckline, it is a signal that the trend has reversed, and the price is likely to continue upward.
Traders and investors use these patterns to identify potential buying or selling opportunities. The Head and Shoulders Pattern can be used to identify an uptrend that is losing momentum, and the Inverted Head and Shoulders Pattern can be used to identify a downtrend that is losing momentum. These patterns are also used to set price targets and stop-loss levels.
It is important to note that these patterns are not foolproof and should be used in conjunction with other technical indicators and analysis tools. Traders should also be aware of false signals and market noise that can affect the accuracy of these patterns.
In conclusion, the Head and Shoulders Pattern and Inverted Head and Shoulders Pattern are two important technical chart patterns used in financial analysis to predict future price movements. These patterns are valuable tools for traders and investors to identify potential trend reversals and set price targets and stop-loss levels. However, it is important to use these patterns in conjunction with other technical indicators and analysis tools and to be aware of false signals and market noise.
#crypto2023 #technicalanalysis #dyor #nfa
Disclaimer: Information provided in this article is collected from internet and for educational purpose only. This is not a financial advise.