
Crypto4light
5.8k Posts

Crypto4light
 Square Verified+
Report
Block User
Find everywhere - @Crypto4light 🔥 | Daily trading ideas | My custom indicators analysis | Educational content | Crypto News |

Level 1 Creator
Open Trade
Frequent Trader
5.9 Years
0 Following
68.4K+ Followers
40.5K+ Liked
1 Badges
Posts
Portfolio
All
Quotes
Videos
Live
PINNED
·
--

Article
The best indicators set for tradingCrypto4light Indicators Set
I spent a lot of time with backtesting and coding to create this set. 6 indicators which can cut all noise on your charts and bring more light in your trading strategy.🐳 Trade ON indicator
➡️ Buy/Sell The signal appears when you can open a position for buying or selling. Stop Loss can be set according to your risk management. Entry into the position can be at the appearance of the Buy/Sell signal and the closing of the candle. Stop Loss by the body or wick of this candle. Another entry option is to wait for the closing of 40-50% of the body of the candle on which you saw the Buy/Sell signal. Stop Loss by the body or wick of the candle on which you saw the Buy/Sell signal. On example you can see 35% profit on spot, 4H timeframe trade. Sometimes you can see signal just blinking, so wait until signal confirmed or try go to lower timeframe to see confirmation for entry by your risk management and strategy.
➡️ Red or Green triangles
Once a Buy/Sell signal appears and you enter a position, you have several options. It all depends on your trading style and risk management.
The first option - If, for example, you entered on the Buy signal, you can close the purchase at the appearance of the Take Profit signal, or at the appearance of the Sell signal, and open a position in another direction.The second option, after opening a position when triangles appear, this is a signal to close a certain percentage of the position in the plus. With each new triangle, you can close % of your position and move the Stop Loss to breakeven.The third option, after opening a position at the appearance of triangles, closing a full position and looking for a possible option to open a position in the other direction, closing the position after the triangles should take place at the appearance of the main Buy/Sell signal.
➡️ Take Profit
➡️ Two identical signals in a row
🐳 Direction indicator
Circles will appear from above or below. The circles will signal that the main market makers are starting to reduce or gain their position. Big players always need liquidity, so they can build or reduce a position for quite a long time. Round dots are not the main signal for tradingA red or green triangle signals a final change in the local or global trend, depending on your timeframe. Market Makers or players with large positions have exited the market, or conversely gained enough position to change the direction of price movement.The green and red solid lines are the levels where the trend is most likely to end
The green and red dashed lines are the levels where the big players are more likely to start gradually selling off or gaining a position to change the trend before the momentum. In the style settings, you can change the input positions of each of the lines, for yourself or for a specific asset. But the settings are already set in the most optimal way.
🐳 ADZ (Accumulation/Distribution Zones)
The red solid zone shows the zone where the big players will complete the sale of their position.The solid green area shows where the big players will accumulate their positions.The middle blue zone shows where medium and small players start to accumulate or sell off their positions.The yellow zone inside the blue zone shows a trend change and this means that most likely the big players have already gained a position to start selling or gaining it depending on the timeframe in which you are trading.
🐳 Take Profit indicator
The first lower "Buy" line, when the price drops to this line is a good point to enter a position or gradually build a position.The bottom green line "Fundamental price" is the real value of the asset. Sometimes when the media background about the asset is negative and buyers are not interested in the asset, the price can fall below its fundamental price. Then this is the best time to buy the asset.The first upper Take Profit line is a line where you can lock part of the profit or close the entire position. There is a possibility of opening a short position if you trade on the futures market
The very top Exit line is the line where you need to close 100% of the trade position. If you are an investor, you do not need to close the entire position and exit the asset, because all lines are dynamic and change depending on the cycle in which the asset is located.
🐳 Market Mood Indicator
On different timeframes, you can view the mood that is currently present in the market. Trend, euphoria, position selection, or lack of interest.
Red and orange color - fear and overbought in the market
Green - Accumulation and purchases on the market
Yellow - Gradual set of position
White - purchases and lack of interest from small investors
Blue - Neutral mood in the market
I rename color zones so you can turn on alerts and easier understand notifications. Some colors got 2 alerts because of gradation based on input data, so you can choose any. You should understand on downtrend for example orange zone can be still be a belief sentiment because traders belief price will not drop.
Dark red - Euphoria
Light red - Thrill
Orange (light and dark) - Belief / Strong Belief
Yellow - Optimism
Green - Hope
Light blue - Disbelief
Dark blue - Capitulation
White - Depression
🐳 Money Power Indicator
When the asset reaches one of the zones, it can serve as a good signal to close a part of the position or to start a gradual acquisition of the position according to your trading timeframe.
An almost ideal signal for deciding whether to enter or exit a position would be a divergence on the price chart and the curve on the Money Power indicator. If you are in a long position, for example, and you see that the price on the chart continues to rise, but in the overbought zone, the lines of the Money Power indicator show lower highs, this is a signal that a large player has almost completely sold out his position on this timeframe.
Of course, the price may continue to grow for some time depending on the timeframe, but such indicators usually indicate the outflow of money from large investors and small players will not be able to keep the asset from falling for a long time. Everything is the same but in a different direction in the oversold zone. When a big player gradually gains a position and we see that the money flow curve goes up, and the price on the chart and candles show lower minimums. This will be a great signal to enter a position. You can enter or close a position by analyzing older timeframes W, 3D 1D depending on your trading style.
In new version you also can find a new signals (explanation with default colors, but you can modify it to your theme)
Yellow block - Whales sell or close % of position
Yellow block with arrow down - Whales strong sell
Blue block - Whales buy
Blue block with arrow up - Whales strong buy
Triangle down - Bearish RSI divergency
Triangle Up - Bullish RSI divergency
Red Circle - Bearish MACD divergency
Green Circle - Bullish MACD divergency
I am not a financial advisor. All indicators created with my own personal experience. Do NOT trade or invest based only on indicators. Always do your own research and due diligence before investing.
All indicators can be used on different timeframes. The higher timeframe, the stronger signal. Your entry or exit point should be base on several indicators from the set, your trading strategy and your risk management. Indicators cannot predict or analyze future events in the world, the release of data in economic reports, statements in the media by public figures, so always follow your risk management when you open trades.
☑️ Always follow risk management and this set of indicators will help you. I wish you successful trading.
#trading #crypto
The best indicators set for trading
Crypto4light Indicators Set
I spent a lot of time with backtesting and coding to create this set. 6 indicators which can cut all noise on your charts and bring more light in your trading strategy.🐳 Trade ON indicator
➡️ Buy/Sell The signal appears when you can open a position for buying or selling. Stop Loss can be set according to your risk management. Entry into the position can be at the appearance of the Buy/Sell signal and the closing of the candle. Stop Loss by the body or wick of this candle. Another entry option is to wait for the closing of 40-50% of the body of the candle on which you saw the Buy/Sell signal. Stop Loss by the body or wick of the candle on which you saw the Buy/Sell signal. On example you can see 35% profit on spot, 4H timeframe trade. Sometimes you can see signal just blinking, so wait until signal confirmed or try go to lower timeframe to see confirmation for entry by your risk management and strategy.
➡️ Red or Green triangles
Once a Buy/Sell signal appears and you enter a position, you have several options. It all depends on your trading style and risk management.
The first option - If, for example, you entered on the Buy signal, you can close the purchase at the appearance of the Take Profit signal, or at the appearance of the Sell signal, and open a position in another direction.The second option, after opening a position when triangles appear, this is a signal to close a certain percentage of the position in the plus. With each new triangle, you can close % of your position and move the Stop Loss to breakeven.The third option, after opening a position at the appearance of triangles, closing a full position and looking for a possible option to open a position in the other direction, closing the position after the triangles should take place at the appearance of the main Buy/Sell signal.
➡️ Take Profit
➡️ Two identical signals in a row
🐳 Direction indicator
Circles will appear from above or below. The circles will signal that the main market makers are starting to reduce or gain their position. Big players always need liquidity, so they can build or reduce a position for quite a long time. Round dots are not the main signal for tradingA red or green triangle signals a final change in the local or global trend, depending on your timeframe. Market Makers or players with large positions have exited the market, or conversely gained enough position to change the direction of price movement.The green and red solid lines are the levels where the trend is most likely to end
The green and red dashed lines are the levels where the big players are more likely to start gradually selling off or gaining a position to change the trend before the momentum. In the style settings, you can change the input positions of each of the lines, for yourself or for a specific asset. But the settings are already set in the most optimal way.
🐳 ADZ (Accumulation/Distribution Zones)
The red solid zone shows the zone where the big players will complete the sale of their position.The solid green area shows where the big players will accumulate their positions.The middle blue zone shows where medium and small players start to accumulate or sell off their positions.The yellow zone inside the blue zone shows a trend change and this means that most likely the big players have already gained a position to start selling or gaining it depending on the timeframe in which you are trading.
🐳 Take Profit indicator
The first lower "Buy" line, when the price drops to this line is a good point to enter a position or gradually build a position.The bottom green line "Fundamental price" is the real value of the asset. Sometimes when the media background about the asset is negative and buyers are not interested in the asset, the price can fall below its fundamental price. Then this is the best time to buy the asset.The first upper Take Profit line is a line where you can lock part of the profit or close the entire position. There is a possibility of opening a short position if you trade on the futures market
The very top Exit line is the line where you need to close 100% of the trade position. If you are an investor, you do not need to close the entire position and exit the asset, because all lines are dynamic and change depending on the cycle in which the asset is located.
🐳 Market Mood Indicator
On different timeframes, you can view the mood that is currently present in the market. Trend, euphoria, position selection, or lack of interest.
Red and orange color - fear and overbought in the market
Green - Accumulation and purchases on the market
Yellow - Gradual set of position
White - purchases and lack of interest from small investors
Blue - Neutral mood in the market
I rename color zones so you can turn on alerts and easier understand notifications. Some colors got 2 alerts because of gradation based on input data, so you can choose any. You should understand on downtrend for example orange zone can be still be a belief sentiment because traders belief price will not drop.
Dark red - Euphoria
Light red - Thrill
Orange (light and dark) - Belief / Strong Belief
Yellow - Optimism
Green - Hope
Light blue - Disbelief
Dark blue - Capitulation
White - Depression
🐳 Money Power Indicator
When the asset reaches one of the zones, it can serve as a good signal to close a part of the position or to start a gradual acquisition of the position according to your trading timeframe.
An almost ideal signal for deciding whether to enter or exit a position would be a divergence on the price chart and the curve on the Money Power indicator. If you are in a long position, for example, and you see that the price on the chart continues to rise, but in the overbought zone, the lines of the Money Power indicator show lower highs, this is a signal that a large player has almost completely sold out his position on this timeframe.
Of course, the price may continue to grow for some time depending on the timeframe, but such indicators usually indicate the outflow of money from large investors and small players will not be able to keep the asset from falling for a long time. Everything is the same but in a different direction in the oversold zone. When a big player gradually gains a position and we see that the money flow curve goes up, and the price on the chart and candles show lower minimums. This will be a great signal to enter a position. You can enter or close a position by analyzing older timeframes W, 3D 1D depending on your trading style.
In new version you also can find a new signals (explanation with default colors, but you can modify it to your theme)
Yellow block - Whales sell or close % of position
Yellow block with arrow down - Whales strong sell
Blue block - Whales buy
Blue block with arrow up - Whales strong buy
Triangle down - Bearish RSI divergency
Triangle Up - Bullish RSI divergency
Red Circle - Bearish MACD divergency
Green Circle - Bullish MACD divergency
I am not a financial advisor. All indicators created with my own personal experience. Do NOT trade or invest based only on indicators. Always do your own research and due diligence before investing.
All indicators can be used on different timeframes. The higher timeframe, the stronger signal. Your entry or exit point should be base on several indicators from the set, your trading strategy and your risk management. Indicators cannot predict or analyze future events in the world, the release of data in economic reports, statements in the media by public figures, so always follow your risk management when you open trades.
☑️ Always follow risk management and this set of indicators will help you. I wish you successful trading.
#trading #crypto
I spent a lot of time with backtesting and coding to create this set. 6 indicators which can cut all noise on your charts and bring more light in your trading strategy.🐳 Trade ON indicator
➡️ Buy/Sell The signal appears when you can open a position for buying or selling. Stop Loss can be set according to your risk management. Entry into the position can be at the appearance of the Buy/Sell signal and the closing of the candle. Stop Loss by the body or wick of this candle. Another entry option is to wait for the closing of 40-50% of the body of the candle on which you saw the Buy/Sell signal. Stop Loss by the body or wick of the candle on which you saw the Buy/Sell signal. On example you can see 35% profit on spot, 4H timeframe trade. Sometimes you can see signal just blinking, so wait until signal confirmed or try go to lower timeframe to see confirmation for entry by your risk management and strategy.
➡️ Red or Green triangles
Once a Buy/Sell signal appears and you enter a position, you have several options. It all depends on your trading style and risk management.
The first option - If, for example, you entered on the Buy signal, you can close the purchase at the appearance of the Take Profit signal, or at the appearance of the Sell signal, and open a position in another direction.The second option, after opening a position when triangles appear, this is a signal to close a certain percentage of the position in the plus. With each new triangle, you can close % of your position and move the Stop Loss to breakeven.The third option, after opening a position at the appearance of triangles, closing a full position and looking for a possible option to open a position in the other direction, closing the position after the triangles should take place at the appearance of the main Buy/Sell signal.
➡️ Take Profit
➡️ Two identical signals in a row
🐳 Direction indicator
Circles will appear from above or below. The circles will signal that the main market makers are starting to reduce or gain their position. Big players always need liquidity, so they can build or reduce a position for quite a long time. Round dots are not the main signal for tradingA red or green triangle signals a final change in the local or global trend, depending on your timeframe. Market Makers or players with large positions have exited the market, or conversely gained enough position to change the direction of price movement.The green and red solid lines are the levels where the trend is most likely to end
The green and red dashed lines are the levels where the big players are more likely to start gradually selling off or gaining a position to change the trend before the momentum. In the style settings, you can change the input positions of each of the lines, for yourself or for a specific asset. But the settings are already set in the most optimal way.
🐳 ADZ (Accumulation/Distribution Zones)
The red solid zone shows the zone where the big players will complete the sale of their position.The solid green area shows where the big players will accumulate their positions.The middle blue zone shows where medium and small players start to accumulate or sell off their positions.The yellow zone inside the blue zone shows a trend change and this means that most likely the big players have already gained a position to start selling or gaining it depending on the timeframe in which you are trading.
🐳 Take Profit indicator
The first lower "Buy" line, when the price drops to this line is a good point to enter a position or gradually build a position.The bottom green line "Fundamental price" is the real value of the asset. Sometimes when the media background about the asset is negative and buyers are not interested in the asset, the price can fall below its fundamental price. Then this is the best time to buy the asset.The first upper Take Profit line is a line where you can lock part of the profit or close the entire position. There is a possibility of opening a short position if you trade on the futures market
The very top Exit line is the line where you need to close 100% of the trade position. If you are an investor, you do not need to close the entire position and exit the asset, because all lines are dynamic and change depending on the cycle in which the asset is located.
🐳 Market Mood Indicator
On different timeframes, you can view the mood that is currently present in the market. Trend, euphoria, position selection, or lack of interest.
Red and orange color - fear and overbought in the market
Green - Accumulation and purchases on the market
Yellow - Gradual set of position
White - purchases and lack of interest from small investors
Blue - Neutral mood in the market
I rename color zones so you can turn on alerts and easier understand notifications. Some colors got 2 alerts because of gradation based on input data, so you can choose any. You should understand on downtrend for example orange zone can be still be a belief sentiment because traders belief price will not drop.
Dark red - Euphoria
Light red - Thrill
Orange (light and dark) - Belief / Strong Belief
Yellow - Optimism
Green - Hope
Light blue - Disbelief
Dark blue - Capitulation
White - Depression
🐳 Money Power Indicator
When the asset reaches one of the zones, it can serve as a good signal to close a part of the position or to start a gradual acquisition of the position according to your trading timeframe.
An almost ideal signal for deciding whether to enter or exit a position would be a divergence on the price chart and the curve on the Money Power indicator. If you are in a long position, for example, and you see that the price on the chart continues to rise, but in the overbought zone, the lines of the Money Power indicator show lower highs, this is a signal that a large player has almost completely sold out his position on this timeframe.
Of course, the price may continue to grow for some time depending on the timeframe, but such indicators usually indicate the outflow of money from large investors and small players will not be able to keep the asset from falling for a long time. Everything is the same but in a different direction in the oversold zone. When a big player gradually gains a position and we see that the money flow curve goes up, and the price on the chart and candles show lower minimums. This will be a great signal to enter a position. You can enter or close a position by analyzing older timeframes W, 3D 1D depending on your trading style.
In new version you also can find a new signals (explanation with default colors, but you can modify it to your theme)
Yellow block - Whales sell or close % of position
Yellow block with arrow down - Whales strong sell
Blue block - Whales buy
Blue block with arrow up - Whales strong buy
Triangle down - Bearish RSI divergency
Triangle Up - Bullish RSI divergency
Red Circle - Bearish MACD divergency
Green Circle - Bullish MACD divergency
I am not a financial advisor. All indicators created with my own personal experience. Do NOT trade or invest based only on indicators. Always do your own research and due diligence before investing.
All indicators can be used on different timeframes. The higher timeframe, the stronger signal. Your entry or exit point should be base on several indicators from the set, your trading strategy and your risk management. Indicators cannot predict or analyze future events in the world, the release of data in economic reports, statements in the media by public figures, so always follow your risk management when you open trades.
☑️ Always follow risk management and this set of indicators will help you. I wish you successful trading.
#trading #crypto
38
17
157
3.6k
·
--
The Altcoin Crash Is Not Over: 2 Coins at Their Final Support $ALGO $HBAR
The Altcoin Crash Is Not Over: 2 Coins at Their Final Support $ALGO $HBAR
2
920
·
--
Verified
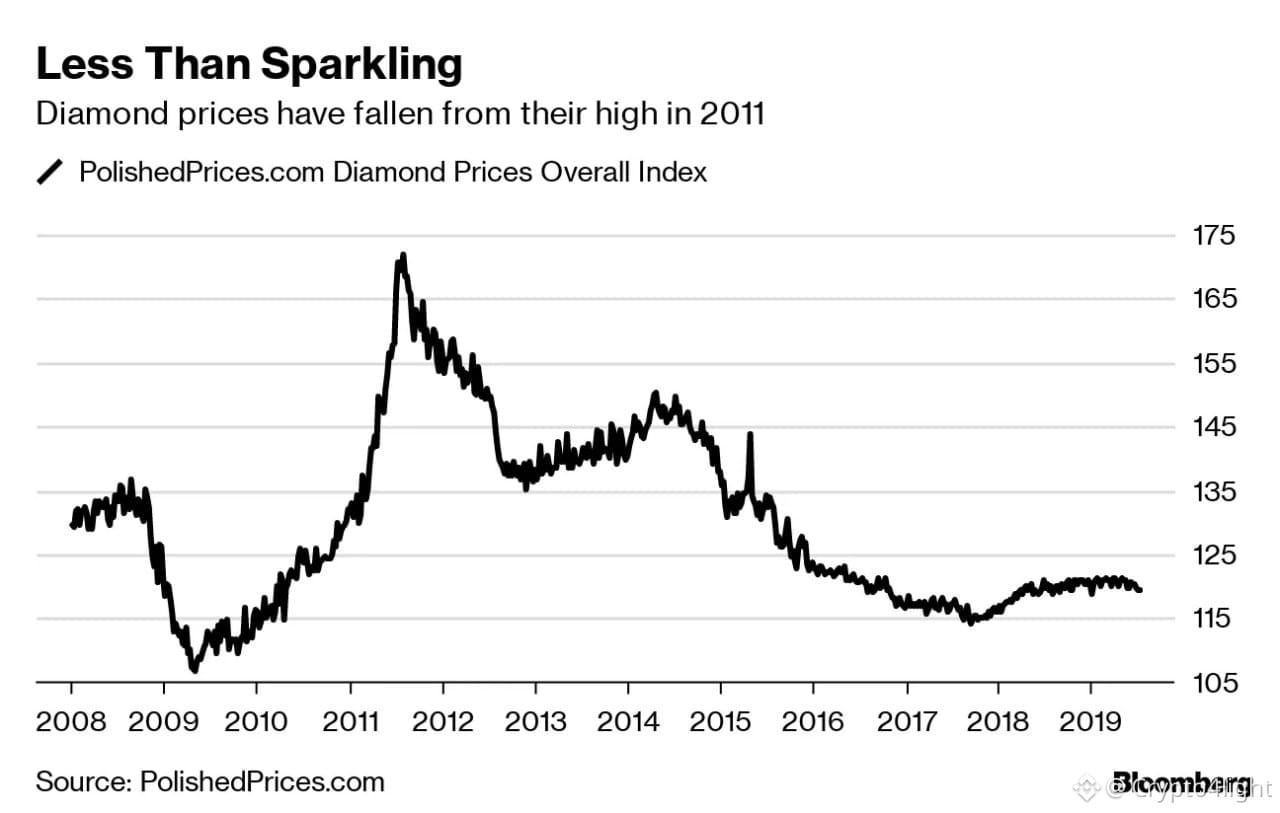
Diamond prices have fallen to the lowest level of the 21st century, down 70% from the historical high of 2011 $BTC
Diamond prices have fallen to the lowest level of the 21st century, down 70% from the historical high of 2011 $BTC
644
·
--
ICP Price Prediction: Where Is the Pain Zone for $ICP Holders?
ICP Price Prediction: Where Is the Pain Zone for $ICP Holders?
1
2k
·
--
{future}(BTCUSDT)
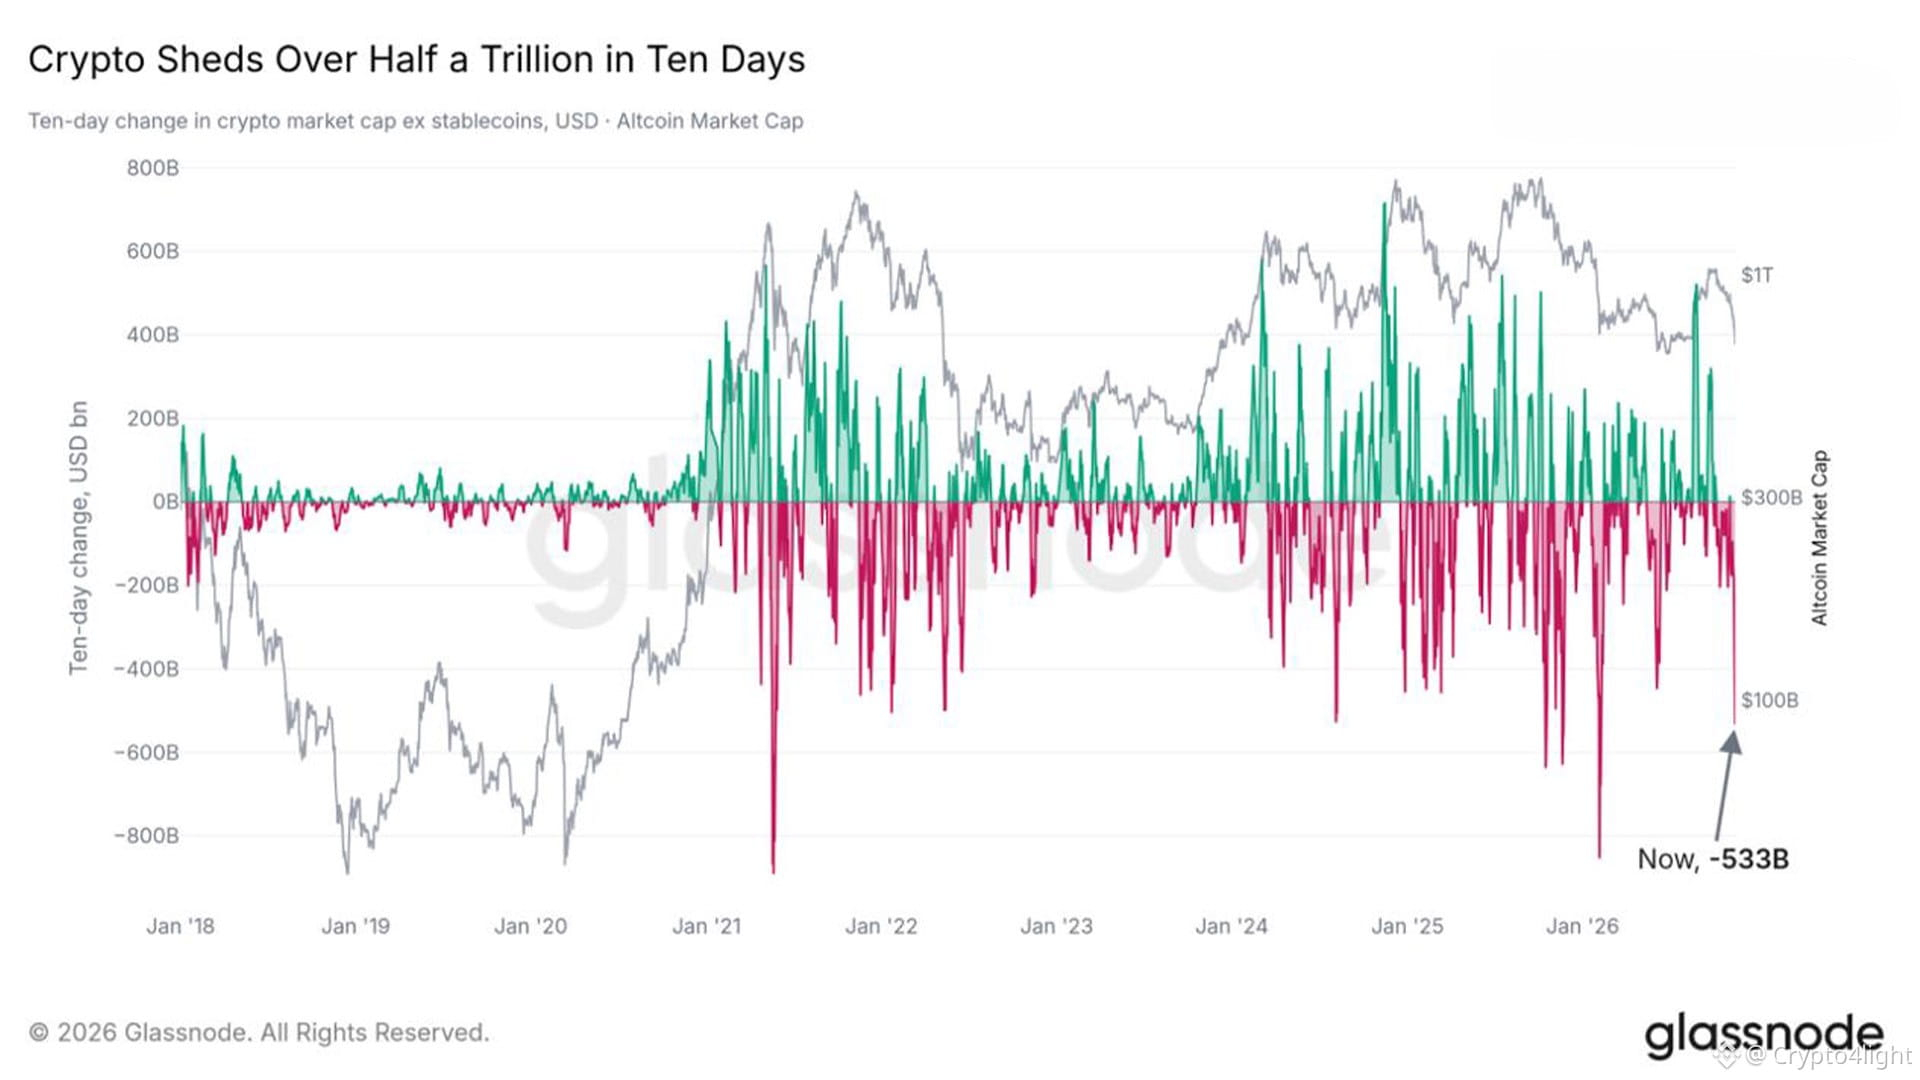
To understand just how surreal this situation is: the crypto market has lost more than $500 billion in market capitalization in just 10 days!
Only four 10-day sell-offs in crypto history have been more severe:
May 2021
October and November 2025
February 2026
But here's the thing: all four previous sell-offs had a logical explanation. They occurred either near major market peaks or, in February, following a significant recovery after the Trump Dump.
This time, however, the picture looks very different.
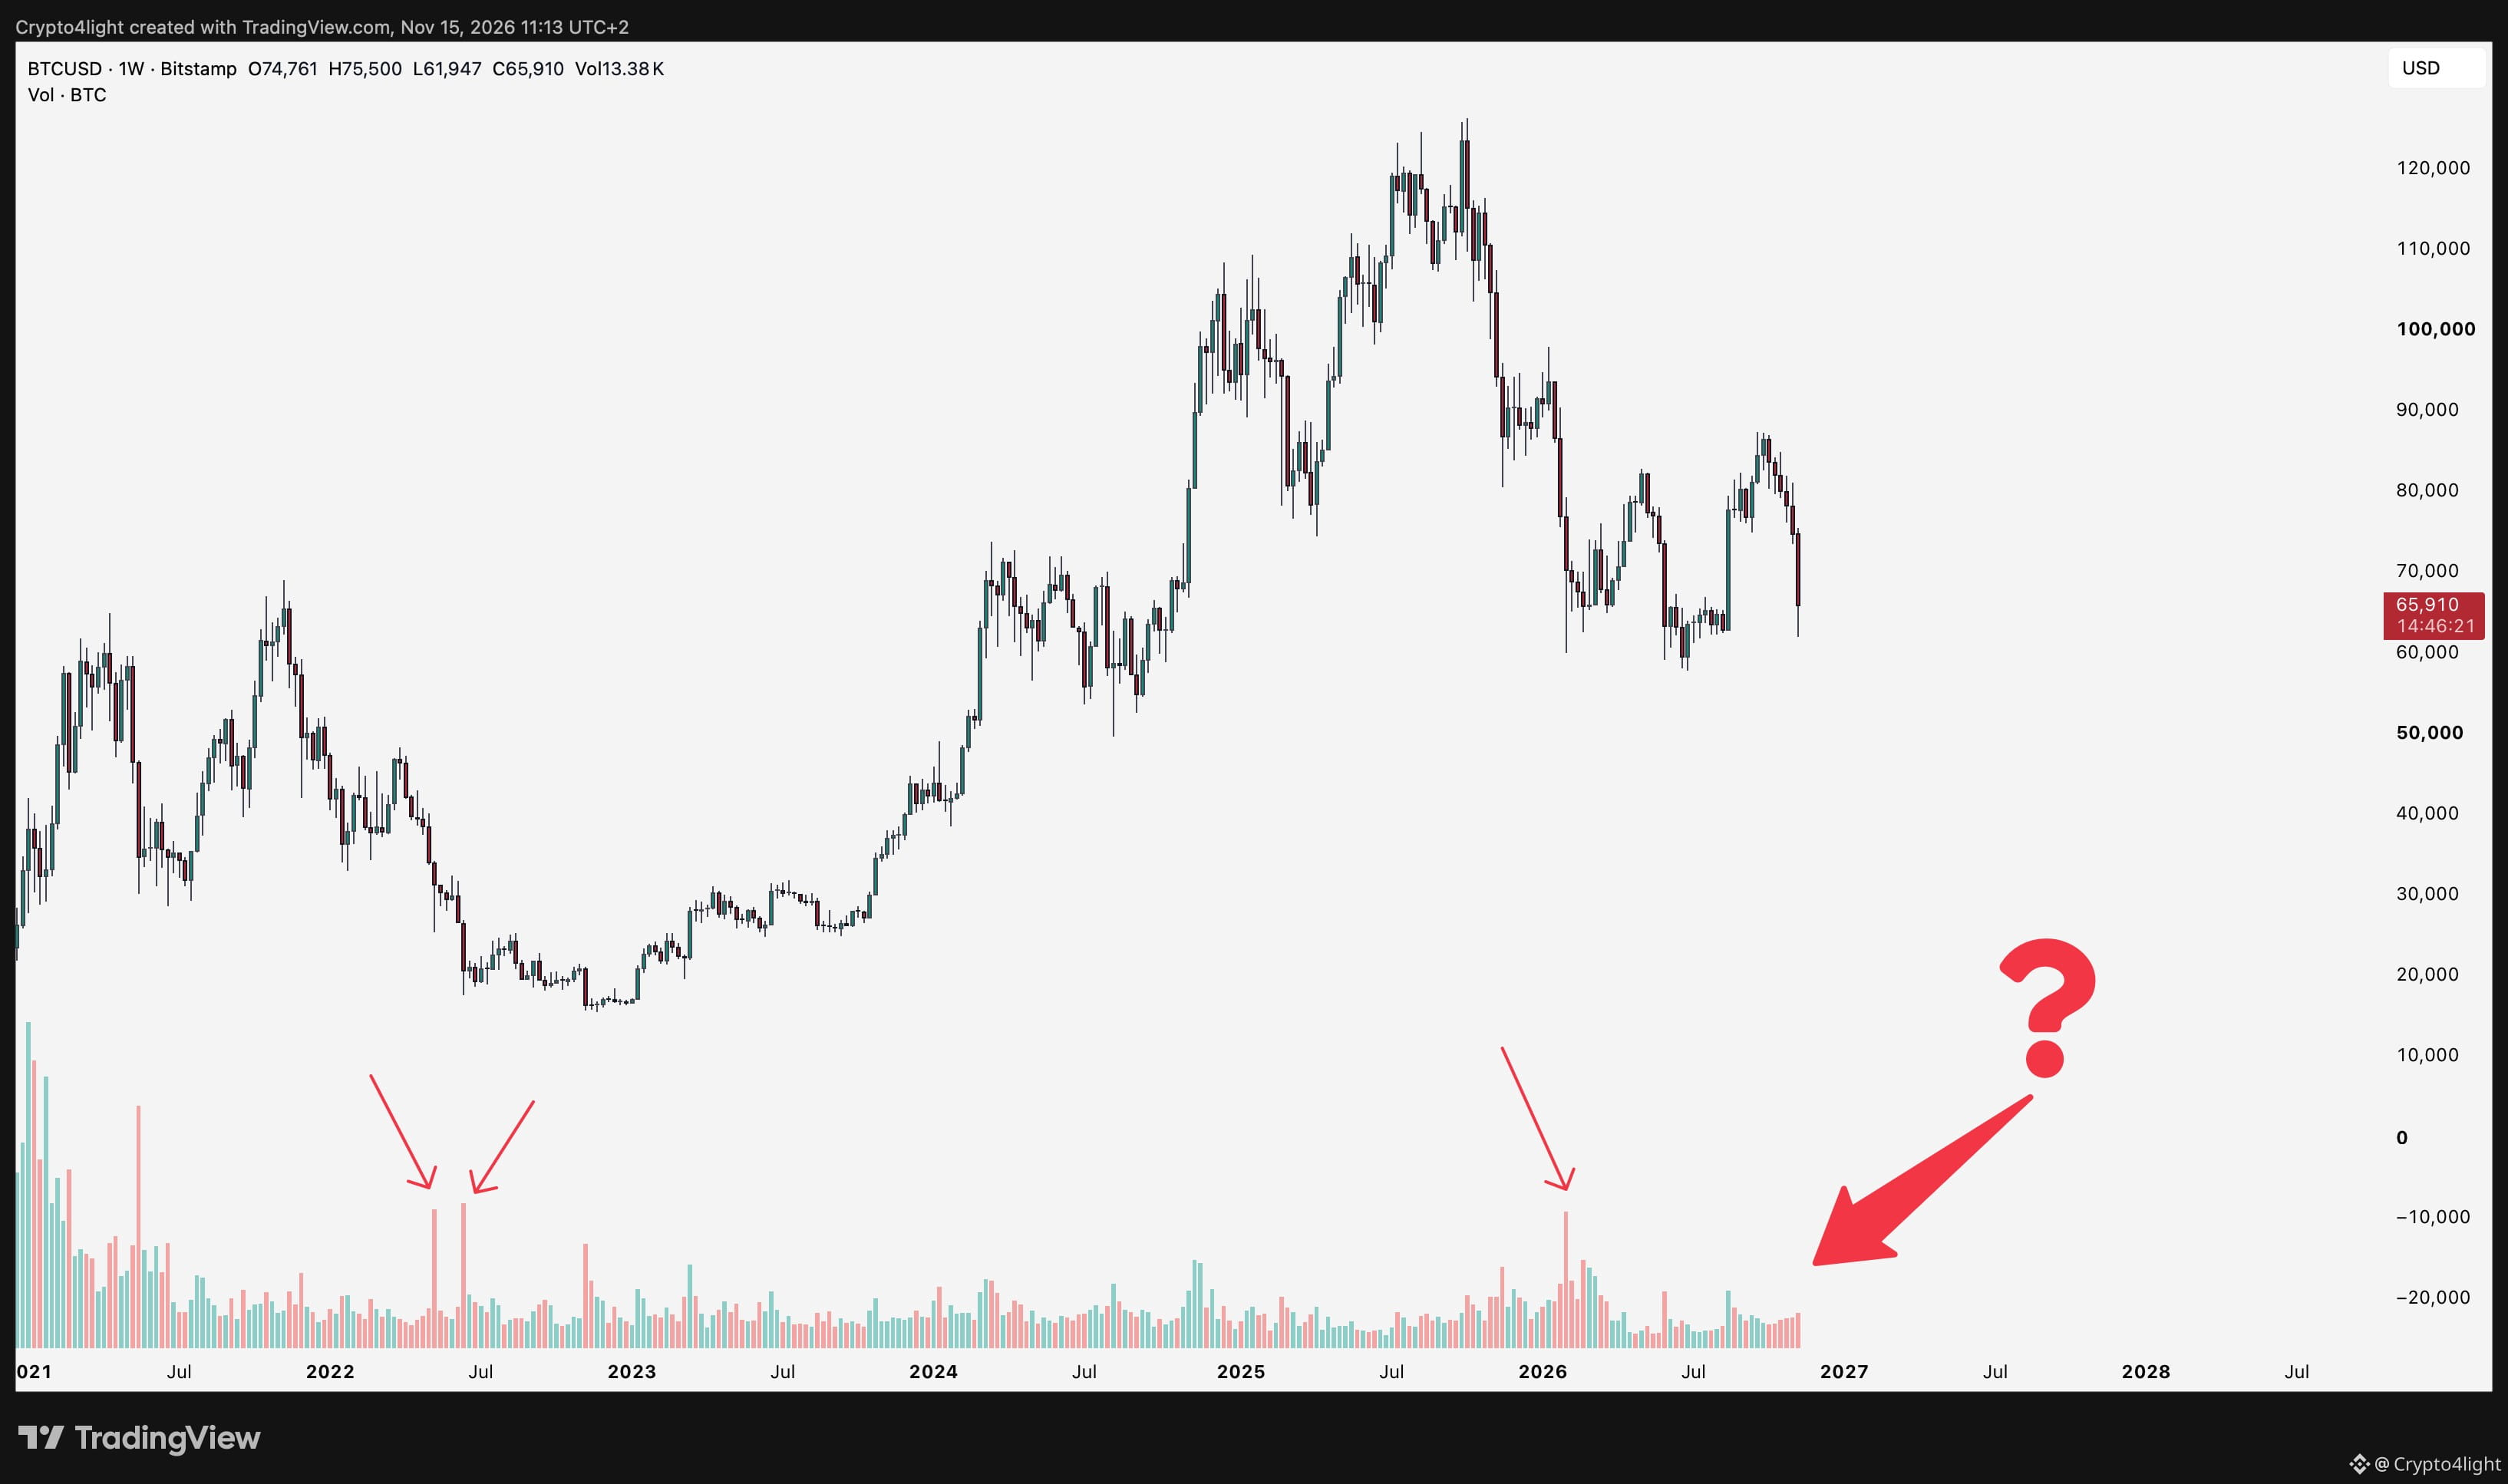
Just look at spot trading volumes. I wouldn't say we're seeing massive spot selling that would normally justify such a dramatic decline.
Yet the market keeps bleeding lower, creating exactly the right sentiment at exactly the right time for someone who clearly knows much more than the rest of us.
Something doesn't add up. $BTC
To understand just how surreal this situation is: the crypto market has lost more than $500 billion in market capitalization in just 10 days!
Only four 10-day sell-offs in crypto history have been more severe:
May 2021
October and November 2025
February 2026
But here's the thing: all four previous sell-offs had a logical explanation. They occurred either near major market peaks or, in February, following a significant recovery after the Trump Dump.
This time, however, the picture looks very different.
Just look at spot trading volumes. I wouldn't say we're seeing massive spot selling that would normally justify such a dramatic decline.
Yet the market keeps bleeding lower, creating exactly the right sentiment at exactly the right time for someone who clearly knows much more than the rest of us.
Something doesn't add up. $BTC
Only four 10-day sell-offs in crypto history have been more severe:
May 2021
October and November 2025
February 2026
But here's the thing: all four previous sell-offs had a logical explanation. They occurred either near major market peaks or, in February, following a significant recovery after the Trump Dump.
This time, however, the picture looks very different.
Just look at spot trading volumes. I wouldn't say we're seeing massive spot selling that would normally justify such a dramatic decline.
Yet the market keeps bleeding lower, creating exactly the right sentiment at exactly the right time for someone who clearly knows much more than the rest of us.
Something doesn't add up. $BTC
3.1k
·
--
Few more))) from videos)
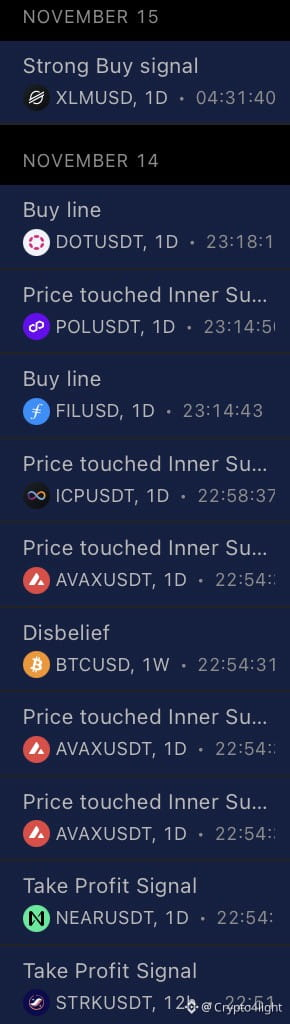
Every time, I’m reminded that the market doesn’t care about our expectations! Whether we believe it or not, price will always gravitate toward algorithmic levels. We need to learn how to be patient and use the right tools! $DOT $ICP
Few more))) from videos)
Every time, I’m reminded that the market doesn’t care about our expectations! Whether we believe it or not, price will always gravitate toward algorithmic levels. We need to learn how to be patient and use the right tools! $DOT $ICP
Every time, I’m reminded that the market doesn’t care about our expectations! Whether we believe it or not, price will always gravitate toward algorithmic levels. We need to learn how to be patient and use the right tools! $DOT $ICP
1k
·
--
Okay….$BTC
Okay….$BTC
Crypto4light
·
--
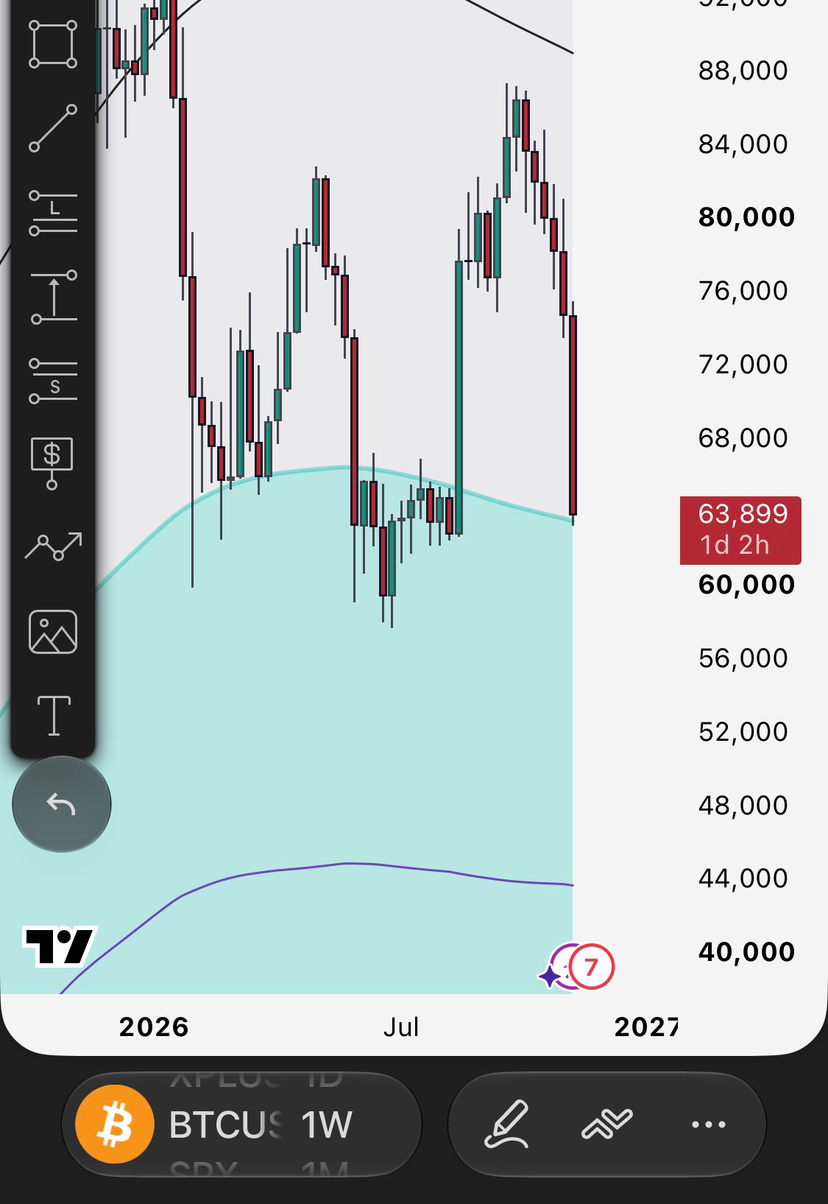
BullishThe Bitcoin scenario would be absolutely insane if we get an inverse head-and-shoulders pattern on the weekly chart 😅 Hopefully, we won’t!
As for the price action:
1. The decline before the US drama around the CLARITY Act and the rate hike was already priced in, and we’ve already seen the subsequent move higher.
2. On the weekly chart, I’ve marked the levels from the Fair Price Line.
3. A Wyckoff accumulation is theoretically still possible, but I’m becoming more and more convinced that we may have already put in the bottom this summer without a spring and a liquidity sweep of the lows. I made a video about the potential bottom.
4. Bitcoin dominance is also looking encouraging. It has started moving lower, giving altcoins a little room to breathe! $BTC
As for the price action:
1. The decline before the US drama around the CLARITY Act and the rate hike was already priced in, and we’ve already seen the subsequent move higher.
2. On the weekly chart, I’ve marked the levels from the Fair Price Line.
3. A Wyckoff accumulation is theoretically still possible, but I’m becoming more and more convinced that we may have already put in the bottom this summer without a spring and a liquidity sweep of the lows. I made a video about the potential bottom.
4. Bitcoin dominance is also looking encouraging. It has started moving lower, giving altcoins a little room to breathe! $BTC
372
·
--
Bullish
{future}(BTCUSDT)
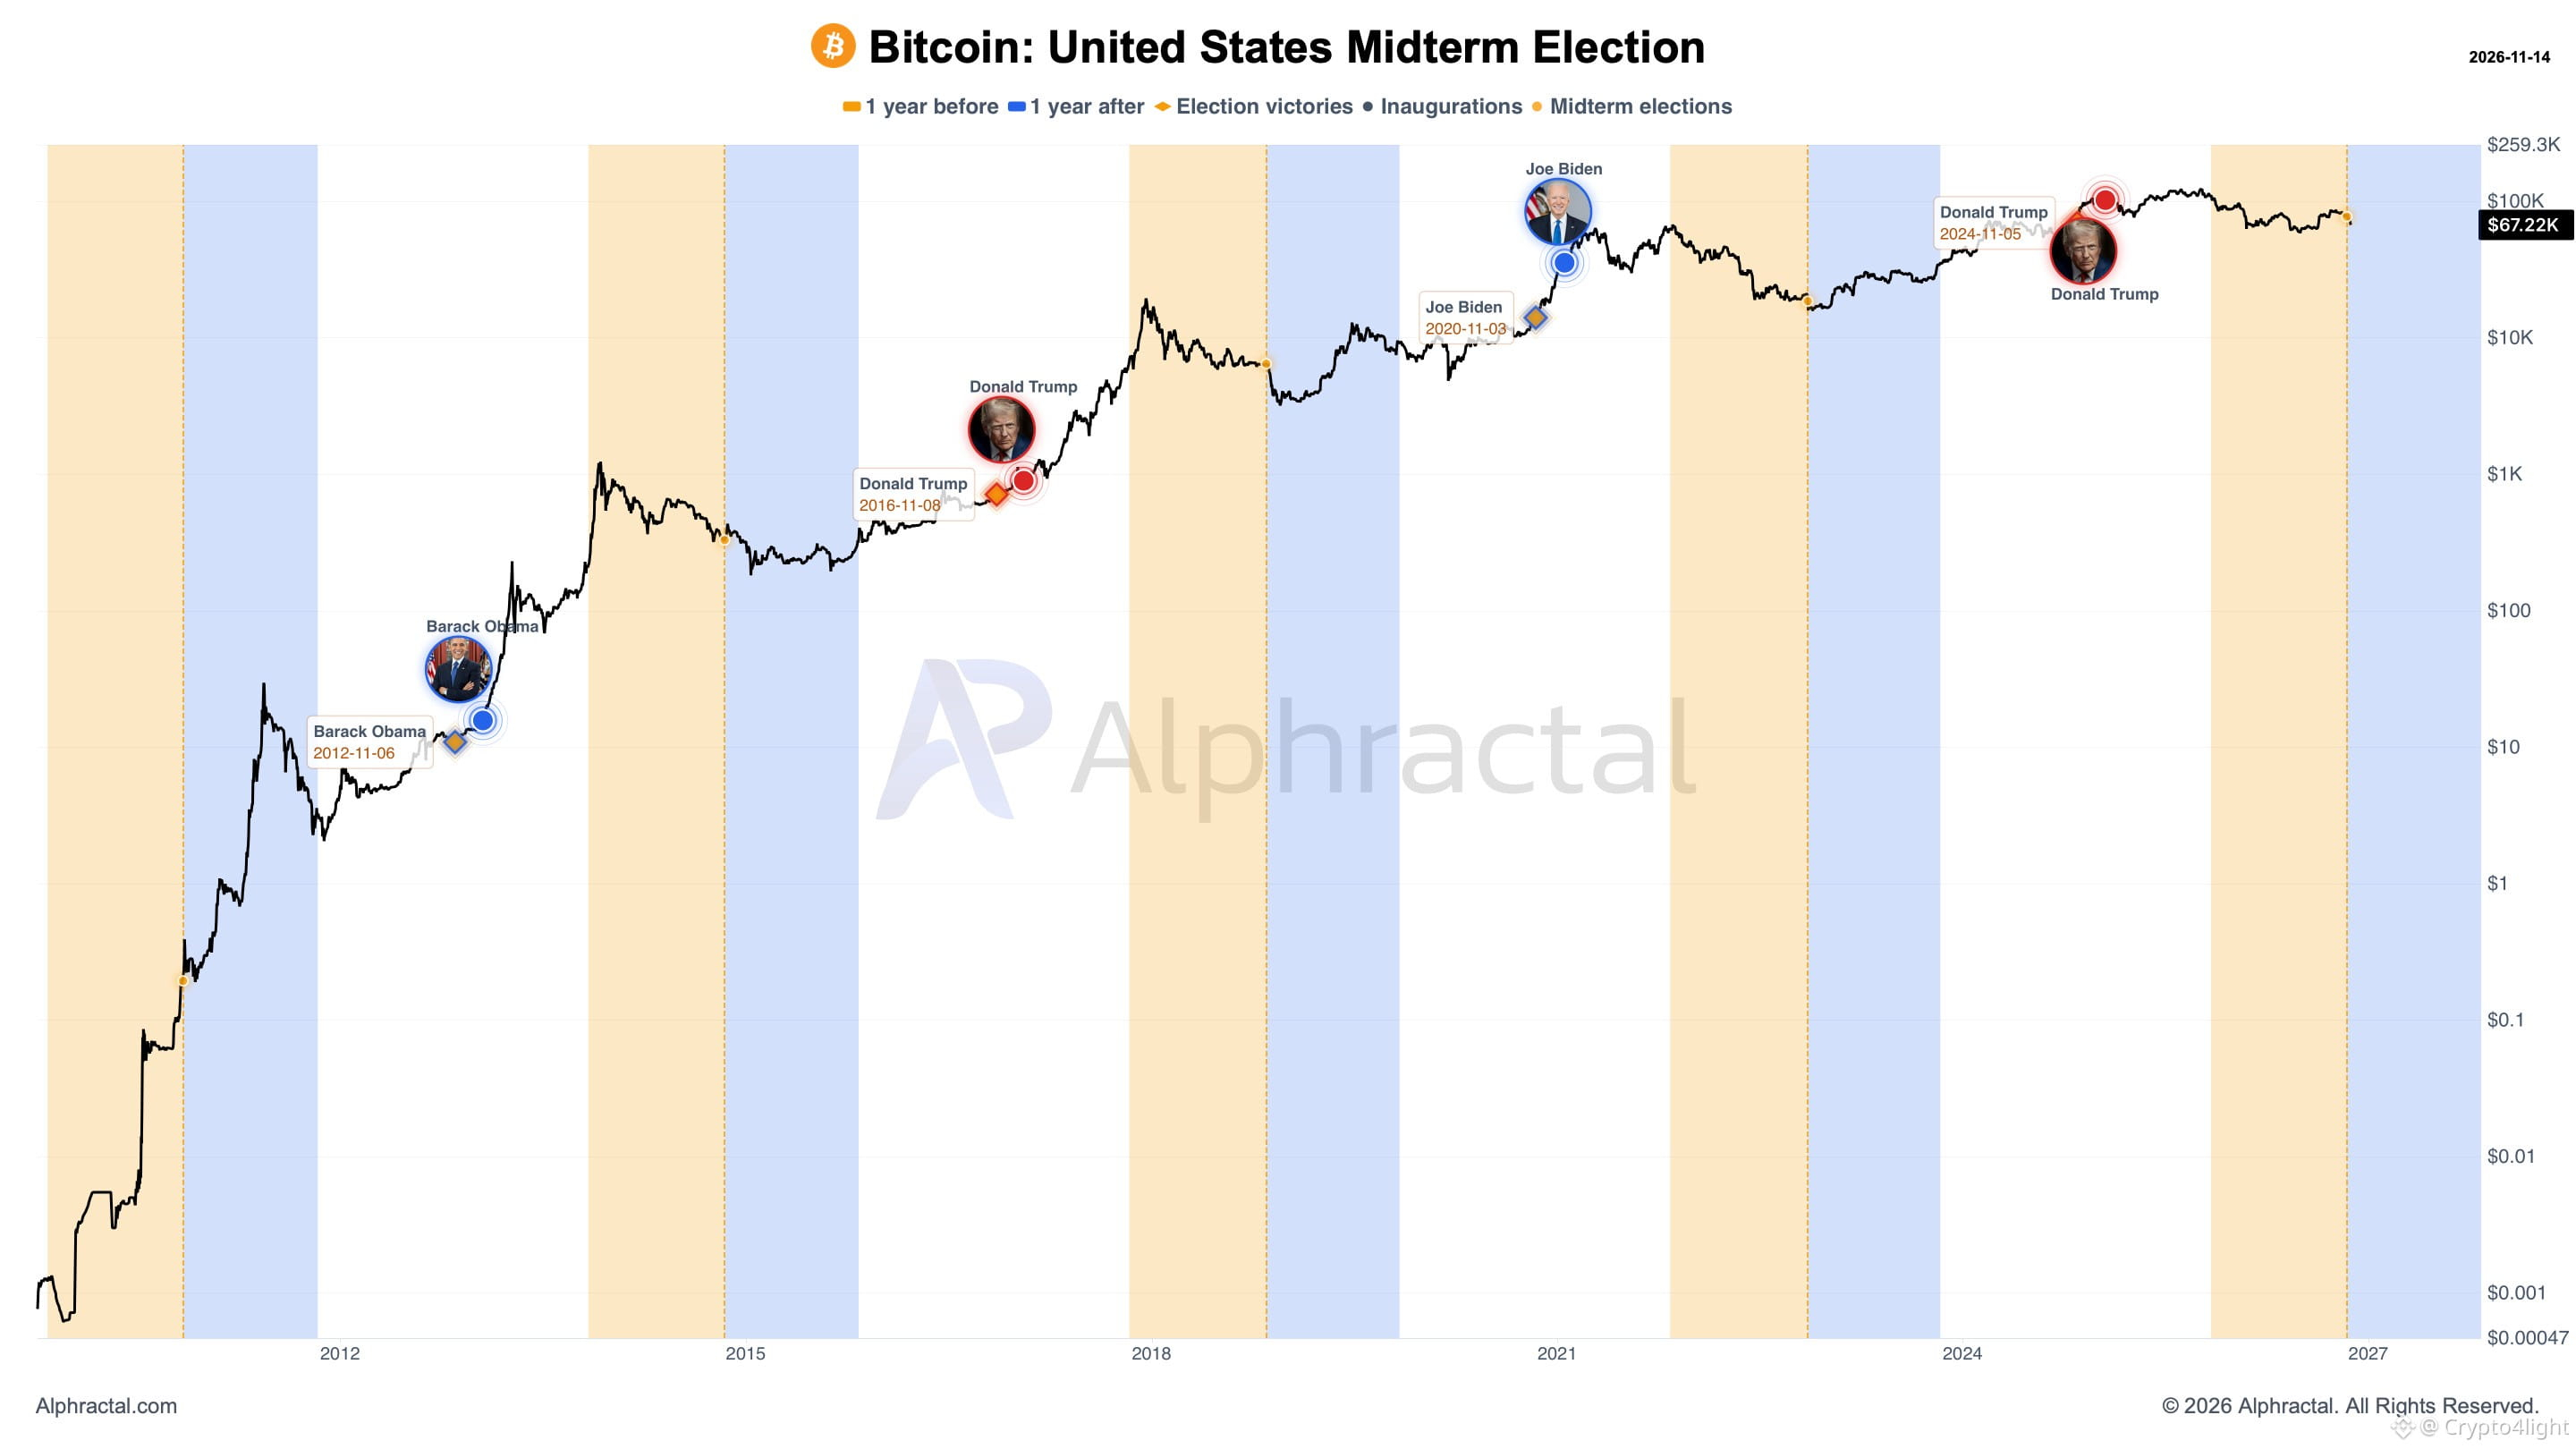
If Bitcoin is an asset created around the idea of decentralization, and people believe in some fictional Satoshi Nakamoto while denying the involvement of intelligence agencies and US developers, then how is it possible that Bitcoin's entire price action depends almost exclusively on one country and the events happening within it, or the events that this country creates around the world? $BTC
If Bitcoin is an asset created around the idea of decentralization, and people believe in some fictional Satoshi Nakamoto while denying the involvement of intelligence agencies and US developers, then how is it possible that Bitcoin's entire price action depends almost exclusively on one country and the events happening within it, or the events that this country creates around the world? $BTC
1
6
1.2k
·
--
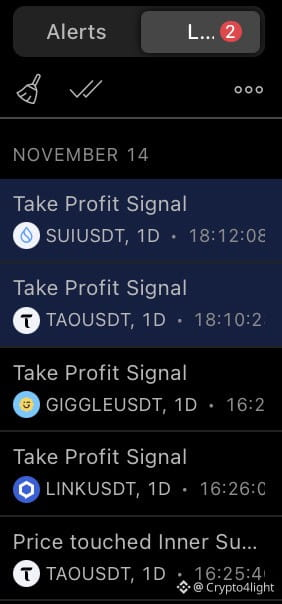
I must state that the Alerts feature is a lifesaver.
Few more $GIGGLE $TAO $SUI $LINK
all alerts added in real time in videos
I must state that the Alerts feature is a lifesaver.
Few more $GIGGLE $TAO $SUI $LINK
all alerts added in real time in videos
Few more $GIGGLE $TAO $SUI $LINK
all alerts added in real time in videos
1
2.8k
·
--
Stop Guessing With Altcoins! Follow the Algorithm | $DOT , $QNT & $FIL Analysis
Stop Guessing With Altcoins! Follow the Algorithm | $DOT , $QNT & $FIL Analysis
1
1.6k
·
--
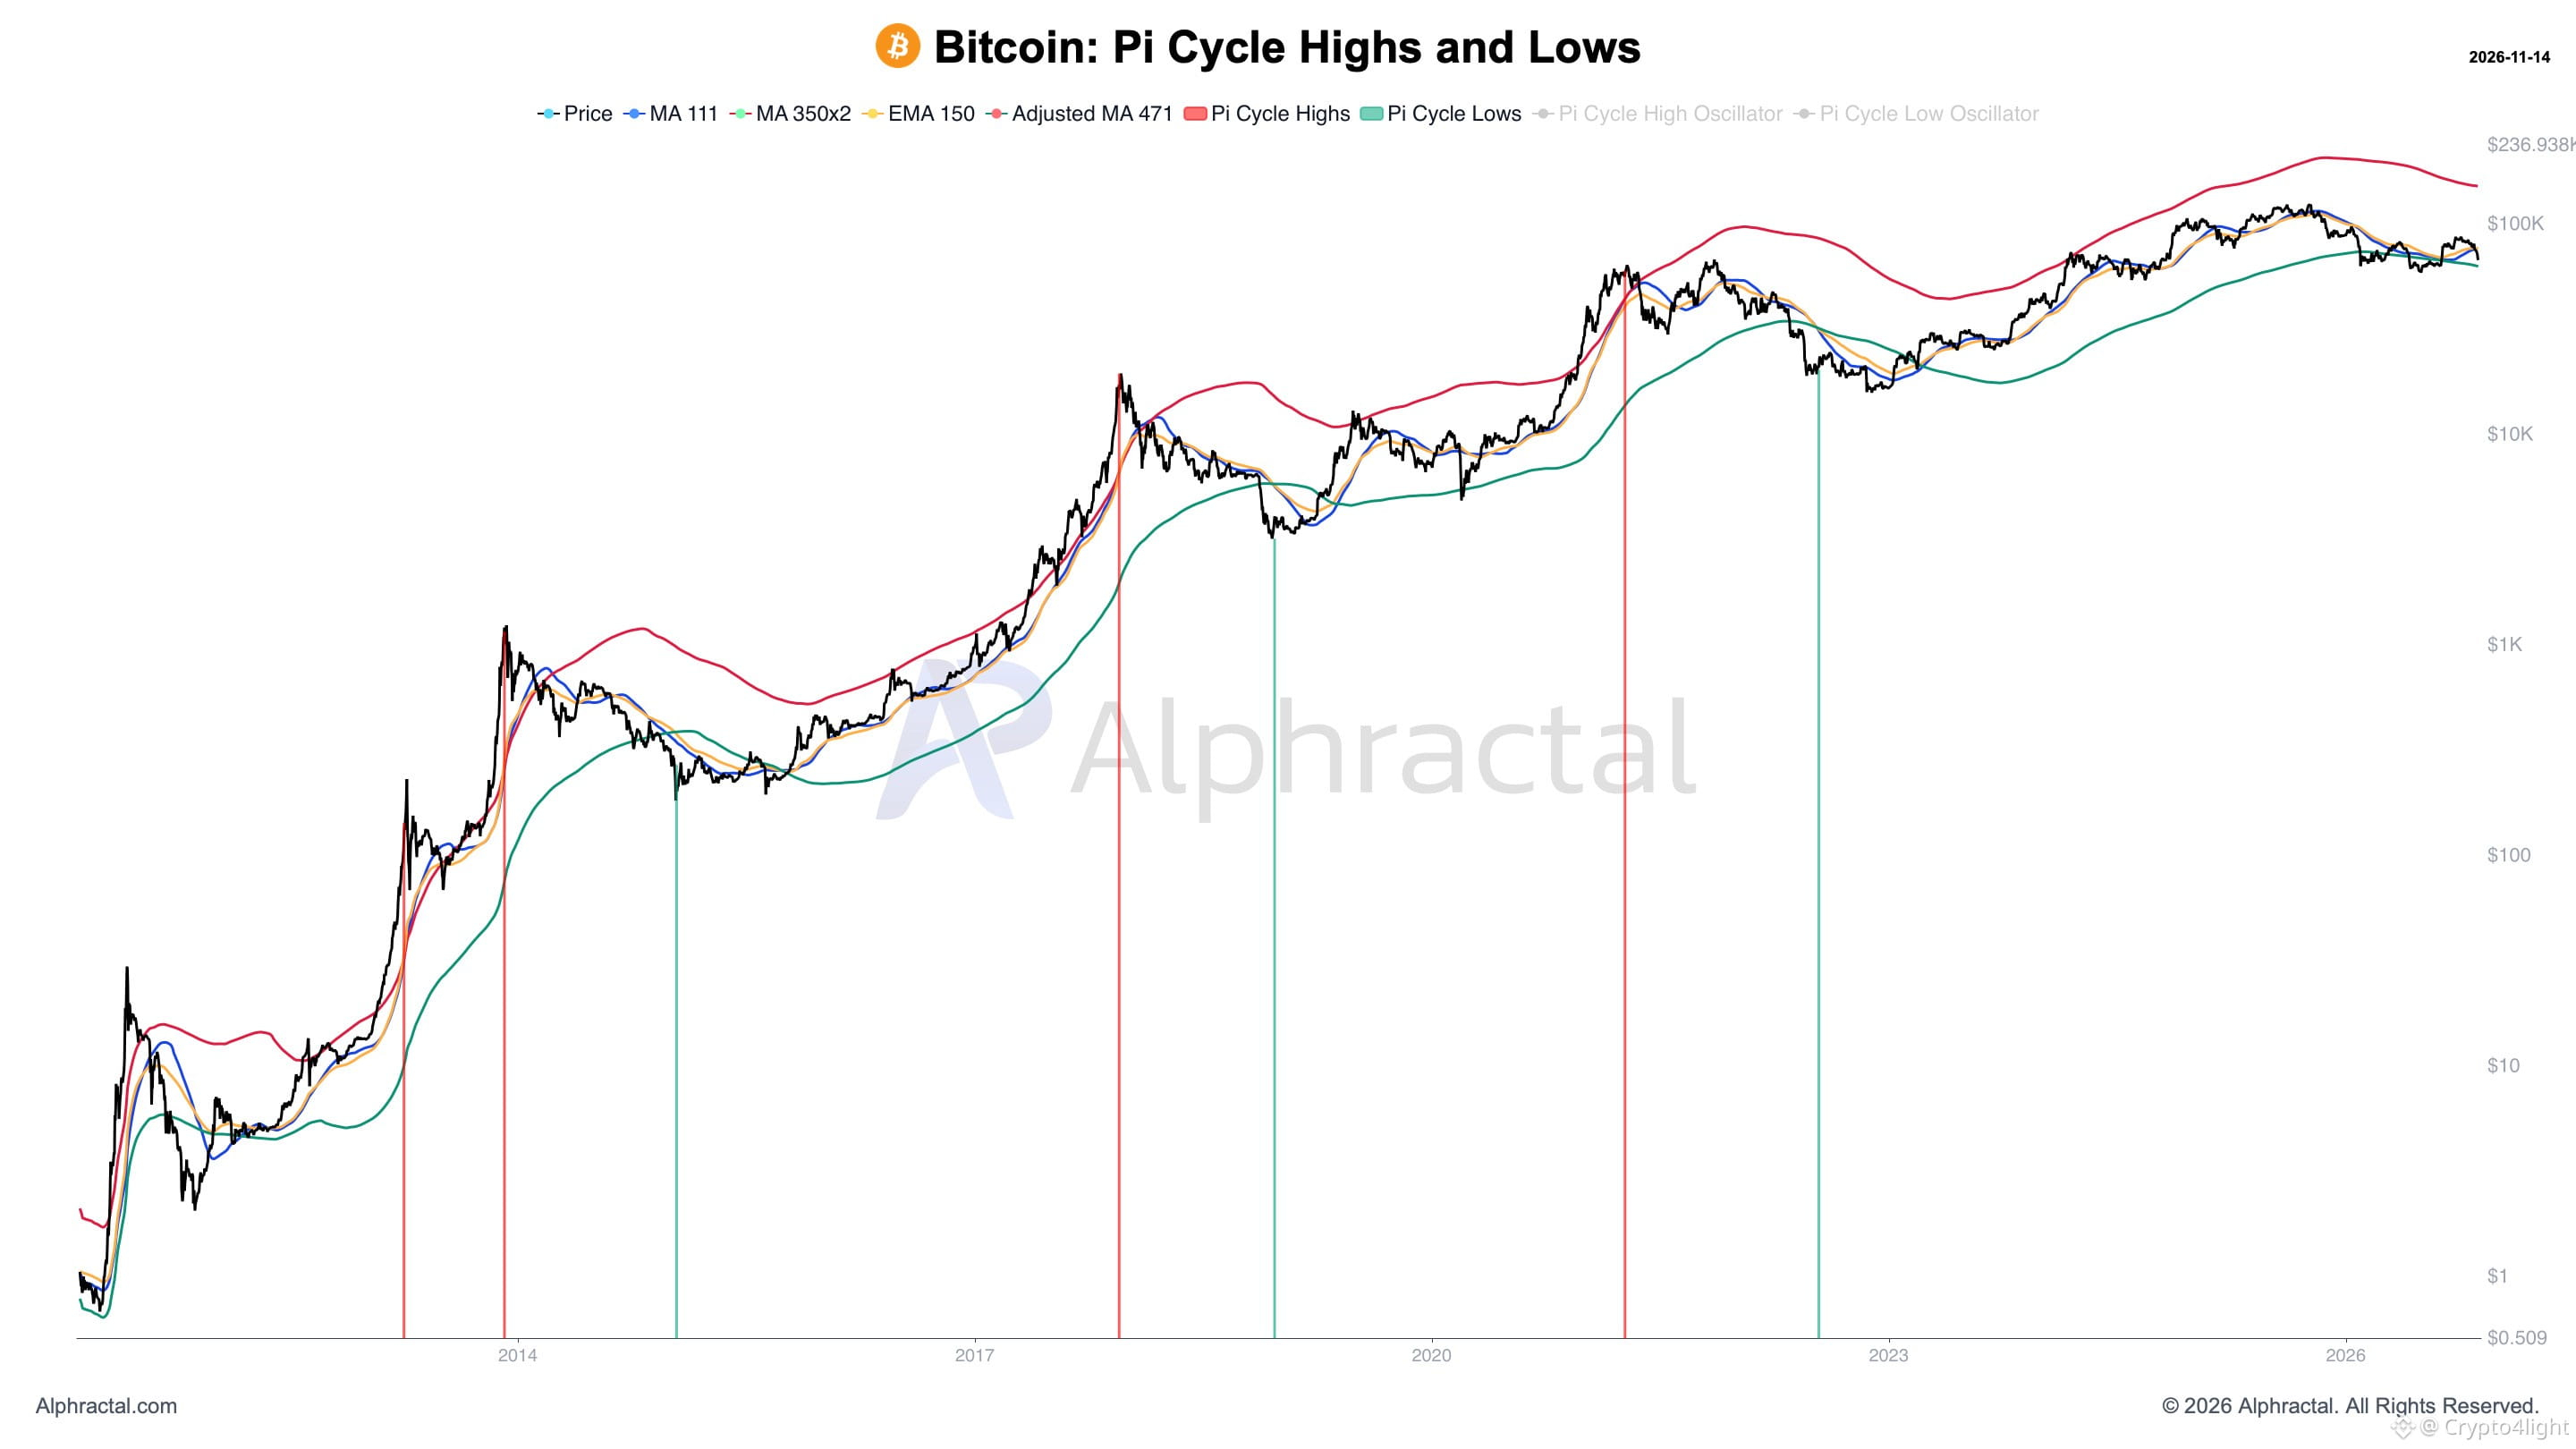
Ah, so according to all the crowd-favorite super indicators, we're reaching bottom signals, but somehow never get the top signals. Got it!
The Pi Cycle indicator. $BTC
Ah, so according to all the crowd-favorite super indicators, we're reaching bottom signals, but somehow never get the top signals. Got it!
The Pi Cycle indicator. $BTC
The Pi Cycle indicator. $BTC
347
·
--
Altcoins Can Still Make You Money! You Just Need to Know the Algorithm | $XLM , $POL & $LTC
Altcoins Can Still Make You Money! You Just Need to Know the Algorithm | $XLM , $POL & $LTC
1
803
·
--
Bullish
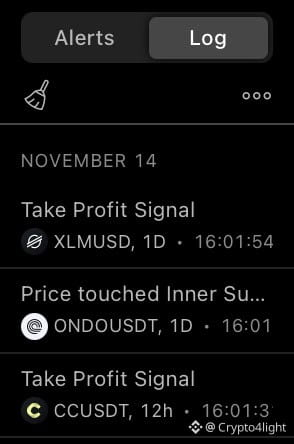
3 More from videos! And around 11 more what i added personally! $CC $XLM $ONDO
3 More from videos! And around 11 more what i added personally! $CC $XLM $ONDO
1
1.1k
·
--
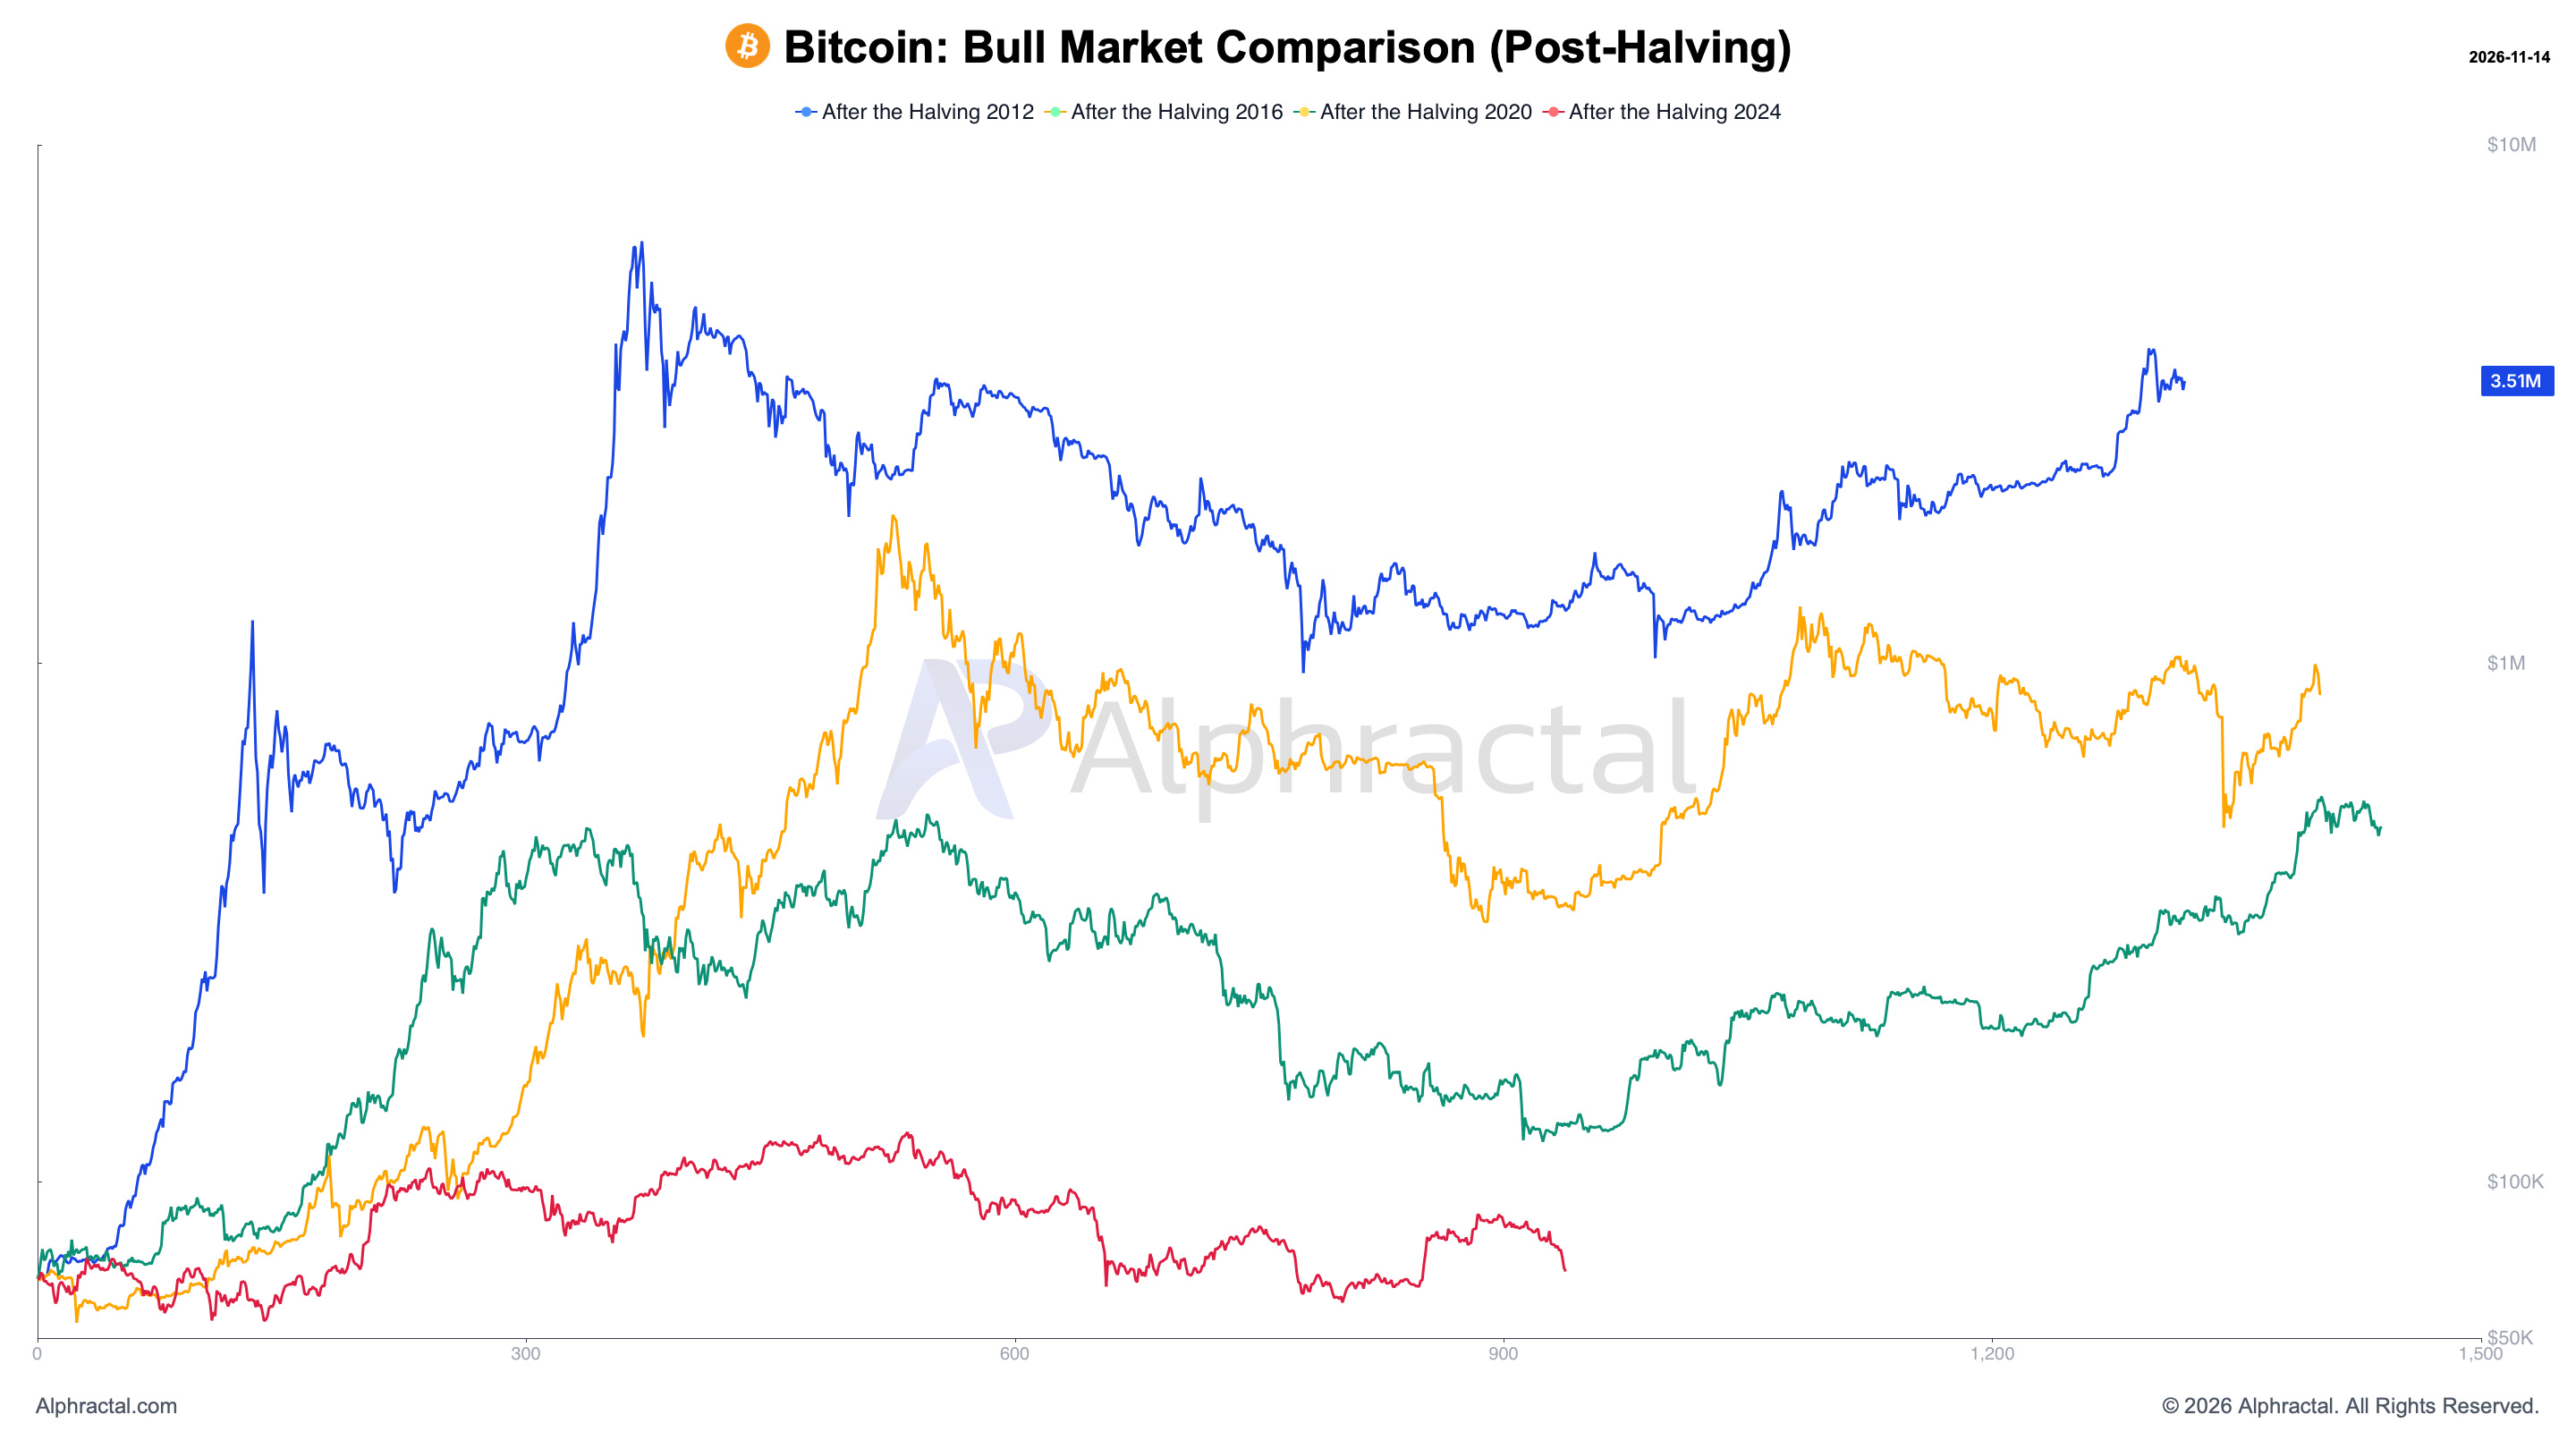
Remember all those utopian ideas about a Supercycle after the Halving? Well, just in case, that period is marked in red at the bottom!
All this nonsense about cycles and parabolic growth supposedly driven by the Halving has absolutely nothing to do with reality!
Liquidity and speculation are what really matter. $BTC
Remember all those utopian ideas about a Supercycle after the Halving? Well, just in case, that period is marked in red at the bottom!
All this nonsense about cycles and parabolic growth supposedly driven by the Halving has absolutely nothing to do with reality!
Liquidity and speculation are what really matter. $BTC
All this nonsense about cycles and parabolic growth supposedly driven by the Halving has absolutely nothing to do with reality!
Liquidity and speculation are what really matter. $BTC
1
3
1.4k
·
--
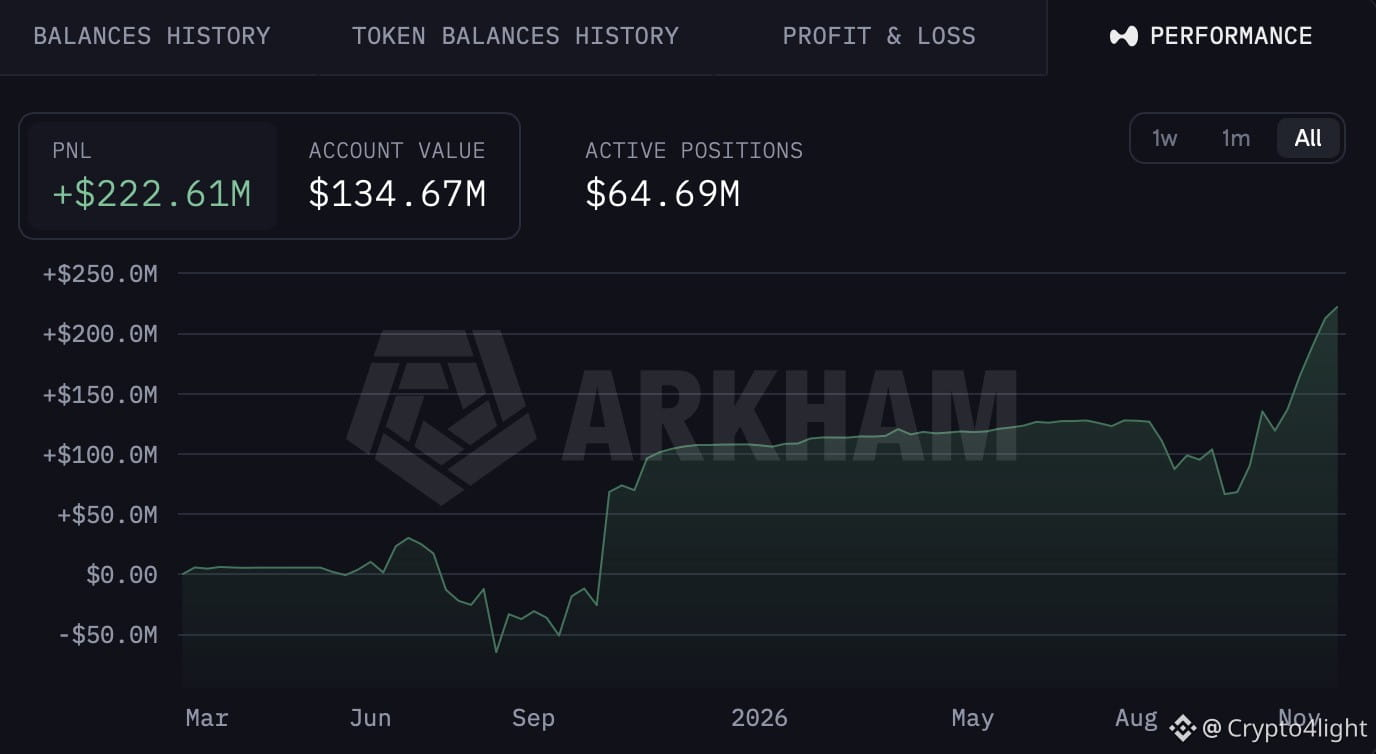
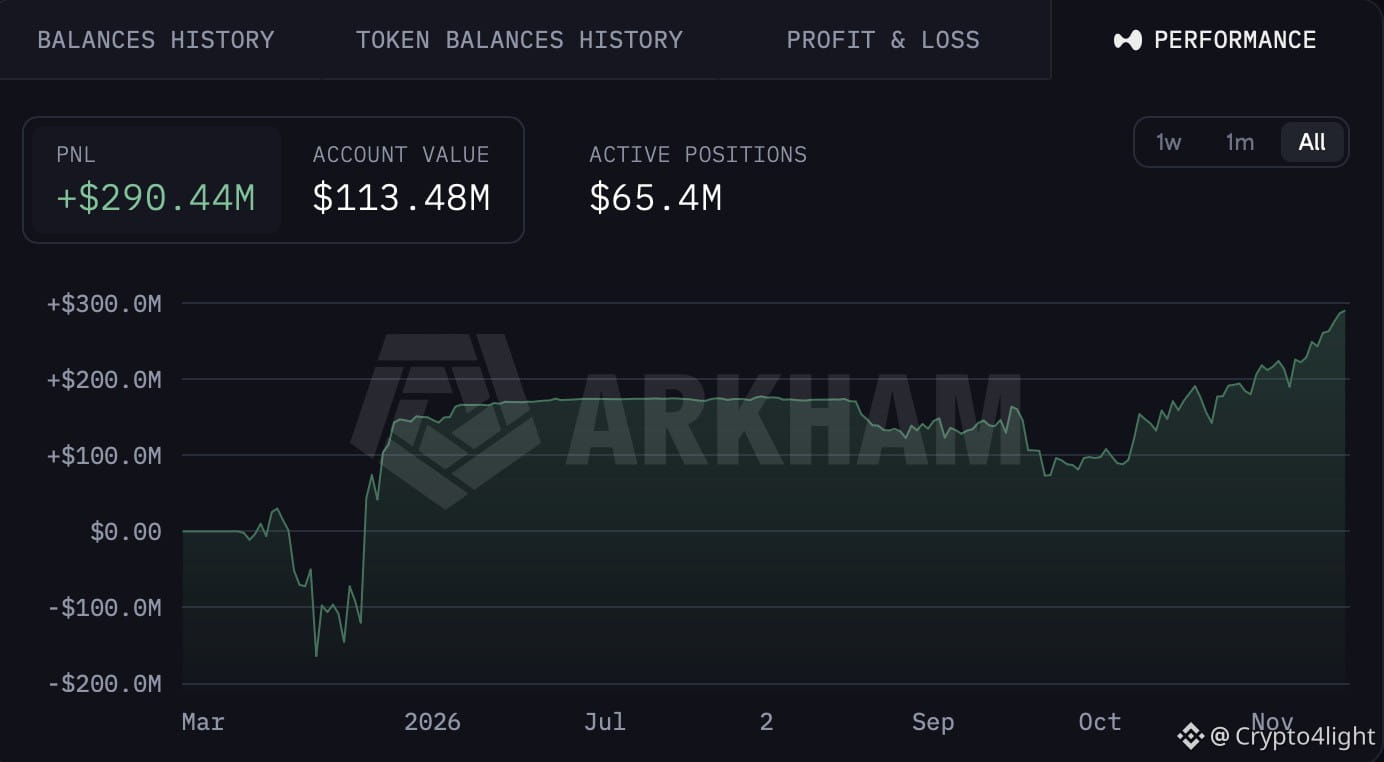
Remember Abraxas Capital? Showed positions with Onchain radar! With short positions they made over 500 Millions just in a few weeks!
2 wallets!
$BTC
Remember Abraxas Capital? Showed positions with Onchain radar! With short positions they made over 500 Millions just in a few weeks!
2 wallets!
$BTC
2 wallets!
$BTC
1
1
499
·
--
Crypto Market WARNING! Something Is Seriously Wrong With $BTC and Altcoins
Crypto Market WARNING! Something Is Seriously Wrong With $BTC and Altcoins
501
·
--
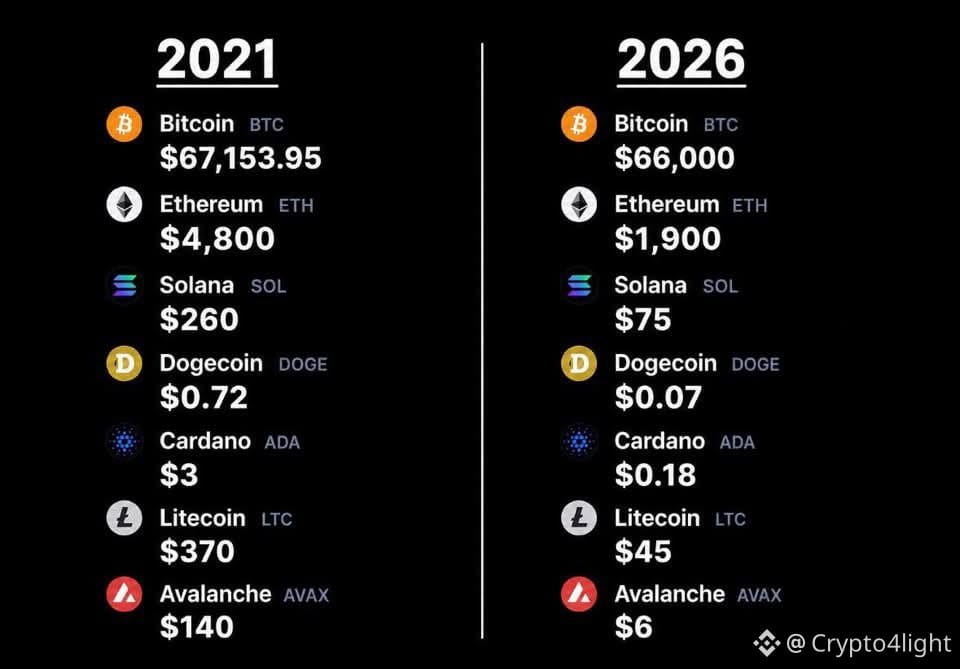
As I said before, even if Bitcoin is falling, there are essentially no questions about it! We had an ATH in 2021, then an excellent rally to $125K, followed by a decline.
The real questions are about teams that rely exclusively on marketing to keep interest in their altcoins alive!
What has the altcoin sector actually managed to deliver over the last 5 years?
Let's be honest. There have been plenty, and I mean plenty, of partnerships with banks and funds. ETFs have been launched for many altcoins. We've seen numerous technical updates and upgrades.
But from an investment perspective, these crypto startups have delivered absolutely nothing over the last 5 years!
This is exactly why we need regulation in the crypto market. $BTC
{future}(BTCUSDT)
As I said before, even if Bitcoin is falling, there are essentially no questions about it! We had an ATH in 2021, then an excellent rally to $125K, followed by a decline.
The real questions are about teams that rely exclusively on marketing to keep interest in their altcoins alive!
What has the altcoin sector actually managed to deliver over the last 5 years?
Let's be honest. There have been plenty, and I mean plenty, of partnerships with banks and funds. ETFs have been launched for many altcoins. We've seen numerous technical updates and upgrades.
But from an investment perspective, these crypto startups have delivered absolutely nothing over the last 5 years!
This is exactly why we need regulation in the crypto market. $BTC
The real questions are about teams that rely exclusively on marketing to keep interest in their altcoins alive!
What has the altcoin sector actually managed to deliver over the last 5 years?
Let's be honest. There have been plenty, and I mean plenty, of partnerships with banks and funds. ETFs have been launched for many altcoins. We've seen numerous technical updates and upgrades.
But from an investment perspective, these crypto startups have delivered absolutely nothing over the last 5 years!
This is exactly why we need regulation in the crypto market. $BTC
2
2.1k
·
--
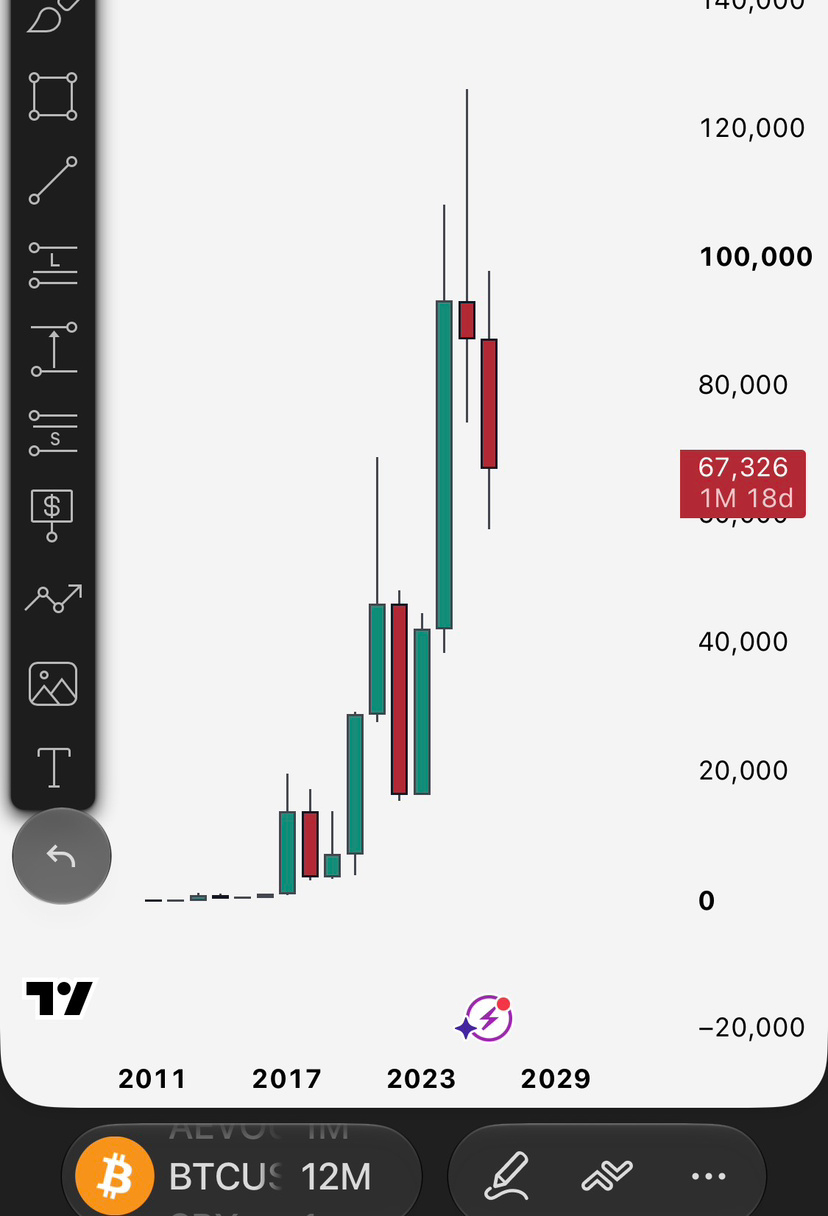
I guess the supporters of the 4-year cycle will be looking for excuses again.
The yearly chart. According to the theory, 1 year down, 3 years up. What could possibly go wrong?!
The thing is, the theory never worked. Just because something worked doesn’t mean it’s a law or a rule. It’s simply a coincidence. But the human brain is used to looking for patterns and logical explanations for everything. It’s easier that way. The brain can’t exist in chaos.
Can we close 2026 with a green candle? Theoretically, yes. But I have a feeling that everything will happen in threes. I mean, we had one pattern three times, and now Bitcoin will repeat another pattern three times. Then eventually we’ll have one year up, one year down. In other words, everything is moving upwards while both volatility and percentage returns are shrinking. $BTC
I guess the supporters of the 4-year cycle will be looking for excuses again.
The yearly chart. According to the theory, 1 year down, 3 years up. What could possibly go wrong?!
The thing is, the theory never worked. Just because something worked doesn’t mean it’s a law or a rule. It’s simply a coincidence. But the human brain is used to looking for patterns and logical explanations for everything. It’s easier that way. The brain can’t exist in chaos.
Can we close 2026 with a green candle? Theoretically, yes. But I have a feeling that everything will happen in threes. I mean, we had one pattern three times, and now Bitcoin will repeat another pattern three times. Then eventually we’ll have one year up, one year down. In other words, everything is moving upwards while both volatility and percentage returns are shrinking. $BTC
The yearly chart. According to the theory, 1 year down, 3 years up. What could possibly go wrong?!
The thing is, the theory never worked. Just because something worked doesn’t mean it’s a law or a rule. It’s simply a coincidence. But the human brain is used to looking for patterns and logical explanations for everything. It’s easier that way. The brain can’t exist in chaos.
Can we close 2026 with a green candle? Theoretically, yes. But I have a feeling that everything will happen in threes. I mean, we had one pattern three times, and now Bitcoin will repeat another pattern three times. Then eventually we’ll have one year up, one year down. In other words, everything is moving upwards while both volatility and percentage returns are shrinking. $BTC
2
1.8k
·
--
Bullish
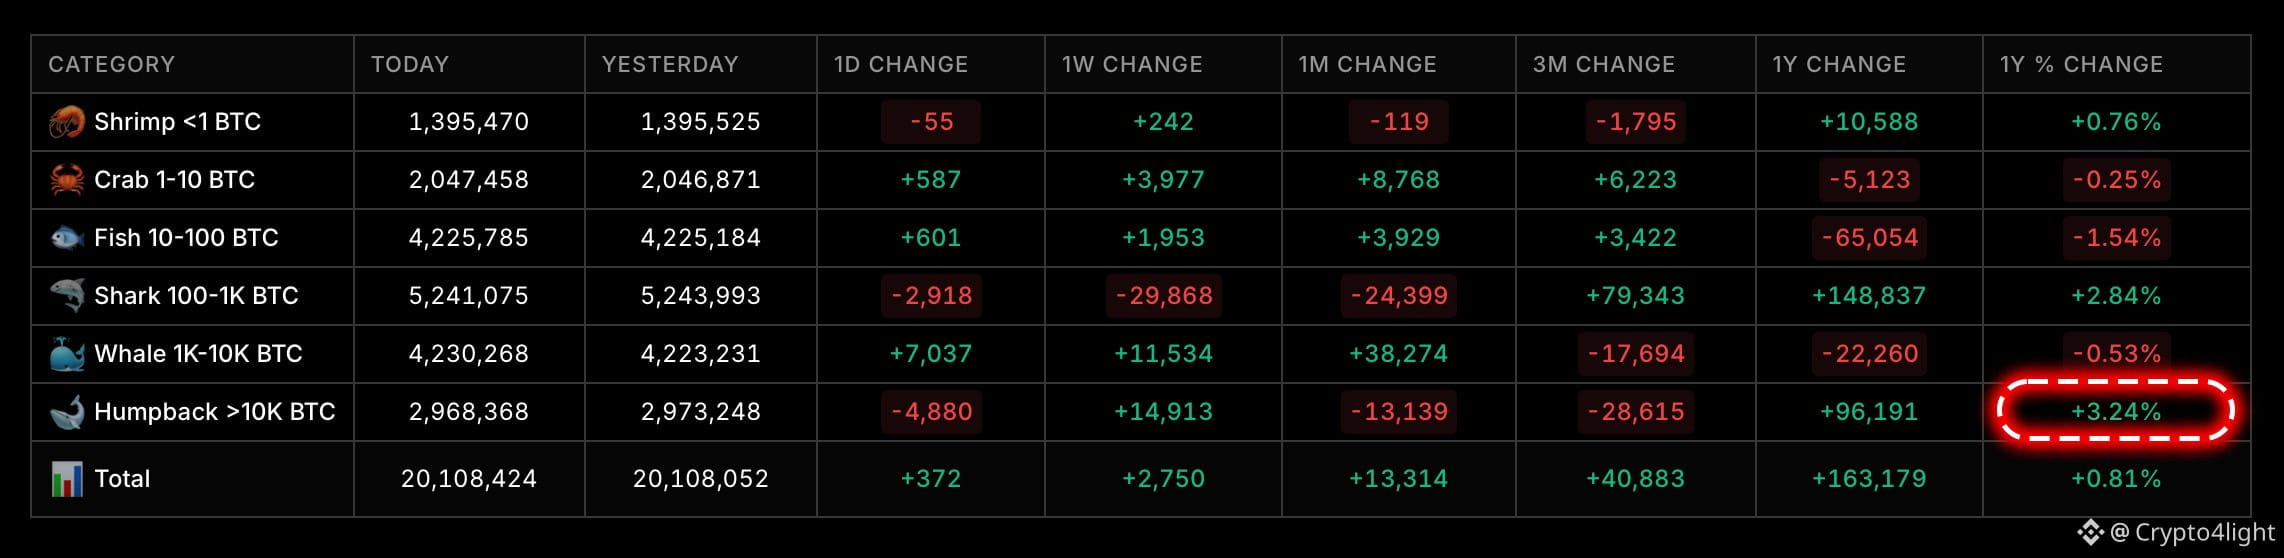
Quite an interesting picture!
While Bitcoin has essentially been declining throughout 2026, considering we're still not that far from the $57K level, whales holding more than 10K BTC have increased their Bitcoin balances by +3.24% over the year.
And that's not even mentioning that they have essentially made money in dollar terms while accumulating even more $BTC
Wallets holding between 100 and 1K BTC have also shown a modest, but still positive accumulation trend.
Quite an interesting picture!
While Bitcoin has essentially been declining throughout 2026, considering we're still not that far from the $57K level, whales holding more than 10K BTC have increased their Bitcoin balances by +3.24% over the year.
And that's not even mentioning that they have essentially made money in dollar terms while accumulating even more $BTC
Wallets holding between 100 and 1K BTC have also shown a modest, but still positive accumulation trend.
While Bitcoin has essentially been declining throughout 2026, considering we're still not that far from the $57K level, whales holding more than 10K BTC have increased their Bitcoin balances by +3.24% over the year.
And that's not even mentioning that they have essentially made money in dollar terms while accumulating even more $BTC
Wallets holding between 100 and 1K BTC have also shown a modest, but still positive accumulation trend.
1
290
·
--
SUI Wallet Shake-Up! Is This a Turning Point for Sui? | $SUI Price Analysis
SUI Wallet Shake-Up! Is This a Turning Point for Sui? | $SUI Price Analysis
619
Log in to explore more content
Join global crypto users on Binance Square
⚡️ Get latest and useful information about crypto.
💬 Trusted by the world’s largest crypto exchange.
👍 Discover real insights from verified creators.
Email / Phone number
Trending Topics
NvidiaEarningsTonight:AIStocks’NextMove?
24,811 views
416 Discussing
Nvidia Earnings Day: Interim CEO's First Appearance — Can the AI Story Hold?
Binance News
·16 Likes
·7.3k views
A Packed Week of Earnings and Data Tests Markets
107,170 views
552 Discussing
AnthropicIPOTestsInvestorAppetiteForAI
223,673 views
2,219 Discussing