

JIMMY EVANS
143 Beiträge

JIMMY EVANS
Melden
Nutzer blockieren
Almost 9 years navigating market cycles. Focused on microstructure, order flow, and deep execution. Pure market mechanics. 😉

BFUSD Halter
Hochfrequenz-Trader
8.8 Jahre
28 Following
71 Follower
181 Like gegeben
Beiträge
Alle
Zitierungen
Videos
PINNED
·
--

Artikel
Die Macht des Volumens: Wie man große Wale und massive Liquidationen mit einem einfachen Indikator erkenntViele Trader verlieren sich in einem Meer von komplexen Indikatoren, aber wir glauben an den "Heiligen Gral" des Handels: Preis & Volumen. Genauer gesagt, die Interaktion zwischen Volumen und seinem gleitenden Durchschnitt (MA).
1. Was sagt uns das Volumen-MA?
Volumen repräsentiert die Energie hinter einer Bewegung. Durch die Verwendung eines gleitenden Durchschnitts auf unserem Volumenindikator filtern wir das "Rauschen" heraus und konzentrieren uns auf anhaltenden Schwung.
Wenn Sie einen Anstieg sehen, der über dem Durchschnitt thront – wie wir es derzeit bei $ROSE sehen – ist das ein klares Signal für massive Akzeptanz (auch bekannt als Akkumulation).
Die Macht des Volumens: Wie man große Wale und massive Liquidationen mit einem einfachen Indikator erkennt
Viele Trader verlieren sich in einem Meer von komplexen Indikatoren, aber wir glauben an den "Heiligen Gral" des Handels: Preis & Volumen. Genauer gesagt, die Interaktion zwischen Volumen und seinem gleitenden Durchschnitt (MA).
1. Was sagt uns das Volumen-MA?
Volumen repräsentiert die Energie hinter einer Bewegung. Durch die Verwendung eines gleitenden Durchschnitts auf unserem Volumenindikator filtern wir das "Rauschen" heraus und konzentrieren uns auf anhaltenden Schwung.
Wenn Sie einen Anstieg sehen, der über dem Durchschnitt thront – wie wir es derzeit bei $ROSE sehen – ist das ein klares Signal für massive Akzeptanz (auch bekannt als Akkumulation).
2
231
·
--
Übersetzung ansehen
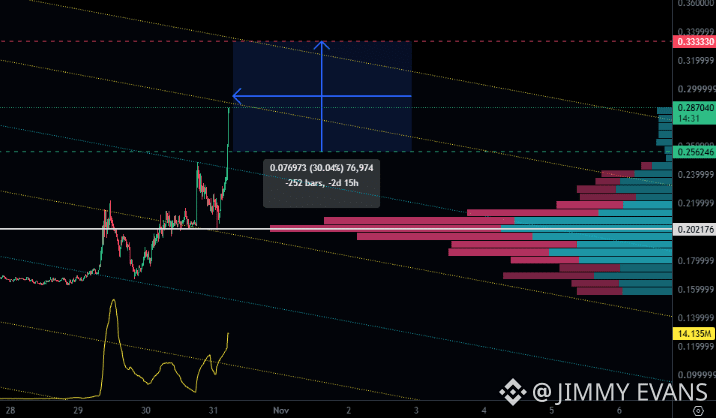
$LSK
Target mapped out: +30.04% potential profit! 🎯
When channel geometry and volume profile align like this, you just let the structure work. No need to over-leverage.
💬 Let's make a deal: If this target hits cleanly, drop a Like and hit Follow so you don't miss my next setup.
NO LEVERAGE.
Track the progress in the comments!
#LSK #JIMMYEVANS #ZOOM360
{future}(LSKUSDT)
$LSK
Target mapped out: +30.04% potential profit! 🎯
When channel geometry and volume profile align like this, you just let the structure work. No need to over-leverage.
💬 Let's make a deal: If this target hits cleanly, drop a Like and hit Follow so you don't miss my next setup.
NO LEVERAGE.
Track the progress in the comments!
#LSK #JIMMYEVANS #ZOOM360
315
·
--
Verifiziert
🛡️ Fast 9 Jahre Handel auf Binance haben mir gezeigt, dass sich Verantwortungsbewusstsein dann beweist, wenn es am wichtigsten ist.
Nach dem jüngsten Sicherheitsvorfall und der Zusage von #Binance , über den Fonds #SAFU🙏 100 % der betroffenen Gelder abzudecken, ist es verständlich, dass es am Markt viel Aufregung gibt. Wir sehen sogar bekannte Persönlichkeiten, die Memes posten und sich über die Situation lustig machen. Doch während manche eine echte Krise nutzen, um Aufmerksamkeit zu erlangen, zeigen andere durch ihr Handeln, wer wirklich Verantwortung übernimmt.
Nachdem ich mehrere Marktzyklen erlebt und diese Plattform fast 9 Jahre lang als meinen wichtigsten operativen Anlaufpunkt genutzt habe, ist meine Haltung klar: absolute Gelassenheit und volle Unterstützung.
Warum stärkt dieses Ereignis mein Vertrauen?
Sofortige Reaktion: Während andere in der Vergangenheit zusammenbrachen, übernimmt Binance Verantwortung und deckt über SAFU und die Unternehmensreserven 100 % der finanziellen Auswirkungen ab.
Umsetzungskraft: In weniger als 24 Stunden wurden gemeinsam mit Analyseunternehmen 3 Mrd. $ on-chain eingefroren und ein erheblicher Teil des Betrags mit realen Vermögenswerten gedeckt.
Souveräne Führung: Angesichts des Spotts von außen reagiert die Führung mit Besonnenheit und Respekt und konzentriert sich ganz auf den Schutz der Nutzer.
Volle Transparenz: Ein bevorstehendes Update zum Proof of Reserves und die schrittweise Wiederaufnahme von Auszahlungen. Die Sicherheit der Nutzer hat Vorrang.
Technische Herausforderungen kommen vor. Der wahre Unterschied eines Branchenführers zeigt sich jedoch in der Disziplin und den Prinzipien, mit denen Krisen bewältigt werden. Ich konzentriere mich weiterhin auf meine Arbeit und weiß, dass das Team rund um die Uhr daran arbeitet, uns zu schützen.
🤝 Eine direkte Nachricht an das Führungsteam:
Meine volle Unterstützung und Anerkennung für die Führung, die mit der Entschlossenheit, Souveränität und Transparenz handelt, die diese Plattform seit dem ersten Tag auszeichnen.
@CZ | @heyi | @richardteng
Seit wie vielen Jahren seid ihr schon auf Binance und wie geht ihr mit dieser Situation um? Schreibt es mir unten 👇
#crypto #BinanceSquare
🛡️ Fast 9 Jahre Handel auf Binance haben mir gezeigt, dass sich Verantwortungsbewusstsein dann beweist, wenn es am wichtigsten ist.
Nach dem jüngsten Sicherheitsvorfall und der Zusage von #Binance , über den Fonds #SAFU🙏 100 % der betroffenen Gelder abzudecken, ist es verständlich, dass es am Markt viel Aufregung gibt. Wir sehen sogar bekannte Persönlichkeiten, die Memes posten und sich über die Situation lustig machen. Doch während manche eine echte Krise nutzen, um Aufmerksamkeit zu erlangen, zeigen andere durch ihr Handeln, wer wirklich Verantwortung übernimmt.
Nachdem ich mehrere Marktzyklen erlebt und diese Plattform fast 9 Jahre lang als meinen wichtigsten operativen Anlaufpunkt genutzt habe, ist meine Haltung klar: absolute Gelassenheit und volle Unterstützung.
Warum stärkt dieses Ereignis mein Vertrauen?
Sofortige Reaktion: Während andere in der Vergangenheit zusammenbrachen, übernimmt Binance Verantwortung und deckt über SAFU und die Unternehmensreserven 100 % der finanziellen Auswirkungen ab.
Umsetzungskraft: In weniger als 24 Stunden wurden gemeinsam mit Analyseunternehmen 3 Mrd. $ on-chain eingefroren und ein erheblicher Teil des Betrags mit realen Vermögenswerten gedeckt.
Souveräne Führung: Angesichts des Spotts von außen reagiert die Führung mit Besonnenheit und Respekt und konzentriert sich ganz auf den Schutz der Nutzer.
Volle Transparenz: Ein bevorstehendes Update zum Proof of Reserves und die schrittweise Wiederaufnahme von Auszahlungen. Die Sicherheit der Nutzer hat Vorrang.
Technische Herausforderungen kommen vor. Der wahre Unterschied eines Branchenführers zeigt sich jedoch in der Disziplin und den Prinzipien, mit denen Krisen bewältigt werden. Ich konzentriere mich weiterhin auf meine Arbeit und weiß, dass das Team rund um die Uhr daran arbeitet, uns zu schützen.
🤝 Eine direkte Nachricht an das Führungsteam:
Meine volle Unterstützung und Anerkennung für die Führung, die mit der Entschlossenheit, Souveränität und Transparenz handelt, die diese Plattform seit dem ersten Tag auszeichnen.
@CZ | @Yi He | @Richard Teng
Seit wie vielen Jahren seid ihr schon auf Binance und wie geht ihr mit dieser Situation um? Schreibt es mir unten 👇
#crypto #BinanceSquare
94
·
--
Bullisch
Übersetzung ansehen
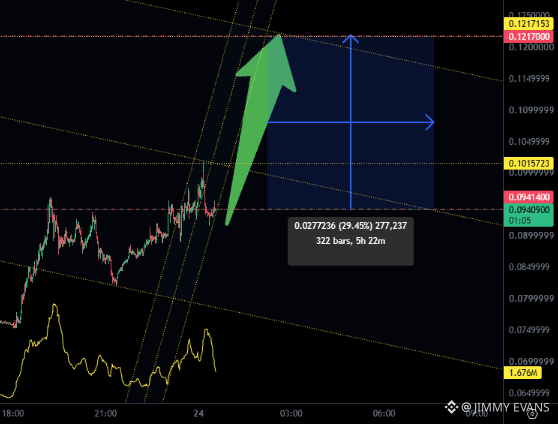
$ERA
{future}(ERAUSDT)
WILL THERE BE A GOD CANDLE NEXT ??????
$ERA
WILL THERE BE A GOD CANDLE NEXT ??????
WILL THERE BE A GOD CANDLE NEXT ??????
YES GOD CANDLE COMING
88%
NO GOD CANDLE
12%
17 Stimmen • Abstimmung beendet
1
1
634
·
--
Bullisch
Übersetzung ansehen
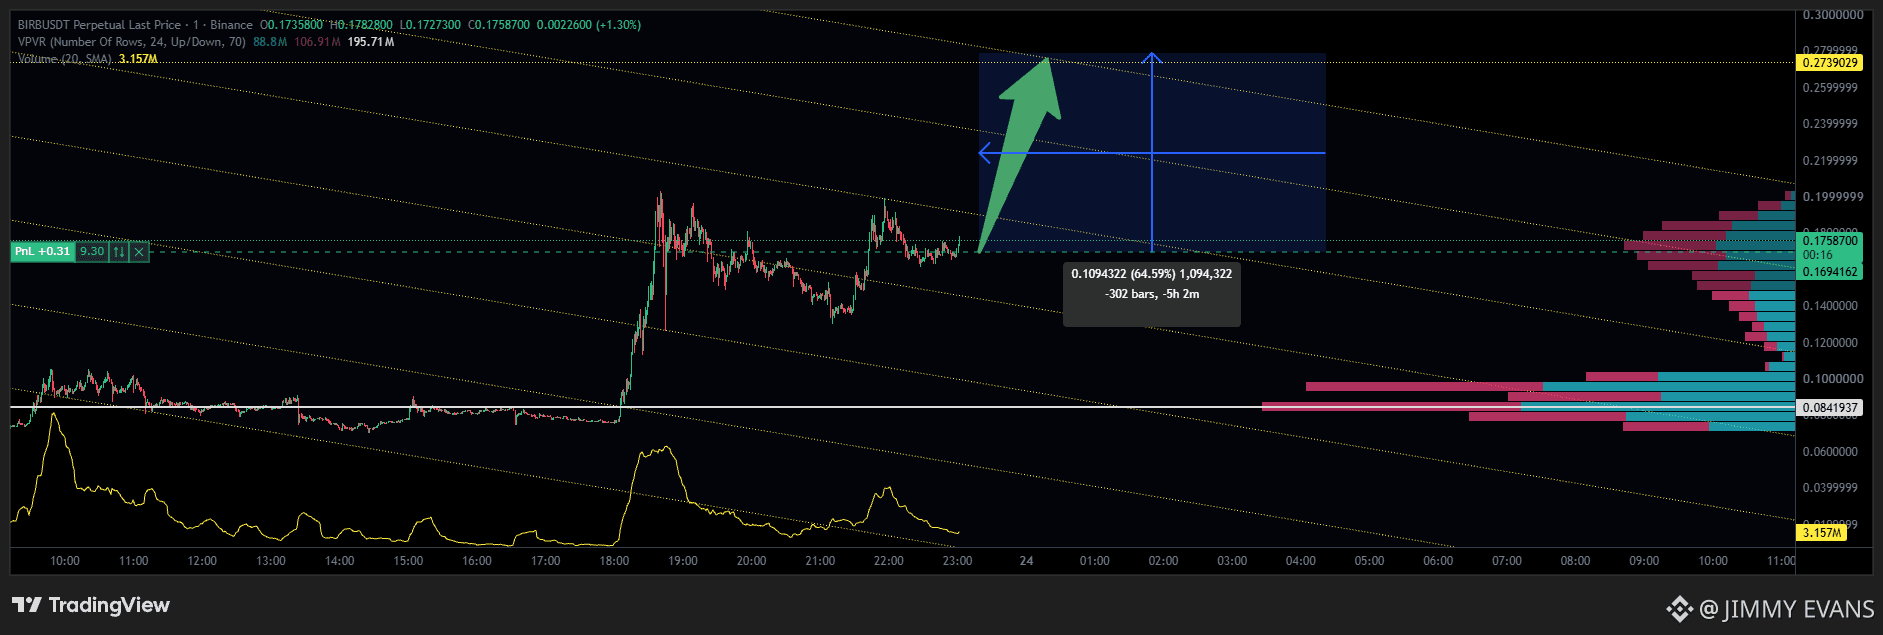
I made a 10 #BFUSD account to see if I CAN 100X or blow it out.
Looking for a quick 60% PROFIT with no leverage.
$BIRB
{future}(BIRBUSDT)
when the price gets close to 0.26 i will start closing partially
#ZOOM360 #JIMMYEVANS #BIRB
I made a 10 #BFUSD account to see if I CAN 100X or blow it out.
Looking for a quick 60% PROFIT with no leverage.
$BIRB
when the price gets close to 0.26 i will start closing partially
#ZOOM360 #JIMMYEVANS #BIRB
Looking for a quick 60% PROFIT with no leverage.
$BIRB
when the price gets close to 0.26 i will start closing partially
#ZOOM360 #JIMMYEVANS #BIRB
6
1
502
·
--
Bullisch
Übersetzung ansehen
1
585
·
--
Artikel
Übersetzung ansehen
Beyond Market Makers: How to Actually Read What’s Happening in Solana MemecoinsIf you’ve spent any time trading memecoins on Solana, you’ve probably asked yourself questions like:
“Why does this token keep recovering in almost the exact same way after every dump?”“How is there so much volume when there are barely any real holders?”“Why do a bunch of wallets buy at almost the exact same second?”“Is this a market maker… or just a bunch of bots… or the team dumping slowly?”
Most people answer these questions with vibes, Twitter threads, or what they heard in a stream.
The problem is that the real activity on Solana is much more layered than “there’s a market maker” or “it’s being manipulated.”
This article is written for the people who actually trade these tokens — not just for on-chain analysts with five monitors. We’re going to break down the patterns you can actually see, explain them in plain language, and show you how to move from raw observation to a smarter interpretation without jumping to conclusions.
1. Why Solana Memecoins Are Different
Solana is extremely fast and extremely cheap. That changes everything.
On Ethereum, high transaction fees and slower confirmation times make it expensive to spam trades or run dozens of wallets. On Solana you can:
Create a tokenAdd liquidityBuy with 20 different walletsSell small amounts over and overMove money between wallets
…all in a matter of seconds and for almost nothing in fees.
This environment creates a unique mix of:
Professional market makers hired by bigger projectsAlgorithmic bots run by developers or private groupsSniper botsCoordinated groups of wallets controlled by the same peopleRegular retail traders
The result is that charts and volume numbers often lie (or at least tell a very incomplete story).
2. The Most Important Rule: Observation vs Interpretation
This is the biggest upgrade you can make in how you look at tokens.
Bad habit (what most people do):
“These 15 wallets all bought at the same time → this is a market maker.”
Better approach:
Observation (what you can actually see on-chain)Behavior (what pattern this activity forms)Hypothesis (what could reasonably explain it)Market Intent (what this might mean for the token’s price action)
Example:
Observation
Wallet A sent 0.8 SOL to Wallet B, C, D and E.
A few minutes later, B, C, D and E all bought the same token with similar size within 4 seconds of each other.
Behavior
Coordinated wallet activity + common funding source.
Hypothesis
These wallets are likely controlled by the same entity or are following the same strategy.
Market Intent
Possible artificial flow, liquidity management, or early accumulation by a coordinated group.
Notice we never said “this is a market maker.” We stayed at the level of evidence.
This way of thinking is much more powerful (and much harder to get wrong).
3. The Main Families of Behavior You Should Watch
Here are the most important patterns, explained from beginner to advanced.
A. Wallet Coordination (The Foundation)
This is one of the strongest signals.
What you look for:
Multiple wallets funded by the same “parent” walletWallets created or activated in a very short time windowWallets that buy or sell almost the same amount at almost the same timeWallets that keep appearing together across different tokensChains of funding (A → B → C → D)
Simple analogy: Imagine 12 people who all got money from the same guy, then all walk into the same store and buy the same product within 10 seconds of each other. That’s not random.
When you see this repeatedly, you’re looking at coordinated activity.
B. Launch Coordination (What Happens in the First Blocks)
At token launch you often see:
Token creationLiquidity pool creationMultiple buysSometimes early sells
…all happening in the same slot or consecutive slots.
This is frequently done with Jito bundles (a way to group transactions so they execute together).
Important: Bundling itself is not automatically “manipulation.” Many legitimate launches use it to protect against snipers. The interesting part is the pattern of who is buying, how the wallets are related, and what happens afterward.
C. Wash Trading & Artificial Volume
Classic pattern:
Wallet A buysWallet B sellsMoney moves between themThey repeat with similar sizes and timing
The volume number on Dexscreener looks huge, but the number of independent economic participants is very low.
Key metric to watch:
Reported volume vs number of unique wallets that are not connected to each other.
$1.2 million in volume with only 40 real independent wallets tells a completely different story than the same volume with 800 unconnected wallets.
D. Algorithmic / Bot-Like Activity
Signs:
Extremely regular time intervals between tradesAlmost identical trade sizesActivity that never sleeps (24/7 with no human-like pauses)Same exact route through the same pools over and overVery low variation in behavior
You don’t need to say “this is a bot.” You can say:
“Algorithmic activity pattern is high — 87 trades, median interval 1.2 seconds, size variance extremely low.”
That’s already very useful information.
E. High-Frequency & Scalping Behavior
Some wallets buy and sell within seconds or minutes, over and over.
Look at:
Average holding timeNumber of round tripsGross volume traded vs net position change
Example:
A wallet traded $48,000 worth of the token but only ended up with +1,200 tokens.
That is high turnover with low net accumulation — classic scalping or HFT-style behavior.
F. Liquidity Management
Who is adding and removing liquidity, and when?
Interesting patterns:
Liquidity added just before a big buyLiquidity removed just before a big sellLiquidity changes that happen at the same time as certain wallet activityLiquidity concentrated in very few wallets
This can reveal who is trying to control price impact.
G. Absorption (One of the Most Important Patterns)
You see heavy selling pressure…
but the price barely drops…
and buying keeps appearing on the other side.
This often means someone is deliberately absorbing the sells (supporting the price).
Later, when the selling pressure decreases, the price starts rising.
The absorption hypothesis becomes stronger.
H. Distribution Patterns
Instead of one big dump (which destroys the chart), you often see:
Gradual / “Ant” distribution
Small sells spread over hours while retail is still buying.
Stair-step distribution
Price rises → whale sells a chunk → price keeps rising → whale sells again → repeat.
Distribution into strength
Selling while demand is still strong.
I. Accumulation
The opposite of distribution:
Price is sideways or slowly decliningSelling pressure is highCertain wallets keep buyingTheir net position is growingPrice does not fall as much as the selling would suggest
J. MEV / Sandwich Activity
On Solana you can see patterns where:
One wallet buys right before a large tradeThen sells right after
This is common MEV (Maximal Extractable Value) behavior. Not every similar sequence is a sandwich, but the pattern is detectable.
K. Arbitrage & Cross-DEX Price Control
When the same token exists on Pump.fun / PumpSwap and Raydium (or other pools), bots constantly buy the cheaper one and sell the more expensive one.
This keeps prices relatively synchronized. Watching who is doing this arbitrage tells you who is keeping the market efficient.
L. Wallet Rotation & Token Rotation
Wallet rotation:
Position moves from Wallet A → Wallet B → Wallet C while the overall exposure stays similar.
Token rotation:
The same cluster of wallets that were early in Token A now appear accumulating Token B, then Token C.
This is extremely valuable once you start tracking wallet clusters across time.
M. New Wallet Inflow
Sudden appearance of many brand new wallets can mean organic interest… or it can mean a new cluster of coordinated wallets being activated.
Always check whether the new wallets are related to each other.
N. Early / Informed-Looking Activity
Wallets that appear right at launch, buy sizeable amounts, and later sell into the first big expansion.
We don’t call them “insiders.” We call it “early informed-looking activity” and note the pattern.
4. Behavioral Transition — The Most Powerful Layer
A single pattern can be normal.
A change in patterns is often much more meaningful.
Example:
Before
Mostly retail buyingLow wallet coordinationNormal trade intervalsStable liquidity
Then something changes
Wallet synchronization increasesA small group of wallets starts accumulatingSell pressure is being absorbedLiquidity becomes more concentrated
Now
Possible coordinated accumulation phase.
This “regime change” thinking is far more useful than trying to label every token as “has a market maker” or “is organic.”
5. Putting It All Together — Market State
Instead of 20 different alarms, the goal is to arrive at a clear, evidence-based summary:
Market State
Accumulation with coordinated activity
Why
Sell pressure is being absorbed8 high-activity wallets increased their net position5 of them show synchronized execution3 share a common funding relationshipPrice stayed relatively stable despite elevated selling
Caution
Activity is concentrated in a small clusterA meaningful portion of volume may not come from independent participants
Confidence
Medium-High
If you want to go deeper, you can expand every bullet into the raw on-chain evidence.
This format is readable, honest about uncertainty, and actually useful for decision-making.
6. Important Limitations (Read This)
Correlation is not proof of control. Common funding + synchronized trading is strong evidence of coordination, but not 100% certainty.Many patterns that look “manipulative” can also appear in legitimate market-making or sophisticated trading.Order-book style spoofing (fake walls that disappear) is much less relevant on pure AMMs like Raydium or Pump.fun than on centralized exchanges.Tools can be wrong or incomplete. Always try to verify key claims yourself on Solscan, Bubblemaps, or similar explorers.
The goal is not to become a conspiracy theorist. The goal is to see the structure of the market more clearly than the average person watching a stream.
Final Thoughts
Most memecoin traders only see the surface: price, volume, and what influencers say.
Underneath there is a rich layer of wallet coordination, algorithmic behavior, liquidity management, absorption, distribution, and regime changes.
You don’t need to detect “the market maker.”
You need to observe the patterns, form careful hypotheses, and understand what those patterns imply for the next moves in the chart.
Once you start looking at Solana tokens this way, the market becomes a lot less mysterious — and a lot more readable.
Trade carefully.
Beyond Market Makers: How to Actually Read What’s Happening in Solana Memecoins
If you’ve spent any time trading memecoins on Solana, you’ve probably asked yourself questions like:
“Why does this token keep recovering in almost the exact same way after every dump?”“How is there so much volume when there are barely any real holders?”“Why do a bunch of wallets buy at almost the exact same second?”“Is this a market maker… or just a bunch of bots… or the team dumping slowly?”
Most people answer these questions with vibes, Twitter threads, or what they heard in a stream.
The problem is that the real activity on Solana is much more layered than “there’s a market maker” or “it’s being manipulated.”
This article is written for the people who actually trade these tokens — not just for on-chain analysts with five monitors. We’re going to break down the patterns you can actually see, explain them in plain language, and show you how to move from raw observation to a smarter interpretation without jumping to conclusions.
1. Why Solana Memecoins Are Different
Solana is extremely fast and extremely cheap. That changes everything.
On Ethereum, high transaction fees and slower confirmation times make it expensive to spam trades or run dozens of wallets. On Solana you can:
Create a tokenAdd liquidityBuy with 20 different walletsSell small amounts over and overMove money between wallets
…all in a matter of seconds and for almost nothing in fees.
This environment creates a unique mix of:
Professional market makers hired by bigger projectsAlgorithmic bots run by developers or private groupsSniper botsCoordinated groups of wallets controlled by the same peopleRegular retail traders
The result is that charts and volume numbers often lie (or at least tell a very incomplete story).
2. The Most Important Rule: Observation vs Interpretation
This is the biggest upgrade you can make in how you look at tokens.
Bad habit (what most people do):
“These 15 wallets all bought at the same time → this is a market maker.”
Better approach:
Observation (what you can actually see on-chain)Behavior (what pattern this activity forms)Hypothesis (what could reasonably explain it)Market Intent (what this might mean for the token’s price action)
Example:
Observation
Wallet A sent 0.8 SOL to Wallet B, C, D and E.
A few minutes later, B, C, D and E all bought the same token with similar size within 4 seconds of each other.
Behavior
Coordinated wallet activity + common funding source.
Hypothesis
These wallets are likely controlled by the same entity or are following the same strategy.
Market Intent
Possible artificial flow, liquidity management, or early accumulation by a coordinated group.
Notice we never said “this is a market maker.” We stayed at the level of evidence.
This way of thinking is much more powerful (and much harder to get wrong).
3. The Main Families of Behavior You Should Watch
Here are the most important patterns, explained from beginner to advanced.
A. Wallet Coordination (The Foundation)
This is one of the strongest signals.
What you look for:
Multiple wallets funded by the same “parent” walletWallets created or activated in a very short time windowWallets that buy or sell almost the same amount at almost the same timeWallets that keep appearing together across different tokensChains of funding (A → B → C → D)
Simple analogy: Imagine 12 people who all got money from the same guy, then all walk into the same store and buy the same product within 10 seconds of each other. That’s not random.
When you see this repeatedly, you’re looking at coordinated activity.
B. Launch Coordination (What Happens in the First Blocks)
At token launch you often see:
Token creationLiquidity pool creationMultiple buysSometimes early sells
…all happening in the same slot or consecutive slots.
This is frequently done with Jito bundles (a way to group transactions so they execute together).
Important: Bundling itself is not automatically “manipulation.” Many legitimate launches use it to protect against snipers. The interesting part is the pattern of who is buying, how the wallets are related, and what happens afterward.
C. Wash Trading & Artificial Volume
Classic pattern:
Wallet A buysWallet B sellsMoney moves between themThey repeat with similar sizes and timing
The volume number on Dexscreener looks huge, but the number of independent economic participants is very low.
Key metric to watch:
Reported volume vs number of unique wallets that are not connected to each other.
$1.2 million in volume with only 40 real independent wallets tells a completely different story than the same volume with 800 unconnected wallets.
D. Algorithmic / Bot-Like Activity
Signs:
Extremely regular time intervals between tradesAlmost identical trade sizesActivity that never sleeps (24/7 with no human-like pauses)Same exact route through the same pools over and overVery low variation in behavior
You don’t need to say “this is a bot.” You can say:
“Algorithmic activity pattern is high — 87 trades, median interval 1.2 seconds, size variance extremely low.”
That’s already very useful information.
E. High-Frequency & Scalping Behavior
Some wallets buy and sell within seconds or minutes, over and over.
Look at:
Average holding timeNumber of round tripsGross volume traded vs net position change
Example:
A wallet traded $48,000 worth of the token but only ended up with +1,200 tokens.
That is high turnover with low net accumulation — classic scalping or HFT-style behavior.
F. Liquidity Management
Who is adding and removing liquidity, and when?
Interesting patterns:
Liquidity added just before a big buyLiquidity removed just before a big sellLiquidity changes that happen at the same time as certain wallet activityLiquidity concentrated in very few wallets
This can reveal who is trying to control price impact.
G. Absorption (One of the Most Important Patterns)
You see heavy selling pressure…
but the price barely drops…
and buying keeps appearing on the other side.
This often means someone is deliberately absorbing the sells (supporting the price).
Later, when the selling pressure decreases, the price starts rising.
The absorption hypothesis becomes stronger.
H. Distribution Patterns
Instead of one big dump (which destroys the chart), you often see:
Gradual / “Ant” distribution
Small sells spread over hours while retail is still buying.
Stair-step distribution
Price rises → whale sells a chunk → price keeps rising → whale sells again → repeat.
Distribution into strength
Selling while demand is still strong.
I. Accumulation
The opposite of distribution:
Price is sideways or slowly decliningSelling pressure is highCertain wallets keep buyingTheir net position is growingPrice does not fall as much as the selling would suggest
J. MEV / Sandwich Activity
On Solana you can see patterns where:
One wallet buys right before a large tradeThen sells right after
This is common MEV (Maximal Extractable Value) behavior. Not every similar sequence is a sandwich, but the pattern is detectable.
K. Arbitrage & Cross-DEX Price Control
When the same token exists on Pump.fun / PumpSwap and Raydium (or other pools), bots constantly buy the cheaper one and sell the more expensive one.
This keeps prices relatively synchronized. Watching who is doing this arbitrage tells you who is keeping the market efficient.
L. Wallet Rotation & Token Rotation
Wallet rotation:
Position moves from Wallet A → Wallet B → Wallet C while the overall exposure stays similar.
Token rotation:
The same cluster of wallets that were early in Token A now appear accumulating Token B, then Token C.
This is extremely valuable once you start tracking wallet clusters across time.
M. New Wallet Inflow
Sudden appearance of many brand new wallets can mean organic interest… or it can mean a new cluster of coordinated wallets being activated.
Always check whether the new wallets are related to each other.
N. Early / Informed-Looking Activity
Wallets that appear right at launch, buy sizeable amounts, and later sell into the first big expansion.
We don’t call them “insiders.” We call it “early informed-looking activity” and note the pattern.
4. Behavioral Transition — The Most Powerful Layer
A single pattern can be normal.
A change in patterns is often much more meaningful.
Example:
Before
Mostly retail buyingLow wallet coordinationNormal trade intervalsStable liquidity
Then something changes
Wallet synchronization increasesA small group of wallets starts accumulatingSell pressure is being absorbedLiquidity becomes more concentrated
Now
Possible coordinated accumulation phase.
This “regime change” thinking is far more useful than trying to label every token as “has a market maker” or “is organic.”
5. Putting It All Together — Market State
Instead of 20 different alarms, the goal is to arrive at a clear, evidence-based summary:
Market State
Accumulation with coordinated activity
Why
Sell pressure is being absorbed8 high-activity wallets increased their net position5 of them show synchronized execution3 share a common funding relationshipPrice stayed relatively stable despite elevated selling
Caution
Activity is concentrated in a small clusterA meaningful portion of volume may not come from independent participants
Confidence
Medium-High
If you want to go deeper, you can expand every bullet into the raw on-chain evidence.
This format is readable, honest about uncertainty, and actually useful for decision-making.
6. Important Limitations (Read This)
Correlation is not proof of control. Common funding + synchronized trading is strong evidence of coordination, but not 100% certainty.Many patterns that look “manipulative” can also appear in legitimate market-making or sophisticated trading.Order-book style spoofing (fake walls that disappear) is much less relevant on pure AMMs like Raydium or Pump.fun than on centralized exchanges.Tools can be wrong or incomplete. Always try to verify key claims yourself on Solscan, Bubblemaps, or similar explorers.
The goal is not to become a conspiracy theorist. The goal is to see the structure of the market more clearly than the average person watching a stream.
Final Thoughts
Most memecoin traders only see the surface: price, volume, and what influencers say.
Underneath there is a rich layer of wallet coordination, algorithmic behavior, liquidity management, absorption, distribution, and regime changes.
You don’t need to detect “the market maker.”
You need to observe the patterns, form careful hypotheses, and understand what those patterns imply for the next moves in the chart.
Once you start looking at Solana tokens this way, the market becomes a lot less mysterious — and a lot more readable.
Trade carefully.
143
·
--
Bullisch
$HIPPO LANGZEIT
{future}(HIPPOUSDT)
$HIPPO blinkt ein massives Warnsignal. Wir schauen uns eine Lehrbuchfalle "Liquiditätspool" für den Einzelhandel an.
Das Urteil:
Die "Long"-Seite ist gefährlich überfüllt. Der Markt ist derzeit ein riesiger Magnet für einen Rückgang von 2-3%. Der Markt ist darauf ausgelegt, genau diese Art von Überhebelung zu jagen, und der "Long Flush" ist bereits in Arbeit.
Meine Strategie:
Ich halte derzeit eine Long-Position, jedoch ohne Hebel.
In Szenarien, die eine massive explosive Bewegung erwarten, ist es entscheidend, auf eine "Ungültigmachung von dem, was ich gerade gesagt habe" zu achten—wo frisches Kapital eintritt und die bärische Diagnose übersteuert.
Obwohl dies typischerweise auf eine bevorstehende Trendwende hinweist, spült der Markt oft übermäßigen Hebel heraus, bevor die echte Bewegung erfolgt, aber das ist nicht zwingend.
Sei nicht die Exit-Liquidität.
Das schlaue Geld wartet auf den Crash, um das Blut aufzukaufen.
#HIPPO #JIMMYEVANS #ZOOM360
$HIPPO LANGZEIT
$HIPPO blinkt ein massives Warnsignal. Wir schauen uns eine Lehrbuchfalle "Liquiditätspool" für den Einzelhandel an.
Das Urteil:
Die "Long"-Seite ist gefährlich überfüllt. Der Markt ist derzeit ein riesiger Magnet für einen Rückgang von 2-3%. Der Markt ist darauf ausgelegt, genau diese Art von Überhebelung zu jagen, und der "Long Flush" ist bereits in Arbeit.
Meine Strategie:
Ich halte derzeit eine Long-Position, jedoch ohne Hebel.
In Szenarien, die eine massive explosive Bewegung erwarten, ist es entscheidend, auf eine "Ungültigmachung von dem, was ich gerade gesagt habe" zu achten—wo frisches Kapital eintritt und die bärische Diagnose übersteuert.
Obwohl dies typischerweise auf eine bevorstehende Trendwende hinweist, spült der Markt oft übermäßigen Hebel heraus, bevor die echte Bewegung erfolgt, aber das ist nicht zwingend.
Sei nicht die Exit-Liquidität.
Das schlaue Geld wartet auf den Crash, um das Blut aufzukaufen.
#HIPPO #JIMMYEVANS #ZOOM360

2
2
206
·
--
Bullisch
🏆 HANDEL GESCHLOSSEN: +415% ROE 🏆
Ich bin offiziell raus. Hier ist der Grund, warum ich gerade bei 0.4787 verkauft habe, während alle anderen in FOMO waren:
Liquiditätsfalle erkannt: Ich habe bemerkt, dass die 'großen Trucks' ihre Taschen in die Einzelhandelskäufe entladen haben. Wenn das Volumen ansteigt, aber der Preis zu stagnieren beginnt, ist das ein klares Zeichen dafür, dass das kluge Geld aussteigt. Ich bin nicht hier, um ihre Ausstiegsliquidität zu sein.

JIMMY EVANS
·
--
Bullisch$CYS AUF DEM WEG
#Cys
#Cys
2
135


·
--

Artikel
"Das ist kein Diagramm. Es ist ein Geständnis."Das Bild unten sollte dir ins Gesicht schreien. Du bist Zeuge eines der seltensten und mächtigsten Signale im professionellen Trading:
Das ist ein Lehrbuch-Beispiel für "Verborgene Hand" Absorption. Jemand saugt jeden verfügbaren Token auf, ohne den Preis bewegen zu lassen... noch.
"Schau dir den grünen Kreis an. Wenn du nicht verstehst, was dort passiert, bist du nicht allein. Die meisten Händler verstehen es nicht. Aber die, die es tun? Sie sind die, die reich werden." So sieht genau eine Investition aus, die in der Lage ist, mehrere 'X' Gewinn zu liefern, bevor die Explosion.
"Das ist kein Diagramm. Es ist ein Geständnis."
Das Bild unten sollte dir ins Gesicht schreien. Du bist Zeuge eines der seltensten und mächtigsten Signale im professionellen Trading:
Das ist ein Lehrbuch-Beispiel für "Verborgene Hand" Absorption. Jemand saugt jeden verfügbaren Token auf, ohne den Preis bewegen zu lassen... noch.
"Schau dir den grünen Kreis an. Wenn du nicht verstehst, was dort passiert, bist du nicht allein. Die meisten Händler verstehen es nicht. Aber die, die es tun? Sie sind die, die reich werden." So sieht genau eine Investition aus, die in der Lage ist, mehrere 'X' Gewinn zu liefern, bevor die Explosion.
1
124
·
--
Bullisch
Zahlen sprechen lauter als Worte, um meinen Punkt zu beweisen.
Wenn du neugierig darauf bist, sind meine DMs geöffnet. Ich teile gerne, was ich sehe. Kein Gatekeeping. Und du kannst den Beitrag von gestern [HIPPO](https://www.binance.com/en/square/post/296905111224274) sehen.
Zahlen sprechen lauter als Worte, um meinen Punkt zu beweisen.
Wenn du neugierig darauf bist, sind meine DMs geöffnet. Ich teile gerne, was ich sehe. Kein Gatekeeping. Und du kannst den Beitrag von gestern HIPPO sehen.
Wenn du neugierig darauf bist, sind meine DMs geöffnet. Ich teile gerne, was ich sehe. Kein Gatekeeping. Und du kannst den Beitrag von gestern HIPPO sehen.

Der zitierte Inhalt wurde entfernt.
28
·
--
Bullisch

4
·
--
Bullisch
$DENT - LONG 60% PROFIT ZIEL, KEIN HEBEL
{future}(DENTUSDT)
Eine Long-Position auf DENT eröffnet.
Warum?
• Jedes 8 Stunden Zinsen erhalten, während ich warte 🕒💰
• Ziel: 0.0005 🎯60% Gewinn vom aktuellen Niveau bei 0.000303
Ein einfaches Spiel. Zeit im Markt > Timing des Marktes.
Lass es köcheln. 🍳
#Dent #long #ZOOM360 #JIMMYEVANS
$DENT - LONG 60% PROFIT ZIEL, KEIN HEBEL
Eine Long-Position auf DENT eröffnet.
Warum?
• Jedes 8 Stunden Zinsen erhalten, während ich warte 🕒💰
• Ziel: 0.0005 🎯60% Gewinn vom aktuellen Niveau bei 0.000303
Ein einfaches Spiel. Zeit im Markt > Timing des Marktes.
Lass es köcheln. 🍳
#Dent #long #ZOOM360 #JIMMYEVANS
Eine Long-Position auf DENT eröffnet.
Warum?
• Jedes 8 Stunden Zinsen erhalten, während ich warte 🕒💰
• Ziel: 0.0005 🎯60% Gewinn vom aktuellen Niveau bei 0.000303
Ein einfaches Spiel. Zeit im Markt > Timing des Marktes.
Lass es köcheln. 🍳
#Dent #long #ZOOM360 #JIMMYEVANS

2
5
395

·
--

Artikel
OMG ACHTET AUF IP Story Protocol$IP Die "Perfekte Falle" mit den raffiniertesten Angebotsstrategien
Milliarden-Dollar-Falle für die Paper Hands.
Niemand interessiert sich für IP zu $0.91, UND die absoluten Chads und Mega-Wale lachen. Denkst du, das ist ein Betrug? Nein, Bro, du wirst einfach vom Smart Money überlistet.
Stell dir vor, du verkaufst das "Nvidia von IP" mit einem Rabatt von 93%. 💀 Ich habe mich mit der Konzentration der Wallets, den Nasdaq-notierten Rückkäufen und dem geheimen koreanischen RWA-Meta beschäftigt. Die Daten lügen nicht: Das Angebot ist gesperrt, die Leerverkäufe werden gekocht, und...
OMG ACHTET AUF IP Story Protocol
$IP Die "Perfekte Falle" mit den raffiniertesten Angebotsstrategien
Milliarden-Dollar-Falle für die Paper Hands.
Niemand interessiert sich für IP zu $0.91, UND die absoluten Chads und Mega-Wale lachen. Denkst du, das ist ein Betrug? Nein, Bro, du wirst einfach vom Smart Money überlistet.
Stell dir vor, du verkaufst das "Nvidia von IP" mit einem Rabatt von 93%. 💀 Ich habe mich mit der Konzentration der Wallets, den Nasdaq-notierten Rückkäufen und dem geheimen koreanischen RWA-Meta beschäftigt. Die Daten lügen nicht: Das Angebot ist gesperrt, die Leerverkäufe werden gekocht, und...
3
531
·
--
Bullisch
🎯 Versuche, $NAORIS bei $0.021 zu fangen... aber dieser Short Squeeze ist unerbittlich!
{future}(NAORISUSDT)
Die Marktmechanik hier ist lehrbuchmäßig: so viele Shorts sind im Minus, dass jeder Anstieg sie zwingt, ZU KAUFEN, um ihre Positionen zu decken, was die Rally weiter anheizt. 🐻⛽
Die Strategie: Da es sich um einen klassischen Squeeze handelt, habe ich einen offenen Long-Trade, der meinen TP erreicht, sobald die letzte Welle von Shorts liquidiert wird. Mein Plan ist es, diesen Momentum zu nutzen und hoffentlich einen gesunden Rücksetzer zu fangen, um danach einen primären Einstieg bei $0.021 zu erreichen.
Beide Seiten der Volatilität spielen. Mal sehen, ob die "Bären" bald aufhören, den Treibstoff bereitzustellen! 🚀
#JIMMYEVANS #ZOOM360 #Naoris
🎯 Versuche, $NAORIS bei $0.021 zu fangen... aber dieser Short Squeeze ist unerbittlich!
Die Marktmechanik hier ist lehrbuchmäßig: so viele Shorts sind im Minus, dass jeder Anstieg sie zwingt, ZU KAUFEN, um ihre Positionen zu decken, was die Rally weiter anheizt. 🐻⛽
Die Strategie: Da es sich um einen klassischen Squeeze handelt, habe ich einen offenen Long-Trade, der meinen TP erreicht, sobald die letzte Welle von Shorts liquidiert wird. Mein Plan ist es, diesen Momentum zu nutzen und hoffentlich einen gesunden Rücksetzer zu fangen, um danach einen primären Einstieg bei $0.021 zu erreichen.
Beide Seiten der Volatilität spielen. Mal sehen, ob die "Bären" bald aufhören, den Treibstoff bereitzustellen! 🚀
#JIMMYEVANS #ZOOM360 #Naoris
2
1
1
64
·
--
Bullisch
🚨MASSIVE 34% ARBITRAGE ALARM: $NAORIS Die Lücke ist RIESIG (+34%)! 🚨
{alpha}(560x1b379a79c91a540b2bcd612b4d713f31de1b80cc)
{future}(NAORISUSDT)
💰 Spot: $0.0234
🚀 Futures: $0.0315
🎯 Ziel: +34% Gewinn, oder bis die Preise gleich sind$
Aber mein persönliches Ziel liegt bei etwa $0.22
#NaorisProtocol #Naoris #JIMMYEVANS #ZOOM360
🚨MASSIVE 34% ARBITRAGE ALARM: $NAORIS Die Lücke ist RIESIG (+34%)! 🚨
💰 Spot: $0.0234
🚀 Futures: $0.0315
🎯 Ziel: +34% Gewinn, oder bis die Preise gleich sind$
Aber mein persönliches Ziel liegt bei etwa $0.22
#NaorisProtocol #Naoris #JIMMYEVANS #ZOOM360
💰 Spot: $0.0234
🚀 Futures: $0.0315
🎯 Ziel: +34% Gewinn, oder bis die Preise gleich sind$
Aber mein persönliches Ziel liegt bei etwa $0.22
#NaorisProtocol #Naoris #JIMMYEVANS #ZOOM360

4
3
227
·
--
Bullisch
$DAM DAS IST EIN 20X HANDEL VOM TATSÄCHLICHEN PREIS BEI 0.0209
{future}(DAMUSDT)
Starker Volumenspitze auf 1 Stunde und eine flache Finanzierungsrate, ich werde nicht ins Detail gehen, wenn du weißt, was ich meine, wirst du es verstehen.
Mein TP ist nicht weniger als .38
Ich sehe eure Likes und ich schätze sie wirklich wirklich.
$BULLA wird bald den HIMMEL erreichen
{future}(BULLAUSDT)
#ZOOM360 #JIMMYEVANS
$DAM DAS IST EIN 20X HANDEL VOM TATSÄCHLICHEN PREIS BEI 0.0209
Starker Volumenspitze auf 1 Stunde und eine flache Finanzierungsrate, ich werde nicht ins Detail gehen, wenn du weißt, was ich meine, wirst du es verstehen.
Mein TP ist nicht weniger als .38
Ich sehe eure Likes und ich schätze sie wirklich wirklich.
$BULLA wird bald den HIMMEL erreichen
#ZOOM360 #JIMMYEVANS

1
196
·
--

Artikel
Ich werde 30.000% mit HIPPOWas die Daten tatsächlich zeigen
Ich habe die On-Chain-Metriken untersucht, um Signal von Rauschen zu trennen. Hier ist, was verifizierte Daten über den aktuellen Zustand von $HIPPO offenbaren
1. Die Realität der Konzentration 🐋
Laut Wallet-Analyse halten die 10 größten Wallets etwa 66,14% des zirkulierenden Angebots. Das ist nicht unbedingt Manipulation – es ist strukturell. Mit 7.212 aktiven Inhabern bedeutet diese Konzentration:
Große Inhaber können die Preisrichtung erheblich beeinflussen
Selbst moderate Marktaufträge erzeugen bemerkenswerte Slippage
Ich werde 30.000% mit HIPPO
Was die Daten tatsächlich zeigen
Ich habe die On-Chain-Metriken untersucht, um Signal von Rauschen zu trennen. Hier ist, was verifizierte Daten über den aktuellen Zustand von $HIPPO offenbaren
1. Die Realität der Konzentration 🐋
Laut Wallet-Analyse halten die 10 größten Wallets etwa 66,14% des zirkulierenden Angebots. Das ist nicht unbedingt Manipulation – es ist strukturell. Mit 7.212 aktiven Inhabern bedeutet diese Konzentration:
Große Inhaber können die Preisrichtung erheblich beeinflussen
Selbst moderate Marktaufträge erzeugen bemerkenswerte Slippage
4
260
Anmelden und weiter Inhalte entdecken
Krypto-Nutzer weltweit auf Binance Square kennenlernen
⚡️ Bleib in Sachen Krypto stets am Puls.
💬 Die weltgrößte Kryptobörse vertraut darauf.
👍 Erhalte verlässliche Einblicke von verifizierten Creators.
E-Mail-Adresse/Telefonnummer
Trendthemen
BinanceReports80%Recoveryof$6.3BillioninLossesfromHackIncident
13,895 Aufrufe
133 Kommentare
Update zum Sicherheitsvorfall Nr. 2 (30.10.2026)
Binance Announcement
·1k Likes
·1.2M Aufrufe
HeYiSaysWithdrawalsExpectedtoResumeWithin42Hours
22,749 Aufrufe
445 Kommentare
CZSaysCompensationIsinPlaceUsersAreProtected
25,117 Aufrufe
352 Kommentare