
Humaira Naseem
3 Beiträge

Humaira Naseem
Melden
Nutzer blockieren
Follow us for daily updates and analysis 🌹
1 Following
0 Follower
1 Like gegeben
Beiträge
·
--
$BTC 🚀 Zukunftsprognose
Kurzfristig (1–4 Wochen)
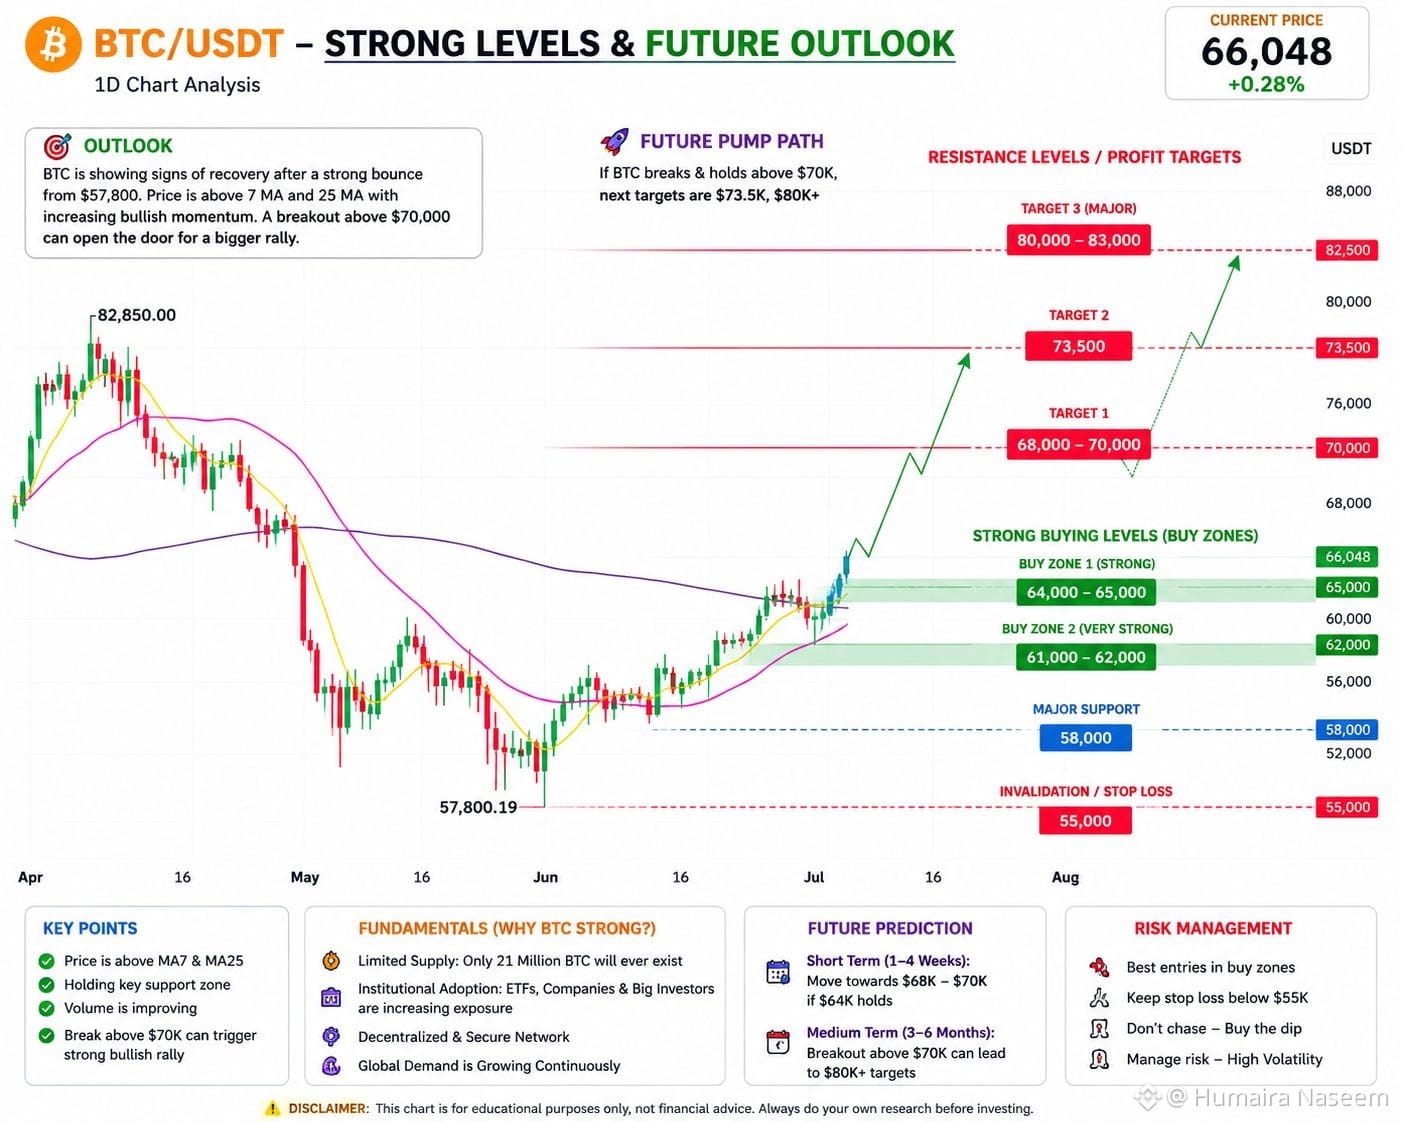
Wenn Bitcoin über $64K bleibt, könnte es einen Schritt in Richtung $68K–$70K versuchen. Ein Ausbruch über $70K würde die Wahrscheinlichkeit erhöhen, höhere Widerstandsbereiche zu testen. �
Investopedia +1
Mittelfristig (3–6 Monate)
Wenn die institutionelle Nachfrage stabil bleibt und die ETF-Zuflüsse sich verbessern, könnte Bitcoin die Region von $80K+ erneut ansteuern. Andererseits könnten schwächere ETF-Nachfrage oder ungünstige makroökonomische Bedingungen zu einer weiteren Korrektur führen, bevor es zu einem nachhaltigen Aufwärtstrend kommt
📊 BTC/USDT – Kurze technische Analyse (1D-Chart)
Bitcoin wird derzeit bei rund $66.000 gehandelt, nachdem es sich vom Tief bei $57.800 erholt hat. Im Tageschart liegt BTC über den 7-Tage- und 25-Tage-Moving Averages, was auf eine verbesserte kurzfristige Dynamik hindeutet. Allerdings liegt es noch unter dem 99-Tage-Moving Average (~$70.000), was diesen Bereich zu einem wichtigen Widerstand macht, den die Bullen zurückerobern müssen. Ein täglicher Schlusskurs über dem 99er MA würde das bullische Szenario stärken. Basierend auf dem Chart verbessert sich die Gesamtstruktur, aber es bedarf noch einer Bestätigung. (Dies ist eine technische Analyse, keine Garantie.)
💎 Bitcoin-Grundlagen
🏦 Die institutionelle Akzeptanz bleibt eine der größten langfristigen Stärken von Bitcoin: Große Finanzinstitute und Spot-Bitcoin-ETFs erhöhen den Zugang in den Mainstream. �
Kiplinger +1
📉 Begrenztes Angebot: Es wird nur 21 Millionen BTC geben, wodurch Bitcoin nach Design knapp ist.
🔒 Dezentrales Netzwerk: Bitcoin wird durch eines der größten verteilten Rechennetzwerke der Welt abgesichert.
🌍 Die globale Akzeptanz nimmt weiter zu – bei Anlegern, Unternehmen und einigen Regierungen – obwohl Regulierung und makroökonomische Bedingungen den Preis weiterhin stark beeinflussen. �
Wikipedia +1
⭐ Gesamt-Ausblick
Trend: Moderat bullisch
Risiko: Mittel
Strategie: In der Nähe von Unterstützungszonen ansammeln, statt großen grünen Kerzen hinterherzulaufen.
Gesamtbewertung: 8,8/10
{spot}(BTCUSDT)
$BTC 🚀 Zukunftsprognose
Kurzfristig (1–4 Wochen)
Wenn Bitcoin über $64K bleibt, könnte es einen Schritt in Richtung $68K–$70K versuchen. Ein Ausbruch über $70K würde die Wahrscheinlichkeit erhöhen, höhere Widerstandsbereiche zu testen. �
Investopedia +1
Mittelfristig (3–6 Monate)
Wenn die institutionelle Nachfrage stabil bleibt und die ETF-Zuflüsse sich verbessern, könnte Bitcoin die Region von $80K+ erneut ansteuern. Andererseits könnten schwächere ETF-Nachfrage oder ungünstige makroökonomische Bedingungen zu einer weiteren Korrektur führen, bevor es zu einem nachhaltigen Aufwärtstrend kommt
📊 BTC/USDT – Kurze technische Analyse (1D-Chart)
Bitcoin wird derzeit bei rund $66.000 gehandelt, nachdem es sich vom Tief bei $57.800 erholt hat. Im Tageschart liegt BTC über den 7-Tage- und 25-Tage-Moving Averages, was auf eine verbesserte kurzfristige Dynamik hindeutet. Allerdings liegt es noch unter dem 99-Tage-Moving Average (~$70.000), was diesen Bereich zu einem wichtigen Widerstand macht, den die Bullen zurückerobern müssen. Ein täglicher Schlusskurs über dem 99er MA würde das bullische Szenario stärken. Basierend auf dem Chart verbessert sich die Gesamtstruktur, aber es bedarf noch einer Bestätigung. (Dies ist eine technische Analyse, keine Garantie.)
💎 Bitcoin-Grundlagen
🏦 Die institutionelle Akzeptanz bleibt eine der größten langfristigen Stärken von Bitcoin: Große Finanzinstitute und Spot-Bitcoin-ETFs erhöhen den Zugang in den Mainstream. �
Kiplinger +1
📉 Begrenztes Angebot: Es wird nur 21 Millionen BTC geben, wodurch Bitcoin nach Design knapp ist.
🔒 Dezentrales Netzwerk: Bitcoin wird durch eines der größten verteilten Rechennetzwerke der Welt abgesichert.
🌍 Die globale Akzeptanz nimmt weiter zu – bei Anlegern, Unternehmen und einigen Regierungen – obwohl Regulierung und makroökonomische Bedingungen den Preis weiterhin stark beeinflussen. �
Wikipedia +1
⭐ Gesamt-Ausblick
Trend: Moderat bullisch
Risiko: Mittel
Strategie: In der Nähe von Unterstützungszonen ansammeln, statt großen grünen Kerzen hinterherzulaufen.
Gesamtbewertung: 8,8/10
Kurzfristig (1–4 Wochen)
Wenn Bitcoin über $64K bleibt, könnte es einen Schritt in Richtung $68K–$70K versuchen. Ein Ausbruch über $70K würde die Wahrscheinlichkeit erhöhen, höhere Widerstandsbereiche zu testen. �
Investopedia +1
Mittelfristig (3–6 Monate)
Wenn die institutionelle Nachfrage stabil bleibt und die ETF-Zuflüsse sich verbessern, könnte Bitcoin die Region von $80K+ erneut ansteuern. Andererseits könnten schwächere ETF-Nachfrage oder ungünstige makroökonomische Bedingungen zu einer weiteren Korrektur führen, bevor es zu einem nachhaltigen Aufwärtstrend kommt
📊 BTC/USDT – Kurze technische Analyse (1D-Chart)
Bitcoin wird derzeit bei rund $66.000 gehandelt, nachdem es sich vom Tief bei $57.800 erholt hat. Im Tageschart liegt BTC über den 7-Tage- und 25-Tage-Moving Averages, was auf eine verbesserte kurzfristige Dynamik hindeutet. Allerdings liegt es noch unter dem 99-Tage-Moving Average (~$70.000), was diesen Bereich zu einem wichtigen Widerstand macht, den die Bullen zurückerobern müssen. Ein täglicher Schlusskurs über dem 99er MA würde das bullische Szenario stärken. Basierend auf dem Chart verbessert sich die Gesamtstruktur, aber es bedarf noch einer Bestätigung. (Dies ist eine technische Analyse, keine Garantie.)
💎 Bitcoin-Grundlagen
🏦 Die institutionelle Akzeptanz bleibt eine der größten langfristigen Stärken von Bitcoin: Große Finanzinstitute und Spot-Bitcoin-ETFs erhöhen den Zugang in den Mainstream. �
Kiplinger +1
📉 Begrenztes Angebot: Es wird nur 21 Millionen BTC geben, wodurch Bitcoin nach Design knapp ist.
🔒 Dezentrales Netzwerk: Bitcoin wird durch eines der größten verteilten Rechennetzwerke der Welt abgesichert.
🌍 Die globale Akzeptanz nimmt weiter zu – bei Anlegern, Unternehmen und einigen Regierungen – obwohl Regulierung und makroökonomische Bedingungen den Preis weiterhin stark beeinflussen. �
Wikipedia +1
⭐ Gesamt-Ausblick
Trend: Moderat bullisch
Risiko: Mittel
Strategie: In der Nähe von Unterstützungszonen ansammeln, statt großen grünen Kerzen hinterherzulaufen.
Gesamtbewertung: 8,8/10
67
·
--
Bullisch
$EPIC 🚀 Ist die EPIC Coin bereit für ihren nächsten großen Schritt? Kaufe nicht, bevor du das gelesen hast!
EPIC/USDT – Kurze technische Analyse (1D-Chart)
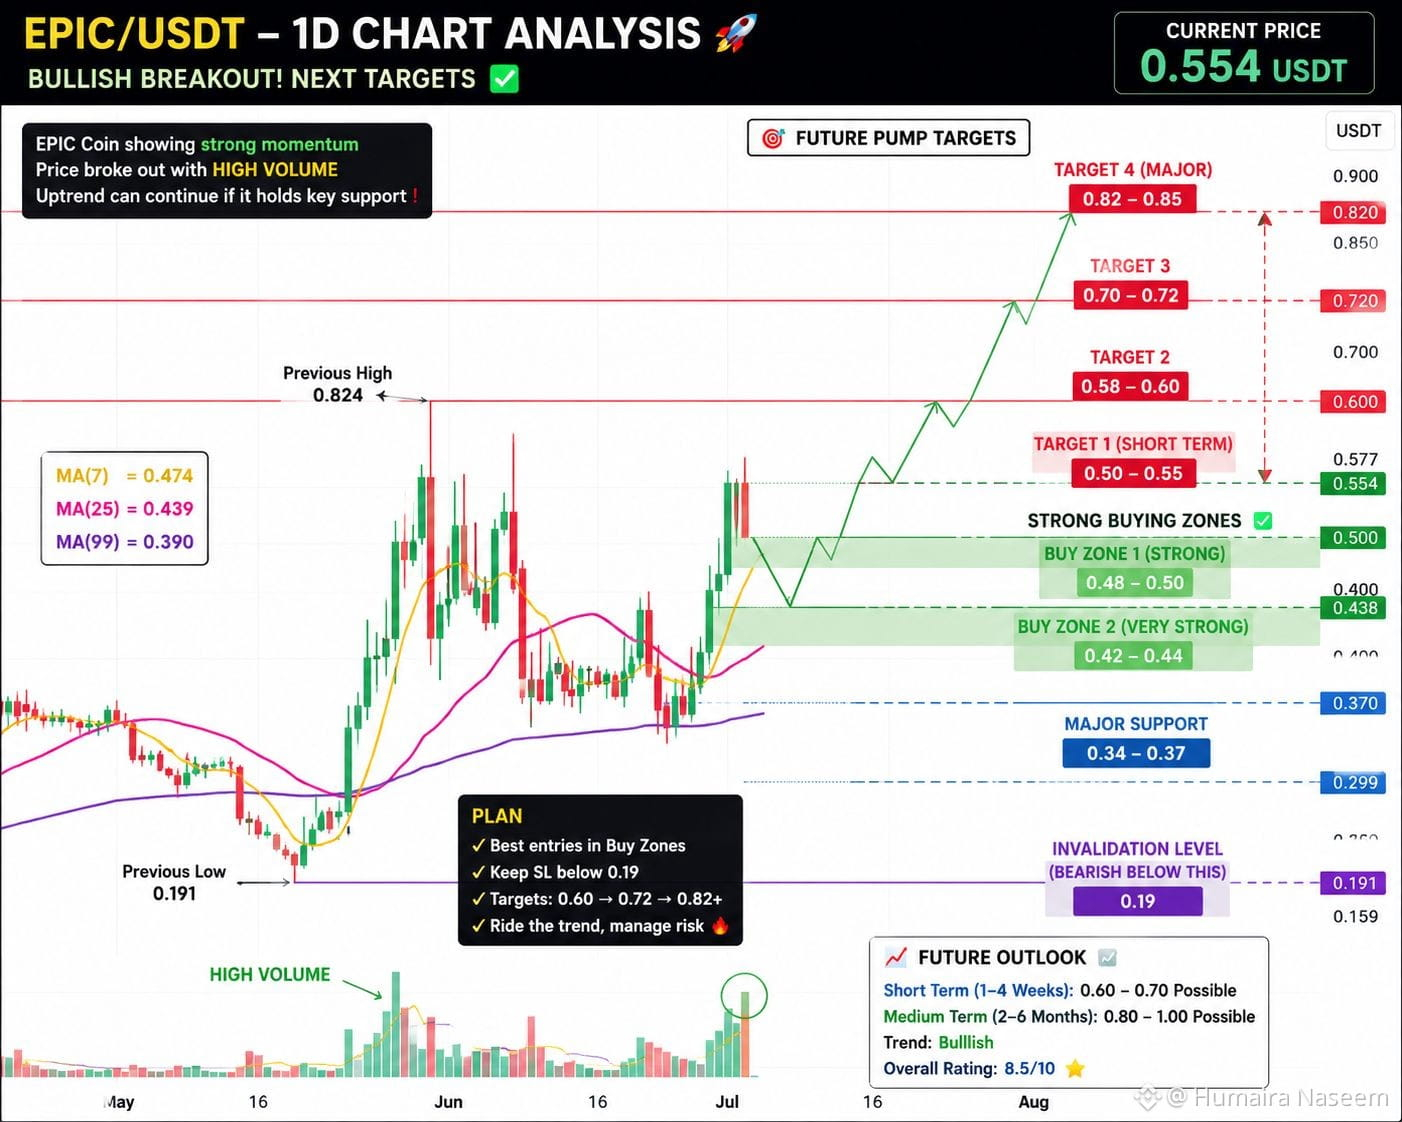
EPIC hat einen starken bullishen Ausbruch gezeigt und ist an einem einzigen Tag um fast 20% gestiegen, begleitet von einem höheren Handelsvolumen. Der Kurs liegt über den 7-Tage-, 25-Tage- und 99-Tage-Moving Averages, was ein positives Zeichen ist und darauf hindeutet, dass die Käufer die Kontrolle haben.
Allerdings ist nach einem steilen Rally ein kurzfristiger Rücksetzer normal, bevor es weiter nach oben geht. Dem aktuellen Kurs hinterherzujagen kann riskant sein.
📊 Wichtige Kursniveaus
🟢 Starke Kaufzone 1:
$0.48 – $0.50
Beste Zone, wenn der Kurs den Support erneut testet.
🟢 Starke Kaufzone 2:
$0.42 – $0.44
Starker Support nahe dem 25-Tage-Moving Average.
🔴 Widerstandsniveaus:
$0.58 – $0.60
$0.70 – $0.72
$0.82 (Widerstand von großer Bedeutung)
🎯 Zukünftige Prognose
Kurzfristig (1–4 Wochen):
Wenn EPIC über $0.50 hält, könnte es $0.60–$0.70 testen.
Mittelfristig (2–6 Monate):
Wenn Bitcoin weiterhin bullish bleibt und das Kaufvolumen stark bleibt, könnte EPIC $0.80–$1.00 erneut ansteuern.
Wenn sich der Markt abschwächt, ist ein Rücksetzer in Richtung $0.48 oder $0.44 möglich, bevor es zu einer weiteren Rally kommt.
⭐ Gesamtfazit
Trend: Bullish
Risiko: Mittel–Hoch (volatile Coin)
Strategie: Auf einen Rücksetzer in die Kaufzonen warten, statt FOMO-Käufe nach einer großen grünen Kerze.
Gesamtbewertung: 8.5/10 (Bullish mit gesunder Risikosteuerung)
#dailyanalysis #Epic #Market_Update #pumpingsoon
{spot}(EPICUSDT)
$EPIC 🚀 Ist die EPIC Coin bereit für ihren nächsten großen Schritt? Kaufe nicht, bevor du das gelesen hast!
EPIC/USDT – Kurze technische Analyse (1D-Chart)
EPIC hat einen starken bullishen Ausbruch gezeigt und ist an einem einzigen Tag um fast 20% gestiegen, begleitet von einem höheren Handelsvolumen. Der Kurs liegt über den 7-Tage-, 25-Tage- und 99-Tage-Moving Averages, was ein positives Zeichen ist und darauf hindeutet, dass die Käufer die Kontrolle haben.
Allerdings ist nach einem steilen Rally ein kurzfristiger Rücksetzer normal, bevor es weiter nach oben geht. Dem aktuellen Kurs hinterherzujagen kann riskant sein.
📊 Wichtige Kursniveaus
🟢 Starke Kaufzone 1:
$0.48 – $0.50
Beste Zone, wenn der Kurs den Support erneut testet.
🟢 Starke Kaufzone 2:
$0.42 – $0.44
Starker Support nahe dem 25-Tage-Moving Average.
🔴 Widerstandsniveaus:
$0.58 – $0.60
$0.70 – $0.72
$0.82 (Widerstand von großer Bedeutung)
🎯 Zukünftige Prognose
Kurzfristig (1–4 Wochen):
Wenn EPIC über $0.50 hält, könnte es $0.60–$0.70 testen.
Mittelfristig (2–6 Monate):
Wenn Bitcoin weiterhin bullish bleibt und das Kaufvolumen stark bleibt, könnte EPIC $0.80–$1.00 erneut ansteuern.
Wenn sich der Markt abschwächt, ist ein Rücksetzer in Richtung $0.48 oder $0.44 möglich, bevor es zu einer weiteren Rally kommt.
⭐ Gesamtfazit
Trend: Bullish
Risiko: Mittel–Hoch (volatile Coin)
Strategie: Auf einen Rücksetzer in die Kaufzonen warten, statt FOMO-Käufe nach einer großen grünen Kerze.
Gesamtbewertung: 8.5/10 (Bullish mit gesunder Risikosteuerung)
#dailyanalysis #Epic #Market_Update #pumpingsoon
EPIC/USDT – Kurze technische Analyse (1D-Chart)
EPIC hat einen starken bullishen Ausbruch gezeigt und ist an einem einzigen Tag um fast 20% gestiegen, begleitet von einem höheren Handelsvolumen. Der Kurs liegt über den 7-Tage-, 25-Tage- und 99-Tage-Moving Averages, was ein positives Zeichen ist und darauf hindeutet, dass die Käufer die Kontrolle haben.
Allerdings ist nach einem steilen Rally ein kurzfristiger Rücksetzer normal, bevor es weiter nach oben geht. Dem aktuellen Kurs hinterherzujagen kann riskant sein.
📊 Wichtige Kursniveaus
🟢 Starke Kaufzone 1:
$0.48 – $0.50
Beste Zone, wenn der Kurs den Support erneut testet.
🟢 Starke Kaufzone 2:
$0.42 – $0.44
Starker Support nahe dem 25-Tage-Moving Average.
🔴 Widerstandsniveaus:
$0.58 – $0.60
$0.70 – $0.72
$0.82 (Widerstand von großer Bedeutung)
🎯 Zukünftige Prognose
Kurzfristig (1–4 Wochen):
Wenn EPIC über $0.50 hält, könnte es $0.60–$0.70 testen.
Mittelfristig (2–6 Monate):
Wenn Bitcoin weiterhin bullish bleibt und das Kaufvolumen stark bleibt, könnte EPIC $0.80–$1.00 erneut ansteuern.
Wenn sich der Markt abschwächt, ist ein Rücksetzer in Richtung $0.48 oder $0.44 möglich, bevor es zu einer weiteren Rally kommt.
⭐ Gesamtfazit
Trend: Bullish
Risiko: Mittel–Hoch (volatile Coin)
Strategie: Auf einen Rücksetzer in die Kaufzonen warten, statt FOMO-Käufe nach einer großen grünen Kerze.
Gesamtbewertung: 8.5/10 (Bullish mit gesunder Risikosteuerung)
#dailyanalysis #Epic #Market_Update #pumpingsoon
1
93
·
--
$NIGHT
Coin-Kurzanalyse
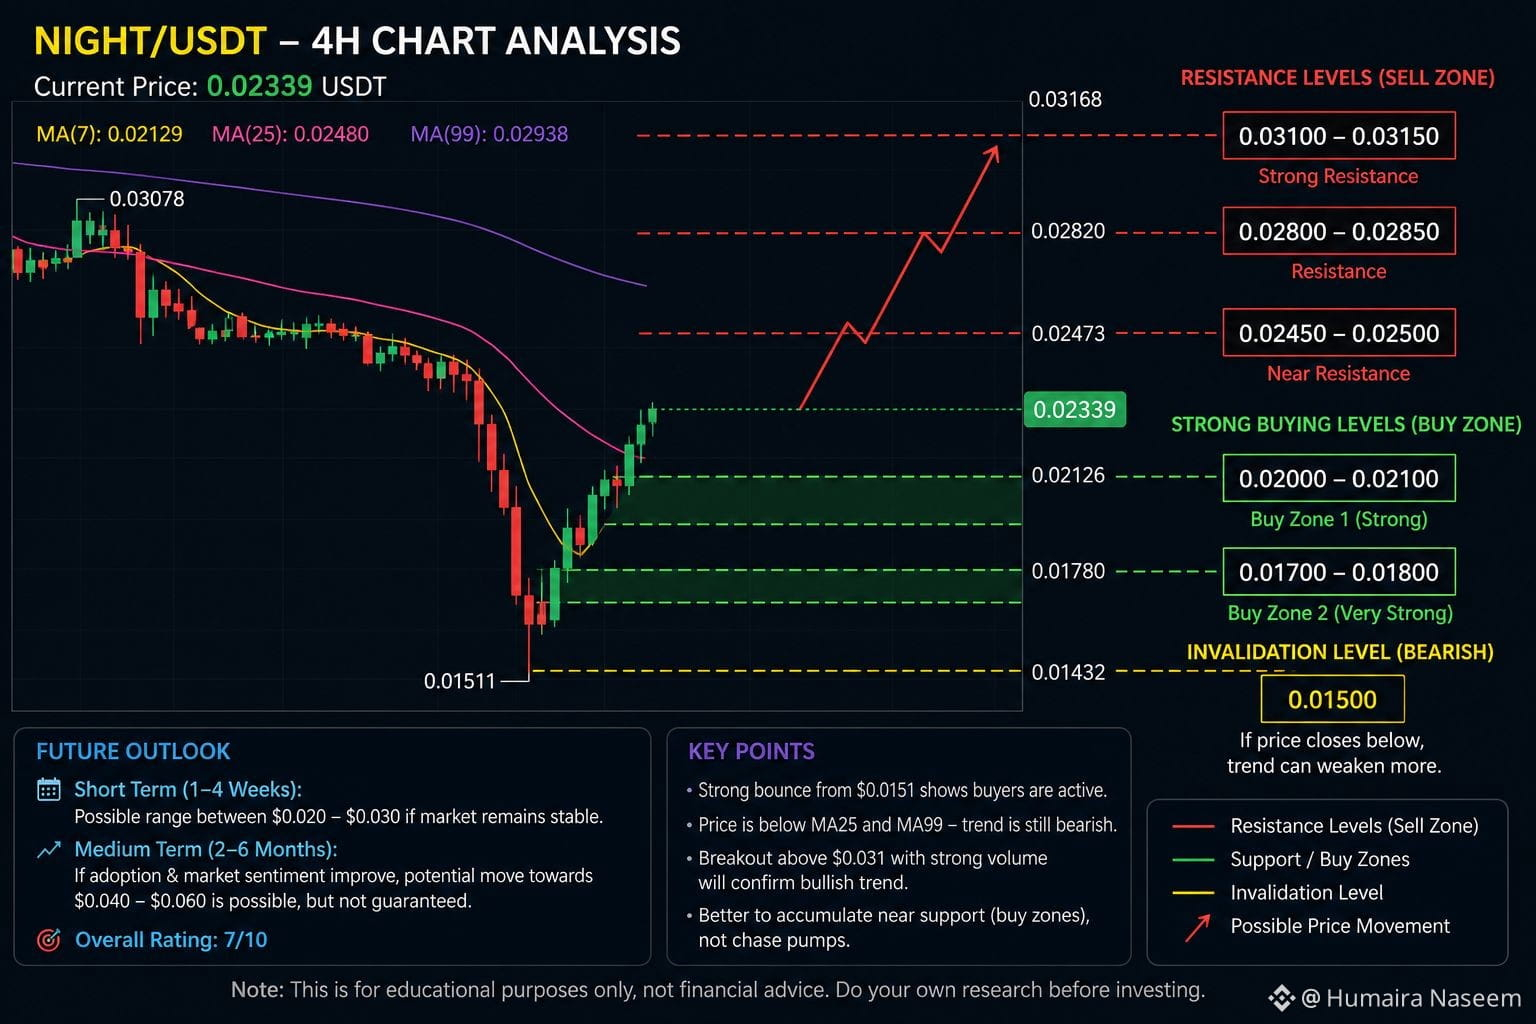
Der Preis ist kürzlich von etwa 0,0307 $ auf 0,0151 $ abgestürzt und hat sich dann stark erholt.
Aktuell handelt die Kryptowährung bei rund 0,0234 $, aber sie liegt noch unter dem 25 MA und dem 99 MA, was bedeutet, dass der größere Trend weiterhin bärisch ist.
Der Rückprall von 0,0151 $ zeigt, dass Käufer aktiv sind, aber die Coin muss einen Widerstand durchbrechen, um einen stärkeren Aufwärtstrend zu bestätigen.
Midnight ist ein privacy-fokussiertes Blockchain-Projekt mit Zero-Knowledge-Technologie, aber wie viele neue Krypto-Projekte bleibt es extrem volatil. �
Midnight Network +1
Starke Kaufzonen
🟢 Kaufzone 1 (Stark):
0,0200 – 0,0210
Gut, wenn der Preis zurückkommt und diesen Bereich hält.
🟢 Kaufzone 2 (Sehr stark):
0,0170 – 0,0180
Starkes historisches Unterstützungsniveau.
🔴 Ungültigmachung:
Wenn der Preis unter 0,0150 schließt, könnte der Trend deutlich schwächer werden.
Widerstandsniveaus
0,0248
0,0280
0,0305 – 0,0310
Ein Ausbruch über 0,031 $ mit starkem Volumen wäre ein bullisches Signal.
Zukunftsprognose
Kurzfristig (1–4 Wochen): Möglicher Bereich zwischen 0,020 und 0,030, wenn der Krypto-Markt stabil bleibt.
Mittelfristig (2–6 Monate): Wenn die Adoption und die Markstimmung sich verbessern, ist eine Bewegung in Richtung 0,04–0,06 möglich, aber nicht garantiert, da es sich um einen risikoreichen, hochvolatilen Token handelt. �
CoinGecko +1
Gesamtbewertung: 7/10
✅ Solide Projektgrundlagen.
⚠️ Hohe Volatilität.
💰 Besser in der Nähe von Unterstützungsniveaus ansammeln, statt Pumps hinterherzulaufen.
#night #future #Bullrun #nextmove #pump #gainer
{spot}(NIGHTUSDT)
$NIGHT
Coin-Kurzanalyse
Der Preis ist kürzlich von etwa 0,0307 $ auf 0,0151 $ abgestürzt und hat sich dann stark erholt.
Aktuell handelt die Kryptowährung bei rund 0,0234 $, aber sie liegt noch unter dem 25 MA und dem 99 MA, was bedeutet, dass der größere Trend weiterhin bärisch ist.
Der Rückprall von 0,0151 $ zeigt, dass Käufer aktiv sind, aber die Coin muss einen Widerstand durchbrechen, um einen stärkeren Aufwärtstrend zu bestätigen.
Midnight ist ein privacy-fokussiertes Blockchain-Projekt mit Zero-Knowledge-Technologie, aber wie viele neue Krypto-Projekte bleibt es extrem volatil. �
Midnight Network +1
Starke Kaufzonen
🟢 Kaufzone 1 (Stark):
0,0200 – 0,0210
Gut, wenn der Preis zurückkommt und diesen Bereich hält.
🟢 Kaufzone 2 (Sehr stark):
0,0170 – 0,0180
Starkes historisches Unterstützungsniveau.
🔴 Ungültigmachung:
Wenn der Preis unter 0,0150 schließt, könnte der Trend deutlich schwächer werden.
Widerstandsniveaus
0,0248
0,0280
0,0305 – 0,0310
Ein Ausbruch über 0,031 $ mit starkem Volumen wäre ein bullisches Signal.
Zukunftsprognose
Kurzfristig (1–4 Wochen): Möglicher Bereich zwischen 0,020 und 0,030, wenn der Krypto-Markt stabil bleibt.
Mittelfristig (2–6 Monate): Wenn die Adoption und die Markstimmung sich verbessern, ist eine Bewegung in Richtung 0,04–0,06 möglich, aber nicht garantiert, da es sich um einen risikoreichen, hochvolatilen Token handelt. �
CoinGecko +1
Gesamtbewertung: 7/10
✅ Solide Projektgrundlagen.
⚠️ Hohe Volatilität.
💰 Besser in der Nähe von Unterstützungsniveaus ansammeln, statt Pumps hinterherzulaufen.
#night #future #Bullrun #nextmove #pump #gainer
Coin-Kurzanalyse
Der Preis ist kürzlich von etwa 0,0307 $ auf 0,0151 $ abgestürzt und hat sich dann stark erholt.
Aktuell handelt die Kryptowährung bei rund 0,0234 $, aber sie liegt noch unter dem 25 MA und dem 99 MA, was bedeutet, dass der größere Trend weiterhin bärisch ist.
Der Rückprall von 0,0151 $ zeigt, dass Käufer aktiv sind, aber die Coin muss einen Widerstand durchbrechen, um einen stärkeren Aufwärtstrend zu bestätigen.
Midnight ist ein privacy-fokussiertes Blockchain-Projekt mit Zero-Knowledge-Technologie, aber wie viele neue Krypto-Projekte bleibt es extrem volatil. �
Midnight Network +1
Starke Kaufzonen
🟢 Kaufzone 1 (Stark):
0,0200 – 0,0210
Gut, wenn der Preis zurückkommt und diesen Bereich hält.
🟢 Kaufzone 2 (Sehr stark):
0,0170 – 0,0180
Starkes historisches Unterstützungsniveau.
🔴 Ungültigmachung:
Wenn der Preis unter 0,0150 schließt, könnte der Trend deutlich schwächer werden.
Widerstandsniveaus
0,0248
0,0280
0,0305 – 0,0310
Ein Ausbruch über 0,031 $ mit starkem Volumen wäre ein bullisches Signal.
Zukunftsprognose
Kurzfristig (1–4 Wochen): Möglicher Bereich zwischen 0,020 und 0,030, wenn der Krypto-Markt stabil bleibt.
Mittelfristig (2–6 Monate): Wenn die Adoption und die Markstimmung sich verbessern, ist eine Bewegung in Richtung 0,04–0,06 möglich, aber nicht garantiert, da es sich um einen risikoreichen, hochvolatilen Token handelt. �
CoinGecko +1
Gesamtbewertung: 7/10
✅ Solide Projektgrundlagen.
⚠️ Hohe Volatilität.
💰 Besser in der Nähe von Unterstützungsniveaus ansammeln, statt Pumps hinterherzulaufen.
#night #future #Bullrun #nextmove #pump #gainer
99
Anmelden und weiter Inhalte entdecken
Krypto-Nutzer weltweit auf Binance Square kennenlernen
⚡️ Bleib in Sachen Krypto stets am Puls.
💬 Die weltgrößte Kryptobörse vertraut darauf.
👍 Erhalte verlässliche Einblicke von verifizierten Creators.
E-Mail-Adresse/Telefonnummer
Trendthemen
CPIWatch
87.3M Aufrufe
503,975 Kommentare
Teile & gewinne Traffic-Belohnungen in unserer Kampagne mit den Trend-Hashtags
✨Thema: Wird CPI eine Zinserhöhung auslösen?
👉So nimmst du teil:
Veröffentliche einen kurzen Beitrag oder Artikel mit dem Hashtag #CPIWatch
Erstelle Inhalte basierend auf den folgenden zwei Blickwinkeln:
- Nichtlandwirtschaftliche Payrolls übertreffen die Erwartungen und CPI steht kurz bevor—glaubst du, dass die Fed die Zinsen erhöht oder hält?
- Bärisch oder bullisch? Teile deine Einschätzung und präsentiere deine Aktien oder Gold-Trades/Bestände mit unserem Widget zum Teilen von Trades.
🚀Kampagnenzeitraum:
- 2026-09-11 3:00 - 2026-09-12 9:00 UTC
🎁Belohnung:
- Qualifizierte Beiträge, die die oben genannten Richtlinien einhalten und mehr als 100 Wörter enthalten, werden überprüft und können möglicherweise einen zufälligen Traffic-Boost von 500 bis 3.000 Views erhalten. Du erhältst eine Benachrichtigung von deiner Feed-Sekretärin, wenn dein Beitrag ausgewählt wurde.
- Erhalte die Chance, dass dein Artikel auf Binance Square Official vorgestellt wird
Brauchst du Ideen für deinen Beitrag? Besuche die Themen-Seite #CPIWatch oder die Square Guide on How to Post for Better Reach.
Binance Square Official
·607 Likes
·1.7M Aufrufe
USBankCompletesCrossBorderPaymentPilotOnStellar
1,501 Aufrufe
84 Kommentare
NvidiaInTalksToInvestUpTo$10BInAnthropicIPO
176 Aufrufe
12 Kommentare