
Crypto Sniper Official
371 Beiträge

Crypto Sniper Official
Melden
Nutzer blockieren
Crypto Market Analyst 📊 BTC & Altcoin Technical Analysis Trading Education | Market Insights Risk Management First
3 Following
79 Follower
48 Like gegeben
Beiträge
Alle
Zitierungen
Videos
Übersetzung ansehen
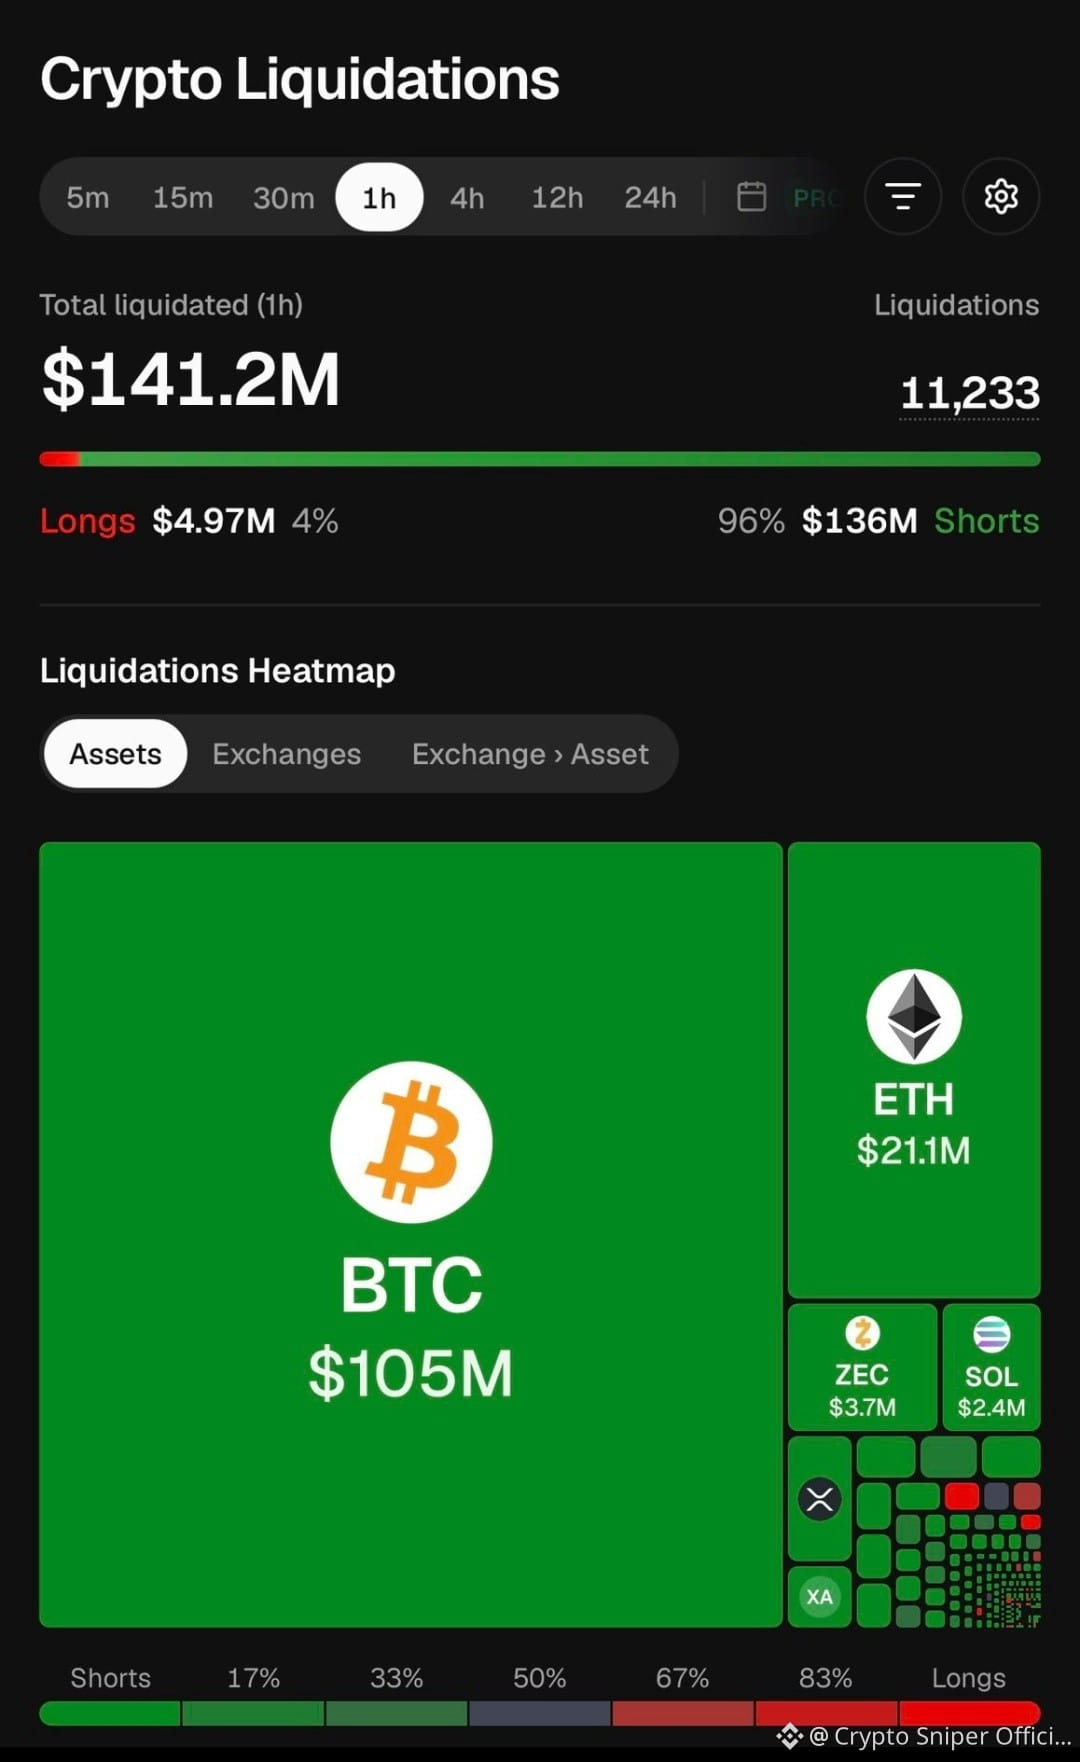
$BTC : $136,000,000 worth of shorts liquidated from the crypto market in the past 1 hour.
$BTC : $136,000,000 worth of shorts liquidated from the crypto market in the past 1 hour.
2
Übersetzung ansehen
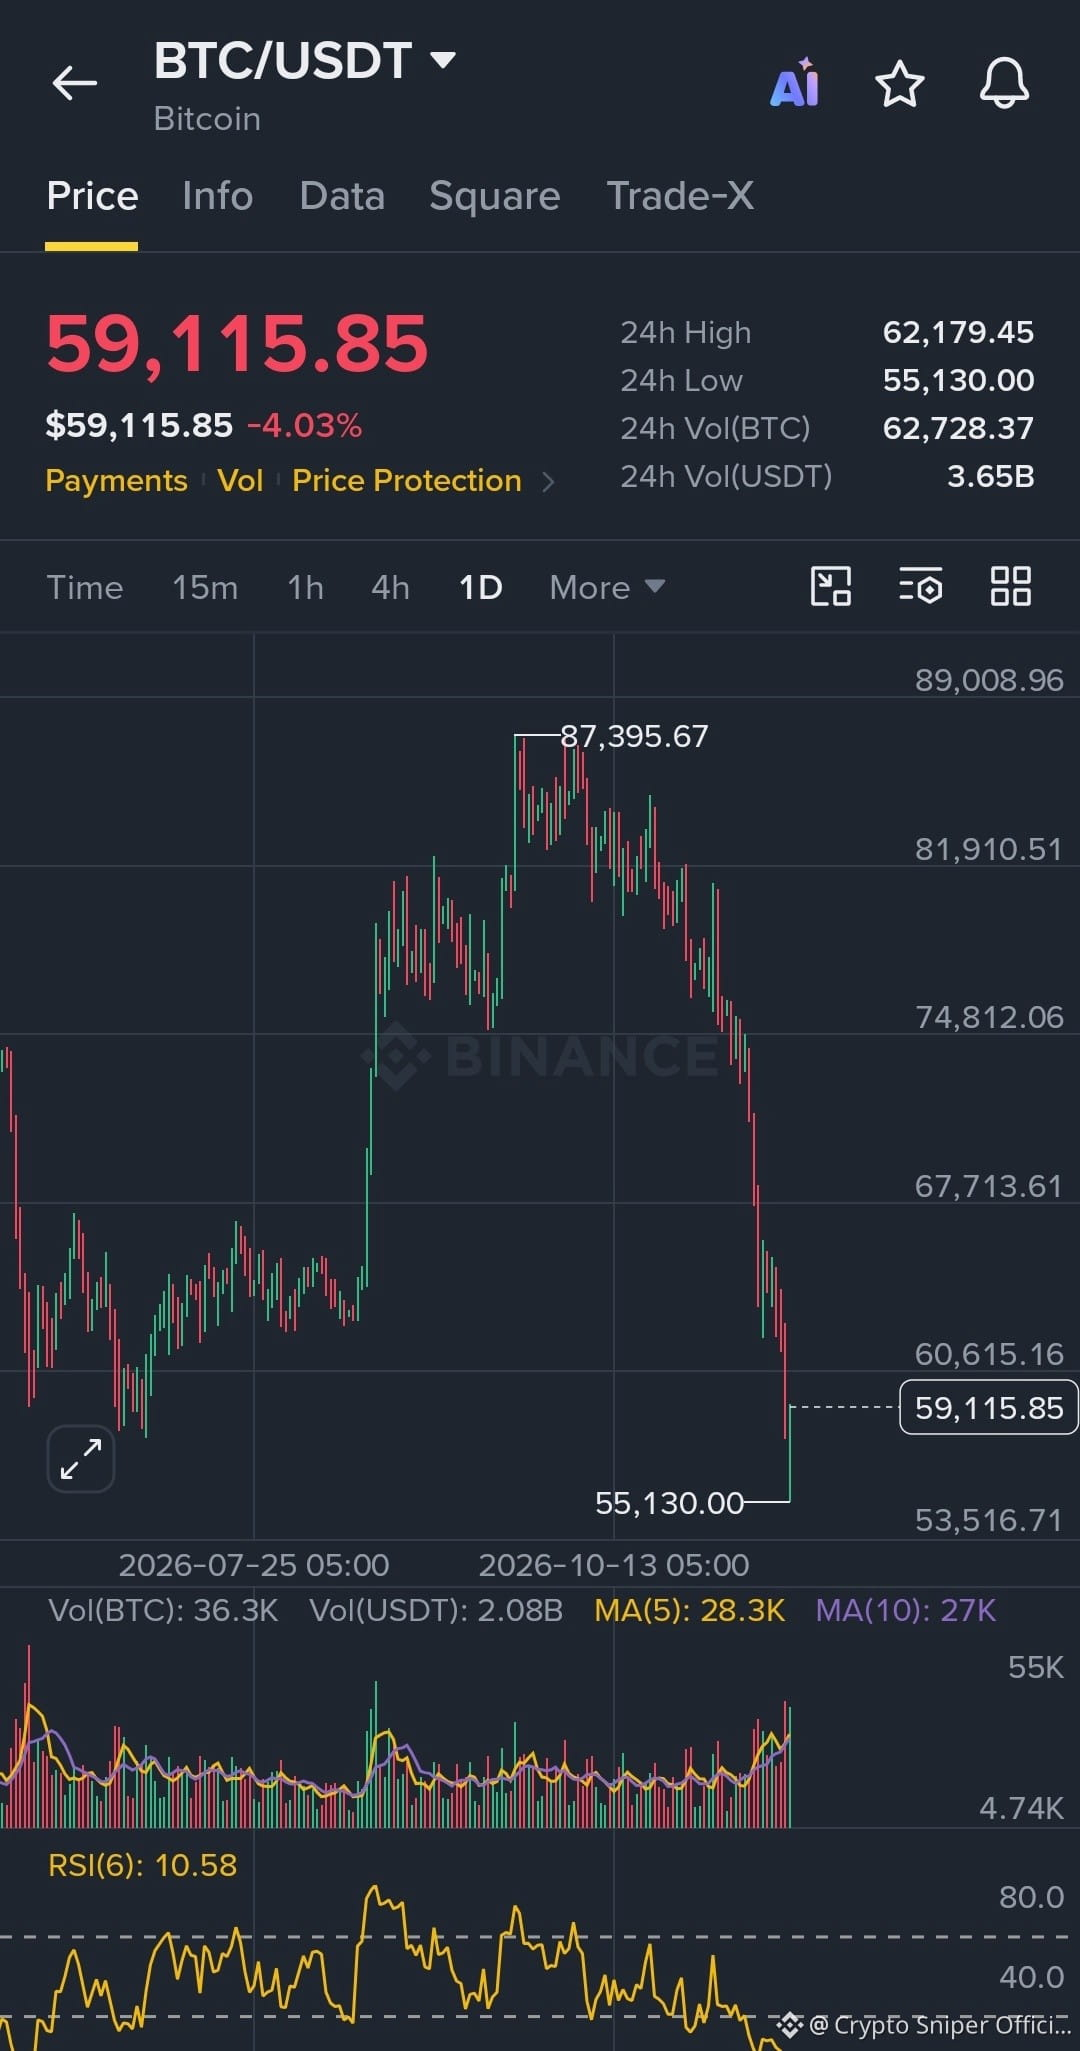
$BTC BTC/USDT — 1D timeframe
Price: $59,115
24H low: $55,130
RSI(6): 10.58 — extremely oversold
Trend: Strong bearish
Support: $55,130, then $53,500
Resistance: $60,615, then $62,179
Daily trend strongly bearish. RSI(6) at 10.58 shows extreme oversold conditions; a relief bounce is possible.
Bias: Bearish until BTC reclaims $62,179.
#CanBTCReboundAfterFallingBelow60K?
$BTC BTC/USDT — 1D timeframe
Price: $59,115
24H low: $55,130
RSI(6): 10.58 — extremely oversold
Trend: Strong bearish
Support: $55,130, then $53,500
Resistance: $60,615, then $62,179
Daily trend strongly bearish. RSI(6) at 10.58 shows extreme oversold conditions; a relief bounce is possible.
Bias: Bearish until BTC reclaims $62,179.
#CanBTCReboundAfterFallingBelow60K?
Price: $59,115
24H low: $55,130
RSI(6): 10.58 — extremely oversold
Trend: Strong bearish
Support: $55,130, then $53,500
Resistance: $60,615, then $62,179
Daily trend strongly bearish. RSI(6) at 10.58 shows extreme oversold conditions; a relief bounce is possible.
Bias: Bearish until BTC reclaims $62,179.
#CanBTCReboundAfterFallingBelow60K?
41
Übersetzung ansehen
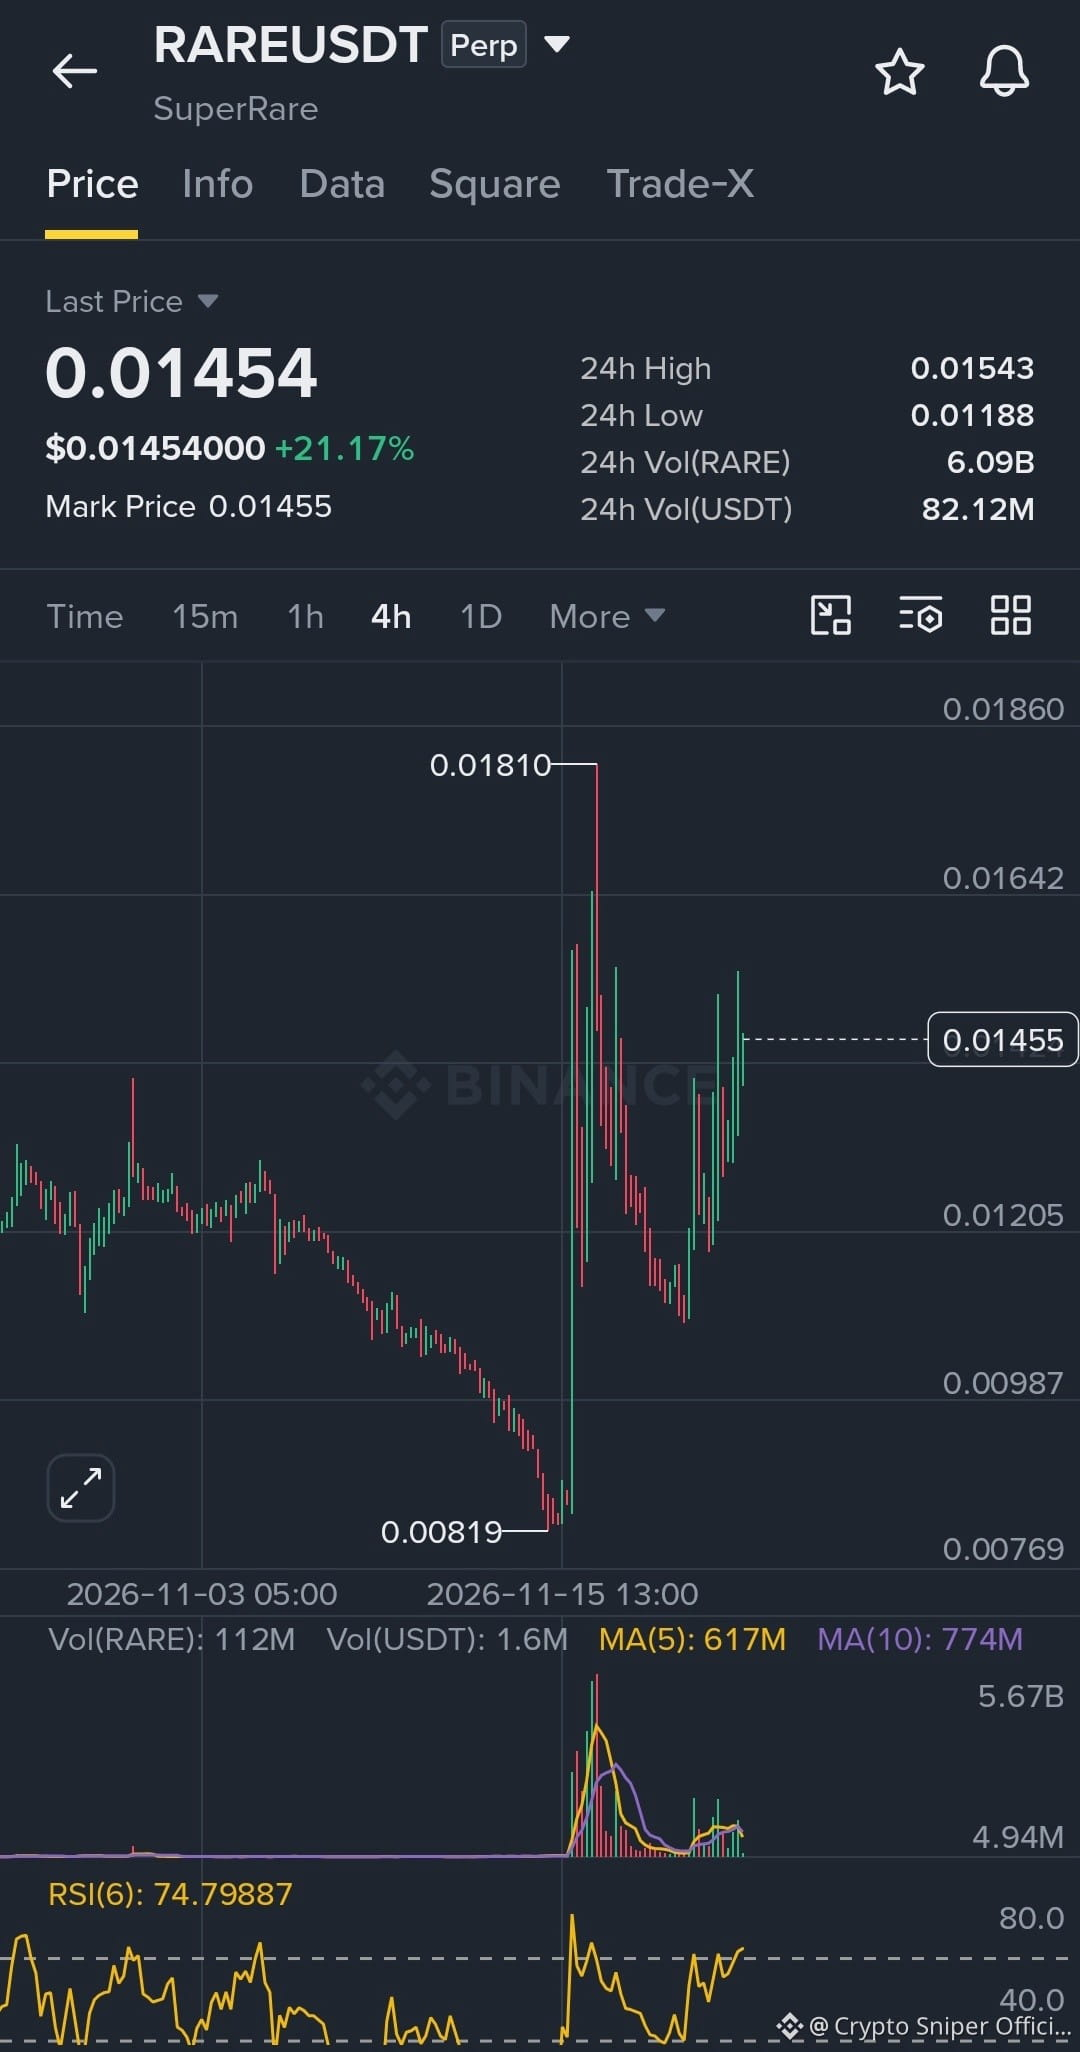
🚀 $RARE / USDT — LONG SETUP
⏱️ 4H Chart | Perpetual
🟢 Entry Zone: 0.01350 – 0.01400
🎯 TP1: 0.01540 🎯 TP2: 0.01640 🎯 TP3: 0.01810
🛑 SL: 0.01250
RARE is showing strong bullish recovery with increasing momentum. RSI(6) at 74.79 indicates overbought conditions. Wait for a pullback before entering. Don't chase the pump!
🚀 $RARE / USDT — LONG SETUP
⏱️ 4H Chart | Perpetual
🟢 Entry Zone: 0.01350 – 0.01400
🎯 TP1: 0.01540 🎯 TP2: 0.01640 🎯 TP3: 0.01810
🛑 SL: 0.01250
RARE is showing strong bullish recovery with increasing momentum. RSI(6) at 74.79 indicates overbought conditions. Wait for a pullback before entering. Don't chase the pump!
⏱️ 4H Chart | Perpetual
🟢 Entry Zone: 0.01350 – 0.01400
🎯 TP1: 0.01540 🎯 TP2: 0.01640 🎯 TP3: 0.01810
🛑 SL: 0.01250
RARE is showing strong bullish recovery with increasing momentum. RSI(6) at 74.79 indicates overbought conditions. Wait for a pullback before entering. Don't chase the pump!
32
Übersetzung ansehen
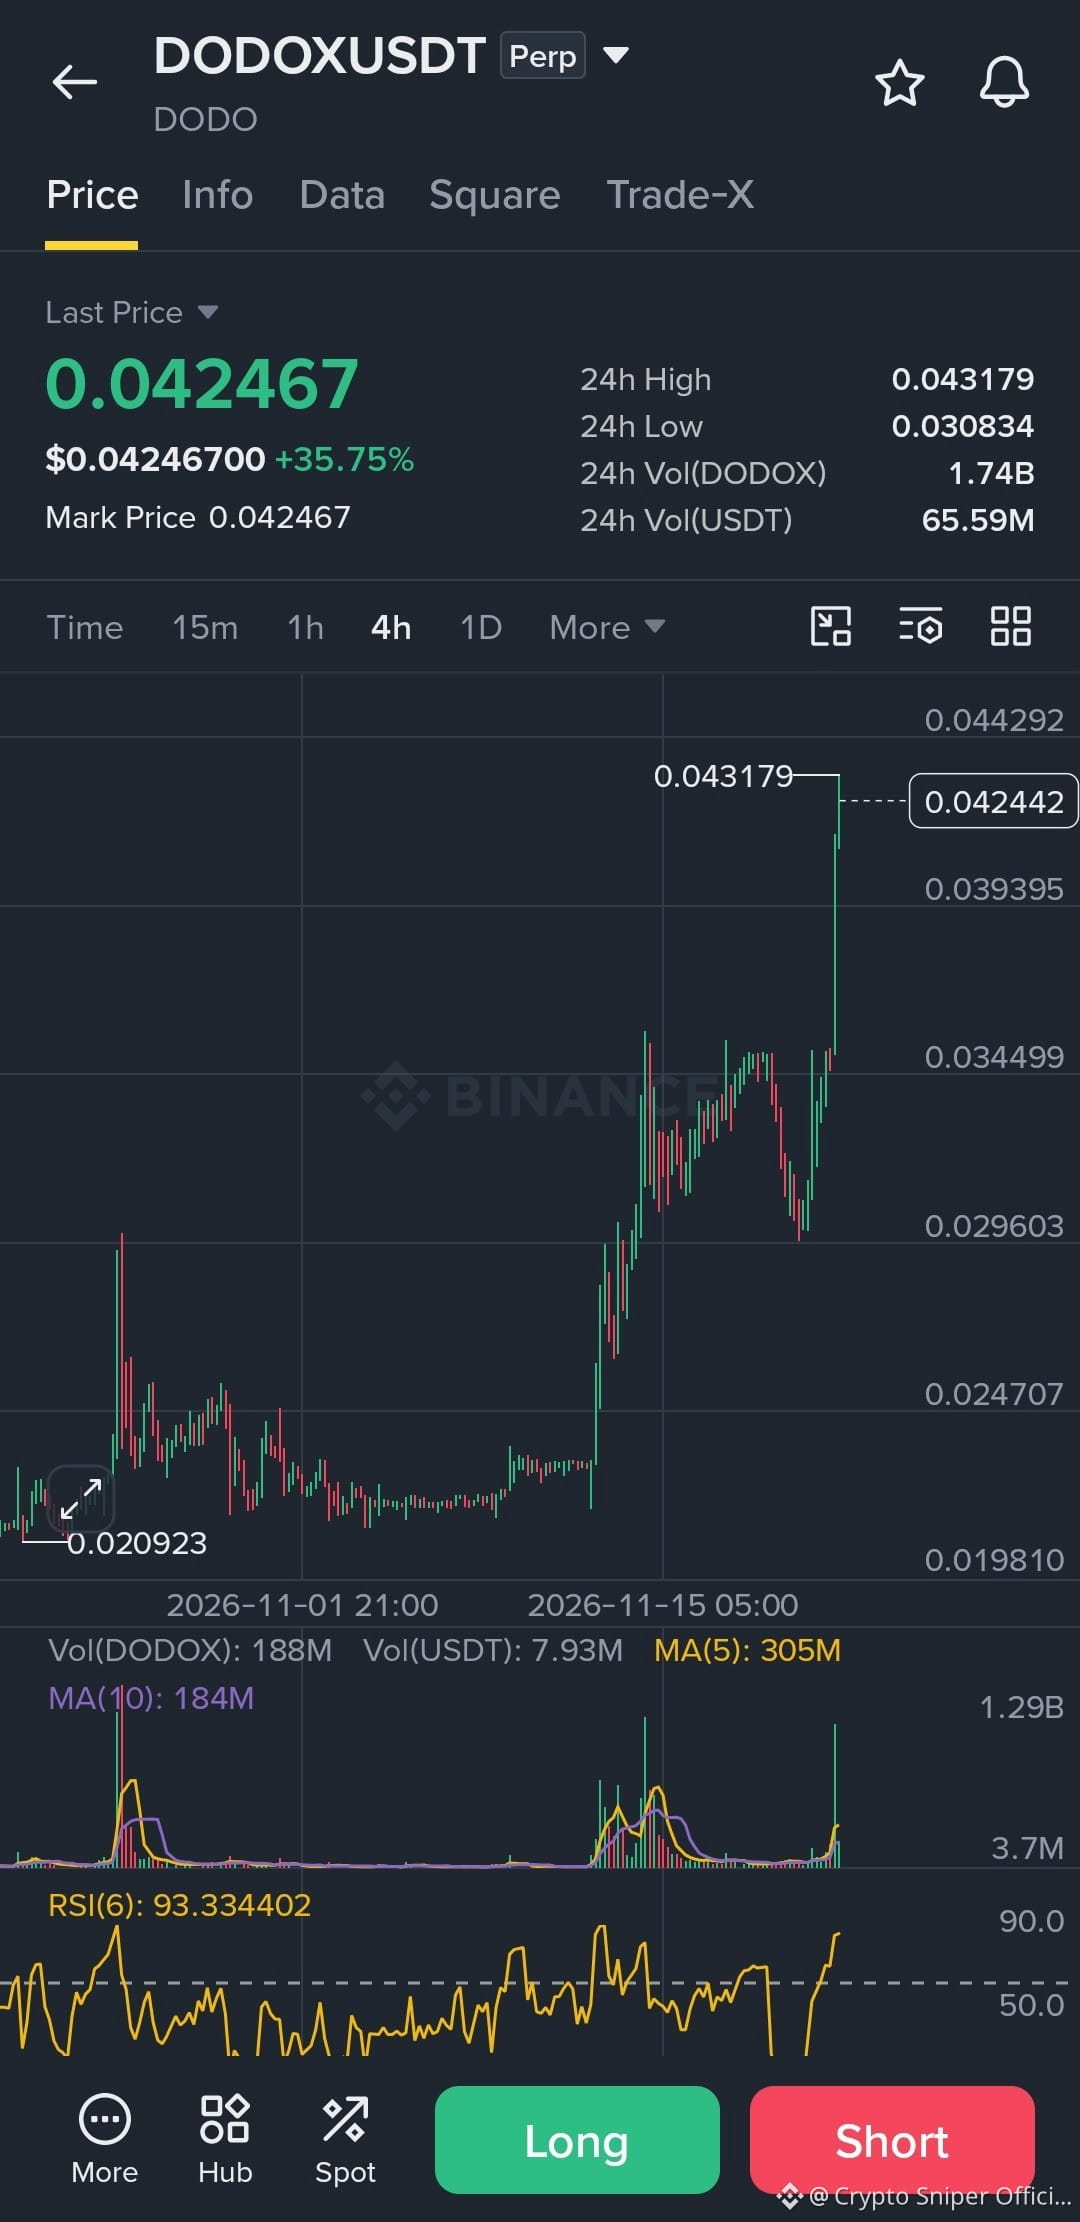
🚀 $DODOX / USDT — LONG SETUP
⏱️ 4H Chart | Perpetual
🟢 Entry Zone: 0.0385 – 0.0400
🎯 TP1: 0.0432 🎯 TP2: 0.0460 🎯 TP3: 0.0490
🛑 SL: 0.0360
DODOX is showing explosive bullish momentum with a strong volume breakout. RSI(6) at 93 indicates extreme overbought conditions. Wait for a pullback and confirmation. Don't chase the pump!
🚀 $DODOX / USDT — LONG SETUP
⏱️ 4H Chart | Perpetual
🟢 Entry Zone: 0.0385 – 0.0400
🎯 TP1: 0.0432 🎯 TP2: 0.0460 🎯 TP3: 0.0490
🛑 SL: 0.0360
DODOX is showing explosive bullish momentum with a strong volume breakout. RSI(6) at 93 indicates extreme overbought conditions. Wait for a pullback and confirmation. Don't chase the pump!
⏱️ 4H Chart | Perpetual
🟢 Entry Zone: 0.0385 – 0.0400
🎯 TP1: 0.0432 🎯 TP2: 0.0460 🎯 TP3: 0.0490
🛑 SL: 0.0360
DODOX is showing explosive bullish momentum with a strong volume breakout. RSI(6) at 93 indicates extreme overbought conditions. Wait for a pullback and confirmation. Don't chase the pump!
54
Übersetzung ansehen
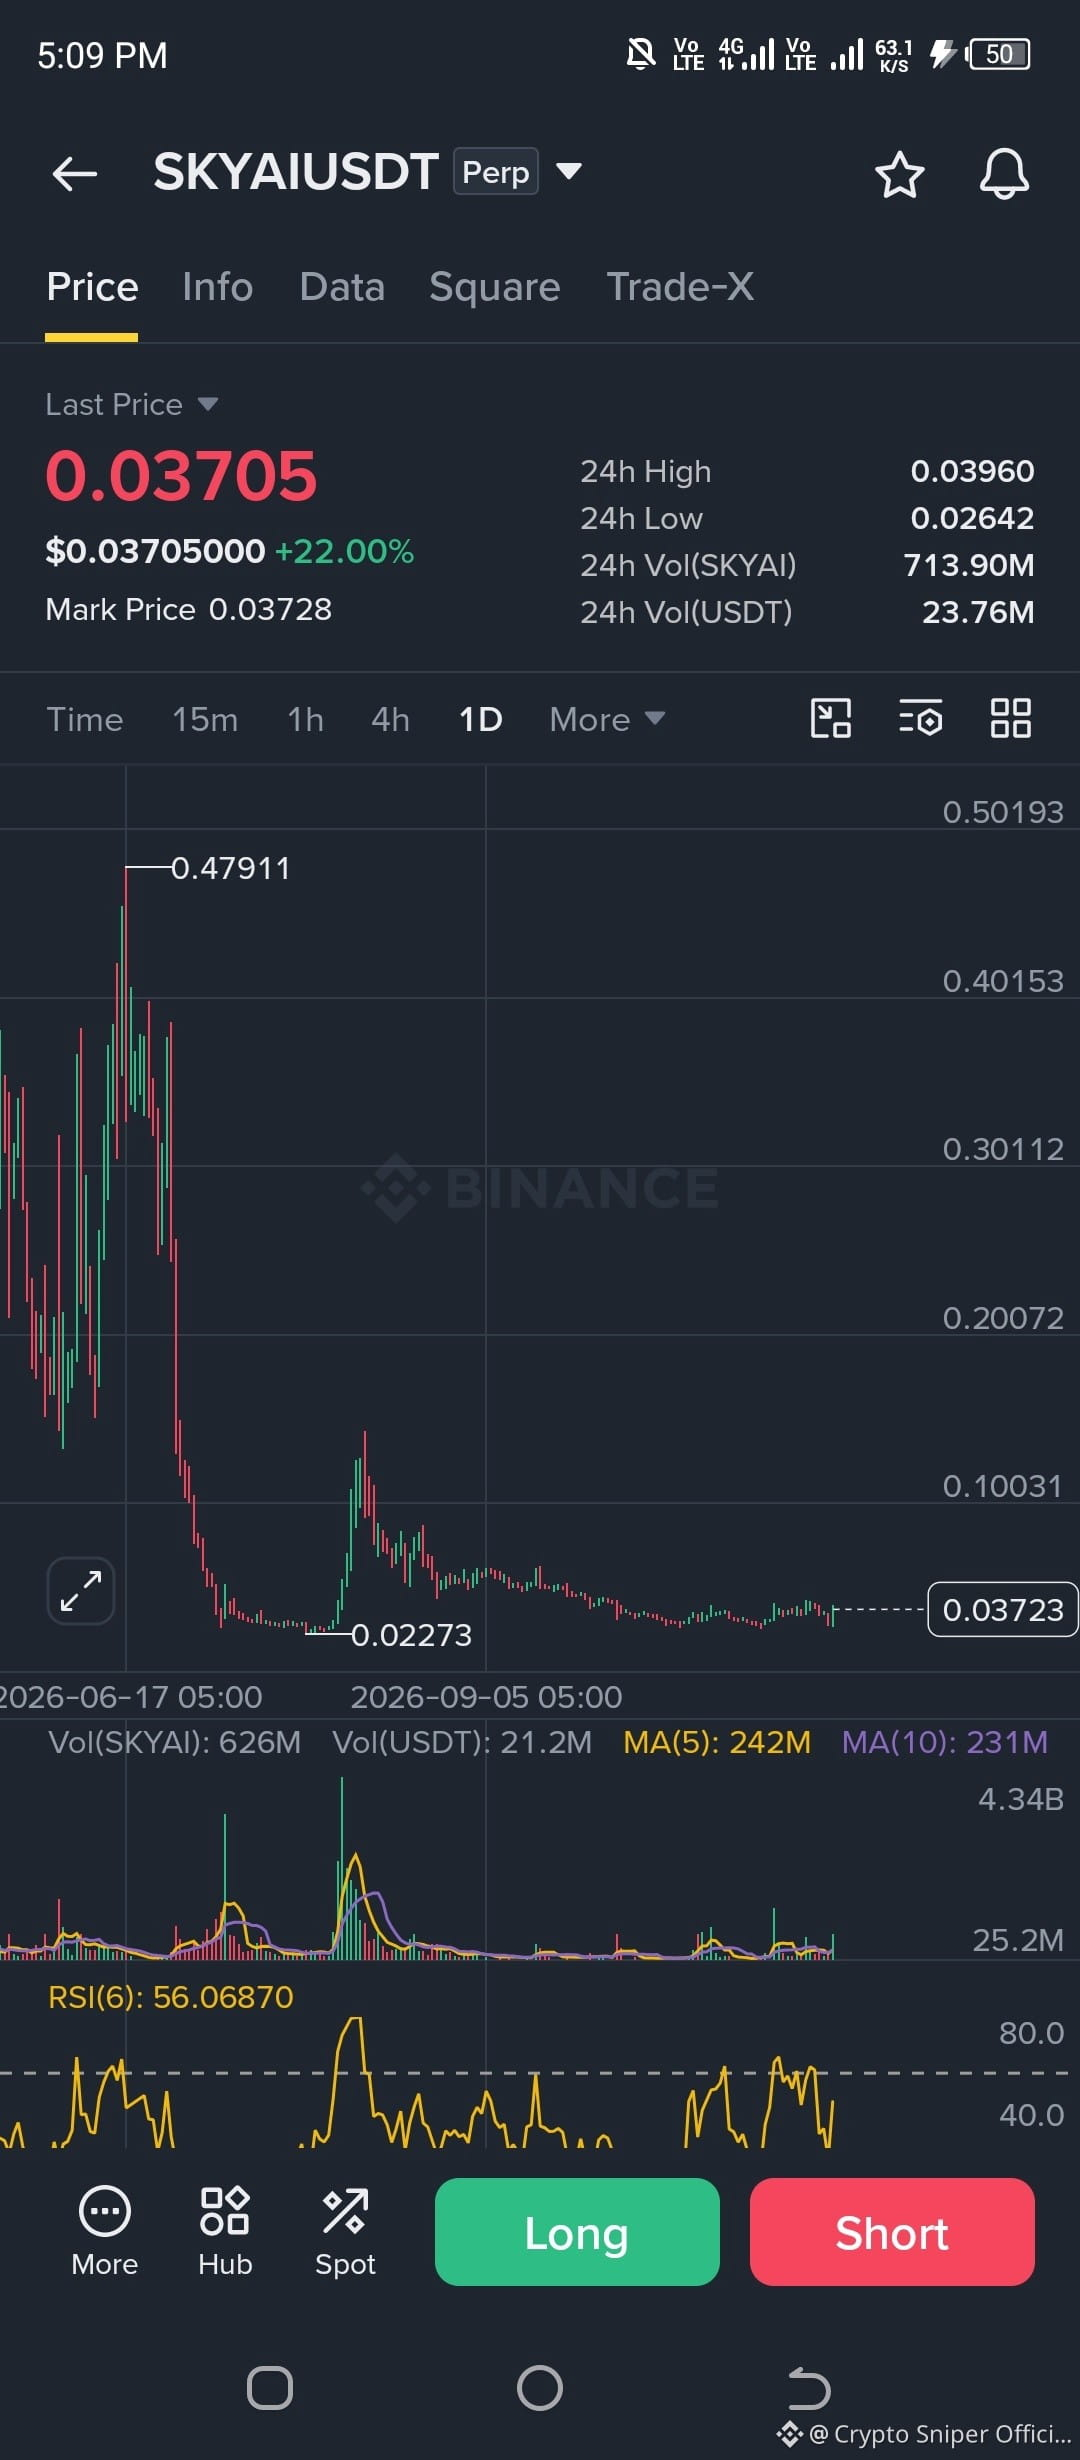
🚀 $SKYAI / USDT — LONG SETUP
⏱️ 1D Chart | Perpetual
🟢 Entry Zone: 0.0340 – 0.0360
🎯 TP1: 0.03960 🎯 TP2: 0.04500 🎯 TP3: 0.05200
🛑 SL: 0.03100
SKYAI is showing signs of recovery with improving momentum. RSI(6) at 56 suggests room for further upside. Watch for a breakout above 0.0396!
🚀 $SKYAI / USDT — LONG SETUP
⏱️ 1D Chart | Perpetual
🟢 Entry Zone: 0.0340 – 0.0360
🎯 TP1: 0.03960 🎯 TP2: 0.04500 🎯 TP3: 0.05200
🛑 SL: 0.03100
SKYAI is showing signs of recovery with improving momentum. RSI(6) at 56 suggests room for further upside. Watch for a breakout above 0.0396!
⏱️ 1D Chart | Perpetual
🟢 Entry Zone: 0.0340 – 0.0360
🎯 TP1: 0.03960 🎯 TP2: 0.04500 🎯 TP3: 0.05200
🛑 SL: 0.03100
SKYAI is showing signs of recovery with improving momentum. RSI(6) at 56 suggests room for further upside. Watch for a breakout above 0.0396!
134
Übersetzung ansehen
📉 CRYPTO PRICES: 2021 vs 2026 (November)
$BTC : $59,700 → $59,000
$ETH : $4,410 → $1,620
$BNB : $605 → $540
$SOL : $220 → $69
$XRP : $1.10 → $0.9
0
while others are significantly lower.
5 YEARS LATER… ARE WE STILL IN THE SAME CYCLE? 👀
📉 CRYPTO PRICES: 2021 vs 2026 (November)
$BTC : $59,700 → $59,000
$ETH : $4,410 → $1,620
$BNB : $605 → $540
$SOL : $220 → $69
$XRP : $1.10 → $0.9
0
while others are significantly lower.
5 YEARS LATER… ARE WE STILL IN THE SAME CYCLE? 👀
$BTC : $59,700 → $59,000
$ETH : $4,410 → $1,620
$BNB : $605 → $540
$SOL : $220 → $69
$XRP : $1.10 → $0.9
0
while others are significantly lower.
5 YEARS LATER… ARE WE STILL IN THE SAME CYCLE? 👀

58
Übersetzung ansehen
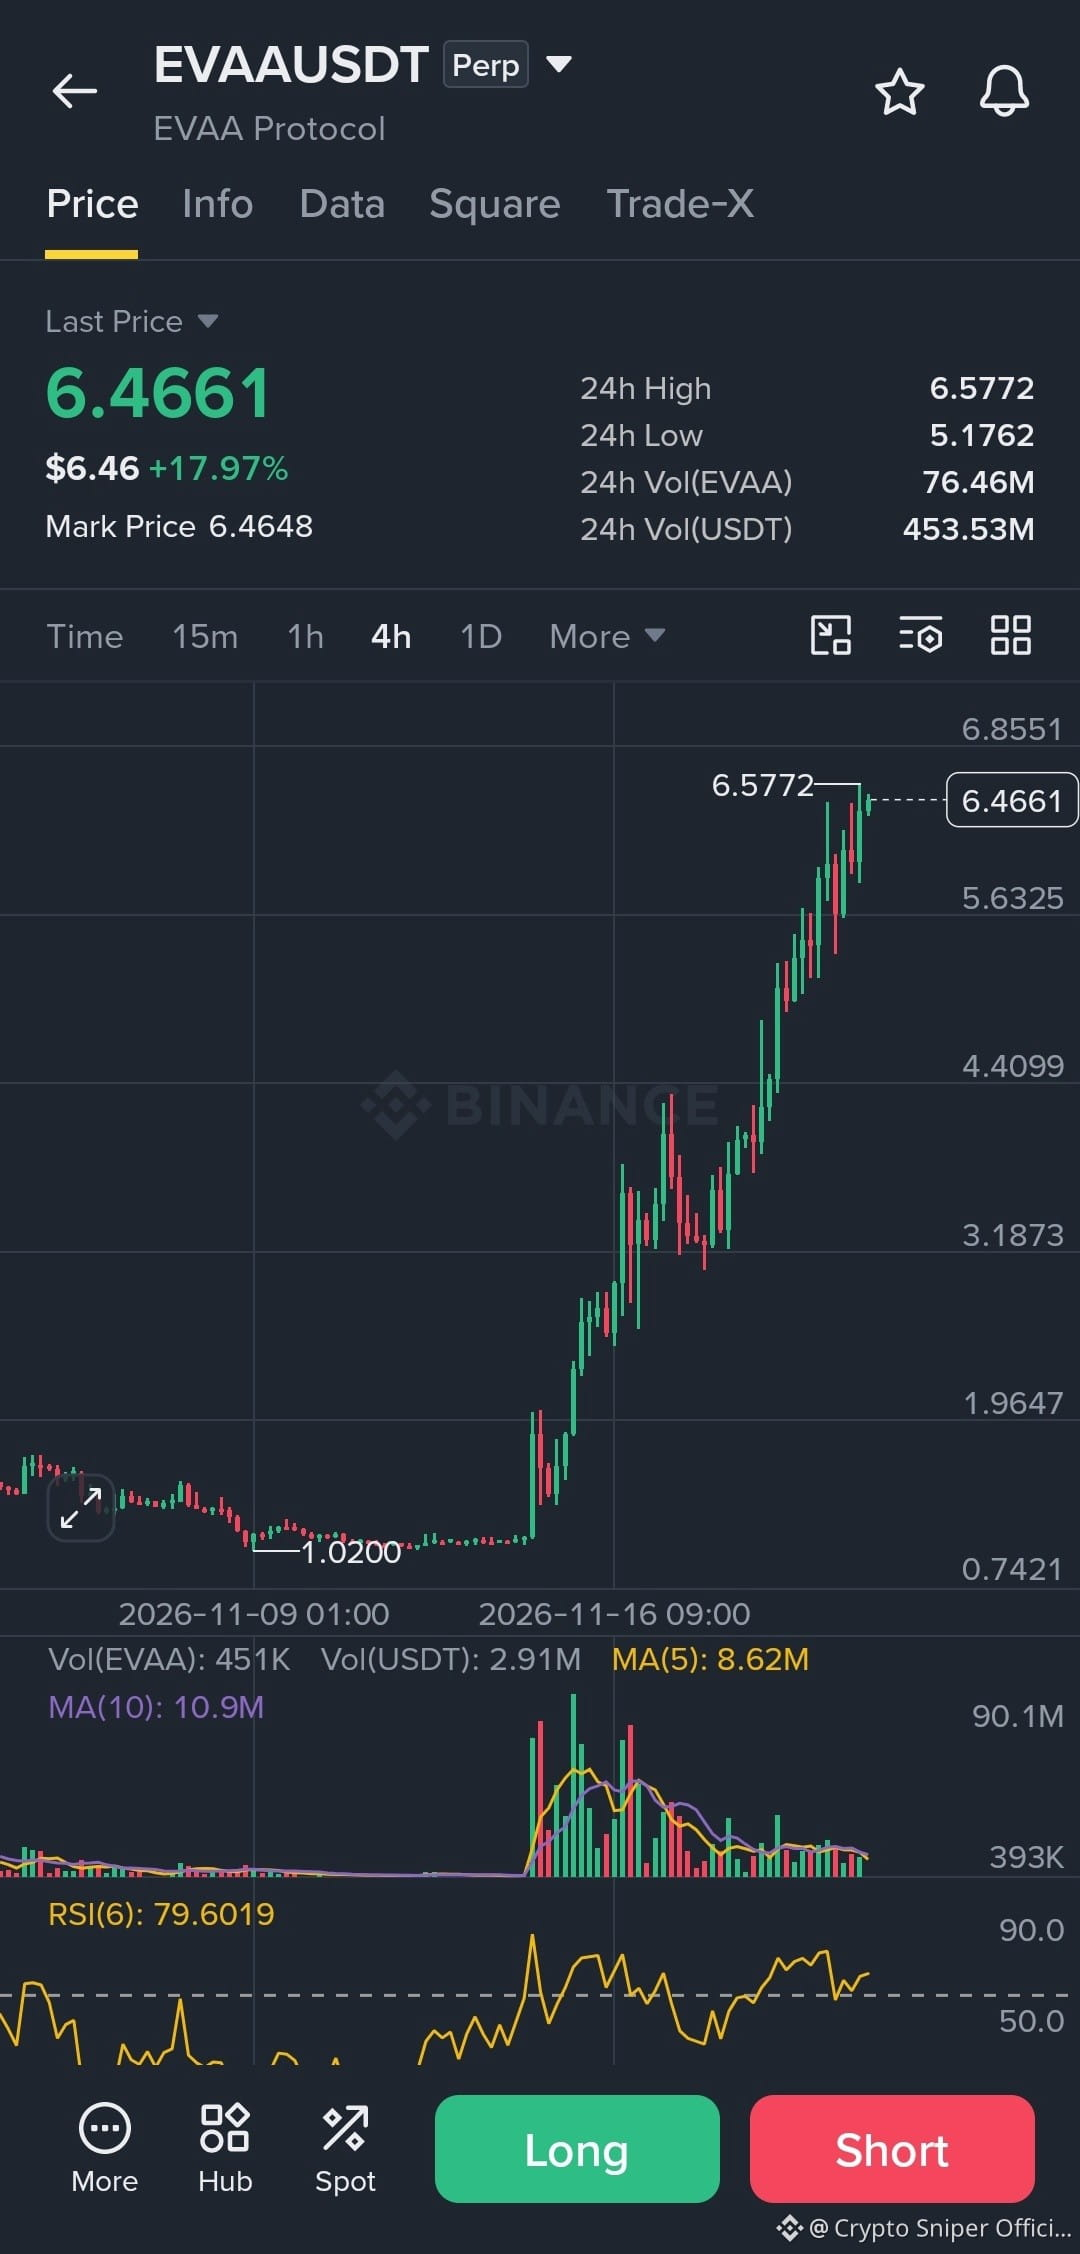
$EVAA LONG All TPs Done ✅
Follow For More Content ❤
$EVAA LONG All TPs Done ✅
Follow For More Content ❤
Follow For More Content ❤
Crypto Sniper Official
·
--
🚀 $EVAA / USDT — LONG SETUP
⏱️ 4H Chart | Perpetual
🟢 Entry Zone: 4.90 – 5.15 (after confirmation)
🎯 TP1: 5.775 🎯 TP2: 6.040 🎯 TP3: 6.500
🛑 SL: 4.65
EVAA is showing strong bullish momentum after a massive breakout. RSI(6) is at 85.42, so avoid chasing the pump. Wait for a healthy pullback before entering.
⏱️ 4H Chart | Perpetual
🟢 Entry Zone: 4.90 – 5.15 (after confirmation)
🎯 TP1: 5.775 🎯 TP2: 6.040 🎯 TP3: 6.500
🛑 SL: 4.65
EVAA is showing strong bullish momentum after a massive breakout. RSI(6) is at 85.42, so avoid chasing the pump. Wait for a healthy pullback before entering.
360
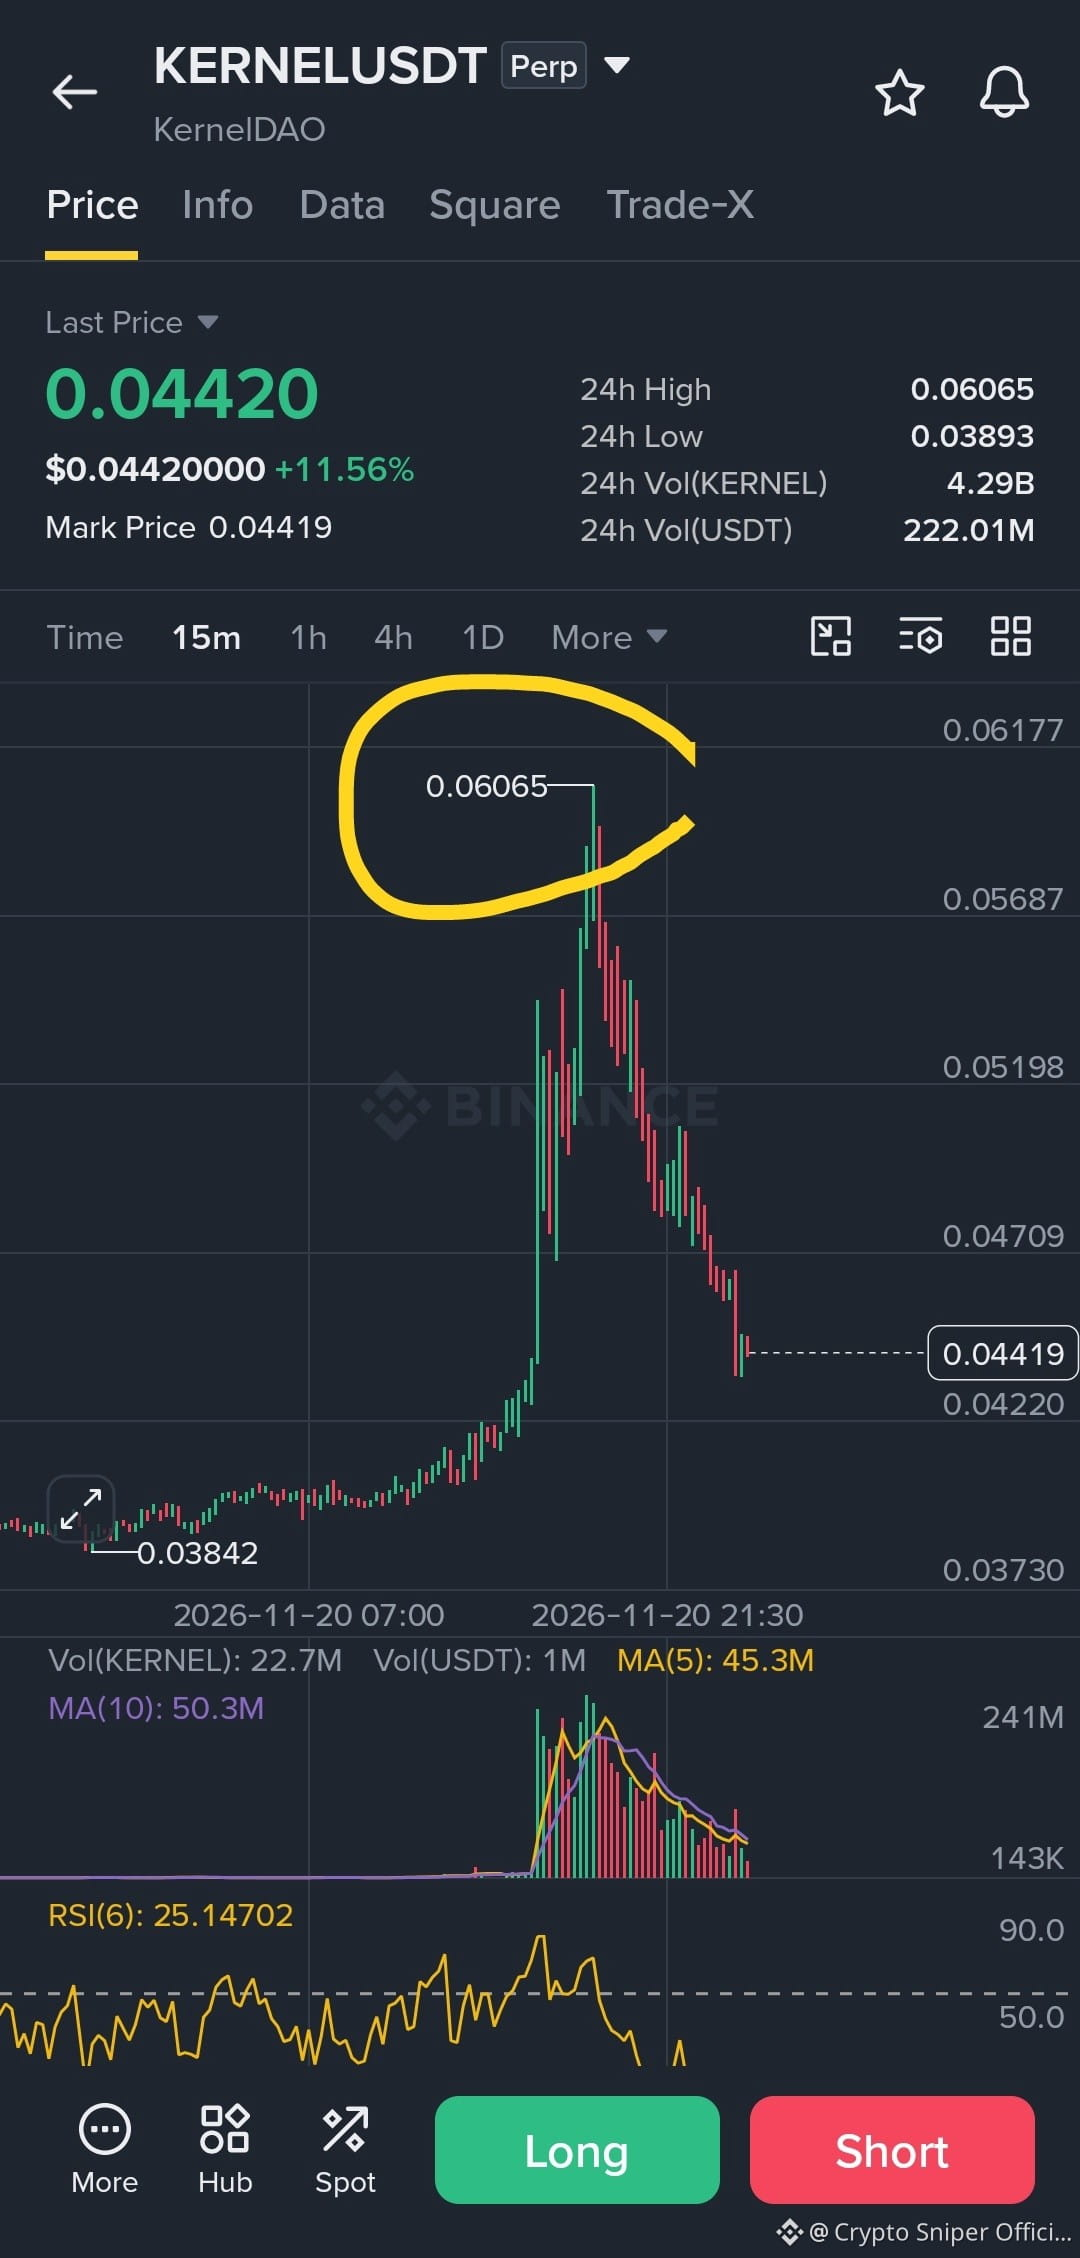
$KERNEL Alle TP3 erledigt ✅
Herzlichen Glückwunsch ❤
$KERNEL Alle TP3 erledigt ✅
Herzlichen Glückwunsch ❤
Herzlichen Glückwunsch ❤
Crypto Sniper Official
·
--
$KERNEL 🚀 USDT — LONG-SETUP
⏱️ 4H-Chart | Perpetual
🟢 Einstiegszone: 0.0455 – 0.0475 (nach Bestätigung)
🎯 TP1: 0.0544 🎯 TP2: 0.0588 🎯 TP3: 0.0620
🛑 SL: 0.0420
KERNEL zeigt eine massive Aufwärtsdynamik mit einem Volumenausbruch. Ein RSI(6) von 95 deutet auf extrem überkaufte Bedingungen hin. Warte vor dem Einstieg auf einen Rücksetzer. Jage dem Pump nicht hinterher!
⏱️ 4H-Chart | Perpetual
🟢 Einstiegszone: 0.0455 – 0.0475 (nach Bestätigung)
🎯 TP1: 0.0544 🎯 TP2: 0.0588 🎯 TP3: 0.0620
🛑 SL: 0.0420
KERNEL zeigt eine massive Aufwärtsdynamik mit einem Volumenausbruch. Ein RSI(6) von 95 deutet auf extrem überkaufte Bedingungen hin. Warte vor dem Einstieg auf einen Rücksetzer. Jage dem Pump nicht hinterher!
150
Übersetzung ansehen
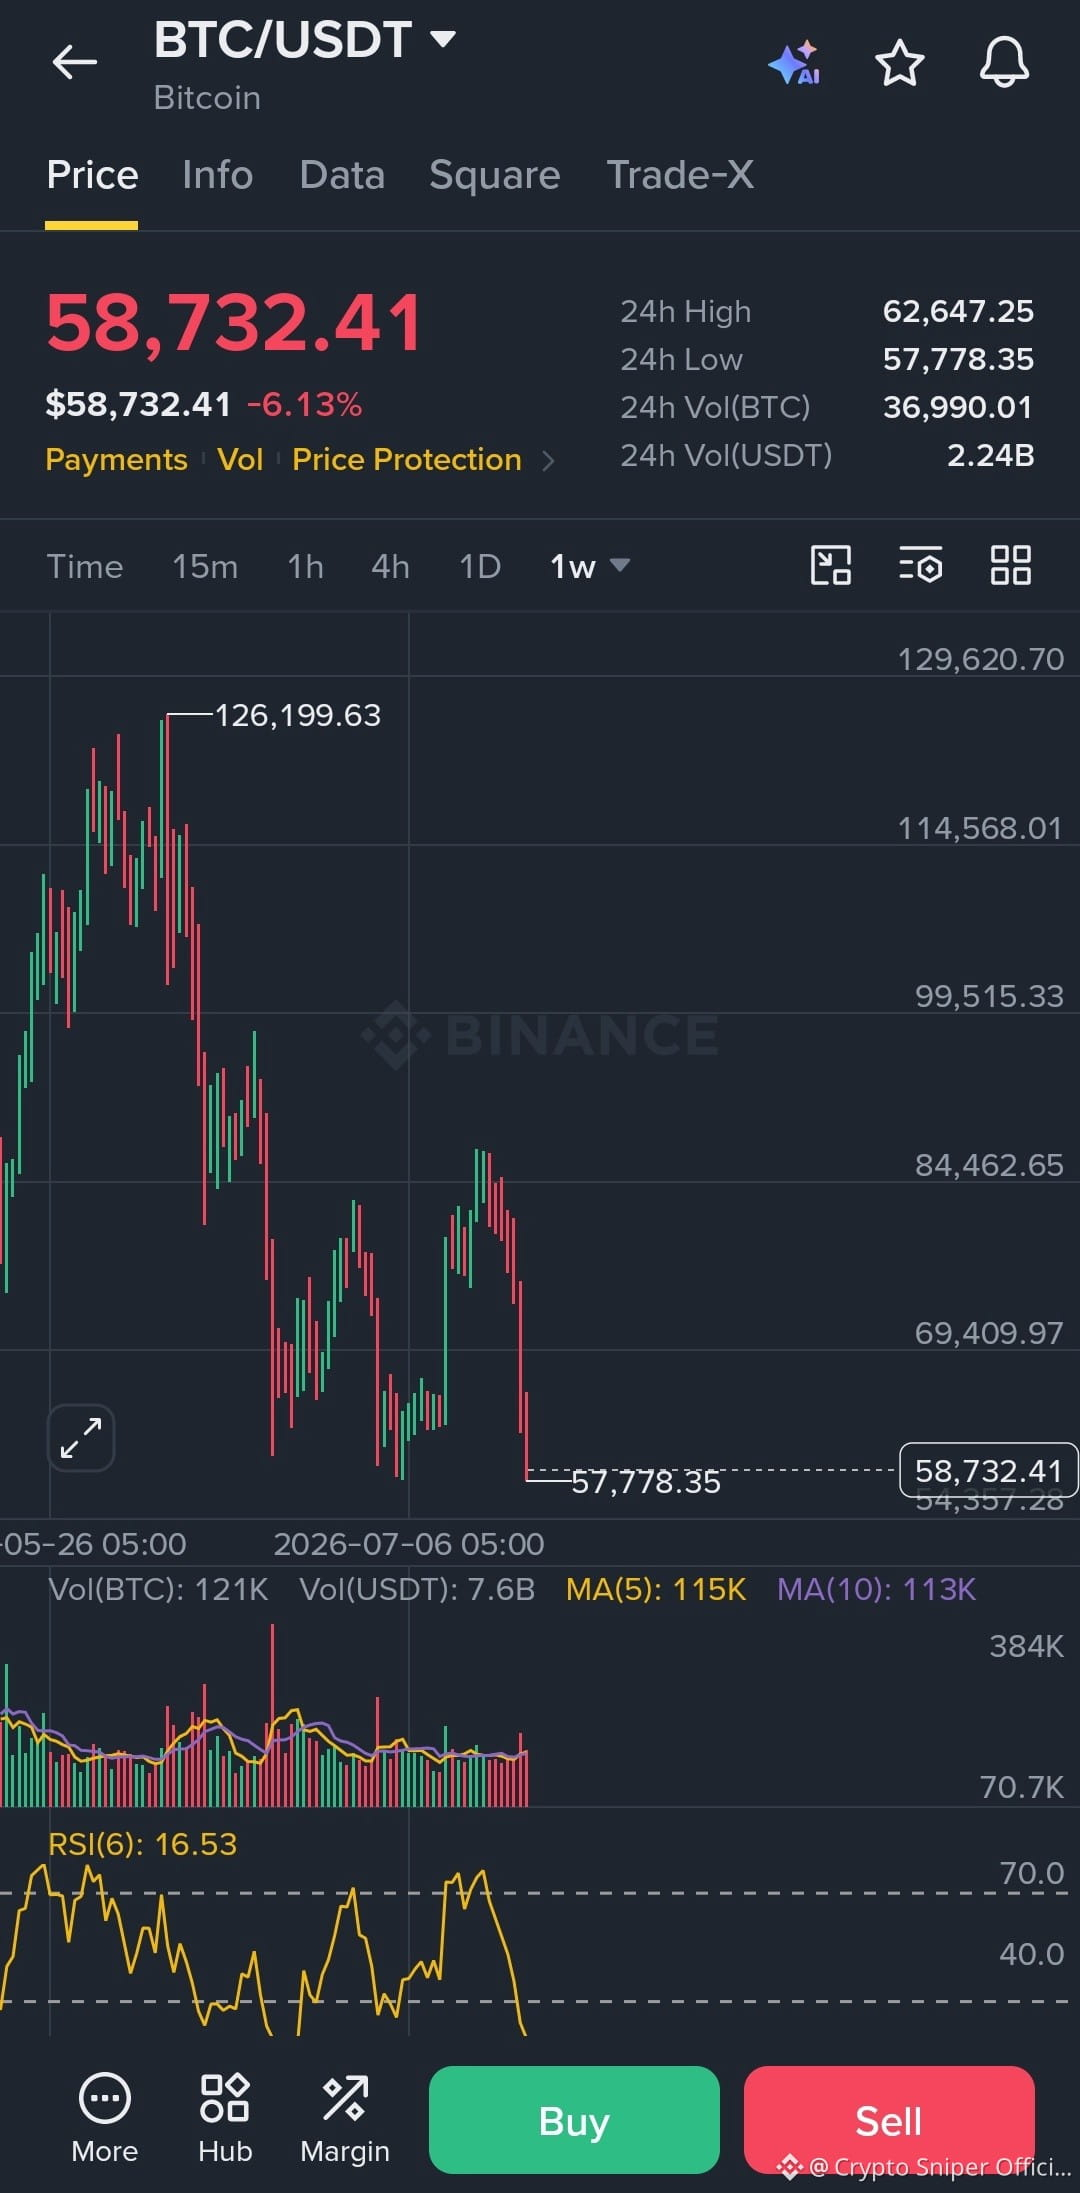
🚨 BITCOIN FLASH CRASH!
$BTC has plunged to $57,778 — its lowest level in over 2 years!
📉 A new cycle low has been recorded.
IS THIS THE BOTTOM, OR IS MORE PAIN AHEAD? 🩸
🚨 BITCOIN FLASH CRASH!
$BTC has plunged to $57,778 — its lowest level in over 2 years!
📉 A new cycle low has been recorded.
IS THIS THE BOTTOM, OR IS MORE PAIN AHEAD? 🩸
$BTC has plunged to $57,778 — its lowest level in over 2 years!
📉 A new cycle low has been recorded.
IS THIS THE BOTTOM, OR IS MORE PAIN AHEAD? 🩸
90
Übersetzung ansehen
I've Told You 😭📉❗🔴
$BTC $ETH
I've Told You 😭📉❗🔴
$BTC $ETH
$BTC $ETH
Crypto Sniper Official
·
--
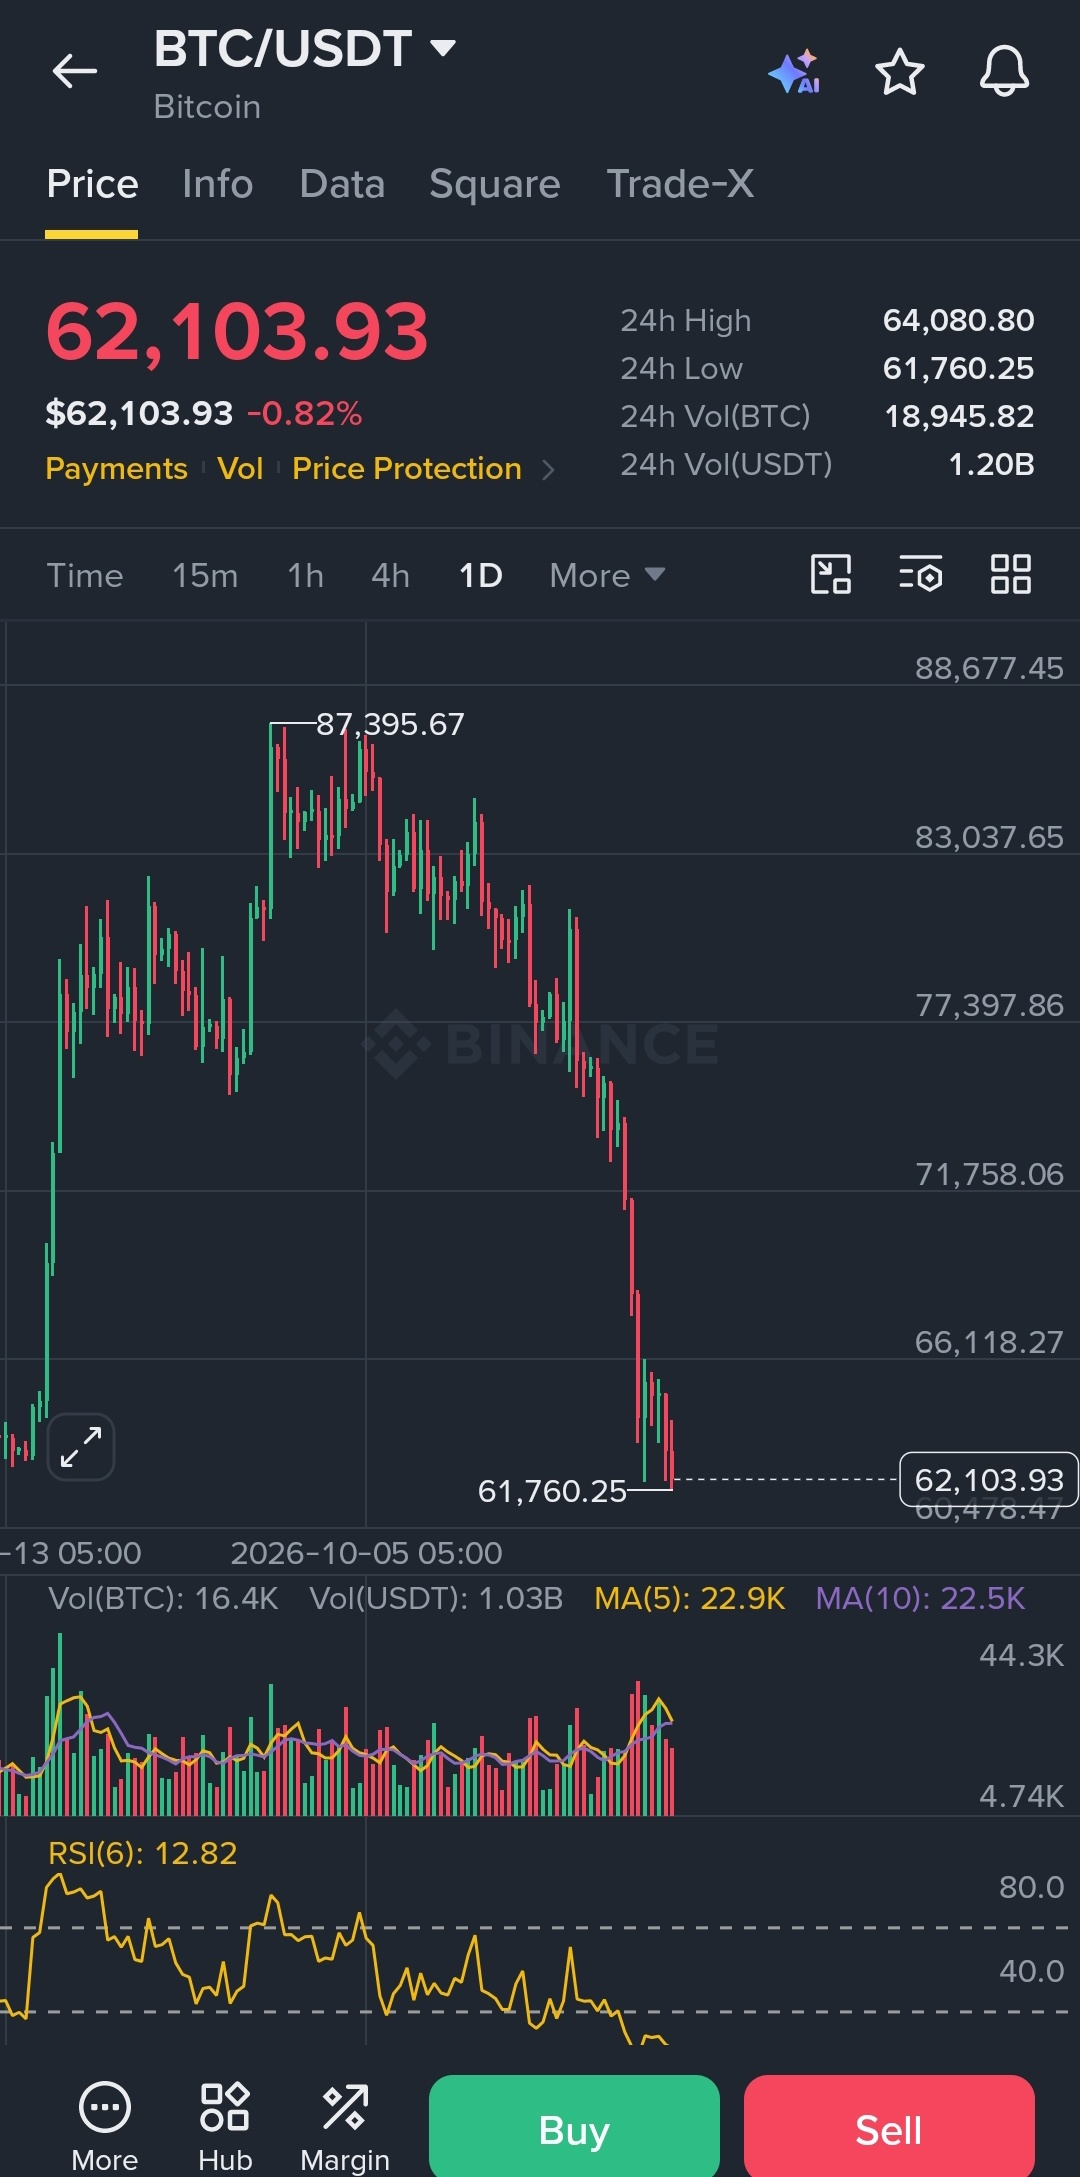
$BTC What The Fu*k 😰
Bitcoin Falls Under $62,000 📉
This Is Not Good Believe me
Bitcoin Falls Under $62,000 📉
This Is Not Good Believe me

20
Übersetzung ansehen
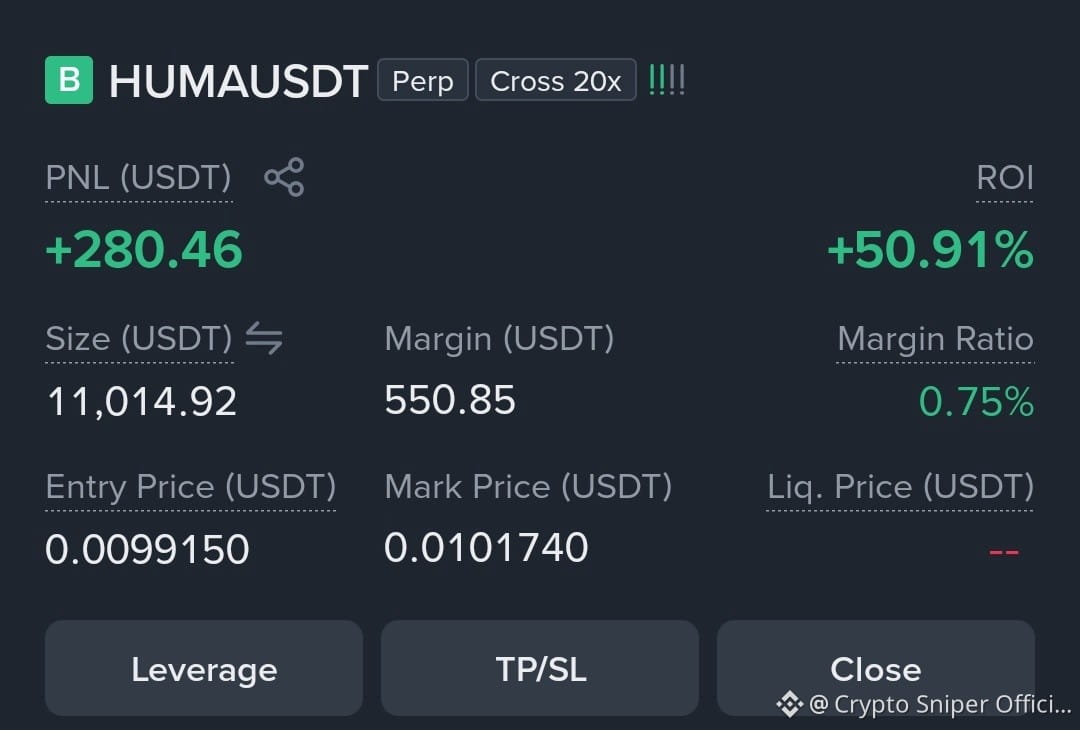
$HUMA Tight Your Seatbelt HUMA Is Ready To Fly ...
$HUMA Tight Your Seatbelt HUMA Is Ready To Fly ...
23
Übersetzung ansehen
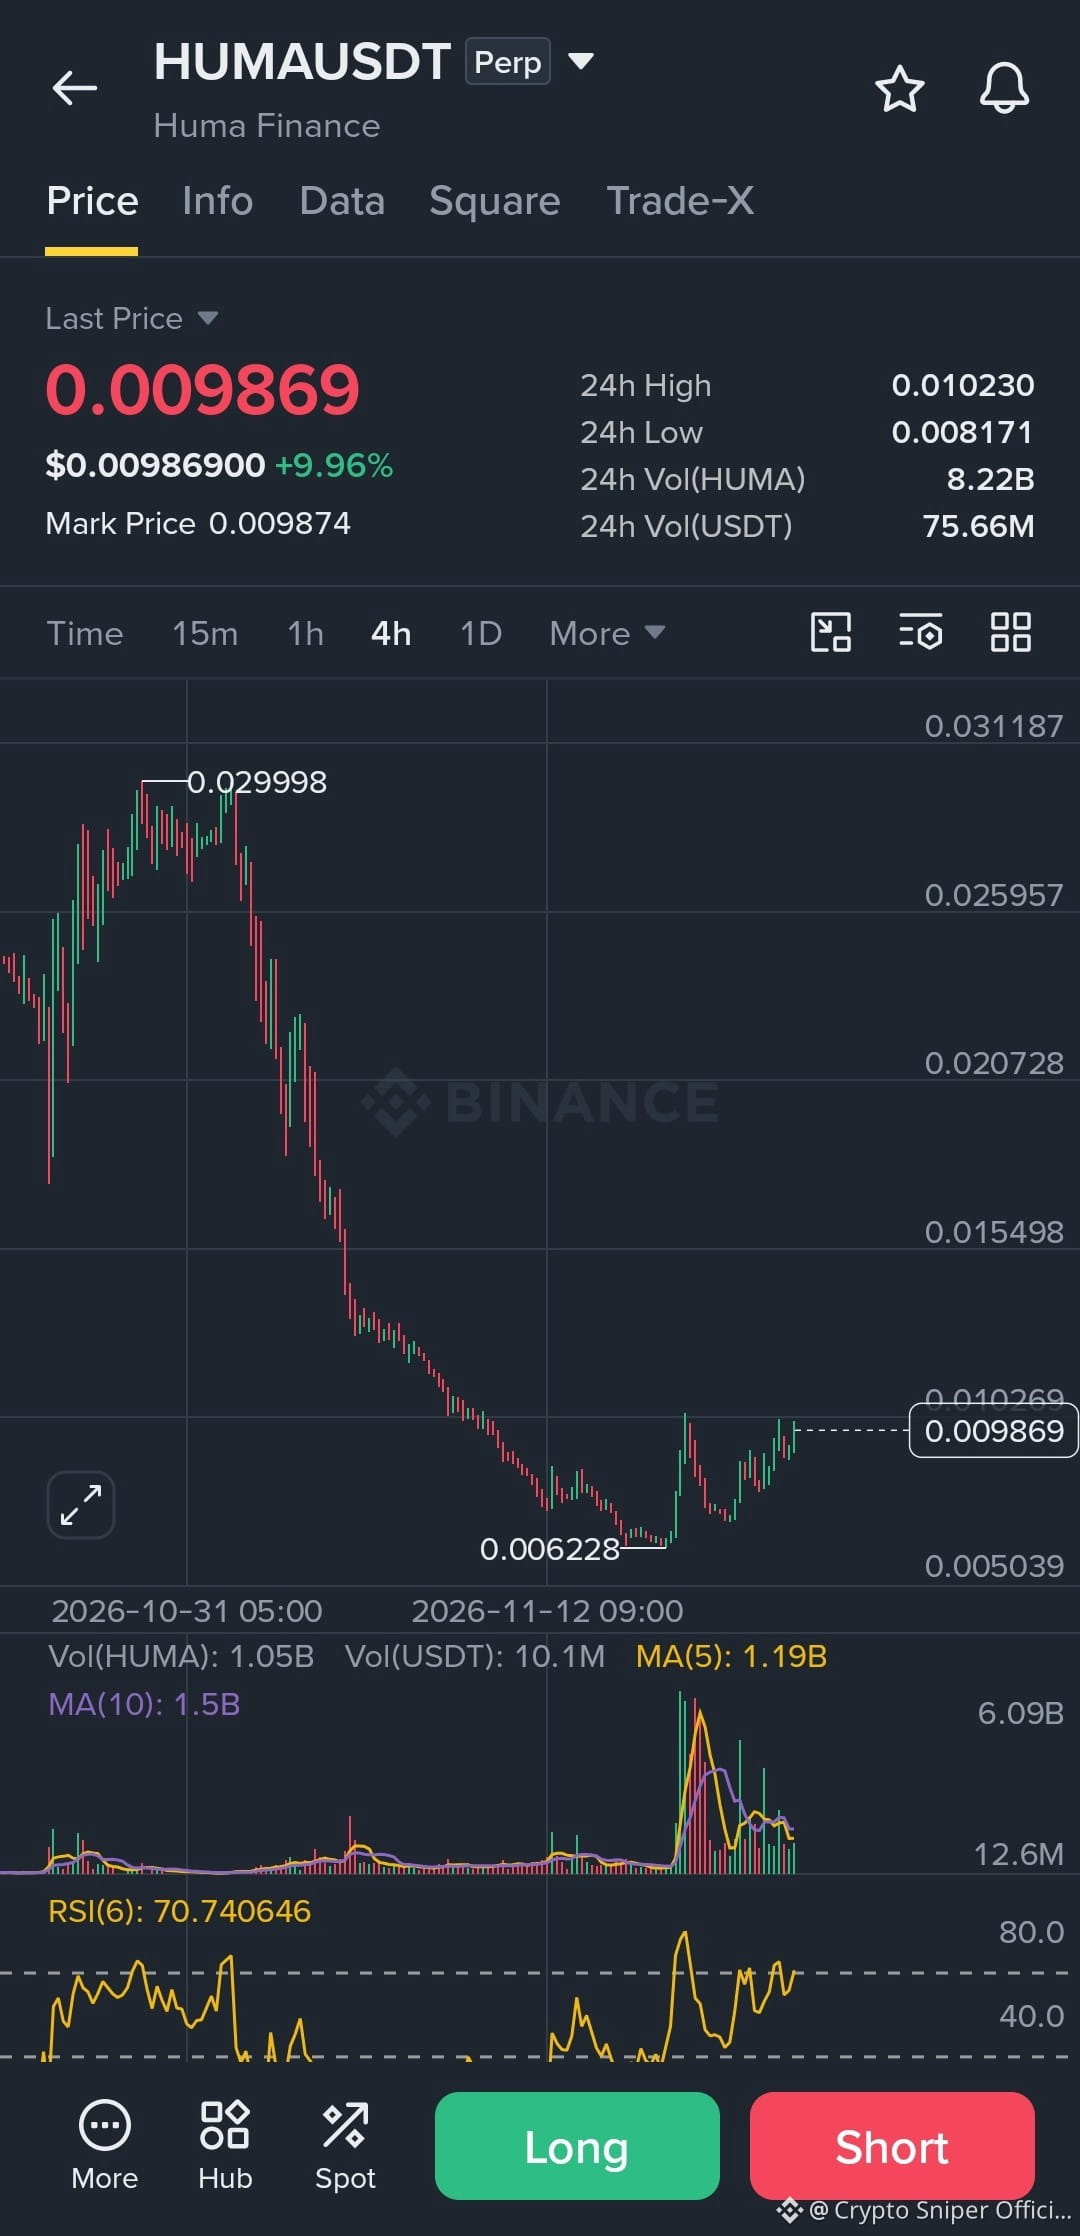
🚀 $HUMA / USDT — LONG SETUP
⏱️ 4H Chart | Perpetual
🟢 Entry Zone: 0.00930 – 0.00960 (after confirmation)
🎯 TP1: 0.01023 🎯 TP2: 0.01100 🎯 TP3: 0.01200
🛑 SL: 0.00870
HUMA is showing strong recovery momentum with increasing volume. RSI(6) is at 72, so wait for a healthy pullback before entering. Don't chase the pump!
$KERNEL $BLESS
🚀 $HUMA / USDT — LONG SETUP
⏱️ 4H Chart | Perpetual
🟢 Entry Zone: 0.00930 – 0.00960 (after confirmation)
🎯 TP1: 0.01023 🎯 TP2: 0.01100 🎯 TP3: 0.01200
🛑 SL: 0.00870
HUMA is showing strong recovery momentum with increasing volume. RSI(6) is at 72, so wait for a healthy pullback before entering. Don't chase the pump!
$KERNEL $BLESS
⏱️ 4H Chart | Perpetual
🟢 Entry Zone: 0.00930 – 0.00960 (after confirmation)
🎯 TP1: 0.01023 🎯 TP2: 0.01100 🎯 TP3: 0.01200
🛑 SL: 0.00870
HUMA is showing strong recovery momentum with increasing volume. RSI(6) is at 72, so wait for a healthy pullback before entering. Don't chase the pump!
$KERNEL $BLESS
33
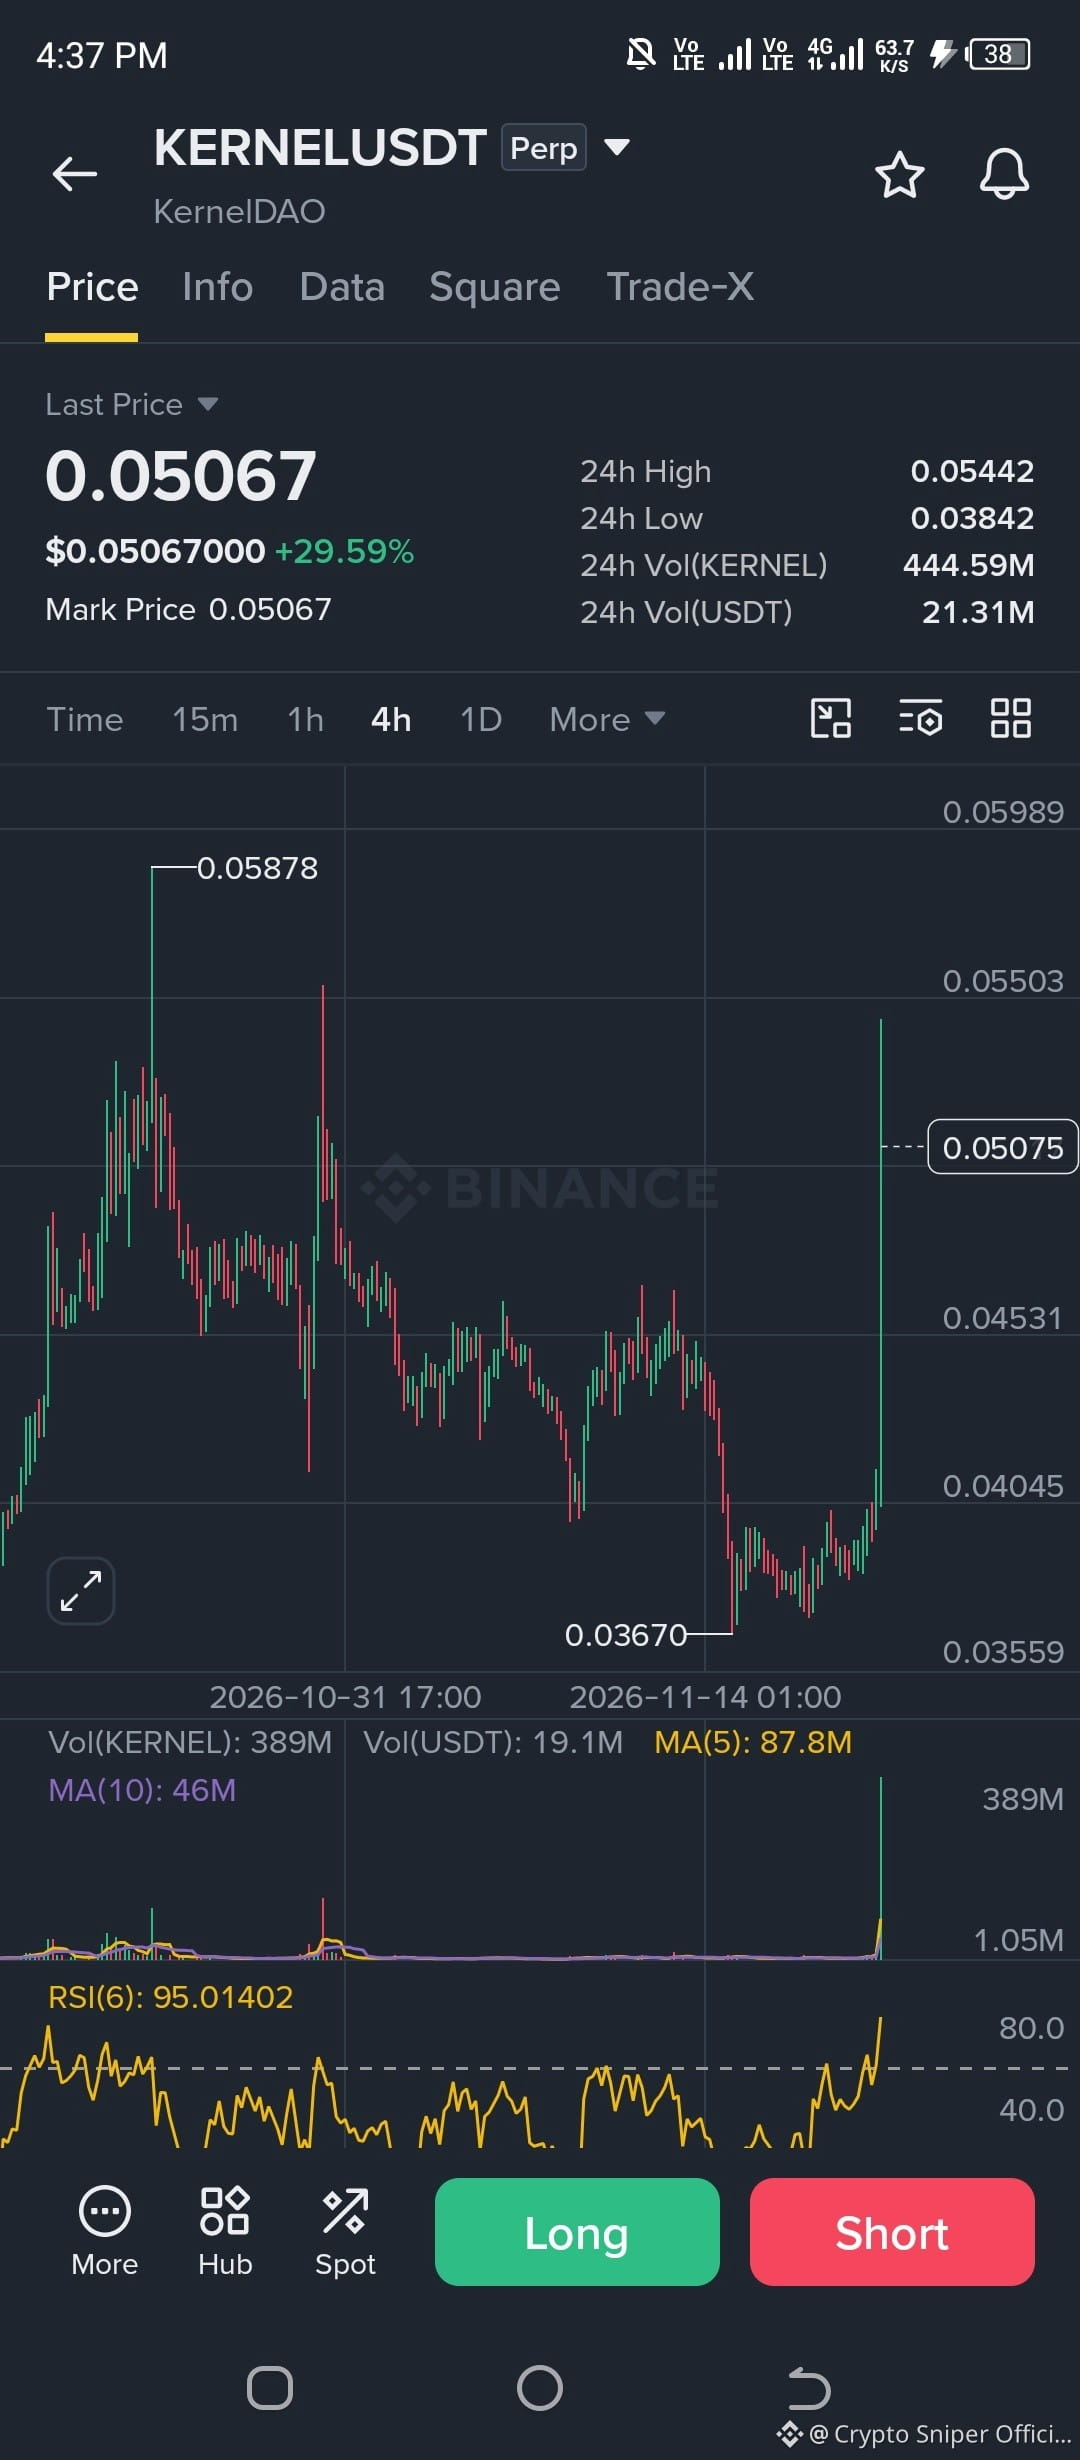
$KERNEL 🚀 USDT — LONG-SETUP
⏱️ 4H-Chart | Perpetual
🟢 Einstiegszone: 0.0455 – 0.0475 (nach Bestätigung)
🎯 TP1: 0.0544 🎯 TP2: 0.0588 🎯 TP3: 0.0620
🛑 SL: 0.0420
KERNEL zeigt eine massive Aufwärtsdynamik mit einem Volumenausbruch. Ein RSI(6) von 95 deutet auf extrem überkaufte Bedingungen hin. Warte vor dem Einstieg auf einen Rücksetzer. Jage dem Pump nicht hinterher!
$KERNEL 🚀 USDT — LONG-SETUP
⏱️ 4H-Chart | Perpetual
🟢 Einstiegszone: 0.0455 – 0.0475 (nach Bestätigung)
🎯 TP1: 0.0544 🎯 TP2: 0.0588 🎯 TP3: 0.0620
🛑 SL: 0.0420
KERNEL zeigt eine massive Aufwärtsdynamik mit einem Volumenausbruch. Ein RSI(6) von 95 deutet auf extrem überkaufte Bedingungen hin. Warte vor dem Einstieg auf einen Rücksetzer. Jage dem Pump nicht hinterher!
⏱️ 4H-Chart | Perpetual
🟢 Einstiegszone: 0.0455 – 0.0475 (nach Bestätigung)
🎯 TP1: 0.0544 🎯 TP2: 0.0588 🎯 TP3: 0.0620
🛑 SL: 0.0420
KERNEL zeigt eine massive Aufwärtsdynamik mit einem Volumenausbruch. Ein RSI(6) von 95 deutet auf extrem überkaufte Bedingungen hin. Warte vor dem Einstieg auf einen Rücksetzer. Jage dem Pump nicht hinterher!
1
1
128
Übersetzung ansehen
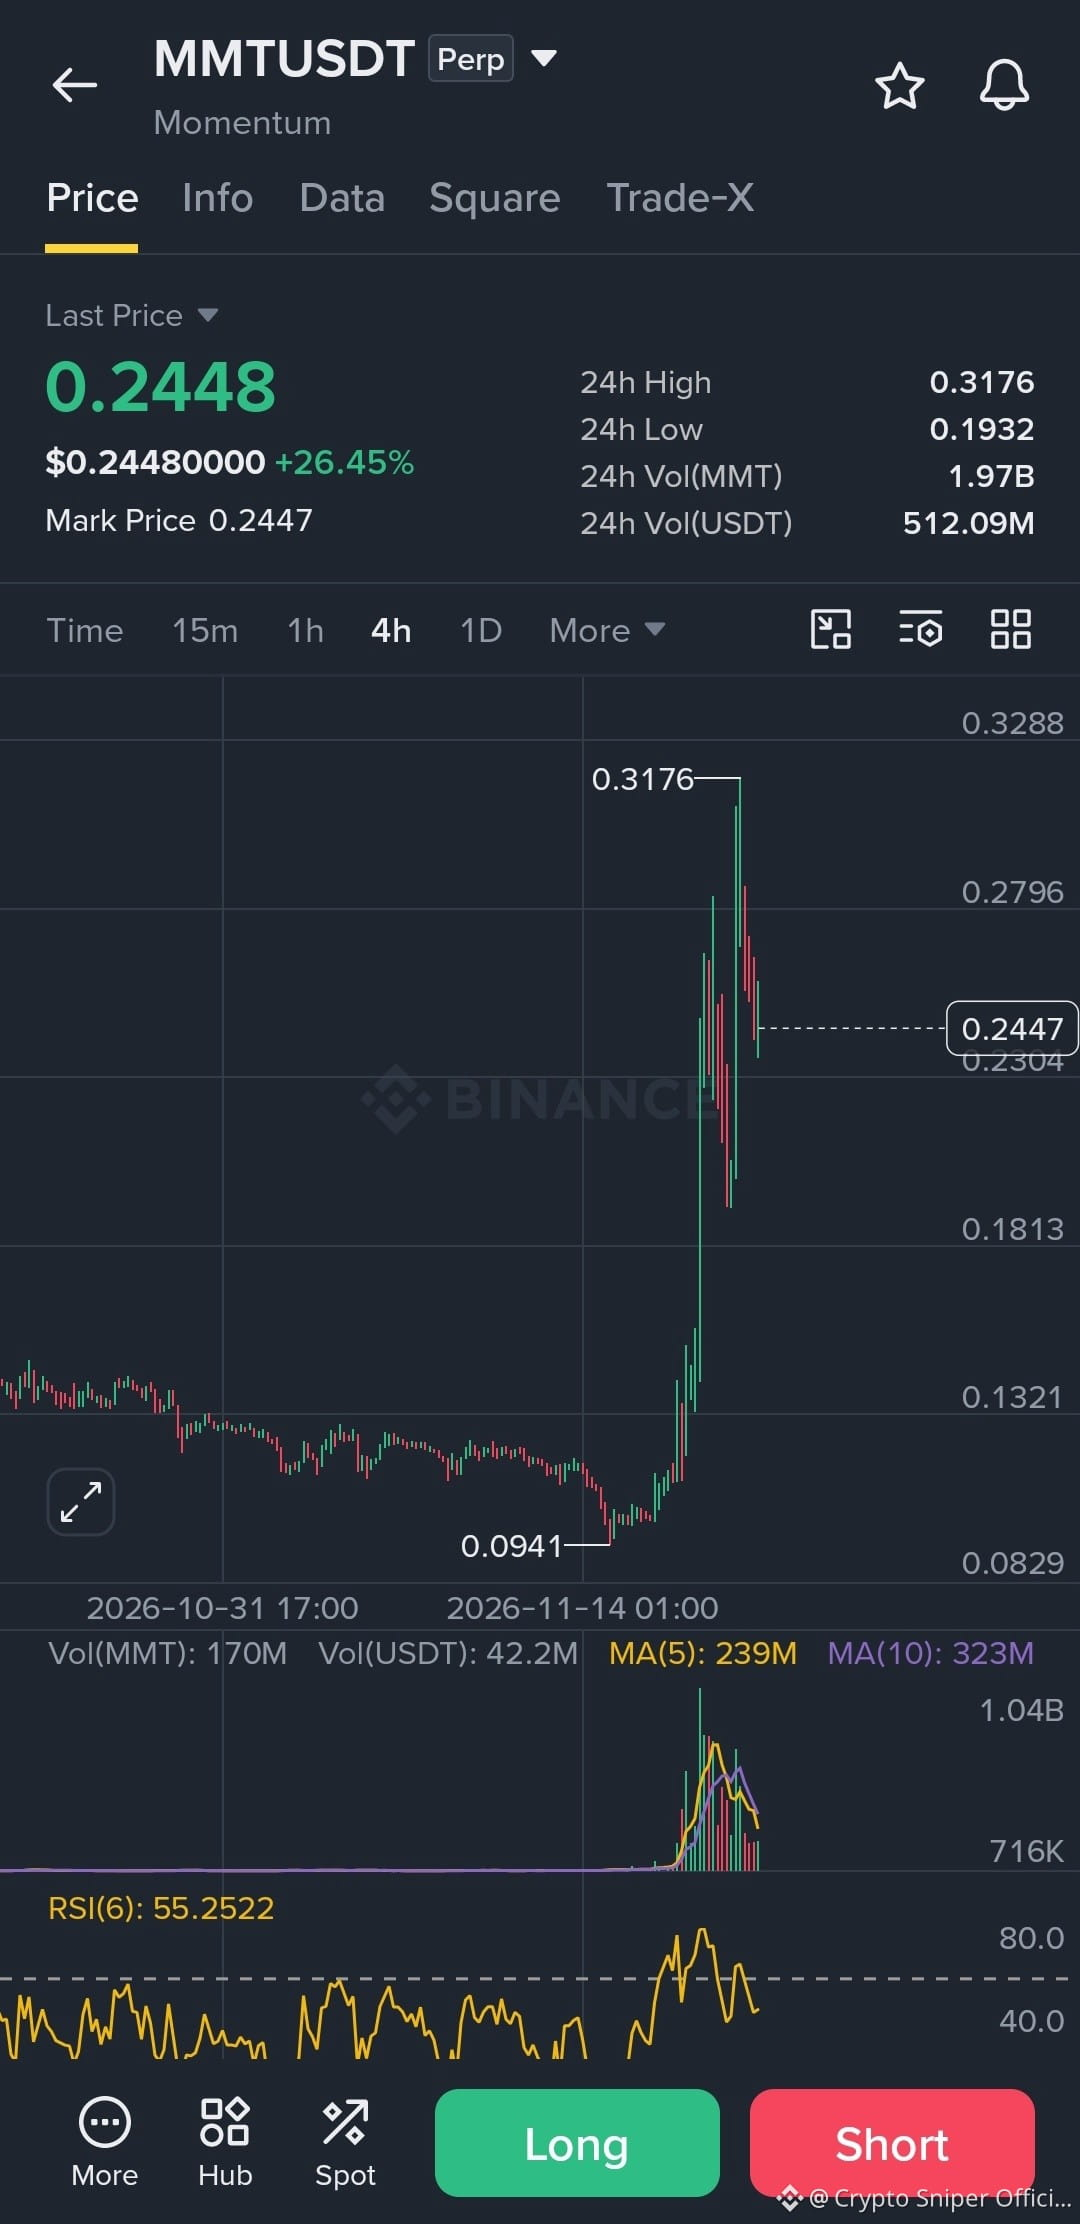
$MMT 🚀 / USDT — LONG SETUP
⏱️ 4H Chart | Perpetual
🟢 Entry Zone: 0.2250 – 0.2350 (after confirmation)
🎯 TP1: 0.2790 🎯 TP2: 0.3000 🎯 TP3: 0.3170
🛑 SL: 0.2050
MMT is cooling down after a massive breakout. RSI(6) at 55 suggests momentum is still recovering. Watch for support confirmation before entering.
$MMT 🚀 / USDT — LONG SETUP
⏱️ 4H Chart | Perpetual
🟢 Entry Zone: 0.2250 – 0.2350 (after confirmation)
🎯 TP1: 0.2790 🎯 TP2: 0.3000 🎯 TP3: 0.3170
🛑 SL: 0.2050
MMT is cooling down after a massive breakout. RSI(6) at 55 suggests momentum is still recovering. Watch for support confirmation before entering.
⏱️ 4H Chart | Perpetual
🟢 Entry Zone: 0.2250 – 0.2350 (after confirmation)
🎯 TP1: 0.2790 🎯 TP2: 0.3000 🎯 TP3: 0.3170
🛑 SL: 0.2050
MMT is cooling down after a massive breakout. RSI(6) at 55 suggests momentum is still recovering. Watch for support confirmation before entering.
178
Übersetzung ansehen
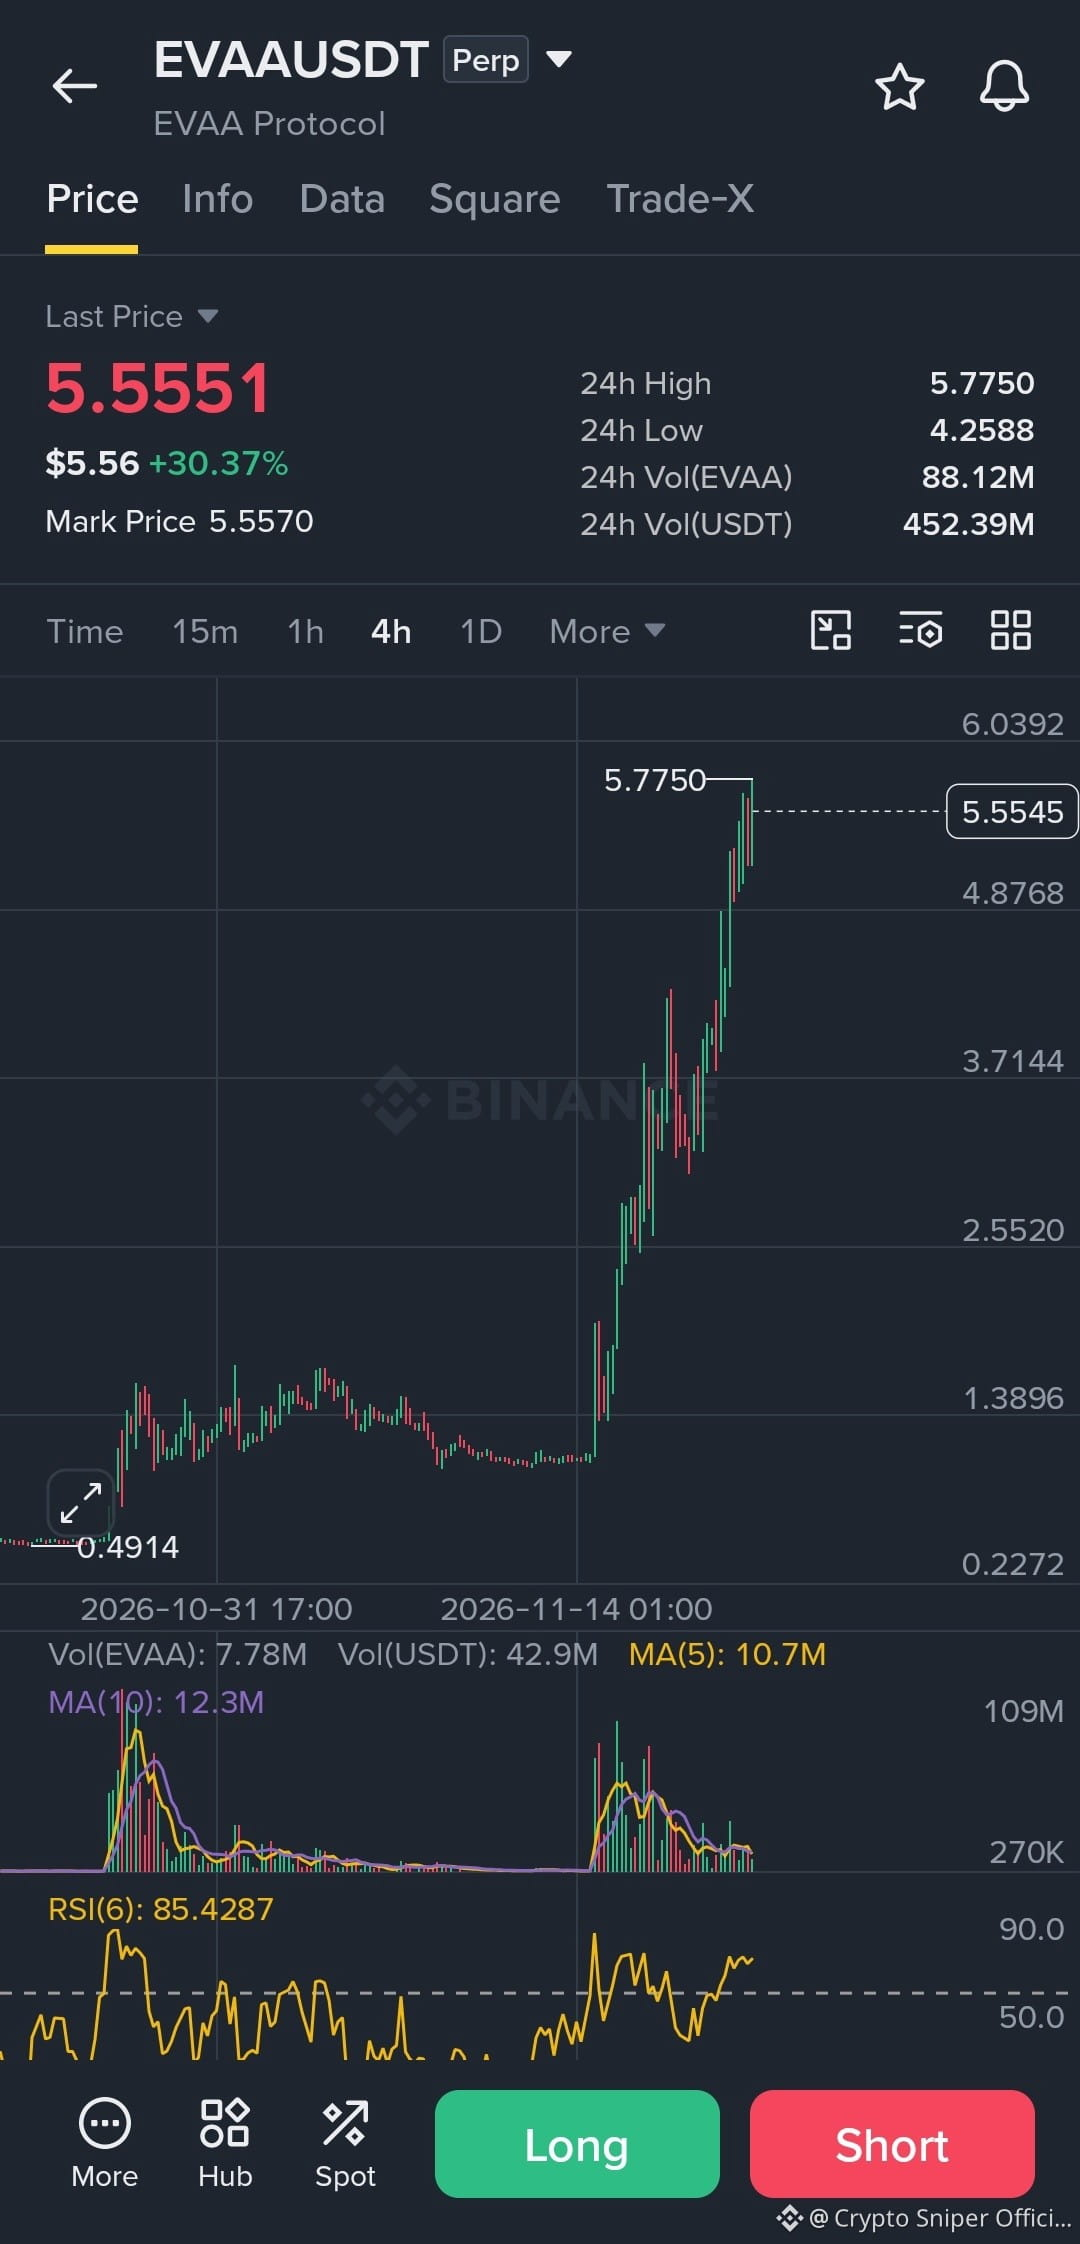
🚀 $EVAA / USDT — LONG SETUP
⏱️ 4H Chart | Perpetual
🟢 Entry Zone: 4.90 – 5.15 (after confirmation)
🎯 TP1: 5.775 🎯 TP2: 6.040 🎯 TP3: 6.500
🛑 SL: 4.65
EVAA is showing strong bullish momentum after a massive breakout. RSI(6) is at 85.42, so avoid chasing the pump. Wait for a healthy pullback before entering.
🚀 $EVAA / USDT — LONG SETUP
⏱️ 4H Chart | Perpetual
🟢 Entry Zone: 4.90 – 5.15 (after confirmation)
🎯 TP1: 5.775 🎯 TP2: 6.040 🎯 TP3: 6.500
🛑 SL: 4.65
EVAA is showing strong bullish momentum after a massive breakout. RSI(6) is at 85.42, so avoid chasing the pump. Wait for a healthy pullback before entering.
⏱️ 4H Chart | Perpetual
🟢 Entry Zone: 4.90 – 5.15 (after confirmation)
🎯 TP1: 5.775 🎯 TP2: 6.040 🎯 TP3: 6.500
🛑 SL: 4.65
EVAA is showing strong bullish momentum after a massive breakout. RSI(6) is at 85.42, so avoid chasing the pump. Wait for a healthy pullback before entering.
1
255
Übersetzung ansehen
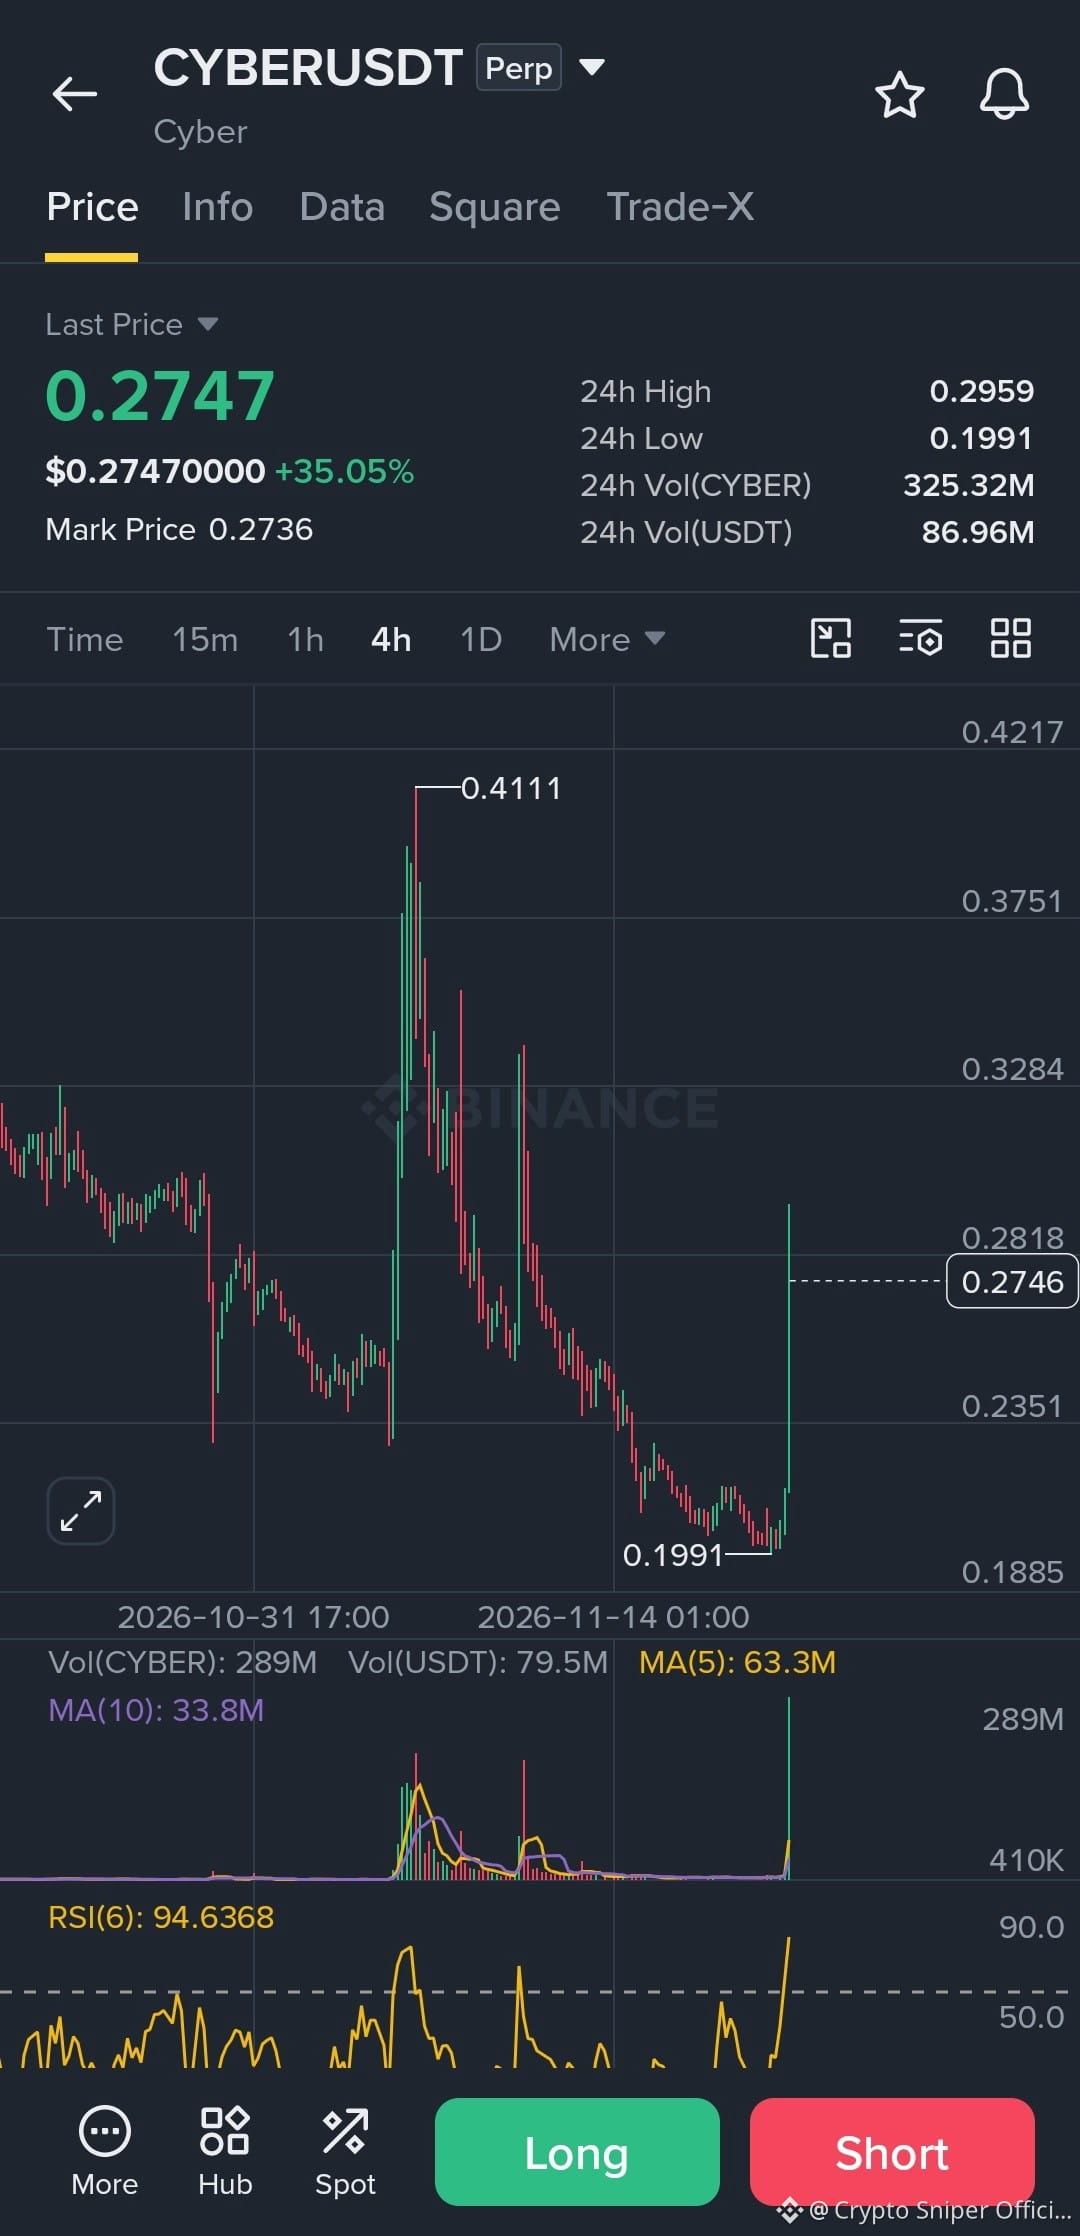
$CYBER / USDT 🚀 LONG SETUP
⏱️ 4H Chart | Perpetual
🟢 Entry Zone: 0.2550 – 0.2650 (after confirmation)
🎯 TP1: 0.2820 🎯 TP2: 0.2960 🎯 TP3: 0.3280
🛑 Stop Loss: 0.2350
CYBER is showing massive bullish momentum with a 35% surge. RSI is extremely overbought, so avoid chasing the pump. Wait for a pullback and confirmation before entering.
$CYBER / USDT 🚀 LONG SETUP
⏱️ 4H Chart | Perpetual
🟢 Entry Zone: 0.2550 – 0.2650 (after confirmation)
🎯 TP1: 0.2820 🎯 TP2: 0.2960 🎯 TP3: 0.3280
🛑 Stop Loss: 0.2350
CYBER is showing massive bullish momentum with a 35% surge. RSI is extremely overbought, so avoid chasing the pump. Wait for a pullback and confirmation before entering.
⏱️ 4H Chart | Perpetual
🟢 Entry Zone: 0.2550 – 0.2650 (after confirmation)
🎯 TP1: 0.2820 🎯 TP2: 0.2960 🎯 TP3: 0.3280
🛑 Stop Loss: 0.2350
CYBER is showing massive bullish momentum with a 35% surge. RSI is extremely overbought, so avoid chasing the pump. Wait for a pullback and confirmation before entering.
216
Übersetzung ansehen
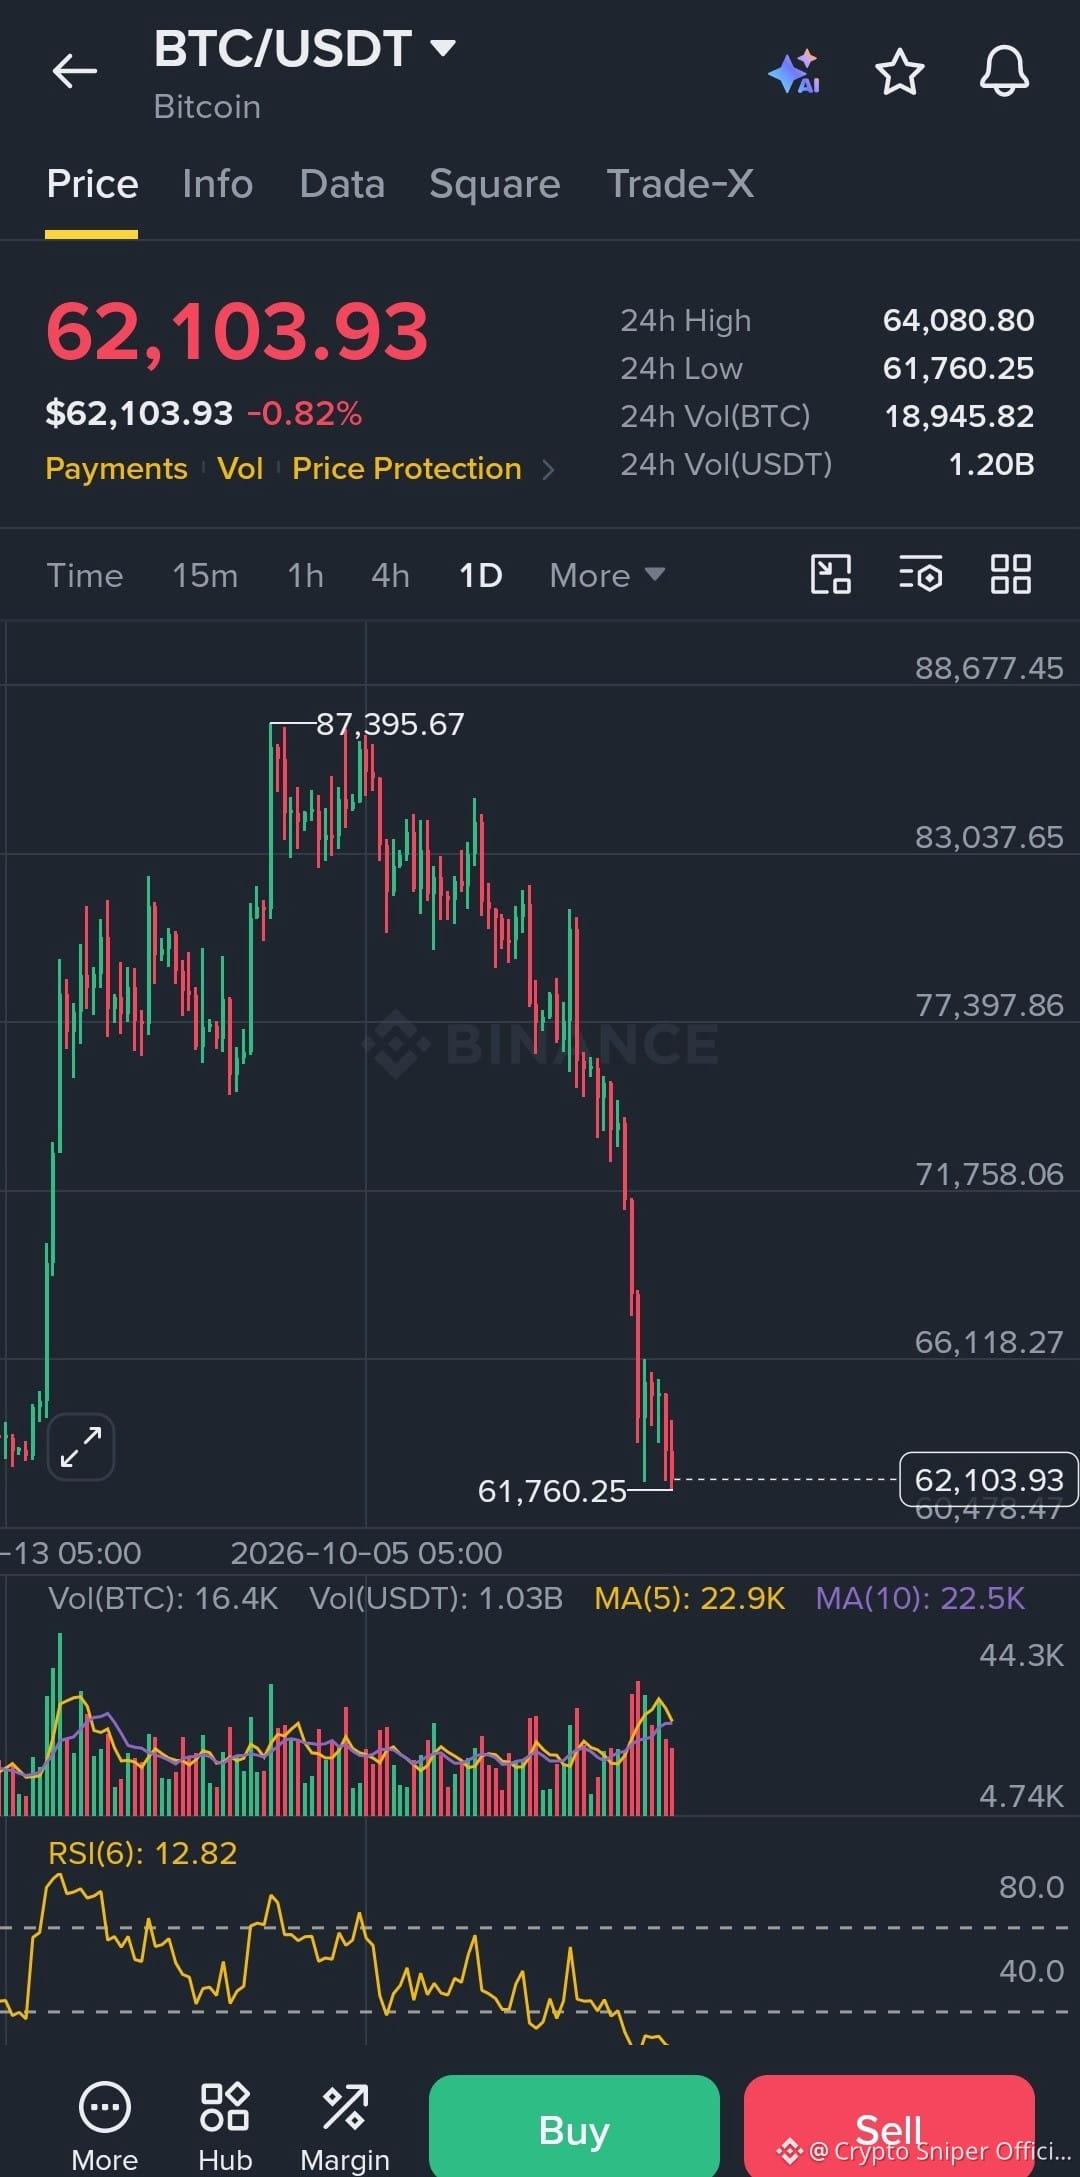
$BTC What The Fu*k 😰
Bitcoin Falls Under $62,000 📉
This Is Not Good Believe me
$BTC What The Fu*k 😰
Bitcoin Falls Under $62,000 📉
This Is Not Good Believe me
Bitcoin Falls Under $62,000 📉
This Is Not Good Believe me

1
118
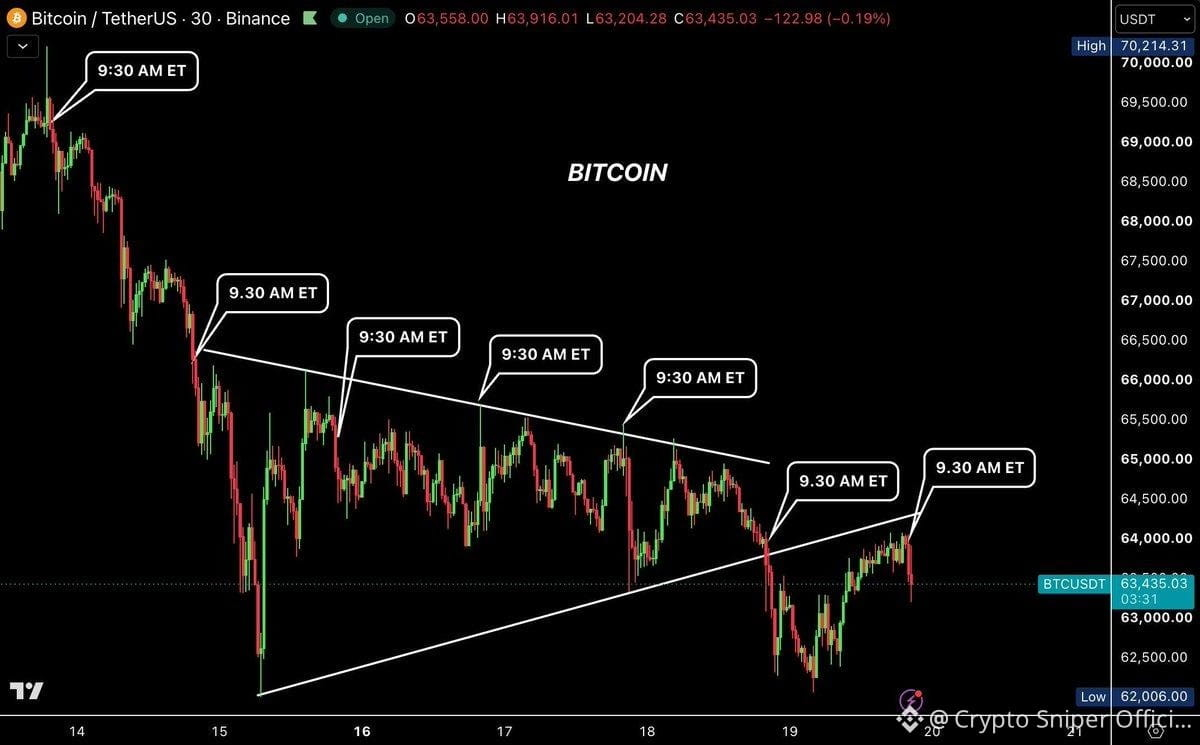
🚨 IST JANE STREET ZURÜCK?
$BTC hat 7-mal in Folge direkt nach der Öffnung des US-Aktienmarkts verkauft.
👀 Noch ein verdächtiges Muster oder einfach Marktvolatilität?
Dieser wiederholte Verkaufsdruck wirft ernsthafte Fragen auf.
DER MARKT BRAUCHT ANTWORTEN! 📉
🚨 IST JANE STREET ZURÜCK?
$BTC hat 7-mal in Folge direkt nach der Öffnung des US-Aktienmarkts verkauft.
👀 Noch ein verdächtiges Muster oder einfach Marktvolatilität?
Dieser wiederholte Verkaufsdruck wirft ernsthafte Fragen auf.
DER MARKT BRAUCHT ANTWORTEN! 📉
$BTC hat 7-mal in Folge direkt nach der Öffnung des US-Aktienmarkts verkauft.
👀 Noch ein verdächtiges Muster oder einfach Marktvolatilität?
Dieser wiederholte Verkaufsdruck wirft ernsthafte Fragen auf.
DER MARKT BRAUCHT ANTWORTEN! 📉
83
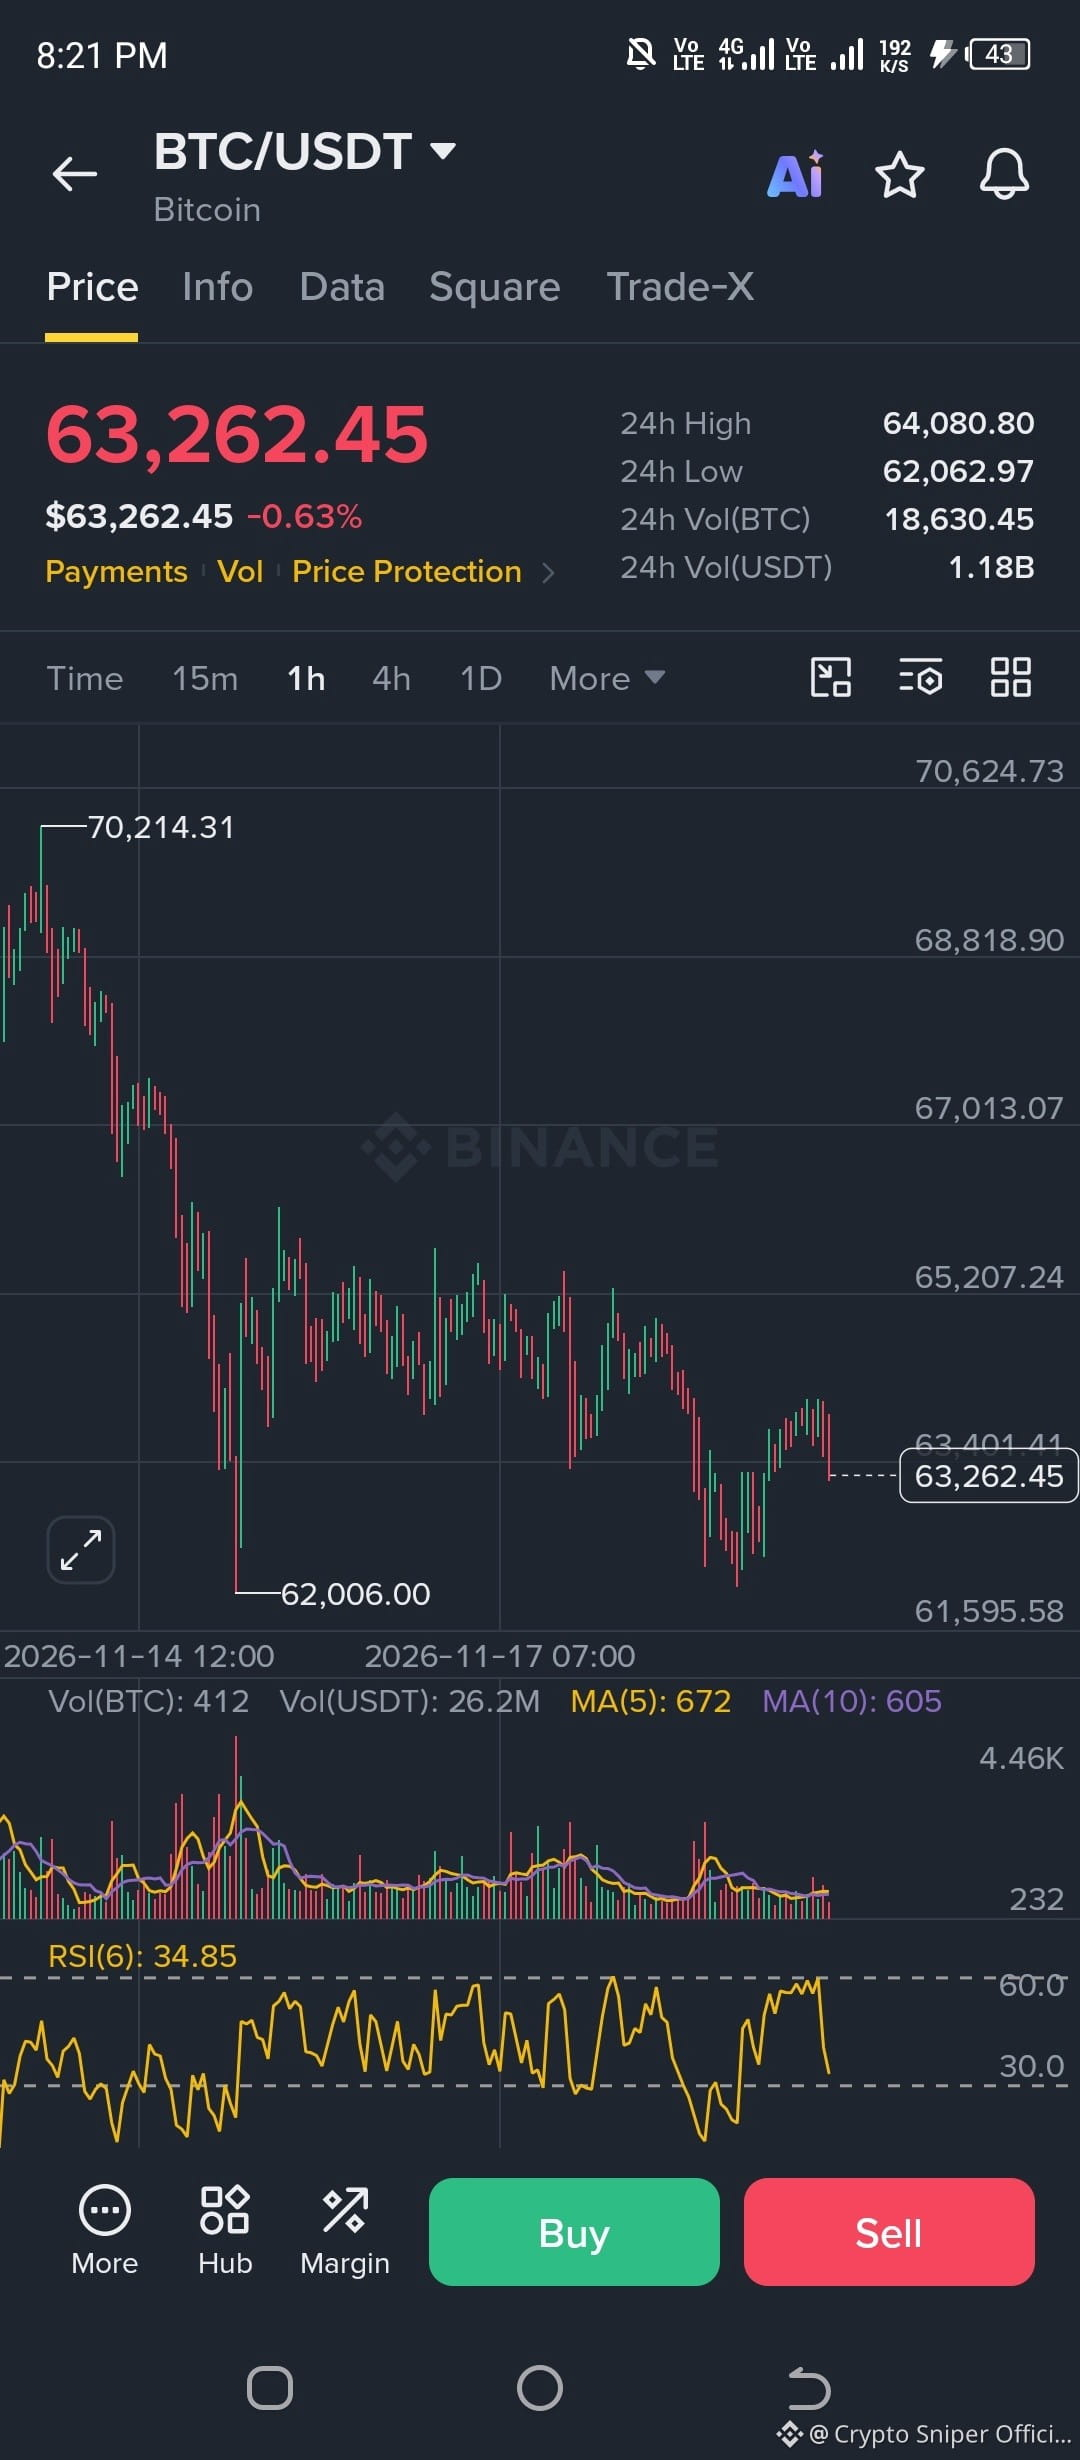
$BTC 🚨 BITCOIN-WARNUNG: DIE ERHOLUNG VERLIERT AN SCHWUNG!
$BTC wird im 1-Stunden-Chart bei etwa 63.262 $ gehandelt.
Nachdem Bitcoin seine jüngste Erholung nicht halten konnte, zeigt sich erneut Schwäche.
📉 Der RSI(6) ist auf 34,85 gefallen.
Diese wichtigen Kursmarken beobachte ich:
🔴 64.080 $ — Unmittelbarer Widerstand
🔴 65.207 $ — Starker Widerstand
🟢 62.060 $ — Unmittelbare Unterstützung
🟢 62.006 $ — Vorheriges Swing-Tief
Meine Einschätzung: Die Bären behalten die Kontrolle, solange BTC den Widerstand nicht zurückerobert. Ein Durchbruch unter 62.000 $ könnte den Weg für weitere Verluste öffnen.
Wird Bitcoin die Marke von 62.000 $ verteidigen oder weiter fallen?
Wie ist eure aktuelle Einschätzung zu BTC?
$BTC 🚨 BITCOIN-WARNUNG: DIE ERHOLUNG VERLIERT AN SCHWUNG!
$BTC wird im 1-Stunden-Chart bei etwa 63.262 $ gehandelt.
Nachdem Bitcoin seine jüngste Erholung nicht halten konnte, zeigt sich erneut Schwäche.
📉 Der RSI(6) ist auf 34,85 gefallen.
Diese wichtigen Kursmarken beobachte ich:
🔴 64.080 $ — Unmittelbarer Widerstand
🔴 65.207 $ — Starker Widerstand
🟢 62.060 $ — Unmittelbare Unterstützung
🟢 62.006 $ — Vorheriges Swing-Tief
Meine Einschätzung: Die Bären behalten die Kontrolle, solange BTC den Widerstand nicht zurückerobert. Ein Durchbruch unter 62.000 $ könnte den Weg für weitere Verluste öffnen.
Wird Bitcoin die Marke von 62.000 $ verteidigen oder weiter fallen?
Wie ist eure aktuelle Einschätzung zu BTC?
$BTC wird im 1-Stunden-Chart bei etwa 63.262 $ gehandelt.
Nachdem Bitcoin seine jüngste Erholung nicht halten konnte, zeigt sich erneut Schwäche.
📉 Der RSI(6) ist auf 34,85 gefallen.
Diese wichtigen Kursmarken beobachte ich:
🔴 64.080 $ — Unmittelbarer Widerstand
🔴 65.207 $ — Starker Widerstand
🟢 62.060 $ — Unmittelbare Unterstützung
🟢 62.006 $ — Vorheriges Swing-Tief
Meine Einschätzung: Die Bären behalten die Kontrolle, solange BTC den Widerstand nicht zurückerobert. Ein Durchbruch unter 62.000 $ könnte den Weg für weitere Verluste öffnen.
Wird Bitcoin die Marke von 62.000 $ verteidigen oder weiter fallen?
Wie ist eure aktuelle Einschätzung zu BTC?
75
Übersetzung ansehen
🔥 LET'S SETTLE THIS: SPOT OR FUTURES?
Two different approaches to the crypto market.
📈 SPOT: No liquidation from leverage. Better suited to longer-term positions.
⚡ FUTURES: More flexibility, but leverage increases both potential profits and losses.
I want to know what the community actually prefers.
Are you a SPOT trader or FUTURES trader? And why?
🔥 LET'S SETTLE THIS: SPOT OR FUTURES?
Two different approaches to the crypto market.
📈 SPOT: No liquidation from leverage. Better suited to longer-term positions.
⚡ FUTURES: More flexibility, but leverage increases both potential profits and losses.
I want to know what the community actually prefers.
Are you a SPOT trader or FUTURES trader? And why?
Two different approaches to the crypto market.
📈 SPOT: No liquidation from leverage. Better suited to longer-term positions.
⚡ FUTURES: More flexibility, but leverage increases both potential profits and losses.
I want to know what the community actually prefers.
Are you a SPOT trader or FUTURES trader? And why?
2
Anmelden und weiter Inhalte entdecken
Krypto-Nutzer weltweit auf Binance Square kennenlernen
⚡️ Bleib in Sachen Krypto stets am Puls.
💬 Die weltgrößte Kryptobörse vertraut darauf.
👍 Erhalte verlässliche Einblicke von verifizierten Creators.
E-Mail-Adresse/Telefonnummer
Trendthemen
NvidiaLoses$2.7TrillionInMonthAndAHalf
16,477 Aufrufe
114 Kommentare
Nvidias 2,7-Billionen-Dollar-Absturz: Wenn die Erzählung wichtiger ist als die Zahlen 📉
Crypto With Faisal
·7 Likes
·5.1k Aufrufe
CanBTCReboundAfterFallingBelow60K?
732,977 Aufrufe
2,941 Kommentare
GlobalStocksFaceLongestLosingStreakSince2023
265,205 Aufrufe
1,972 Kommentare