

Qaiser Mehmood Sheikh
6 Beiträge

Qaiser Mehmood Sheikh
Melden
Nutzer blockieren
Trade eröffnen
2.2 Monate
2 Following
0 Follower
0 Like gegeben
Beiträge
Portfolio
#dusk $DUSK @Dusk_Foundation
Der Kernfokus von @Dusk_Foundation liegt auf dem Aufbau einer leistungsstarken Finanz-Execution-Ebene, die hochgradige Compliance auf Institutionsebene nahtlos mit datenschutzfreundlicher Zero-Knowledge-Privatsphäre verbindet. Durch die Ermöglichung vertraulicher Smart Contracts stellt $DUSK die entscheidende Infrastruktur bereit, die für regulierte Finanzanlagen und sichere On-Chain-Abwicklungen erforderlich ist. Ein gewaltiger Sprung nach vorn für Finanzen mit Fokus auf Privatsphäre! #dusk
#dusk $DUSK @Dusk
Der Kernfokus von @Dusk liegt auf dem Aufbau einer leistungsstarken Finanz-Execution-Ebene, die hochgradige Compliance auf Institutionsebene nahtlos mit datenschutzfreundlicher Zero-Knowledge-Privatsphäre verbindet. Durch die Ermöglichung vertraulicher Smart Contracts stellt $DUSK die entscheidende Infrastruktur bereit, die für regulierte Finanzanlagen und sichere On-Chain-Abwicklungen erforderlich ist. Ein gewaltiger Sprung nach vorn für Finanzen mit Fokus auf Privatsphäre! #dusk
Der Kernfokus von @Dusk liegt auf dem Aufbau einer leistungsstarken Finanz-Execution-Ebene, die hochgradige Compliance auf Institutionsebene nahtlos mit datenschutzfreundlicher Zero-Knowledge-Privatsphäre verbindet. Durch die Ermöglichung vertraulicher Smart Contracts stellt $DUSK die entscheidende Infrastruktur bereit, die für regulierte Finanzanlagen und sichere On-Chain-Abwicklungen erforderlich ist. Ein gewaltiger Sprung nach vorn für Finanzen mit Fokus auf Privatsphäre! #dusk
63

Artikel
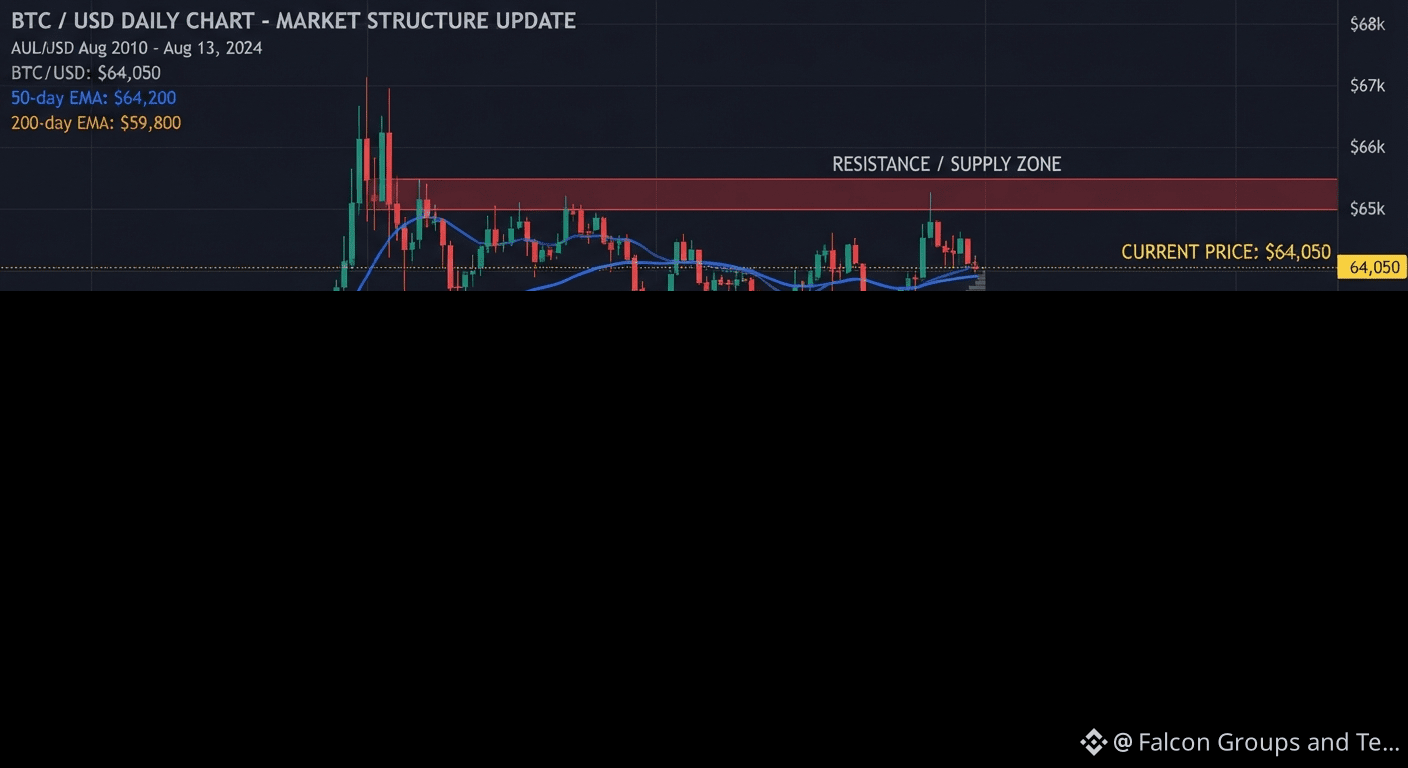
Die Weekend-Falle: Steht $BTC kurz vor einem Ausbruch oder zockt es uns nur ab? 📉 📈Hey Binance Square-Familie! Während wir uns ins Wochenende einpendeln, zieht sich die Volatilität insgesamt zusammen, und $BITCOIN sitzt direkt an einem großen Entscheidungspunkt nahe 64.050 US-Dollar.
Das Volumen kühlt ab, was normalerweise eine Sache bedeutet: eine scharfe Bewegung steht bevor. So spiele ich die aktuelle Marktstruktur:
Der Bull-Case: Wenn es den Bullen gelingt, die Support-Zone bei 63.500 – 64.000 US-Dollar zu verteidigen und eine Kerze mit hohem Volumen über 65.000 US-Dollar zu drücken, dann schauen wir auf einen schnellen Anstieg bis in den Widerstandsbereich von 66.700 – 67.500 US-Dollar.
Das Bear-Risiko: Ein Verlust des unmittelbaren Support-Bodens birgt die Gefahr eines Sweeps nach unten bis in die Macro-Range-Tiefs nahe 62.500 US-Dollar.
Die Weekend-Falle: Steht $BTC kurz vor einem Ausbruch oder zockt es uns nur ab? 📉 📈
Hey Binance Square-Familie! Während wir uns ins Wochenende einpendeln, zieht sich die Volatilität insgesamt zusammen, und $BITCOIN sitzt direkt an einem großen Entscheidungspunkt nahe 64.050 US-Dollar.
Das Volumen kühlt ab, was normalerweise eine Sache bedeutet: eine scharfe Bewegung steht bevor. So spiele ich die aktuelle Marktstruktur:
Der Bull-Case: Wenn es den Bullen gelingt, die Support-Zone bei 63.500 – 64.000 US-Dollar zu verteidigen und eine Kerze mit hohem Volumen über 65.000 US-Dollar zu drücken, dann schauen wir auf einen schnellen Anstieg bis in den Widerstandsbereich von 66.700 – 67.500 US-Dollar.
Das Bear-Risiko: Ein Verlust des unmittelbaren Support-Bodens birgt die Gefahr eines Sweeps nach unten bis in die Macro-Range-Tiefs nahe 62.500 US-Dollar.
Das Volumen kühlt ab, was normalerweise eine Sache bedeutet: eine scharfe Bewegung steht bevor. So spiele ich die aktuelle Marktstruktur:
Der Bull-Case: Wenn es den Bullen gelingt, die Support-Zone bei 63.500 – 64.000 US-Dollar zu verteidigen und eine Kerze mit hohem Volumen über 65.000 US-Dollar zu drücken, dann schauen wir auf einen schnellen Anstieg bis in den Widerstandsbereich von 66.700 – 67.500 US-Dollar.
Das Bear-Risiko: Ein Verlust des unmittelbaren Support-Bodens birgt die Gefahr eines Sweeps nach unten bis in die Macro-Range-Tiefs nahe 62.500 US-Dollar.
99
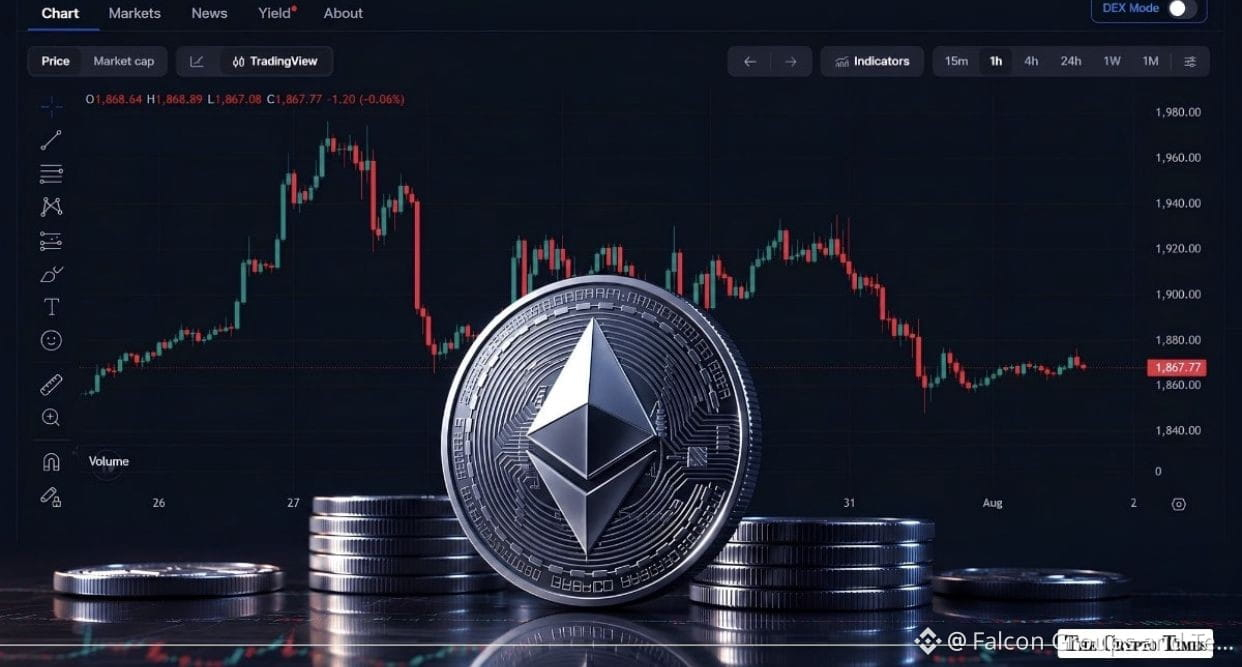
Ethereum $ETH Marktanalyse
* Aktueller Preis: ca. 1.890 – 1.900 $
* Marktumfeld: $ETH versucht nach dem Test einer Unterstützung nahe der 1.850-Dollar-Zone eine solide Erholung aufzubauen. Dabei bewegt es sich im Gleichklang mit den breiteren Kursbewegungen am Kryptomarkt, während Händler makroökonomische Updates und die US-Inflationsdaten verarbeiten.
Wichtige technische Kursmarken
| Marke | Preisspanne | Bedeutung |
|---|---|---|
| Unmittelbare Unterstützung | 1.850 – 1.865 $ | Zusammenfluss der 20-Tage- und 50-Tage-EMAs; dient als entscheidender Sicherheitsboden für kurzfristige Rücksetzer. |
| Pivot / Ausbruch-Hürde | 1.895 – 1.920 $ | Kurzfristiger Wendepunkt, der mit der 100-Tage-EMA (1.922 $) zusammenfällt. Das Zurückerobern dieser Zone ist essenziell, um Aufwärtsdynamik aufzubauen. |
| Große Angebots-/Widerstandszone | 1.960 – 2.000 $ | Starke Widerstandszone mit viel Angebotsdruck. Ein bestätigter Tagesabschluss über dieser Marke ebnet den Weg zu höheren mittelfristigen Zielen (2.170+). |
Wann ist die beste Zeit zum Handeln?
Die Wahl des richtigen Einstiegs hängt davon ab, ob du sichere Range-Setups bevorzugst oder bestätigte Ausbrüche:
* Beste Zeit für Long-Einstiege (Support-Bounce):
Achte auf Einstiege, wenn der Preis die 1.850 – 1.865-Dollar-Unterstützungszone erfolgreich testet und verteidigt – bei gleichzeitig abnehmendem Verkaufsvolumen. Kaufen nahe der Unterstützung bei einem engen Stop-Loss unter 1.830 $ bietet ein vorteilhaftes Chance-Risiko-Verhältnis.
* Beste Zeit für Momentum-/Breakout-Einstiege:
Verfolge keine Preise in der mittleren Range. Warte stattdessen auf einen täglichen Schlusskurs mit hohem Volumen über der 1.920 – 1.960-Dollar-Widerstandszone. Der Einstieg erst nach der Bestätigung senkt das Risiko, Opfer eines Fehlausbruchs zu werden oder nach unten in die Range zurückgeworfen zu werden.
* Warnhinweis zum Risikomanagement:
Da die gesamte Marktstimmung eher vorsichtig bleibt und die Sommer-Volumentrends flach sind, solltest du hohe Hebel vermeiden. Staffle deine Orders und halte strikte Stop-Losses ein, um dich gegen makroökonomische Volatilität abzusichern.
#ETH #EthereumMarket $ETH
{spot}(ETHUSDT)
Ethereum $ETH Marktanalyse
* Aktueller Preis: ca. 1.890 – 1.900 $
* Marktumfeld: $ETH versucht nach dem Test einer Unterstützung nahe der 1.850-Dollar-Zone eine solide Erholung aufzubauen. Dabei bewegt es sich im Gleichklang mit den breiteren Kursbewegungen am Kryptomarkt, während Händler makroökonomische Updates und die US-Inflationsdaten verarbeiten.
Wichtige technische Kursmarken
| Marke | Preisspanne | Bedeutung |
|---|---|---|
| Unmittelbare Unterstützung | 1.850 – 1.865 $ | Zusammenfluss der 20-Tage- und 50-Tage-EMAs; dient als entscheidender Sicherheitsboden für kurzfristige Rücksetzer. |
| Pivot / Ausbruch-Hürde | 1.895 – 1.920 $ | Kurzfristiger Wendepunkt, der mit der 100-Tage-EMA (1.922 $) zusammenfällt. Das Zurückerobern dieser Zone ist essenziell, um Aufwärtsdynamik aufzubauen. |
| Große Angebots-/Widerstandszone | 1.960 – 2.000 $ | Starke Widerstandszone mit viel Angebotsdruck. Ein bestätigter Tagesabschluss über dieser Marke ebnet den Weg zu höheren mittelfristigen Zielen (2.170+). |
Wann ist die beste Zeit zum Handeln?
Die Wahl des richtigen Einstiegs hängt davon ab, ob du sichere Range-Setups bevorzugst oder bestätigte Ausbrüche:
* Beste Zeit für Long-Einstiege (Support-Bounce):
Achte auf Einstiege, wenn der Preis die 1.850 – 1.865-Dollar-Unterstützungszone erfolgreich testet und verteidigt – bei gleichzeitig abnehmendem Verkaufsvolumen. Kaufen nahe der Unterstützung bei einem engen Stop-Loss unter 1.830 $ bietet ein vorteilhaftes Chance-Risiko-Verhältnis.
* Beste Zeit für Momentum-/Breakout-Einstiege:
Verfolge keine Preise in der mittleren Range. Warte stattdessen auf einen täglichen Schlusskurs mit hohem Volumen über der 1.920 – 1.960-Dollar-Widerstandszone. Der Einstieg erst nach der Bestätigung senkt das Risiko, Opfer eines Fehlausbruchs zu werden oder nach unten in die Range zurückgeworfen zu werden.
* Warnhinweis zum Risikomanagement:
Da die gesamte Marktstimmung eher vorsichtig bleibt und die Sommer-Volumentrends flach sind, solltest du hohe Hebel vermeiden. Staffle deine Orders und halte strikte Stop-Losses ein, um dich gegen makroökonomische Volatilität abzusichern.
#ETH #EthereumMarket $ETH
* Aktueller Preis: ca. 1.890 – 1.900 $
* Marktumfeld: $ETH versucht nach dem Test einer Unterstützung nahe der 1.850-Dollar-Zone eine solide Erholung aufzubauen. Dabei bewegt es sich im Gleichklang mit den breiteren Kursbewegungen am Kryptomarkt, während Händler makroökonomische Updates und die US-Inflationsdaten verarbeiten.
Wichtige technische Kursmarken
| Marke | Preisspanne | Bedeutung |
|---|---|---|
| Unmittelbare Unterstützung | 1.850 – 1.865 $ | Zusammenfluss der 20-Tage- und 50-Tage-EMAs; dient als entscheidender Sicherheitsboden für kurzfristige Rücksetzer. |
| Pivot / Ausbruch-Hürde | 1.895 – 1.920 $ | Kurzfristiger Wendepunkt, der mit der 100-Tage-EMA (1.922 $) zusammenfällt. Das Zurückerobern dieser Zone ist essenziell, um Aufwärtsdynamik aufzubauen. |
| Große Angebots-/Widerstandszone | 1.960 – 2.000 $ | Starke Widerstandszone mit viel Angebotsdruck. Ein bestätigter Tagesabschluss über dieser Marke ebnet den Weg zu höheren mittelfristigen Zielen (2.170+). |
Wann ist die beste Zeit zum Handeln?
Die Wahl des richtigen Einstiegs hängt davon ab, ob du sichere Range-Setups bevorzugst oder bestätigte Ausbrüche:
* Beste Zeit für Long-Einstiege (Support-Bounce):
Achte auf Einstiege, wenn der Preis die 1.850 – 1.865-Dollar-Unterstützungszone erfolgreich testet und verteidigt – bei gleichzeitig abnehmendem Verkaufsvolumen. Kaufen nahe der Unterstützung bei einem engen Stop-Loss unter 1.830 $ bietet ein vorteilhaftes Chance-Risiko-Verhältnis.
* Beste Zeit für Momentum-/Breakout-Einstiege:
Verfolge keine Preise in der mittleren Range. Warte stattdessen auf einen täglichen Schlusskurs mit hohem Volumen über der 1.920 – 1.960-Dollar-Widerstandszone. Der Einstieg erst nach der Bestätigung senkt das Risiko, Opfer eines Fehlausbruchs zu werden oder nach unten in die Range zurückgeworfen zu werden.
* Warnhinweis zum Risikomanagement:
Da die gesamte Marktstimmung eher vorsichtig bleibt und die Sommer-Volumentrends flach sind, solltest du hohe Hebel vermeiden. Staffle deine Orders und halte strikte Stop-Losses ein, um dich gegen makroökonomische Volatilität abzusichern.
#ETH #EthereumMarket $ETH
80
Artikel
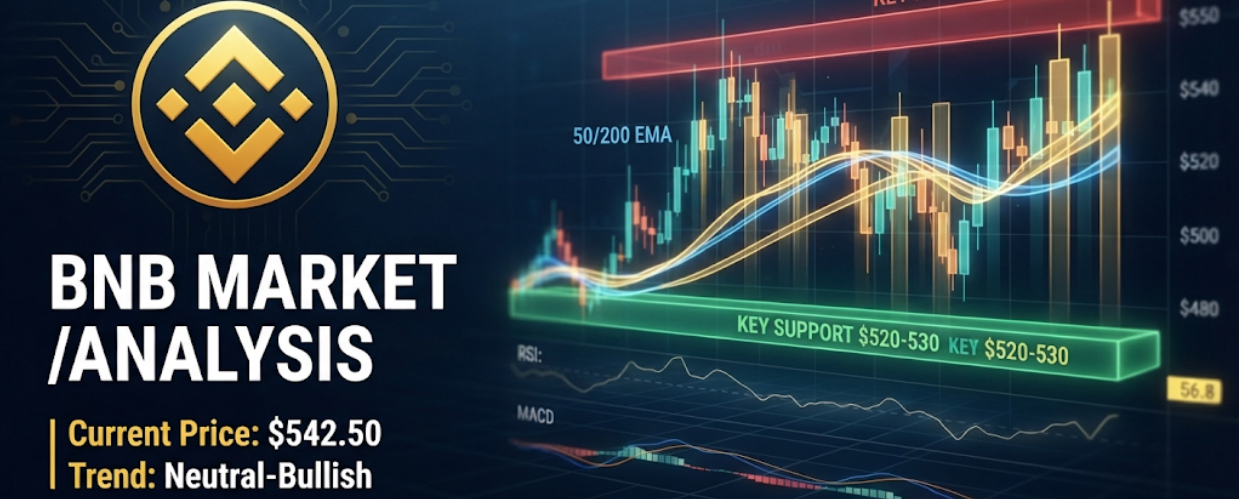
Detaillierte technische Analyse BNB / USDAktueller Marktpreis: ~$BNB 542,50
Technische Indikatoren: 50-Tage-EMA: $530,00 (wirkt als unmittelbarer dynamischer Support)
200-Tage-EMA:
$498,00 (langfristige strukturelle Basis)
RSI (Relative Strength Index): 56,8 (neutral bis bullisher Momentum-Shift, zeigt nach oben ohne überkauft zu sein)
MACD:
Leichte bullische Konvergenz, die sich auf den Tagescharts bildet, nachdem kürzlich Tests des Supports stattgefunden haben.
Wichtige technische Zonen
Zonentyp
Preisspanne
Analyse & Bedeutung
Angebots-/Widerstandszone
$555,00 - $565,00
Starker Liquiditätsblock. Frühere Rallye-Versuche trafen hier auf massiven Verkaufsdruck. Ein täglicher Schlusskurs über $565 ist erforderlich für einen großen Ausbruch.
Detaillierte technische Analyse BNB / USD
Aktueller Marktpreis: ~$BNB 542,50
Technische Indikatoren: 50-Tage-EMA: $530,00 (wirkt als unmittelbarer dynamischer Support)
200-Tage-EMA:
$498,00 (langfristige strukturelle Basis)
RSI (Relative Strength Index): 56,8 (neutral bis bullisher Momentum-Shift, zeigt nach oben ohne überkauft zu sein)
MACD:
Leichte bullische Konvergenz, die sich auf den Tagescharts bildet, nachdem kürzlich Tests des Supports stattgefunden haben.
Wichtige technische Zonen
Zonentyp
Preisspanne
Analyse & Bedeutung
Angebots-/Widerstandszone
$555,00 - $565,00
Starker Liquiditätsblock. Frühere Rallye-Versuche trafen hier auf massiven Verkaufsdruck. Ein täglicher Schlusskurs über $565 ist erforderlich für einen großen Ausbruch.
Technische Indikatoren: 50-Tage-EMA: $530,00 (wirkt als unmittelbarer dynamischer Support)
200-Tage-EMA:
$498,00 (langfristige strukturelle Basis)
RSI (Relative Strength Index): 56,8 (neutral bis bullisher Momentum-Shift, zeigt nach oben ohne überkauft zu sein)
MACD:
Leichte bullische Konvergenz, die sich auf den Tagescharts bildet, nachdem kürzlich Tests des Supports stattgefunden haben.
Wichtige technische Zonen
Zonentyp
Preisspanne
Analyse & Bedeutung
Angebots-/Widerstandszone
$555,00 - $565,00
Starker Liquiditätsblock. Frühere Rallye-Versuche trafen hier auf massiven Verkaufsdruck. Ein täglicher Schlusskurs über $565 ist erforderlich für einen großen Ausbruch.
86
Bitcoin $BTC Trade-Analyse
* Aktueller Kurs: ca. 63.800 – 64.000 USD
* Marktumfeld: $BTC konsolidiert in einer engen Spanne zwischen 62.500 und 65.000 USD, reagiert dabei eng auf die jüngsten US-Inflationsdaten (CPI) und wartet auf bevorstehende makroökonomische Auslöser.
Wichtige technische Marken
| Level-Typ | Preiszone / Spanne | Bedeutung |
|---|---|---|
| Unmittelbarer Support | 62.500 – 63.500 USD | Entscheidend für die Nachfrageszone, die kurzfristig höhere Tiefs hält; bei einem Bruch droht ein Rücklauf Richtung 61.300 USD. |
| Pivot / Ausbruch-Bereich | 64.000 – 64.500 USD | Kurzfristiger Wendepunkt; im Zusammenspiel mit der 50-Tage-EMA (64.583 USD). |
| Unmittelbarer Widerstand | 64.900 – 65.300 USD | Hohe Angebots-/Liquiditätszone. Eine Abweisung hier könnte die spannen-/rangegebundene Bewegung verlängern. |
| Kursziel nach oben / Ausbruch | 66.700 – 67.500 USD | Ein bestätigter täglicher Close oberhalb der Widerstandsziele setzt die 100-Tage-EMA und lokale, schwache Hochs unter Druck. |
Handelsszenarien
* Bullisches Fortsetzungs-Setup (Long):
* Trigger: Auf einen starken 1H–4H-Kerzenabschluss über 65.000 USD achten, untermauert durch Volumen, oder auf einen sauberen Retest sowie die Verteidigung des Supportblocks 63.800 – 64.200 USD.
* Ziele: 65.500 USD, anschließend 66.750 USD.
* Risikomanagement: Stop-Loss eng unter 63.500 USD platzieren.
* Bärisches / Range-Abweisungs-Setup (Short):
* Trigger: Abweisung und nachlassender Momentum-Bias um die Angebotszone 64.900 – 65.300 USD.
* Ziele: Rückkehr zu den Range-Tiefs bei 62.500 USD.
* Risikomanagement: Stop-Loss oberhalb 65.600 USD.
* Invalidierung: Ein täglicher Close mit hohem Volumen unter 62.000 USD invalidiert die aktuelle kurzfristige Erholungsstruktur und macht tieferen makroökonomischen Support sichtbar.
#BTC #Market_Update
{spot}(BTCUSDT)
Bitcoin $BTC Trade-Analyse
* Aktueller Kurs: ca. 63.800 – 64.000 USD
* Marktumfeld: $BTC konsolidiert in einer engen Spanne zwischen 62.500 und 65.000 USD, reagiert dabei eng auf die jüngsten US-Inflationsdaten (CPI) und wartet auf bevorstehende makroökonomische Auslöser.
Wichtige technische Marken
| Level-Typ | Preiszone / Spanne | Bedeutung |
|---|---|---|
| Unmittelbarer Support | 62.500 – 63.500 USD | Entscheidend für die Nachfrageszone, die kurzfristig höhere Tiefs hält; bei einem Bruch droht ein Rücklauf Richtung 61.300 USD. |
| Pivot / Ausbruch-Bereich | 64.000 – 64.500 USD | Kurzfristiger Wendepunkt; im Zusammenspiel mit der 50-Tage-EMA (64.583 USD). |
| Unmittelbarer Widerstand | 64.900 – 65.300 USD | Hohe Angebots-/Liquiditätszone. Eine Abweisung hier könnte die spannen-/rangegebundene Bewegung verlängern. |
| Kursziel nach oben / Ausbruch | 66.700 – 67.500 USD | Ein bestätigter täglicher Close oberhalb der Widerstandsziele setzt die 100-Tage-EMA und lokale, schwache Hochs unter Druck. |
Handelsszenarien
* Bullisches Fortsetzungs-Setup (Long):
* Trigger: Auf einen starken 1H–4H-Kerzenabschluss über 65.000 USD achten, untermauert durch Volumen, oder auf einen sauberen Retest sowie die Verteidigung des Supportblocks 63.800 – 64.200 USD.
* Ziele: 65.500 USD, anschließend 66.750 USD.
* Risikomanagement: Stop-Loss eng unter 63.500 USD platzieren.
* Bärisches / Range-Abweisungs-Setup (Short):
* Trigger: Abweisung und nachlassender Momentum-Bias um die Angebotszone 64.900 – 65.300 USD.
* Ziele: Rückkehr zu den Range-Tiefs bei 62.500 USD.
* Risikomanagement: Stop-Loss oberhalb 65.600 USD.
* Invalidierung: Ein täglicher Close mit hohem Volumen unter 62.000 USD invalidiert die aktuelle kurzfristige Erholungsstruktur und macht tieferen makroökonomischen Support sichtbar.
#BTC #Market_Update
* Aktueller Kurs: ca. 63.800 – 64.000 USD
* Marktumfeld: $BTC konsolidiert in einer engen Spanne zwischen 62.500 und 65.000 USD, reagiert dabei eng auf die jüngsten US-Inflationsdaten (CPI) und wartet auf bevorstehende makroökonomische Auslöser.
Wichtige technische Marken
| Level-Typ | Preiszone / Spanne | Bedeutung |
|---|---|---|
| Unmittelbarer Support | 62.500 – 63.500 USD | Entscheidend für die Nachfrageszone, die kurzfristig höhere Tiefs hält; bei einem Bruch droht ein Rücklauf Richtung 61.300 USD. |
| Pivot / Ausbruch-Bereich | 64.000 – 64.500 USD | Kurzfristiger Wendepunkt; im Zusammenspiel mit der 50-Tage-EMA (64.583 USD). |
| Unmittelbarer Widerstand | 64.900 – 65.300 USD | Hohe Angebots-/Liquiditätszone. Eine Abweisung hier könnte die spannen-/rangegebundene Bewegung verlängern. |
| Kursziel nach oben / Ausbruch | 66.700 – 67.500 USD | Ein bestätigter täglicher Close oberhalb der Widerstandsziele setzt die 100-Tage-EMA und lokale, schwache Hochs unter Druck. |
Handelsszenarien
* Bullisches Fortsetzungs-Setup (Long):
* Trigger: Auf einen starken 1H–4H-Kerzenabschluss über 65.000 USD achten, untermauert durch Volumen, oder auf einen sauberen Retest sowie die Verteidigung des Supportblocks 63.800 – 64.200 USD.
* Ziele: 65.500 USD, anschließend 66.750 USD.
* Risikomanagement: Stop-Loss eng unter 63.500 USD platzieren.
* Bärisches / Range-Abweisungs-Setup (Short):
* Trigger: Abweisung und nachlassender Momentum-Bias um die Angebotszone 64.900 – 65.300 USD.
* Ziele: Rückkehr zu den Range-Tiefs bei 62.500 USD.
* Risikomanagement: Stop-Loss oberhalb 65.600 USD.
* Invalidierung: Ein täglicher Close mit hohem Volumen unter 62.000 USD invalidiert die aktuelle kurzfristige Erholungsstruktur und macht tieferen makroökonomischen Support sichtbar.
#BTC #Market_Update
75
Anmelden und weiter Inhalte entdecken
Krypto-Nutzer weltweit auf Binance Square kennenlernen
⚡️ Bleib in Sachen Krypto stets am Puls.
💬 Die weltgrößte Kryptobörse vertraut darauf.
👍 Erhalte verlässliche Einblicke von verifizierten Creators.
E-Mail-Adresse/Telefonnummer
Trendthemen
NvidiaApproves$150BBuyback
235 Aufrufe
12 Kommentare
🚨 NVIDIA HAT SOEBEN EINE WETTE ÜBER 150 MILLIARDEN DOLLAR AUF SICH SELBST ABGEGEBEN!
Der KI-Riese NVIDIA hat eine zusätzliche Aktienrückkauf-Ermächtigung in Höhe von 150 Milliarden US-Dollar genehmigt und damit seine verbleibende Gesamt-Ermächtigung für den Aktienrückkauf auf 235 Milliarden US-Dollar erhöht — das größte Aktienrückkaufprogramm in der US-Unternehmensgeschichte.
Warum ist das wichtig? 👇
🔥 Massive Aktienrückkäufe signalisieren häufig starkes Vertrauen des Managements.
💰 NVIDIA nutzt riesige, KI-getriebene Cashflows, um Kapital an die Aktionäre zurückzugeben.
📈 Der Schritt unterstreicht zudem NVIDIA’s Überzeugung, dass der KI-Boom noch lange nicht vorbei ist.
CEO Jensen Huang sagt, dass KI und beschleunigtes Computing eine „Gelegenheit einmal pro Generation“ schaffen, und NVIDIA plant, weiterhin aggressiv zu investieren und gleichzeitig Investoren zu belohnen.
👀 Trader beobachten nun, ob diese historische Ankündigung mehr Schwung in KI-bezogene Aktien und den breiteren Tech-Markt bringt.
#NvidiaApproves$150BBuyback #NVIDIA
$NVDA.US $NVDAB
ASHFAQ NAEEM
·1 Likes
·42 Aufrufe
OpenAIDelaysGPT6.1OverSafetyIssues
769 Aufrufe
59 Kommentare
AMDToAcquireWorldLabsFor$8.2B
96 Aufrufe
16 Kommentare