
mrWH
15 Beiträge

mrWH
Melden
Nutzer blockieren
10 Following
0 Follower
2 Like gegeben
Beiträge
·
--
{spot}(BNBUSDT)
#BNB Smarte Analyse — BNBUSDT
Zusammenfassung: Die Chartstruktur bleibt schwach, obwohl die jüngste Bewegung über einen Tag nahezu unverändert ist. BNB wird unter seinen wichtigen gleitenden Tagesdurchschnitten gehandelt, während die Momentumindikatoren weiterhin schwach sind. Kurzfristig überverkaufte Werte bedeuten, dass die Volatilität erhöht bleiben kann; sie bestätigen keine Trendwende.
Chartanalyse
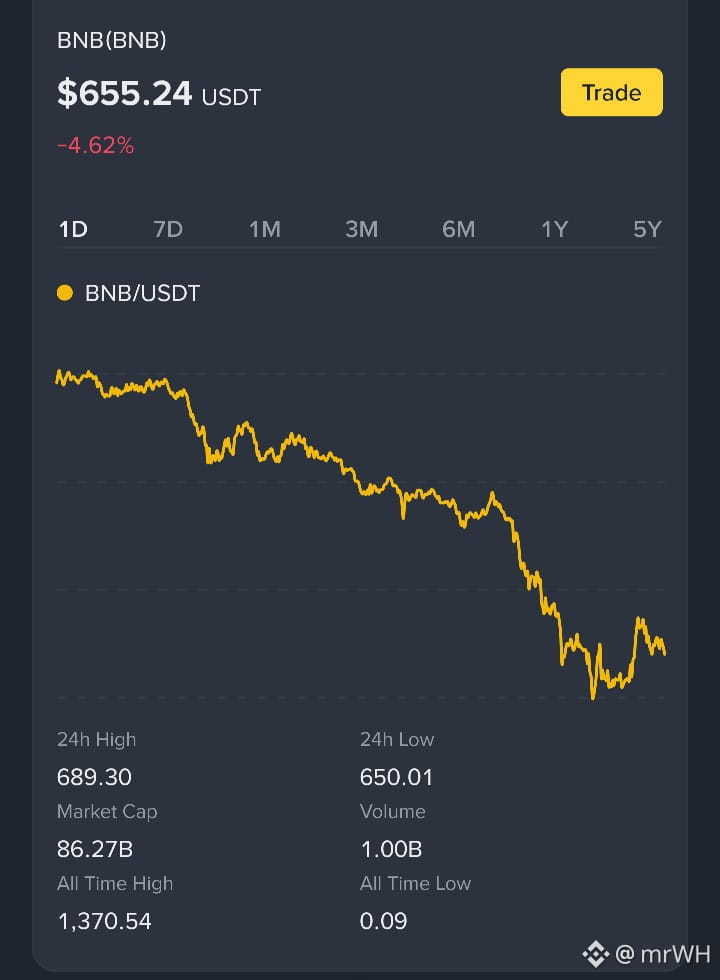
Aktueller Spotpreis: $655.50
24-Stunden-Spanne: $650.01–$689.30
4-Stunden-Chart: 59 abgeschlossene Kerzen, vom 2. bis 12. Nov. UTC
Im dargestellten Zeitraum fiel BNB von $699.25 auf $654.57, ein Rückgang von 6.39%.
Die jüngste abgeschlossene 4-Stunden-Kerze: Eröffnung $664.40 / Hoch $665.24 / Tief $650.01 / Schluss $654.57.
Jüngste Entwicklung laut Spotdaten: +0.15% über 1 Tag, −4.86% über 7 Tage und −11.89% über 30 Tage.
Technische Struktur
Auf Basis der Tagesindikatoren:
BNB liegt unter EMA 7: $689.06, EMA 25: $710.31 und EMA 99: $706.30.
Das untere Tages-Bollinger-Band liegt bei $662.93; der aktuelle Preis liegt darunter.
RSI 6: 33.06 und RSI 12: 36.75 signalisieren schwaches Momentum, jedoch keine so extremen Stundenwerte wie im gespeicherten Research-Bericht.
MACD DIF: −2.2973, im Einklang mit negativem Momentum.
Zu den beobachteten Chartmarken zählen das jüngste Tief nahe $650.01, das untere Tages-Bollinger-Band bei $662.93 und der EMA-Bereich um $689–$710. Dies sind historische Referenzwerte, keine Handelsanweisungen.
Kapitalflüsse und Research-Kontext
Der jüngste 4-Stunden-Block zu Kapitalflüssen großer Orders weist einen Nettozufluss von 1,402.49 BNB aus.
Der gespeicherte Research-Bericht beschreibt eine andere, frühere Momentaufnahme mit kumulierten Spot-Abflüssen von mehr als $25 Millionen und Verkäufen großer Orders von mehr als $11.5 Millionen im letzten Vier-Stunden-Abschnitt. Da sich die Momentaufnahmen und Zeitpunkte unterscheiden, würde ich sie nicht zu einem einzigen Flusssignal zusammenführen.
Der Bericht verzeichnete außerdem einen stündlichen RSI 6 von 5.39 und einen stündlichen RSI 12 von 14.55, was zum Zeitpunkt dieser Momentaufnahme auf eine deutlich extremere kurzfristige Erschöpfung hindeutete. Die neueren Tageswerte sind weniger extrem.
Community-Umfrage auf Binance Square
Die begrenzte Square-Umfrage zeigt:
Bärisch: 218 von 379 Stimmen, 57.5%
Bullisch: 161 von 379 Stimmen, 42.5%
Dies ist eine sich verändernde, begrenzte Stichprobe aus der Community – keine Messung der allgemeinen Marktstimmung und keine repräsentative Umfrage.
#BNB Smarte Analyse — BNBUSDT
Zusammenfassung: Die Chartstruktur bleibt schwach, obwohl die jüngste Bewegung über einen Tag nahezu unverändert ist. BNB wird unter seinen wichtigen gleitenden Tagesdurchschnitten gehandelt, während die Momentumindikatoren weiterhin schwach sind. Kurzfristig überverkaufte Werte bedeuten, dass die Volatilität erhöht bleiben kann; sie bestätigen keine Trendwende.
Chartanalyse
Aktueller Spotpreis: $655.50
24-Stunden-Spanne: $650.01–$689.30
4-Stunden-Chart: 59 abgeschlossene Kerzen, vom 2. bis 12. Nov. UTC
Im dargestellten Zeitraum fiel BNB von $699.25 auf $654.57, ein Rückgang von 6.39%.
Die jüngste abgeschlossene 4-Stunden-Kerze: Eröffnung $664.40 / Hoch $665.24 / Tief $650.01 / Schluss $654.57.
Jüngste Entwicklung laut Spotdaten: +0.15% über 1 Tag, −4.86% über 7 Tage und −11.89% über 30 Tage.
Technische Struktur
Auf Basis der Tagesindikatoren:
BNB liegt unter EMA 7: $689.06, EMA 25: $710.31 und EMA 99: $706.30.
Das untere Tages-Bollinger-Band liegt bei $662.93; der aktuelle Preis liegt darunter.
RSI 6: 33.06 und RSI 12: 36.75 signalisieren schwaches Momentum, jedoch keine so extremen Stundenwerte wie im gespeicherten Research-Bericht.
MACD DIF: −2.2973, im Einklang mit negativem Momentum.
Zu den beobachteten Chartmarken zählen das jüngste Tief nahe $650.01, das untere Tages-Bollinger-Band bei $662.93 und der EMA-Bereich um $689–$710. Dies sind historische Referenzwerte, keine Handelsanweisungen.
Kapitalflüsse und Research-Kontext
Der jüngste 4-Stunden-Block zu Kapitalflüssen großer Orders weist einen Nettozufluss von 1,402.49 BNB aus.
Der gespeicherte Research-Bericht beschreibt eine andere, frühere Momentaufnahme mit kumulierten Spot-Abflüssen von mehr als $25 Millionen und Verkäufen großer Orders von mehr als $11.5 Millionen im letzten Vier-Stunden-Abschnitt. Da sich die Momentaufnahmen und Zeitpunkte unterscheiden, würde ich sie nicht zu einem einzigen Flusssignal zusammenführen.
Der Bericht verzeichnete außerdem einen stündlichen RSI 6 von 5.39 und einen stündlichen RSI 12 von 14.55, was zum Zeitpunkt dieser Momentaufnahme auf eine deutlich extremere kurzfristige Erschöpfung hindeutete. Die neueren Tageswerte sind weniger extrem.
Community-Umfrage auf Binance Square
Die begrenzte Square-Umfrage zeigt:
Bärisch: 218 von 379 Stimmen, 57.5%
Bullisch: 161 von 379 Stimmen, 42.5%
Dies ist eine sich verändernde, begrenzte Stichprobe aus der Community – keine Messung der allgemeinen Marktstimmung und keine repräsentative Umfrage.
Zusammenfassung: Die Chartstruktur bleibt schwach, obwohl die jüngste Bewegung über einen Tag nahezu unverändert ist. BNB wird unter seinen wichtigen gleitenden Tagesdurchschnitten gehandelt, während die Momentumindikatoren weiterhin schwach sind. Kurzfristig überverkaufte Werte bedeuten, dass die Volatilität erhöht bleiben kann; sie bestätigen keine Trendwende.
Chartanalyse
Aktueller Spotpreis: $655.50
24-Stunden-Spanne: $650.01–$689.30
4-Stunden-Chart: 59 abgeschlossene Kerzen, vom 2. bis 12. Nov. UTC
Im dargestellten Zeitraum fiel BNB von $699.25 auf $654.57, ein Rückgang von 6.39%.
Die jüngste abgeschlossene 4-Stunden-Kerze: Eröffnung $664.40 / Hoch $665.24 / Tief $650.01 / Schluss $654.57.
Jüngste Entwicklung laut Spotdaten: +0.15% über 1 Tag, −4.86% über 7 Tage und −11.89% über 30 Tage.
Technische Struktur
Auf Basis der Tagesindikatoren:
BNB liegt unter EMA 7: $689.06, EMA 25: $710.31 und EMA 99: $706.30.
Das untere Tages-Bollinger-Band liegt bei $662.93; der aktuelle Preis liegt darunter.
RSI 6: 33.06 und RSI 12: 36.75 signalisieren schwaches Momentum, jedoch keine so extremen Stundenwerte wie im gespeicherten Research-Bericht.
MACD DIF: −2.2973, im Einklang mit negativem Momentum.
Zu den beobachteten Chartmarken zählen das jüngste Tief nahe $650.01, das untere Tages-Bollinger-Band bei $662.93 und der EMA-Bereich um $689–$710. Dies sind historische Referenzwerte, keine Handelsanweisungen.
Kapitalflüsse und Research-Kontext
Der jüngste 4-Stunden-Block zu Kapitalflüssen großer Orders weist einen Nettozufluss von 1,402.49 BNB aus.
Der gespeicherte Research-Bericht beschreibt eine andere, frühere Momentaufnahme mit kumulierten Spot-Abflüssen von mehr als $25 Millionen und Verkäufen großer Orders von mehr als $11.5 Millionen im letzten Vier-Stunden-Abschnitt. Da sich die Momentaufnahmen und Zeitpunkte unterscheiden, würde ich sie nicht zu einem einzigen Flusssignal zusammenführen.
Der Bericht verzeichnete außerdem einen stündlichen RSI 6 von 5.39 und einen stündlichen RSI 12 von 14.55, was zum Zeitpunkt dieser Momentaufnahme auf eine deutlich extremere kurzfristige Erschöpfung hindeutete. Die neueren Tageswerte sind weniger extrem.
Community-Umfrage auf Binance Square
Die begrenzte Square-Umfrage zeigt:
Bärisch: 218 von 379 Stimmen, 57.5%
Bullisch: 161 von 379 Stimmen, 42.5%
Dies ist eine sich verändernde, begrenzte Stichprobe aus der Community – keine Messung der allgemeinen Marktstimmung und keine repräsentative Umfrage.
59
·
--
Übersetzung ansehen
211
·
--
Übersetzung ansehen
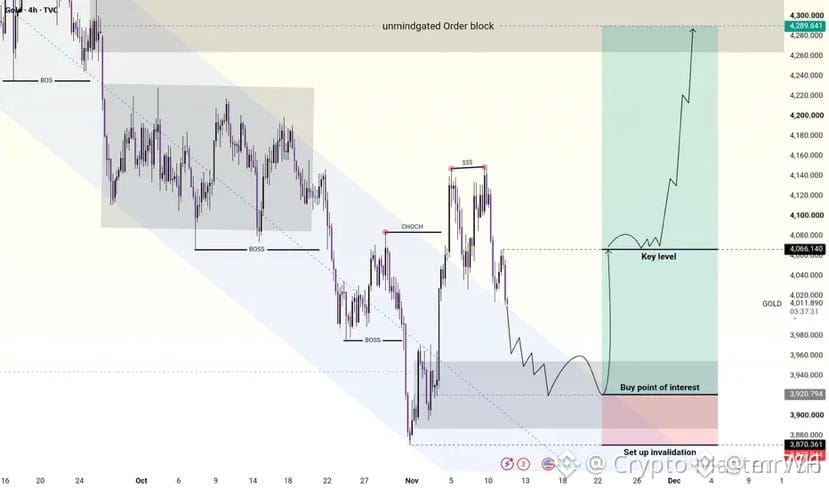
$XAU – Bullish Recovery Ahead? 3,000 Pips in Focus‼️
Attention Traders! Gold is showing bearish pressure near $4,012, with a potential buying opportunity around the $3,920–$3,950 support zone.
If buyers defend this area and reclaim $4,066, Gold could recover toward $4,200–$4,290. A break below $3,870 would weaken the bullish outlook.
What do you think, Fam? Is Gold preparing for a major comeback???
{future}(XAUUSDT)
$XAU – Bullish Recovery Ahead? 3,000 Pips in Focus‼️
Attention Traders! Gold is showing bearish pressure near $4,012, with a potential buying opportunity around the $3,920–$3,950 support zone.
If buyers defend this area and reclaim $4,066, Gold could recover toward $4,200–$4,290. A break below $3,870 would weaken the bullish outlook.
What do you think, Fam? Is Gold preparing for a major comeback???
Attention Traders! Gold is showing bearish pressure near $4,012, with a potential buying opportunity around the $3,920–$3,950 support zone.
If buyers defend this area and reclaim $4,066, Gold could recover toward $4,200–$4,290. A break below $3,870 would weaken the bullish outlook.
What do you think, Fam? Is Gold preparing for a major comeback???
28
·
--
Übersetzung ansehen
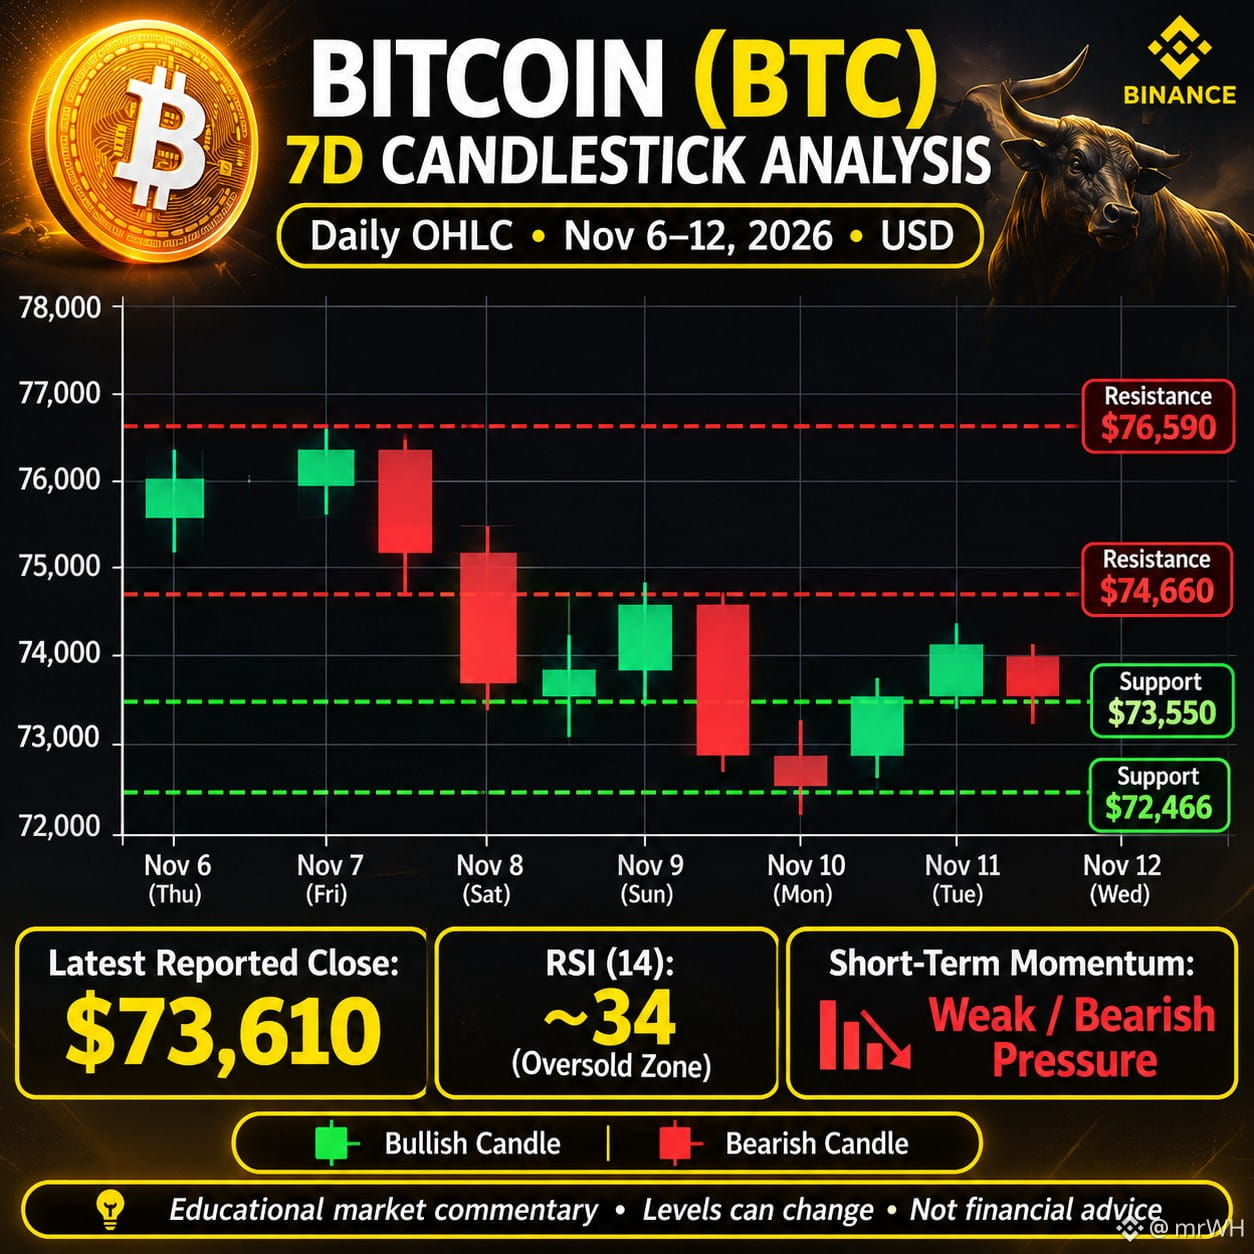
$BTC is facing selling pressure around $73,600. The short-term trend remains weak, with price trading below most major daily moving averages. RSI near 34 suggests weak momentum, although a short-term rebound remains possible.
Key technical levels
Support 1: $73,550
Support 2: $72,466
Resistance 1: $74,660
Resistance 2: $76,590
A sustained move above $74,660 could improve the short-term outlook, while a break below $73,550 could increase downside pressure.
#BTC #AnthropicRejectsIPODelayValuationinQuestion
{spot}(BTCUSDT)
$BTC is facing selling pressure around $73,600. The short-term trend remains weak, with price trading below most major daily moving averages. RSI near 34 suggests weak momentum, although a short-term rebound remains possible.
Key technical levels
Support 1: $73,550
Support 2: $72,466
Resistance 1: $74,660
Resistance 2: $76,590
A sustained move above $74,660 could improve the short-term outlook, while a break below $73,550 could increase downside pressure.
#BTC #AnthropicRejectsIPODelayValuationinQuestion
Key technical levels
Support 1: $73,550
Support 2: $72,466
Resistance 1: $74,660
Resistance 2: $76,590
A sustained move above $74,660 could improve the short-term outlook, while a break below $73,550 could increase downside pressure.
#BTC #AnthropicRejectsIPODelayValuationinQuestion
44
·
--
Übersetzung ansehen
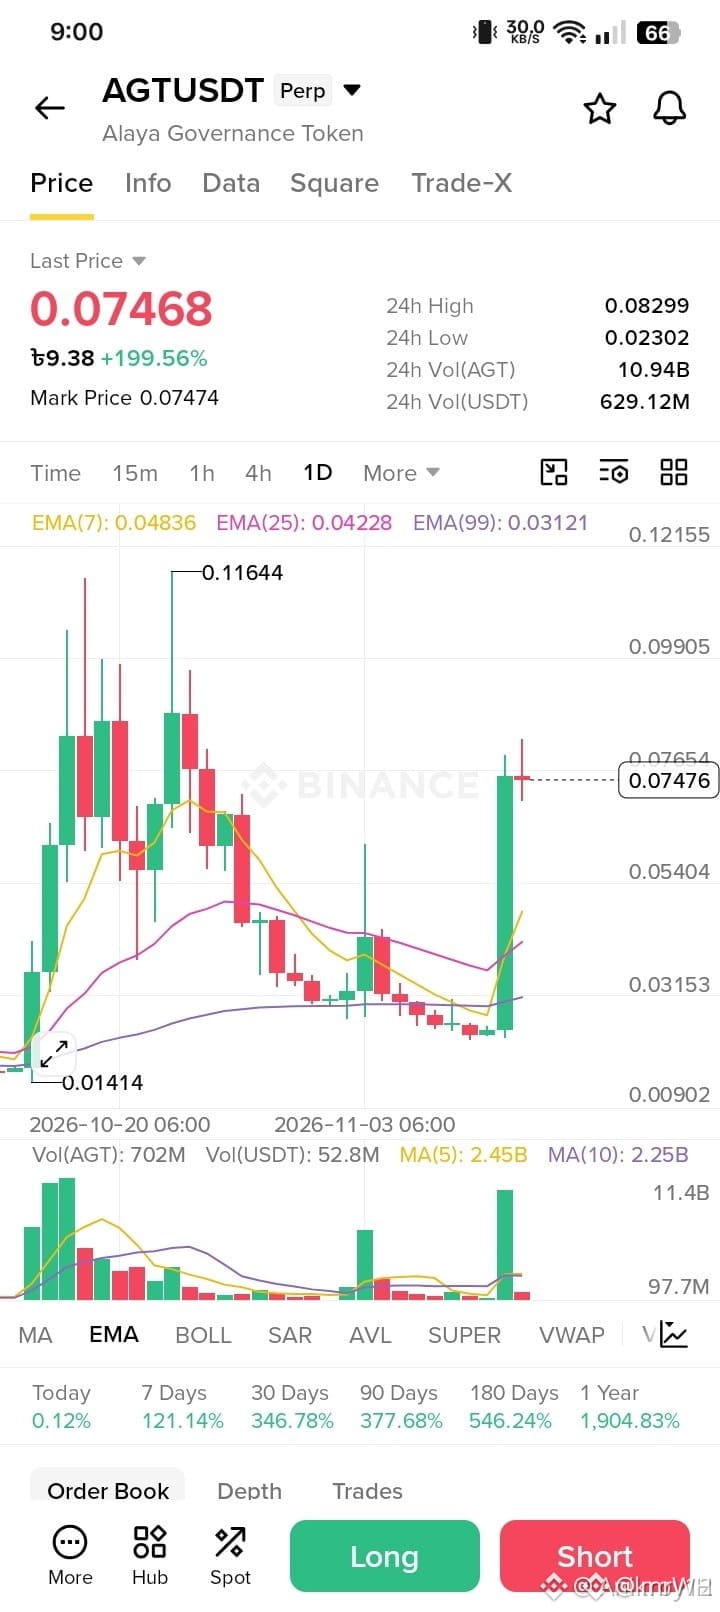
🚨 $AGT — DON'T IGNORE THE MARKET SIGNAL! 📉⚠️
What is happening with $AGT ? 👀
A sudden pump doesn't always mean a strong recovery. Sometimes the market moves up fast, then surprises everyone with a sharp correction! ☠️
Is this a real bullish move, or just a temporary pump before another drop? 🤔
Stay alert, protect your profits, and never make decisions based on hype alone.
💬 What's your opinion on $AGT ?
Are you BULLISH or BEARISH?
@IJ @JJ__ @_BH @hd @I_G
Let's discuss! 🔥
#AGT #CryptoMarket #trading #BinanceSquareFamily #AnthropicRejectsIPODelayValuationinQuestion
{spot}(TRXUSDT)
{future}(AGTUSDT)
{spot}(PEPEUSDT)
🚨 $AGT — DON'T IGNORE THE MARKET SIGNAL! 📉⚠️
What is happening with $AGT ? 👀
A sudden pump doesn't always mean a strong recovery. Sometimes the market moves up fast, then surprises everyone with a sharp correction! ☠️
Is this a real bullish move, or just a temporary pump before another drop? 🤔
Stay alert, protect your profits, and never make decisions based on hype alone.
💬 What's your opinion on $AGT ?
Are you BULLISH or BEARISH?
@IJ @JJ__ @_BH @hd @I_G
Let's discuss! 🔥
#AGT #CryptoMarket #trading #BinanceSquareFamily #AnthropicRejectsIPODelayValuationinQuestion
What is happening with $AGT ? 👀
A sudden pump doesn't always mean a strong recovery. Sometimes the market moves up fast, then surprises everyone with a sharp correction! ☠️
Is this a real bullish move, or just a temporary pump before another drop? 🤔
Stay alert, protect your profits, and never make decisions based on hype alone.
💬 What's your opinion on $AGT ?
Are you BULLISH or BEARISH?
@IJ @JJ__ @_BH @hd @I_G
Let's discuss! 🔥
#AGT #CryptoMarket #trading #BinanceSquareFamily #AnthropicRejectsIPODelayValuationinQuestion

53
·
--
Übersetzung ansehen
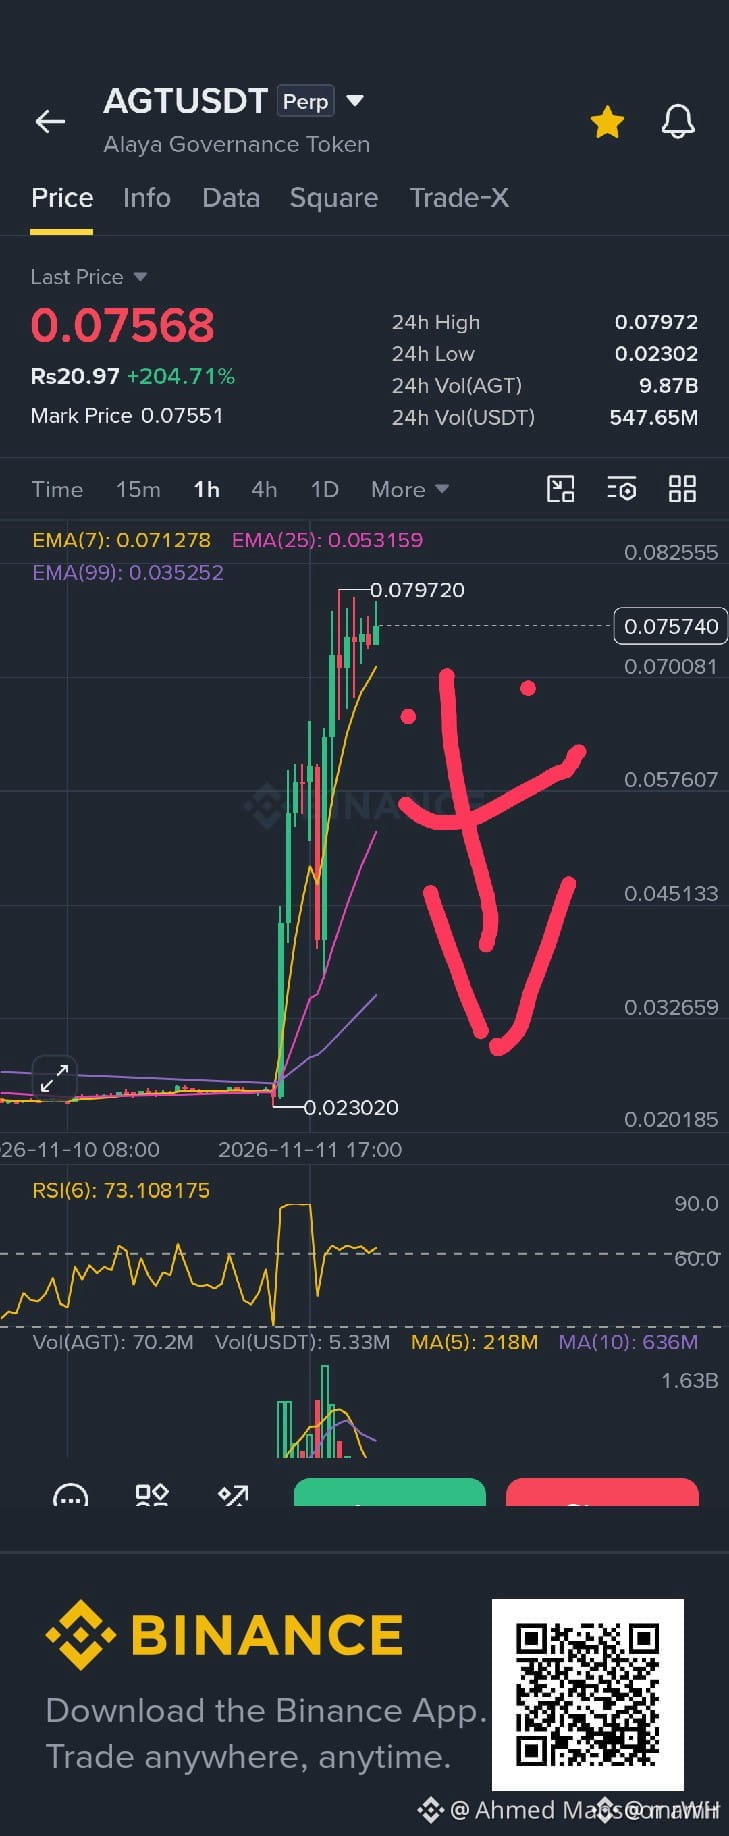
$AGT no power leftover from here any time this coin is going back 🔙 to 🏠 home 🏡🏡
lets drop him to his home with me short this
$AGT
#BinanceSquareTalks #AGT
{future}(AGTUSDT)
$AGT no power leftover from here any time this coin is going back 🔙 to 🏠 home 🏡🏡
lets drop him to his home with me short this
$AGT
#BinanceSquareTalks #AGT
lets drop him to his home with me short this
$AGT
#BinanceSquareTalks #AGT
76
·
--
Übersetzung ansehen
CPI at 0.4% Broke Bitcoin’s $73,000 Floor. What Happens if the Fed Goes Bigger? X
{spot}(BTCUSDT)
CPI at 0.4% Broke Bitcoin’s $73,000 Floor. What Happens if the Fed Goes Bigger? X
70
·
--
Übersetzung ansehen
Everyone is talking about Anthropic's IPO right now, but honestly, 1$ Trillion+ valuation in this market feels insane to me 🤯
Tech stocks just got battered this week and Nasdaq took a heavy hit, yet Anthropic is aiming for a record-breaking debut on Nasdaq.
On one side, revenue growth is massive. On the other side, data-center infrastructure costs are eating up margins fast and regulators are watching closely.
I'm torn on this one—does this turn out like the SpaceX listing momentum, or do we see a massive reality check on day one?
What’s your play here, long term hold or quick short? Drop your thoughts below 👇 $ANTHROPIC | $SPCX
{future}(ANTHROPICUSDT)
{future}(SPCXUSDT)
#AnthropicIPO进展
Everyone is talking about Anthropic's IPO right now, but honestly, 1$ Trillion+ valuation in this market feels insane to me 🤯
Tech stocks just got battered this week and Nasdaq took a heavy hit, yet Anthropic is aiming for a record-breaking debut on Nasdaq.
On one side, revenue growth is massive. On the other side, data-center infrastructure costs are eating up margins fast and regulators are watching closely.
I'm torn on this one—does this turn out like the SpaceX listing momentum, or do we see a massive reality check on day one?
What’s your play here, long term hold or quick short? Drop your thoughts below 👇 $ANTHROPIC | $SPCX
#AnthropicIPO进展
Tech stocks just got battered this week and Nasdaq took a heavy hit, yet Anthropic is aiming for a record-breaking debut on Nasdaq.
On one side, revenue growth is massive. On the other side, data-center infrastructure costs are eating up margins fast and regulators are watching closely.
I'm torn on this one—does this turn out like the SpaceX listing momentum, or do we see a massive reality check on day one?
What’s your play here, long term hold or quick short? Drop your thoughts below 👇 $ANTHROPIC | $SPCX
#AnthropicIPO进展

25
·
--
Mal sehen, ob $SOL diesmal bis morgen früh wieder auf $75 fallen kann. Was meinst du?
{spot}(SOLUSDT)
Mal sehen, ob $SOL diesmal bis morgen früh wieder auf $75 fallen kann. Was meinst du?
1
1
201
·
--
Übersetzung ansehen
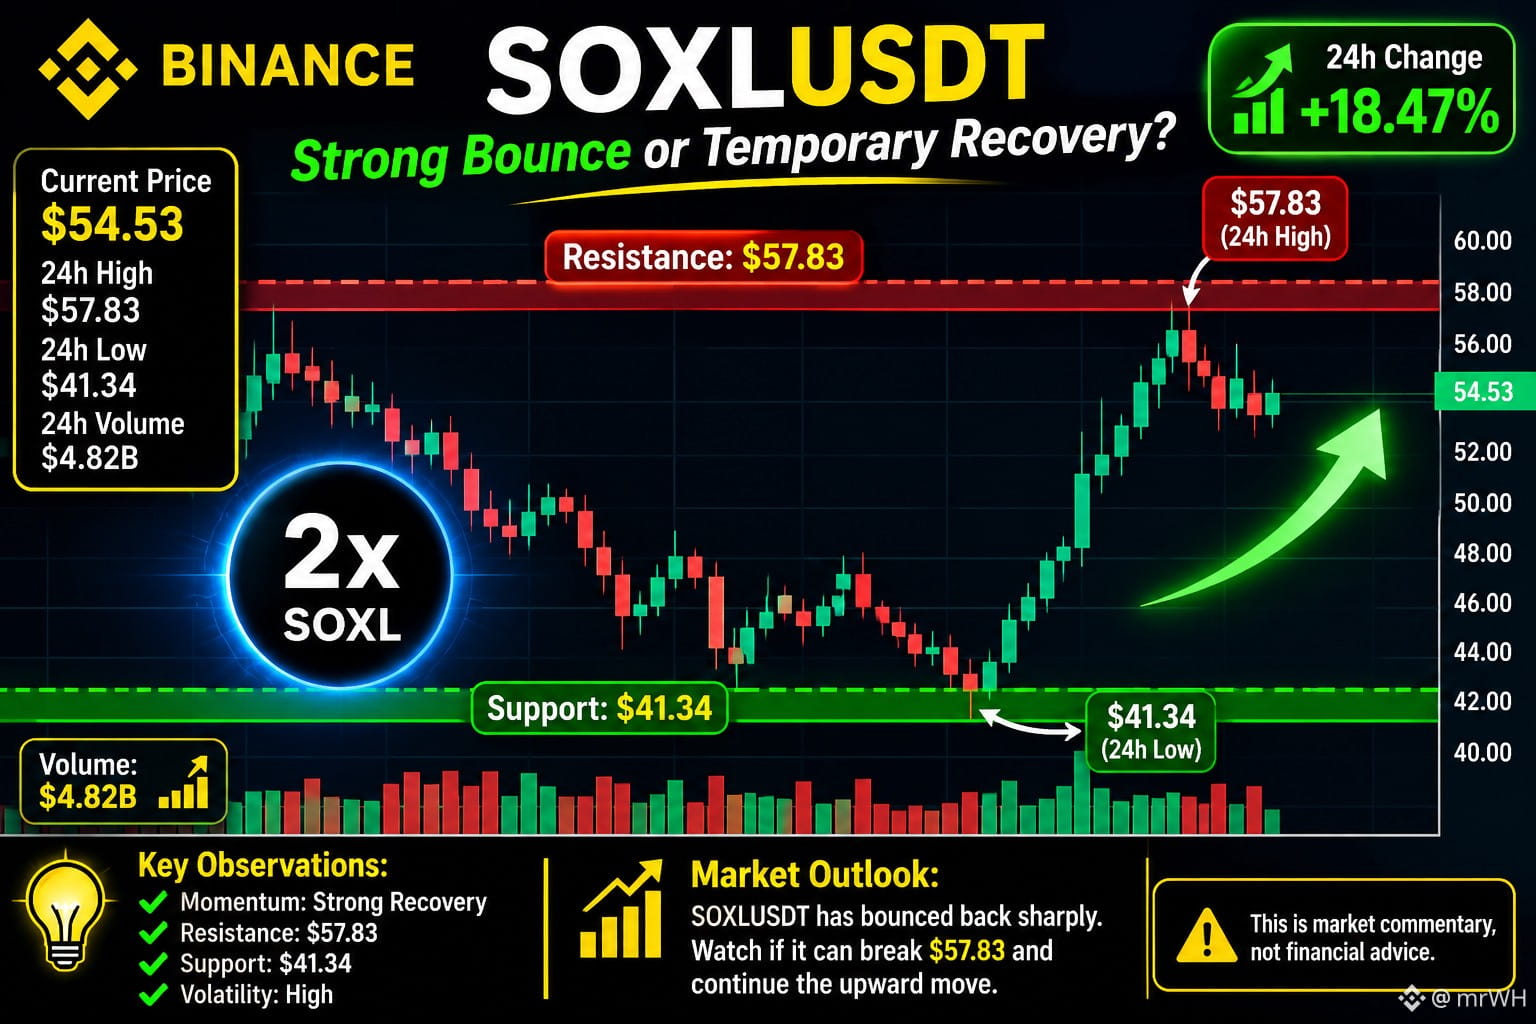
🚀 SOXLUSDT – Strong Bounce or Temporary Recovery?
SOXLUSDT is showing a sharp recovery, gaining approximately 18.47% in 24 hours. However, recent volatility and selling pressure make the next price movement important.
📊 Market Analysis – November 10, 2026
Current Price: $54.53
24H High: $57.83
24H Low: $41.34
24H Change: +18.47%
24H Volume: $4.82B
Key Observations:
Momentum: Strong recovery
Resistance: $57.83
Support: $41.34
Volatility: High
{future}(SOXLUSDT)
🚀 SOXLUSDT – Strong Bounce or Temporary Recovery?
SOXLUSDT is showing a sharp recovery, gaining approximately 18.47% in 24 hours. However, recent volatility and selling pressure make the next price movement important.
📊 Market Analysis – November 10, 2026
Current Price: $54.53
24H High: $57.83
24H Low: $41.34
24H Change: +18.47%
24H Volume: $4.82B
Key Observations:
Momentum: Strong recovery
Resistance: $57.83
Support: $41.34
Volatility: High
SOXLUSDT is showing a sharp recovery, gaining approximately 18.47% in 24 hours. However, recent volatility and selling pressure make the next price movement important.
📊 Market Analysis – November 10, 2026
Current Price: $54.53
24H High: $57.83
24H Low: $41.34
24H Change: +18.47%
24H Volume: $4.82B
Key Observations:
Momentum: Strong recovery
Resistance: $57.83
Support: $41.34
Volatility: High
362
·
--
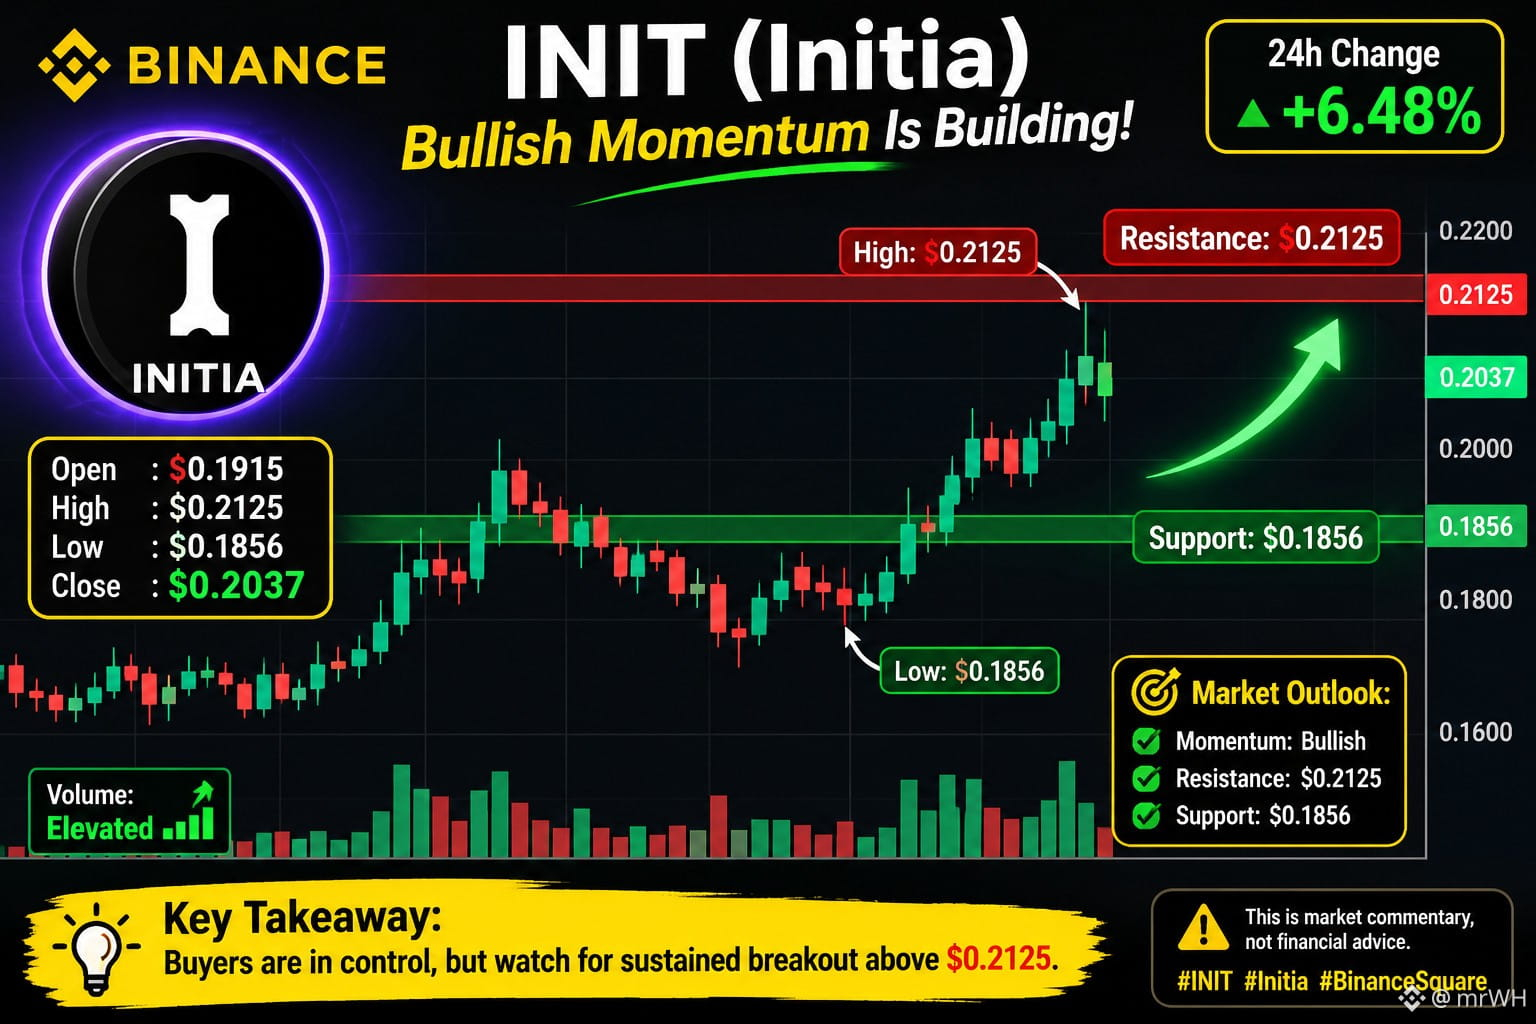
🚀 INIT (Initia) – Die bullische Dynamik nimmt zu!
INIT zeigt eine starke bullische Dynamik, mit zunehmender Handelsaktivität und einer deutlichen Kurserholung.
📊 Tägliche Candlestick-Analyse (10. Nov.)
Eröffnung: $0.1915
Höchstkurs: $0.2125
Tiefstkurs: $0.1856
Schlusskurs: $0.2037
Tagesveränderung: +6.48%
Marktausblick:
Dynamik: Bullisch
Widerstand: $0.2125
Unterstützung: $0.1856
Volumen: Erhöht
{spot}(INITUSDT)
🚀 INIT (Initia) – Die bullische Dynamik nimmt zu!
INIT zeigt eine starke bullische Dynamik, mit zunehmender Handelsaktivität und einer deutlichen Kurserholung.
📊 Tägliche Candlestick-Analyse (10. Nov.)
Eröffnung: $0.1915
Höchstkurs: $0.2125
Tiefstkurs: $0.1856
Schlusskurs: $0.2037
Tagesveränderung: +6.48%
Marktausblick:
Dynamik: Bullisch
Widerstand: $0.2125
Unterstützung: $0.1856
Volumen: Erhöht
INIT zeigt eine starke bullische Dynamik, mit zunehmender Handelsaktivität und einer deutlichen Kurserholung.
📊 Tägliche Candlestick-Analyse (10. Nov.)
Eröffnung: $0.1915
Höchstkurs: $0.2125
Tiefstkurs: $0.1856
Schlusskurs: $0.2037
Tagesveränderung: +6.48%
Marktausblick:
Dynamik: Bullisch
Widerstand: $0.2125
Unterstützung: $0.1856
Volumen: Erhöht
166
·
--
Übersetzung ansehen
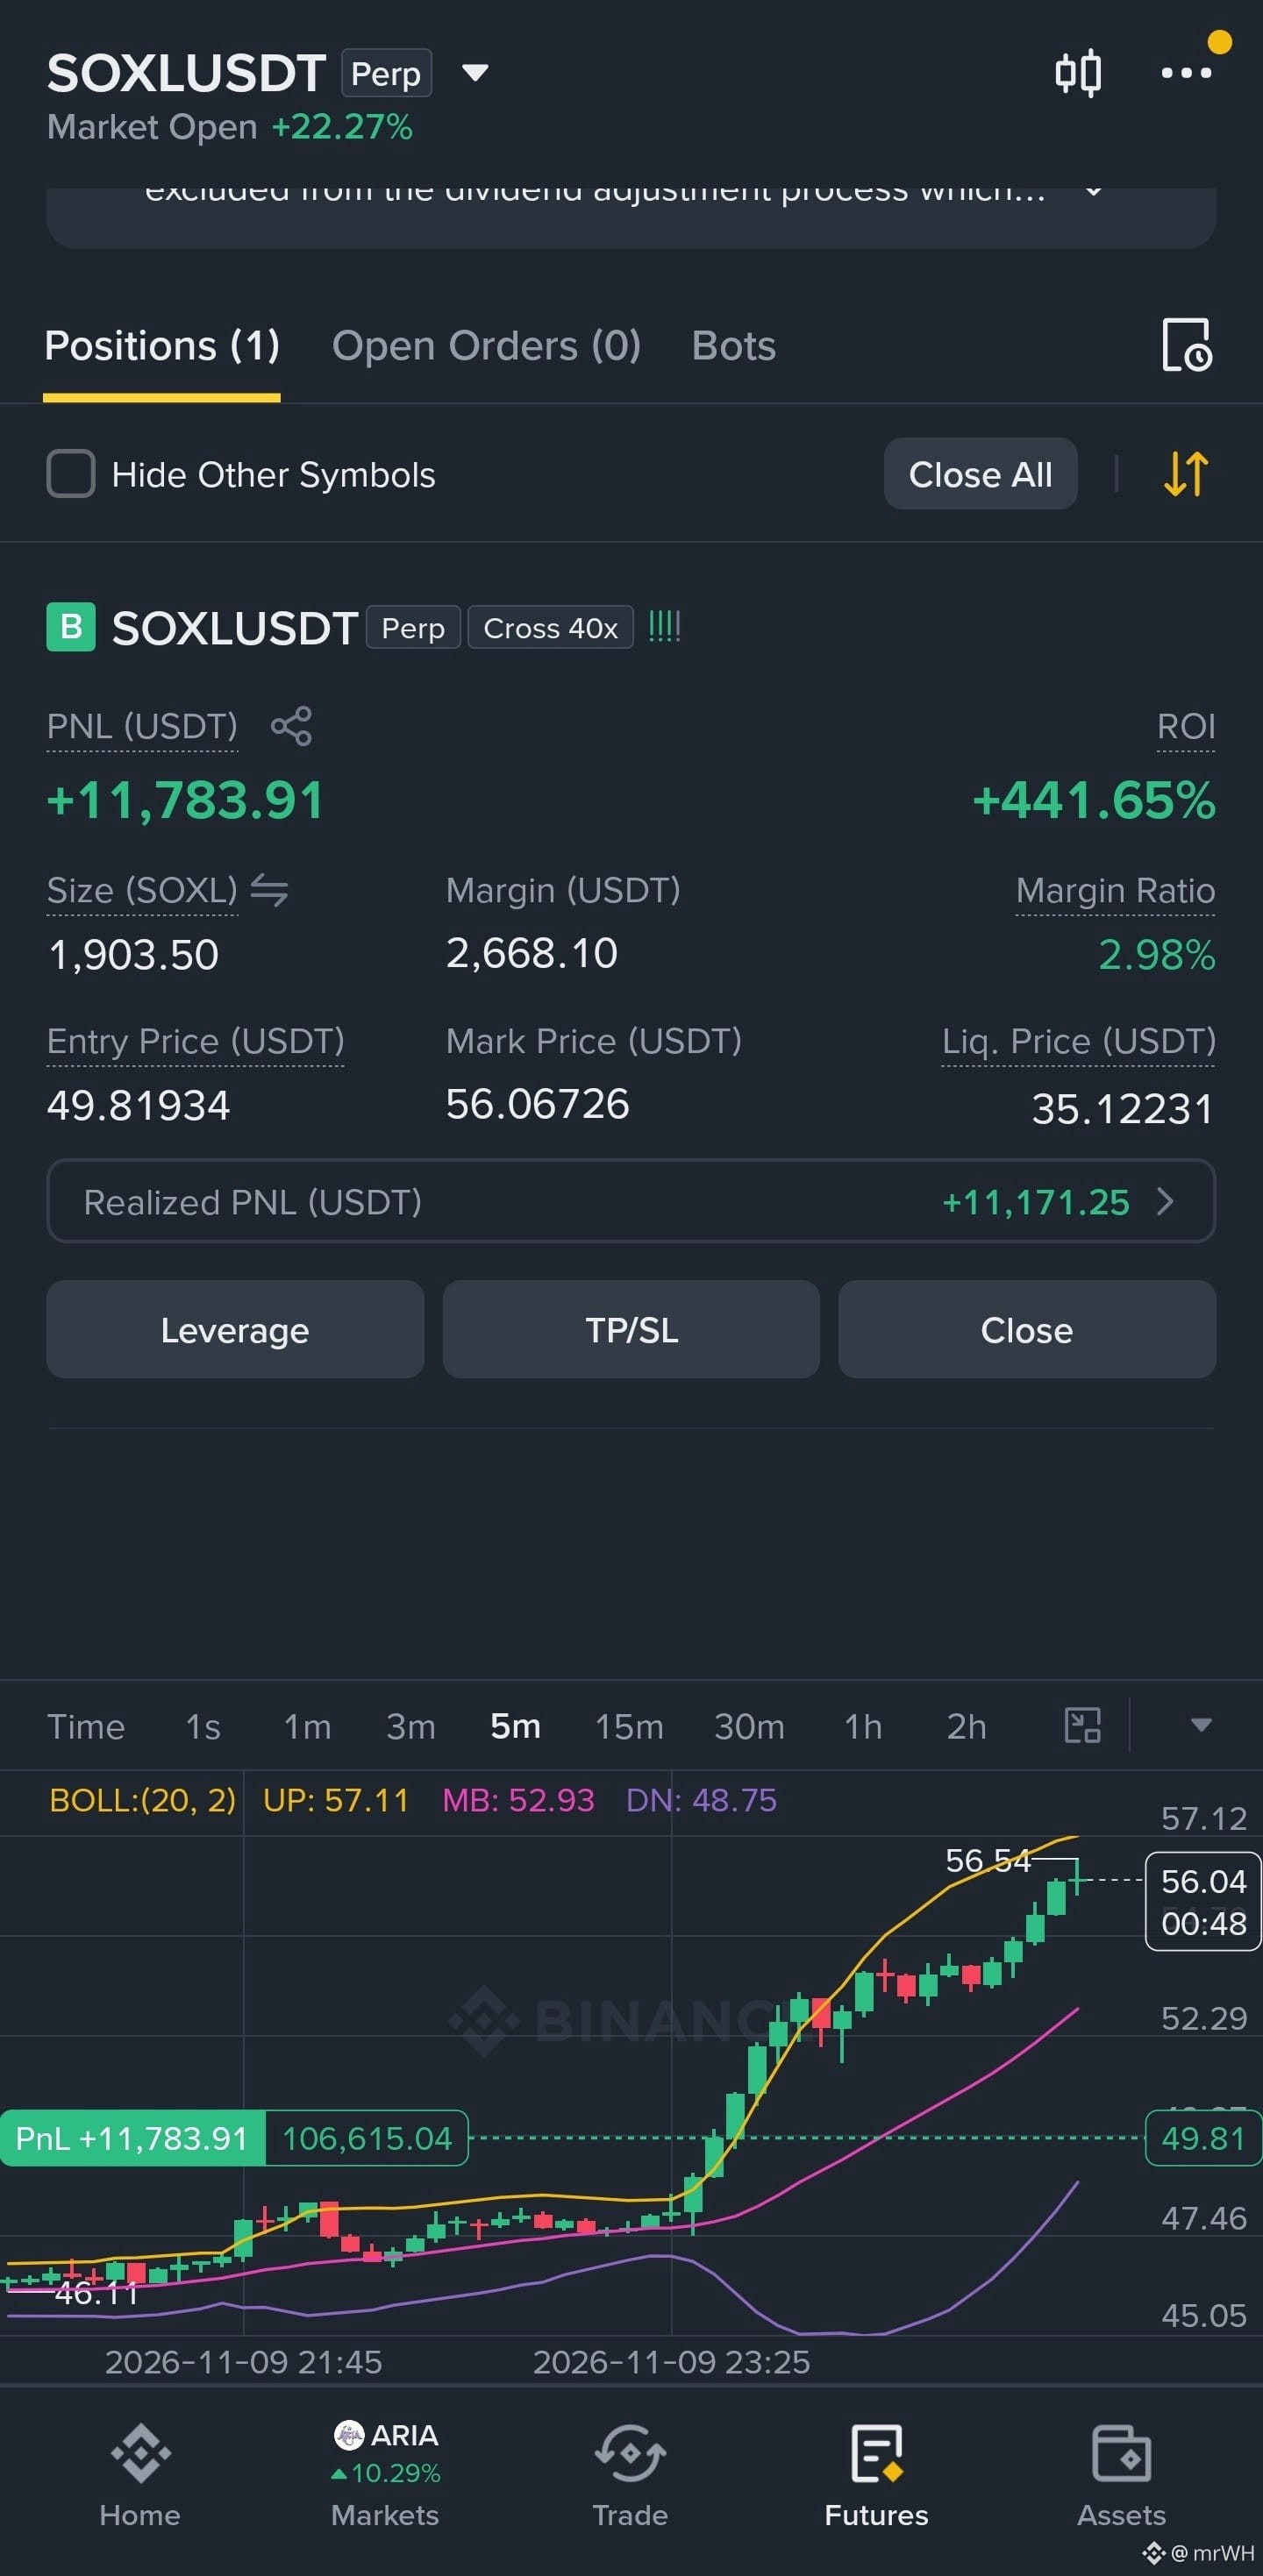
$SOXL I said I would take revenge for the losses I incurred earlier today!!?! 😉 I took 50% profit first.
{future}(SOXLUSDT)
$SOXL I said I would take revenge for the losses I incurred earlier today!!?! 😉 I took 50% profit first.
105
Anmelden und weiter Inhalte entdecken
Krypto-Nutzer weltweit auf Binance Square kennenlernen
⚡️ Bleib in Sachen Krypto stets am Puls.
💬 Die weltgrößte Kryptobörse vertraut darauf.
👍 Erhalte verlässliche Einblicke von verifizierten Creators.
E-Mail-Adresse/Telefonnummer
Trendthemen
HuangExitNvidiaStrategyInFocus
107,148 Aufrufe
1,168 Kommentare
AKTIEN | Nvidias Jensen Huang tritt zurück, Colette Kress zur Interims-CEO ernannt
Binance News
·31 Likes
·37.9k Aufrufe
AnthropicRejectsIPODelayValuationinQuestion
713,631 Aufrufe
5,384 Kommentare
HedgeFundsCMEBitcoinNetShortsFall89%
458 Aufrufe
33 Kommentare