
AMRIA BIBI
8 Beiträge

AMRIA BIBI
Melden
Nutzer blockieren
Trade eröffnen
Gelegenheitstrader
1.4 Jahre
4 Following
11 Follower
12 Like gegeben
Beiträge
Portfolio
·
--
Übersetzung ansehen
$ETH #BTCVSGOLD #WriteToEarnUpgrade #BinanceBlockchainWeek #USJobsData #CPIWatch
{spot}(ETHUSDT)
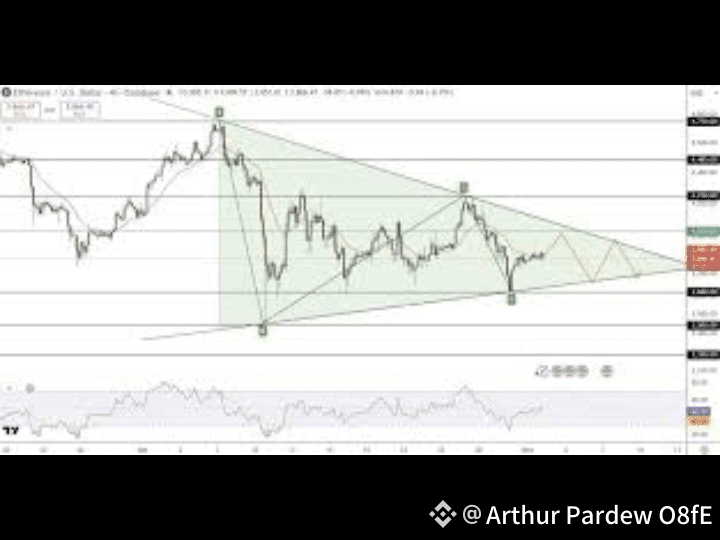
ka current price ~ $3,374 tak report hua hai.
Kuch analyses suggest karte hain ke agle kuch dino mein price $3,450–$3,750 tak ja sakti hai, agar momentum bana rahe.
---
🔎 Technical Signals & Market Sentiment
Kuch technical indicators (jaise moving averages on daily/weekly) currently bullish setup dikha rahe hain — short-term trend (5D, 10D MA) aur long-term MA (50D, 200D) dono ne buy signals diye hain.
Daily RSI around neutral (~50-55) hai — matlab abhi over-bought ya over-sold nahi hai, market consolidation mode mein ho sakti hai.
Agar ETH $3,300–$3,400 resistance level cross kar le, to bulls ka target agla zone $3,700–$3,800 ho sakta hai.
Magar agar support levels fail ho gaye (around $2,800–$2,950), to downside risk bhi hai — kuch analysts $2,600–$2,700 tak potential dip mention karte hain.
---
🧭 Fundamentals & Broader Drivers
ETH ka ecosystem ab tak robust hai; network upgrades aur Layer-2 adoption se long-term fundamentals strong hain.
Institutional interest (whale longs, futures open interest) ne recently rally ko support diya hai — yeh signal deta hai ke large investors abhi ETH ko under-valuation nahi samajh rahe.
Kuch aggressive bullish forecasts hain jo year-end ya coming months ke liye $5,000+ ya even $7,000+ tak ke targets suggest karte hain — lekin yeh kaafi speculative hain aur strong breakout ke depend karte hain.
$ETH #BTCVSGOLD #WriteToEarnUpgrade #BinanceBlockchainWeek #USJobsData #CPIWatch
ka current price ~ $3,374 tak report hua hai.
Kuch analyses suggest karte hain ke agle kuch dino mein price $3,450–$3,750 tak ja sakti hai, agar momentum bana rahe.
---
🔎 Technical Signals & Market Sentiment
Kuch technical indicators (jaise moving averages on daily/weekly) currently bullish setup dikha rahe hain — short-term trend (5D, 10D MA) aur long-term MA (50D, 200D) dono ne buy signals diye hain.
Daily RSI around neutral (~50-55) hai — matlab abhi over-bought ya over-sold nahi hai, market consolidation mode mein ho sakti hai.
Agar ETH $3,300–$3,400 resistance level cross kar le, to bulls ka target agla zone $3,700–$3,800 ho sakta hai.
Magar agar support levels fail ho gaye (around $2,800–$2,950), to downside risk bhi hai — kuch analysts $2,600–$2,700 tak potential dip mention karte hain.
---
🧭 Fundamentals & Broader Drivers
ETH ka ecosystem ab tak robust hai; network upgrades aur Layer-2 adoption se long-term fundamentals strong hain.
Institutional interest (whale longs, futures open interest) ne recently rally ko support diya hai — yeh signal deta hai ke large investors abhi ETH ko under-valuation nahi samajh rahe.
Kuch aggressive bullish forecasts hain jo year-end ya coming months ke liye $5,000+ ya even $7,000+ tak ke targets suggest karte hain — lekin yeh kaafi speculative hain aur strong breakout ke depend karte hain.
ka current price ~ $3,374 tak report hua hai.
Kuch analyses suggest karte hain ke agle kuch dino mein price $3,450–$3,750 tak ja sakti hai, agar momentum bana rahe.
---
🔎 Technical Signals & Market Sentiment
Kuch technical indicators (jaise moving averages on daily/weekly) currently bullish setup dikha rahe hain — short-term trend (5D, 10D MA) aur long-term MA (50D, 200D) dono ne buy signals diye hain.
Daily RSI around neutral (~50-55) hai — matlab abhi over-bought ya over-sold nahi hai, market consolidation mode mein ho sakti hai.
Agar ETH $3,300–$3,400 resistance level cross kar le, to bulls ka target agla zone $3,700–$3,800 ho sakta hai.
Magar agar support levels fail ho gaye (around $2,800–$2,950), to downside risk bhi hai — kuch analysts $2,600–$2,700 tak potential dip mention karte hain.
---
🧭 Fundamentals & Broader Drivers
ETH ka ecosystem ab tak robust hai; network upgrades aur Layer-2 adoption se long-term fundamentals strong hain.
Institutional interest (whale longs, futures open interest) ne recently rally ko support diya hai — yeh signal deta hai ke large investors abhi ETH ko under-valuation nahi samajh rahe.
Kuch aggressive bullish forecasts hain jo year-end ya coming months ke liye $5,000+ ya even $7,000+ tak ke targets suggest karte hain — lekin yeh kaafi speculative hain aur strong breakout ke depend karte hain.
41
·
--
Übersetzung ansehen
$BTC
{spot}(BTCUSDT)
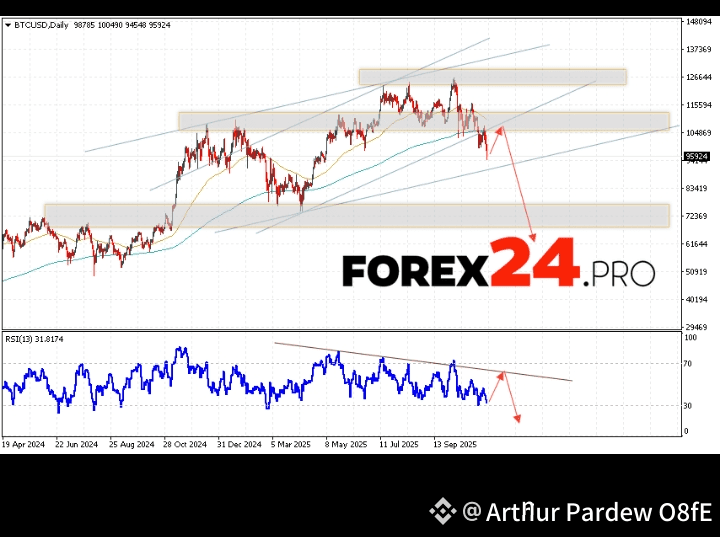
#StrategyBTCPurchase #MarketPullback #ProjectCrypto #CPIWatch #CFTCCryptoSprint Bitcoin (BTC) Latest Analysis – November 2025
---
🔍 Current Technical Picture
1. Key Support & Resistance
Support is forming around $107K–$110K, which is a critical zone.
On the upside, BTC is facing resistance near $120K–$125K.
2. Moving Averages & Momentum
According to LiteFinance, BTC is holding above the 200-day SMA (~$103,200) which is a long-term bullish signal.
MACD has turned upward, supporting a potential bullish continuation.
However, a breach below long-term levels could risk further downside; some analyses point to further weakness if BTC gets below its 200-day MA.
3. Pattern & Structure
There’s talk of a double-bottom around $106K–$108K, which could be setting BTC up for a bounce.
Alternatively, the current consolidation may be a mid-cycle rest rather than a major top or a reversal.
---
📈 Price Forecasts & Scenarios
Bullish Case:
According to Blockchain.News, BTC could rally to $138,183 in the near term if it breaks key resistance.
Moderate Bull Base:
Analysts cited by Coin Edition expect a breakout to ~$115K, driven by historically bullish November seasonality and increasing institutional accumulation.
Bearish Risks:
If BTC fails to hold its support zone, it could drop to ~$94,200, according to Katie Stockton (Fairlead Strategies).
CoinCodex’s model shows current sentiment is leaning bearish, with several indicators pointing to downside
$BTC
#StrategyBTCPurchase #MarketPullback #ProjectCrypto #CPIWatch #CFTCCryptoSprint Bitcoin (BTC) Latest Analysis – November 2025
---
🔍 Current Technical Picture
1. Key Support & Resistance
Support is forming around $107K–$110K, which is a critical zone.
On the upside, BTC is facing resistance near $120K–$125K.
2. Moving Averages & Momentum
According to LiteFinance, BTC is holding above the 200-day SMA (~$103,200) which is a long-term bullish signal.
MACD has turned upward, supporting a potential bullish continuation.
However, a breach below long-term levels could risk further downside; some analyses point to further weakness if BTC gets below its 200-day MA.
3. Pattern & Structure
There’s talk of a double-bottom around $106K–$108K, which could be setting BTC up for a bounce.
Alternatively, the current consolidation may be a mid-cycle rest rather than a major top or a reversal.
---
📈 Price Forecasts & Scenarios
Bullish Case:
According to Blockchain.News, BTC could rally to $138,183 in the near term if it breaks key resistance.
Moderate Bull Base:
Analysts cited by Coin Edition expect a breakout to ~$115K, driven by historically bullish November seasonality and increasing institutional accumulation.
Bearish Risks:
If BTC fails to hold its support zone, it could drop to ~$94,200, according to Katie Stockton (Fairlead Strategies).
CoinCodex’s model shows current sentiment is leaning bearish, with several indicators pointing to downside
#StrategyBTCPurchase #MarketPullback #ProjectCrypto #CPIWatch #CFTCCryptoSprint Bitcoin (BTC) Latest Analysis – November 2025
---
🔍 Current Technical Picture
1. Key Support & Resistance
Support is forming around $107K–$110K, which is a critical zone.
On the upside, BTC is facing resistance near $120K–$125K.
2. Moving Averages & Momentum
According to LiteFinance, BTC is holding above the 200-day SMA (~$103,200) which is a long-term bullish signal.
MACD has turned upward, supporting a potential bullish continuation.
However, a breach below long-term levels could risk further downside; some analyses point to further weakness if BTC gets below its 200-day MA.
3. Pattern & Structure
There’s talk of a double-bottom around $106K–$108K, which could be setting BTC up for a bounce.
Alternatively, the current consolidation may be a mid-cycle rest rather than a major top or a reversal.
---
📈 Price Forecasts & Scenarios
Bullish Case:
According to Blockchain.News, BTC could rally to $138,183 in the near term if it breaks key resistance.
Moderate Bull Base:
Analysts cited by Coin Edition expect a breakout to ~$115K, driven by historically bullish November seasonality and increasing institutional accumulation.
Bearish Risks:
If BTC fails to hold its support zone, it could drop to ~$94,200, according to Katie Stockton (Fairlead Strategies).
CoinCodex’s model shows current sentiment is leaning bearish, with several indicators pointing to downside
2
36
·
--
$XRP
{spot}(XRPUSDT)
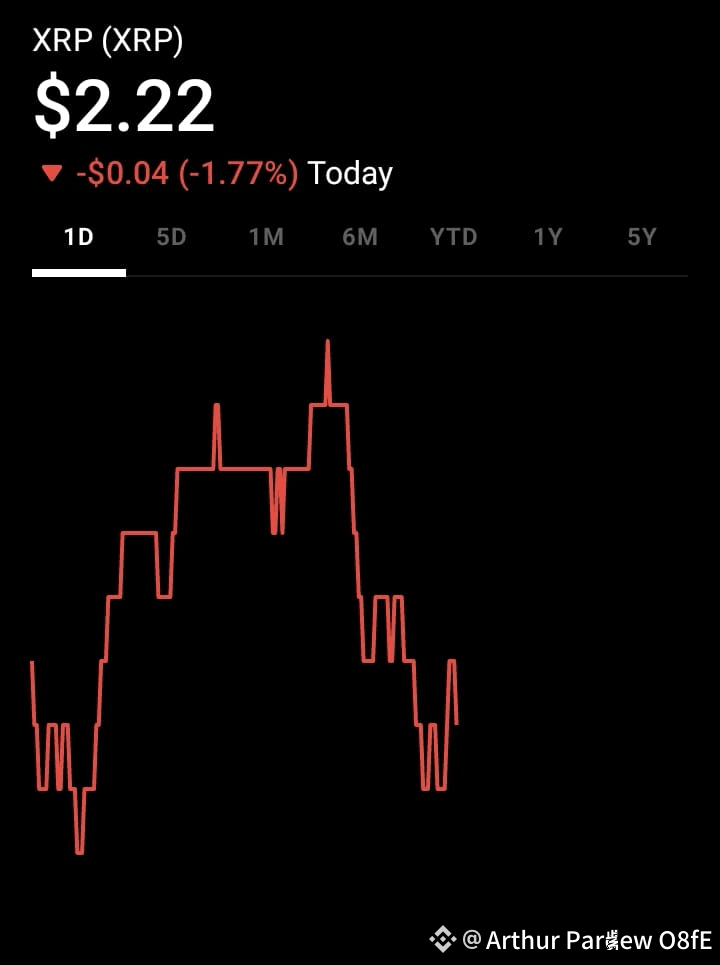
#StrategyBTCPurchase #MarketPullback #TrumpBitcoinEmpire #CryptoIn401k #TrumpTariffs hat in einem engeren Bereich gehandelt und ein Dreiecks- / Konsolidierungsmuster gebildet.
Wichtige Unterstützung liegt bei etwa 2,33 $, während der Widerstand derzeit bei etwa 2,44 $ liegt.
Die Handelsvolumina sind etwas gedämpft, was auf eine vorsichtige Akkumulation hindeutet, anstatt auf eine voll ausgeprägte bullische Überzeugung.
---
2. Technische / Musterbasierte Ausblick
Bullische Szenarien:
Fraktalmuster: Einige Analysten, die fraktale Analysen verwenden, sehen eine potenzielle Bewegung nach oben in Richtung 6–7 $ bis Mitte November 2025, vorausgesetzt, der aktuelle Kanal hält.
Fibonacci-Erweiterungen: Einige Händler schlagen eine aggressivere Prognose vor, die ein Ziel von bis zu 8,50 $+ basierend auf Fibonacci-Erweiterungsniveaus vorschlägt, wenn ein Ausbruch anhält.
ETF & Institutionelle Strömungen: Analysten glauben, dass die ETF-Dynamik und die institutionelle Übernahme (insbesondere jetzt, da der regulatorische Druck nachgelassen hat) die Nachfrage erheblich steigern könnten.
Langfristiges Ziel: Ein Analyst prognostiziert sogar ein mögliches 15 $ bis Ende 2025, wenn die bullische Dynamik anhält und die Übernahme fortgesetzt wird.
Konservativer / Basisfall:
Näherliegendes Ziel in den nächsten Wochen: 3,05–3,25 $ wird von mehreren Quellen zitiert, vorausgesetzt, es kommt zu einem Ausbruch aus der Konsolidierung.
Wenn der bärische Druck einsetzt, schlagen einige vor, dass die Unterstützung in Richtung 2,27–2,30 $ brechen könnte.
---
3. Fundamentale / makroökonomische Treiber
Regulatorische Klarheit: Ripple hat das große rechtliche Überhang mit der SEC gelöst.
Strategische Akquisition: Ripple erwirbt Hidden Road (Prime Brokerage) für ca. 1,25 Mrd. $, was die Rolle von XRP im institutionellen DeFi und bei Abwicklungen stärken könnte.
Stablecoin-Anwendungsfall: Ripples Stablecoin (RLUSD) könnte von der institutionellen Übernahme profitieren und tiefer in das XRP-Ökosystem integriert werden.
Wal-Aktivität: Es gibt Berichte / On-Chain-Signale über große XRP-Bewegungen, die entweder Akkumulation oder potenziellen Verkaufsdruck bedeuten könnten.
$XRP
#StrategyBTCPurchase #MarketPullback #TrumpBitcoinEmpire #CryptoIn401k #TrumpTariffs hat in einem engeren Bereich gehandelt und ein Dreiecks- / Konsolidierungsmuster gebildet.
Wichtige Unterstützung liegt bei etwa 2,33 $, während der Widerstand derzeit bei etwa 2,44 $ liegt.
Die Handelsvolumina sind etwas gedämpft, was auf eine vorsichtige Akkumulation hindeutet, anstatt auf eine voll ausgeprägte bullische Überzeugung.
---
2. Technische / Musterbasierte Ausblick
Bullische Szenarien:
Fraktalmuster: Einige Analysten, die fraktale Analysen verwenden, sehen eine potenzielle Bewegung nach oben in Richtung 6–7 $ bis Mitte November 2025, vorausgesetzt, der aktuelle Kanal hält.
Fibonacci-Erweiterungen: Einige Händler schlagen eine aggressivere Prognose vor, die ein Ziel von bis zu 8,50 $+ basierend auf Fibonacci-Erweiterungsniveaus vorschlägt, wenn ein Ausbruch anhält.
ETF & Institutionelle Strömungen: Analysten glauben, dass die ETF-Dynamik und die institutionelle Übernahme (insbesondere jetzt, da der regulatorische Druck nachgelassen hat) die Nachfrage erheblich steigern könnten.
Langfristiges Ziel: Ein Analyst prognostiziert sogar ein mögliches 15 $ bis Ende 2025, wenn die bullische Dynamik anhält und die Übernahme fortgesetzt wird.
Konservativer / Basisfall:
Näherliegendes Ziel in den nächsten Wochen: 3,05–3,25 $ wird von mehreren Quellen zitiert, vorausgesetzt, es kommt zu einem Ausbruch aus der Konsolidierung.
Wenn der bärische Druck einsetzt, schlagen einige vor, dass die Unterstützung in Richtung 2,27–2,30 $ brechen könnte.
---
3. Fundamentale / makroökonomische Treiber
Regulatorische Klarheit: Ripple hat das große rechtliche Überhang mit der SEC gelöst.
Strategische Akquisition: Ripple erwirbt Hidden Road (Prime Brokerage) für ca. 1,25 Mrd. $, was die Rolle von XRP im institutionellen DeFi und bei Abwicklungen stärken könnte.
Stablecoin-Anwendungsfall: Ripples Stablecoin (RLUSD) könnte von der institutionellen Übernahme profitieren und tiefer in das XRP-Ökosystem integriert werden.
Wal-Aktivität: Es gibt Berichte / On-Chain-Signale über große XRP-Bewegungen, die entweder Akkumulation oder potenziellen Verkaufsdruck bedeuten könnten.
#StrategyBTCPurchase #MarketPullback #TrumpBitcoinEmpire #CryptoIn401k #TrumpTariffs hat in einem engeren Bereich gehandelt und ein Dreiecks- / Konsolidierungsmuster gebildet.
Wichtige Unterstützung liegt bei etwa 2,33 $, während der Widerstand derzeit bei etwa 2,44 $ liegt.
Die Handelsvolumina sind etwas gedämpft, was auf eine vorsichtige Akkumulation hindeutet, anstatt auf eine voll ausgeprägte bullische Überzeugung.
---
2. Technische / Musterbasierte Ausblick
Bullische Szenarien:
Fraktalmuster: Einige Analysten, die fraktale Analysen verwenden, sehen eine potenzielle Bewegung nach oben in Richtung 6–7 $ bis Mitte November 2025, vorausgesetzt, der aktuelle Kanal hält.
Fibonacci-Erweiterungen: Einige Händler schlagen eine aggressivere Prognose vor, die ein Ziel von bis zu 8,50 $+ basierend auf Fibonacci-Erweiterungsniveaus vorschlägt, wenn ein Ausbruch anhält.
ETF & Institutionelle Strömungen: Analysten glauben, dass die ETF-Dynamik und die institutionelle Übernahme (insbesondere jetzt, da der regulatorische Druck nachgelassen hat) die Nachfrage erheblich steigern könnten.
Langfristiges Ziel: Ein Analyst prognostiziert sogar ein mögliches 15 $ bis Ende 2025, wenn die bullische Dynamik anhält und die Übernahme fortgesetzt wird.
Konservativer / Basisfall:
Näherliegendes Ziel in den nächsten Wochen: 3,05–3,25 $ wird von mehreren Quellen zitiert, vorausgesetzt, es kommt zu einem Ausbruch aus der Konsolidierung.
Wenn der bärische Druck einsetzt, schlagen einige vor, dass die Unterstützung in Richtung 2,27–2,30 $ brechen könnte.
---
3. Fundamentale / makroökonomische Treiber
Regulatorische Klarheit: Ripple hat das große rechtliche Überhang mit der SEC gelöst.
Strategische Akquisition: Ripple erwirbt Hidden Road (Prime Brokerage) für ca. 1,25 Mrd. $, was die Rolle von XRP im institutionellen DeFi und bei Abwicklungen stärken könnte.
Stablecoin-Anwendungsfall: Ripples Stablecoin (RLUSD) könnte von der institutionellen Übernahme profitieren und tiefer in das XRP-Ökosystem integriert werden.
Wal-Aktivität: Es gibt Berichte / On-Chain-Signale über große XRP-Bewegungen, die entweder Akkumulation oder potenziellen Verkaufsdruck bedeuten könnten.
1
93
·
--
Übersetzung ansehen
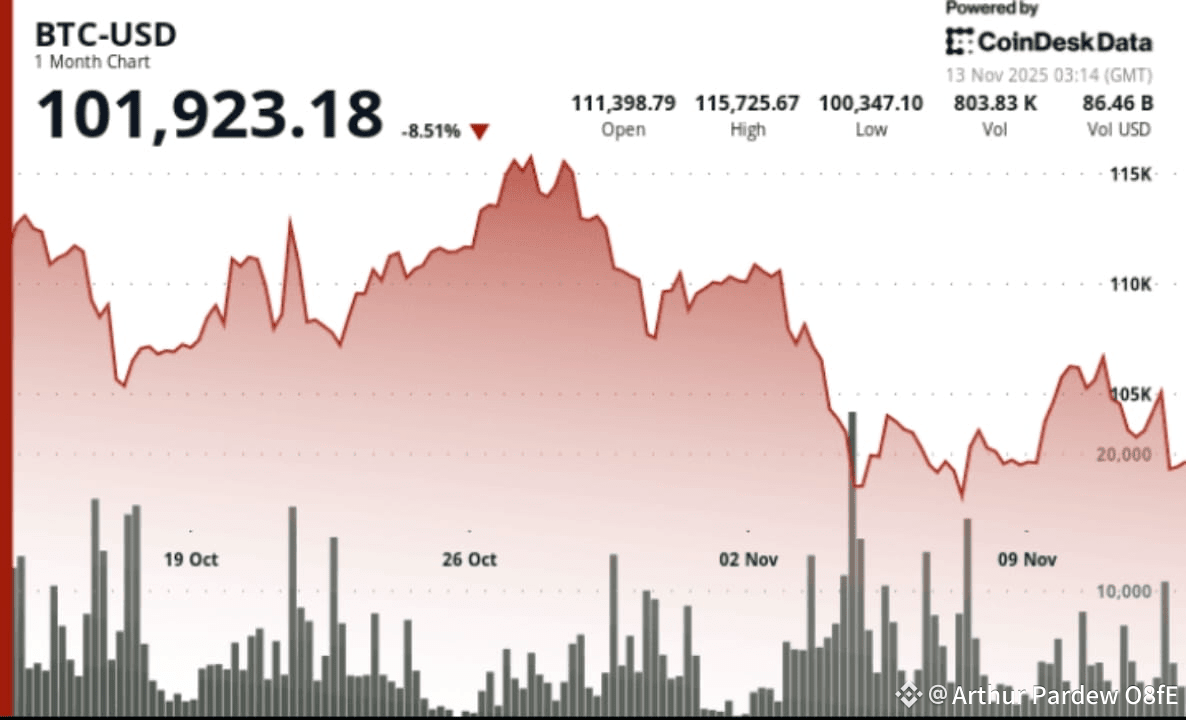
$BTC is holding a critical support around $102K. Analysts from Brave New Coin note that a rebound above $105K would be needed to sustain bullish momentum.
On the upside, resistance sits in the $120K–$125K range, according to aiTrendview.
According to technicals, if BTC breaks below $102K, downside risk could intensify.
2. Technical Signals
There was a breakdown below the 200-day moving average, which some view as a negative signal.
According to DropFinder, BTC saw a large wave of leveraged long liquidations after breaking key support around $110K.
A “death cross” (50-day MA crossing below 200-day MA) has been flagged as possible, a classic bearish signal.
3. Market Sentiment & Macro Risk
Sentiment is shaky: DropFinder’s confidence meter has dropped significantly, and many traders are less optimistic.
The U.S. Federal Reserve’s hawkish stance is weighing on BTC, reducing risk appetite.
Regulatory risk is still in play. There are growing worries about stricter crypto regulations and taxation.
4. On-Chain / Miner Dynamics
Miner selling is increasing: higher energy costs and rising difficulty are forcing some miners to liquidate.
However, there is still underlying demand: on-chain metrics (like active addresses, network hashrate) remain generally healthy.
5. Outlook & Scenarios
Bullish case: If BTC holds the $102K level and reclaims $105K+, we could see a run toward $120K+ — driven by on-chain strength, ETF flows, and macro easing.
Bearish case: A sustained break below $102K could trigger more liquidation, with potential downside toward ~$94K, especially if macro pressure continues.
Neutral / Consolidation: Some models suggest BTC is in a mid-cycle consolidation phase rather than forming a top or entering a fresh bear trend. #StrategyBTCPurchase #AmericaAIActionPlan #MarketPullback #CPIWatch #WriteToEarnUpgrade
{spot}(BTCUSDT)
$BTC is holding a critical support around $102K. Analysts from Brave New Coin note that a rebound above $105K would be needed to sustain bullish momentum.
On the upside, resistance sits in the $120K–$125K range, according to aiTrendview.
According to technicals, if BTC breaks below $102K, downside risk could intensify.
2. Technical Signals
There was a breakdown below the 200-day moving average, which some view as a negative signal.
According to DropFinder, BTC saw a large wave of leveraged long liquidations after breaking key support around $110K.
A “death cross” (50-day MA crossing below 200-day MA) has been flagged as possible, a classic bearish signal.
3. Market Sentiment & Macro Risk
Sentiment is shaky: DropFinder’s confidence meter has dropped significantly, and many traders are less optimistic.
The U.S. Federal Reserve’s hawkish stance is weighing on BTC, reducing risk appetite.
Regulatory risk is still in play. There are growing worries about stricter crypto regulations and taxation.
4. On-Chain / Miner Dynamics
Miner selling is increasing: higher energy costs and rising difficulty are forcing some miners to liquidate.
However, there is still underlying demand: on-chain metrics (like active addresses, network hashrate) remain generally healthy.
5. Outlook & Scenarios
Bullish case: If BTC holds the $102K level and reclaims $105K+, we could see a run toward $120K+ — driven by on-chain strength, ETF flows, and macro easing.
Bearish case: A sustained break below $102K could trigger more liquidation, with potential downside toward ~$94K, especially if macro pressure continues.
Neutral / Consolidation: Some models suggest BTC is in a mid-cycle consolidation phase rather than forming a top or entering a fresh bear trend. #StrategyBTCPurchase #AmericaAIActionPlan #MarketPullback #CPIWatch #WriteToEarnUpgrade
On the upside, resistance sits in the $120K–$125K range, according to aiTrendview.
According to technicals, if BTC breaks below $102K, downside risk could intensify.
2. Technical Signals
There was a breakdown below the 200-day moving average, which some view as a negative signal.
According to DropFinder, BTC saw a large wave of leveraged long liquidations after breaking key support around $110K.
A “death cross” (50-day MA crossing below 200-day MA) has been flagged as possible, a classic bearish signal.
3. Market Sentiment & Macro Risk
Sentiment is shaky: DropFinder’s confidence meter has dropped significantly, and many traders are less optimistic.
The U.S. Federal Reserve’s hawkish stance is weighing on BTC, reducing risk appetite.
Regulatory risk is still in play. There are growing worries about stricter crypto regulations and taxation.
4. On-Chain / Miner Dynamics
Miner selling is increasing: higher energy costs and rising difficulty are forcing some miners to liquidate.
However, there is still underlying demand: on-chain metrics (like active addresses, network hashrate) remain generally healthy.
5. Outlook & Scenarios
Bullish case: If BTC holds the $102K level and reclaims $105K+, we could see a run toward $120K+ — driven by on-chain strength, ETF flows, and macro easing.
Bearish case: A sustained break below $102K could trigger more liquidation, with potential downside toward ~$94K, especially if macro pressure continues.
Neutral / Consolidation: Some models suggest BTC is in a mid-cycle consolidation phase rather than forming a top or entering a fresh bear trend. #StrategyBTCPurchase #AmericaAIActionPlan #MarketPullback #CPIWatch #WriteToEarnUpgrade
4
·
--
Übersetzung ansehen
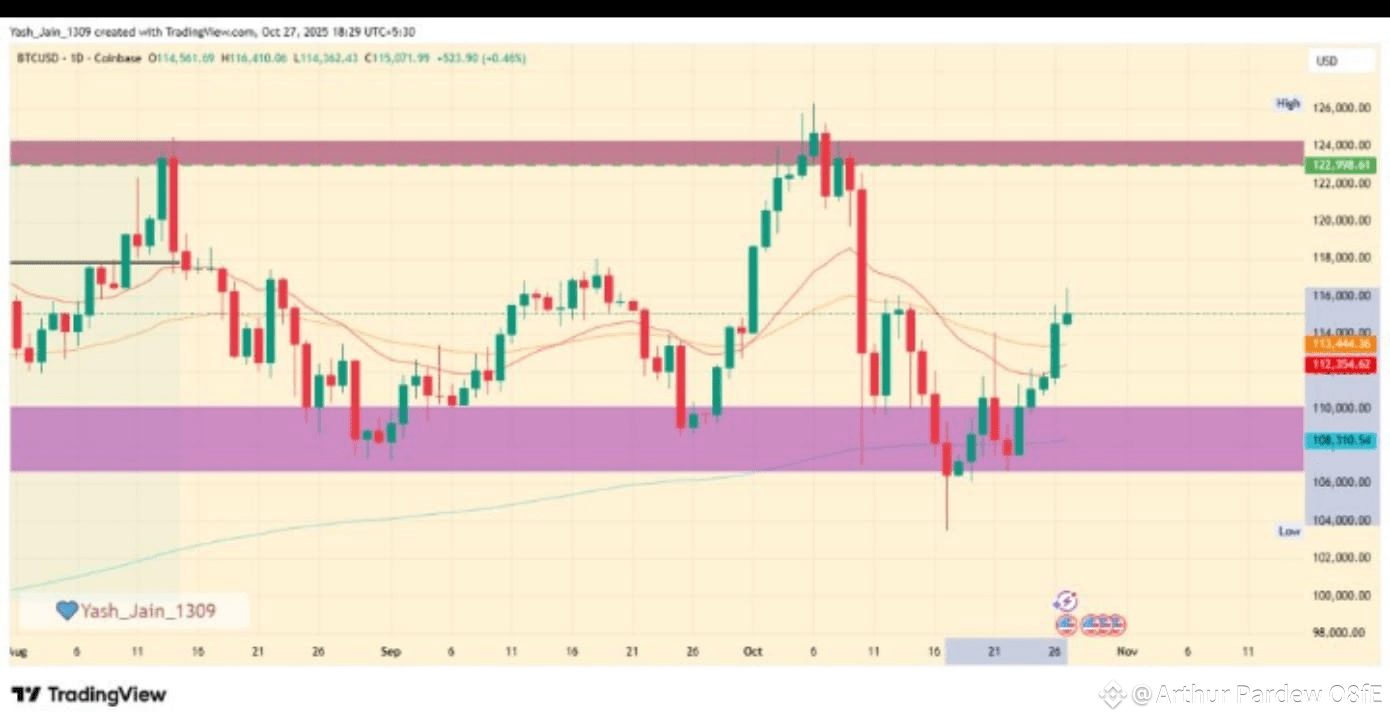
$BTC is trading in a somewhat tight range between support around $99K–$100K and resistance near $109K–$110K.
According to CoinCodex, sentiment is currently bearish, and many technical indicators lean toward downside risk.
Key support levels: around $101K per CoinCodex, with stronger zones near $99K.
On the upside, a break above $109K–$110K could trigger renewed bullish momentum.
---
2. Fundamental Drivers
ETF Inflows: Institutional demand remains a strong tailwind. Analysts note renewed confidence in spot Bitcoin ETFs.
Macro Risk: There’s tension around macro conditions and regulation, so BTC’s path isn’t without potential headwinds.
Leverage & Deleveraging: Some strategists (e.g., at JPMorgan) argue that recent deleveraging in futures markets has reduced risk, making BTC more attractive relative to gold.
Cycle Models: Some long-term models (like quantile regression) still point to very high cycle tops (e.g., $250K+ in a bullish extreme), though that’s speculative.
#StrategyBTCPurchase #MarketPullback #CPIWatch #StablecoinLaw #TrumpBitcoinEmpire
{spot}(BTCUSDT)
$BTC is trading in a somewhat tight range between support around $99K–$100K and resistance near $109K–$110K.
According to CoinCodex, sentiment is currently bearish, and many technical indicators lean toward downside risk.
Key support levels: around $101K per CoinCodex, with stronger zones near $99K.
On the upside, a break above $109K–$110K could trigger renewed bullish momentum.
---
2. Fundamental Drivers
ETF Inflows: Institutional demand remains a strong tailwind. Analysts note renewed confidence in spot Bitcoin ETFs.
Macro Risk: There’s tension around macro conditions and regulation, so BTC’s path isn’t without potential headwinds.
Leverage & Deleveraging: Some strategists (e.g., at JPMorgan) argue that recent deleveraging in futures markets has reduced risk, making BTC more attractive relative to gold.
Cycle Models: Some long-term models (like quantile regression) still point to very high cycle tops (e.g., $250K+ in a bullish extreme), though that’s speculative.
#StrategyBTCPurchase #MarketPullback #CPIWatch #StablecoinLaw #TrumpBitcoinEmpire
According to CoinCodex, sentiment is currently bearish, and many technical indicators lean toward downside risk.
Key support levels: around $101K per CoinCodex, with stronger zones near $99K.
On the upside, a break above $109K–$110K could trigger renewed bullish momentum.
---
2. Fundamental Drivers
ETF Inflows: Institutional demand remains a strong tailwind. Analysts note renewed confidence in spot Bitcoin ETFs.
Macro Risk: There’s tension around macro conditions and regulation, so BTC’s path isn’t without potential headwinds.
Leverage & Deleveraging: Some strategists (e.g., at JPMorgan) argue that recent deleveraging in futures markets has reduced risk, making BTC more attractive relative to gold.
Cycle Models: Some long-term models (like quantile regression) still point to very high cycle tops (e.g., $250K+ in a bullish extreme), though that’s speculative.
#StrategyBTCPurchase #MarketPullback #CPIWatch #StablecoinLaw #TrumpBitcoinEmpire
58
·
--
Übersetzung ansehen
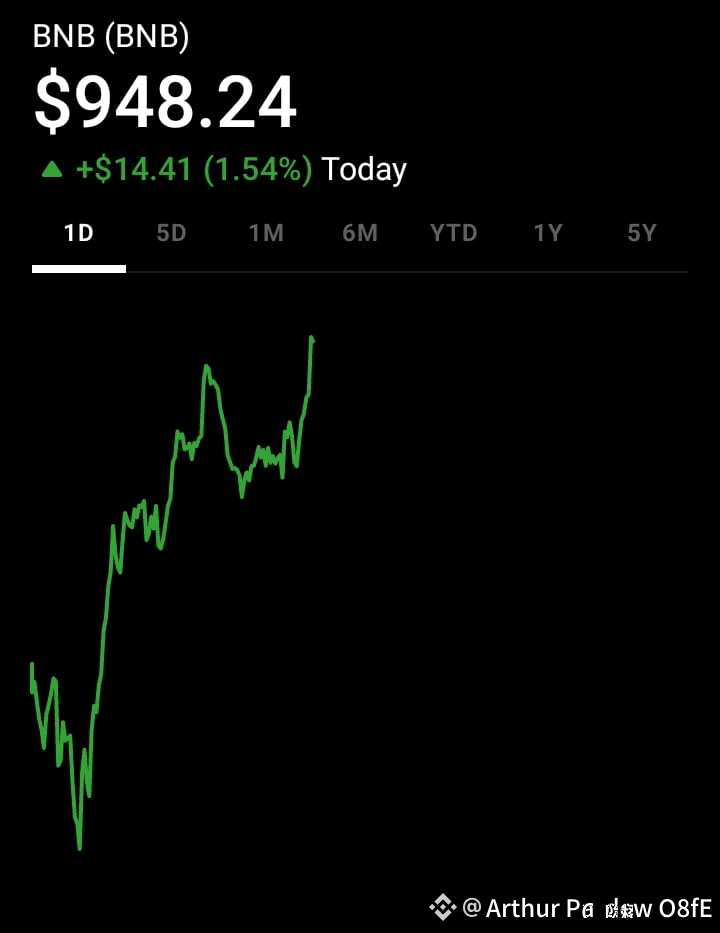
According to CoinCodex, $BNB is likely to trade in a channel around $1,039 – $1,237 through 2025.
Momentum is relatively neutral: RSI (from CoinCodex) is around the middle, suggesting no extreme overbought or oversold.
Short-term technicals (from AMB Crypto) suggest a possible rise: by mid-November 2025, average BNB price could reach ~$1,033, with a potential high near $1,105.
But there is also a risk of pullback: some analyses expect consolidation or even a dip toward $950–$1,000 in a medium-term scenario. #StrategyBTCPurchase #MarketPullback #PowellRemarks #TrumpBitcoinEmpire #AmericaAIActionPlan
{spot}(BNBUSDT)
According to CoinCodex, $BNB is likely to trade in a channel around $1,039 – $1,237 through 2025.
Momentum is relatively neutral: RSI (from CoinCodex) is around the middle, suggesting no extreme overbought or oversold.
Short-term technicals (from AMB Crypto) suggest a possible rise: by mid-November 2025, average BNB price could reach ~$1,033, with a potential high near $1,105.
But there is also a risk of pullback: some analyses expect consolidation or even a dip toward $950–$1,000 in a medium-term scenario. #StrategyBTCPurchase #MarketPullback #PowellRemarks #TrumpBitcoinEmpire #AmericaAIActionPlan
Momentum is relatively neutral: RSI (from CoinCodex) is around the middle, suggesting no extreme overbought or oversold.
Short-term technicals (from AMB Crypto) suggest a possible rise: by mid-November 2025, average BNB price could reach ~$1,033, with a potential high near $1,105.
But there is also a risk of pullback: some analyses expect consolidation or even a dip toward $950–$1,000 in a medium-term scenario. #StrategyBTCPurchase #MarketPullback #PowellRemarks #TrumpBitcoinEmpire #AmericaAIActionPlan
3
62
·
--
Übersetzung ansehen
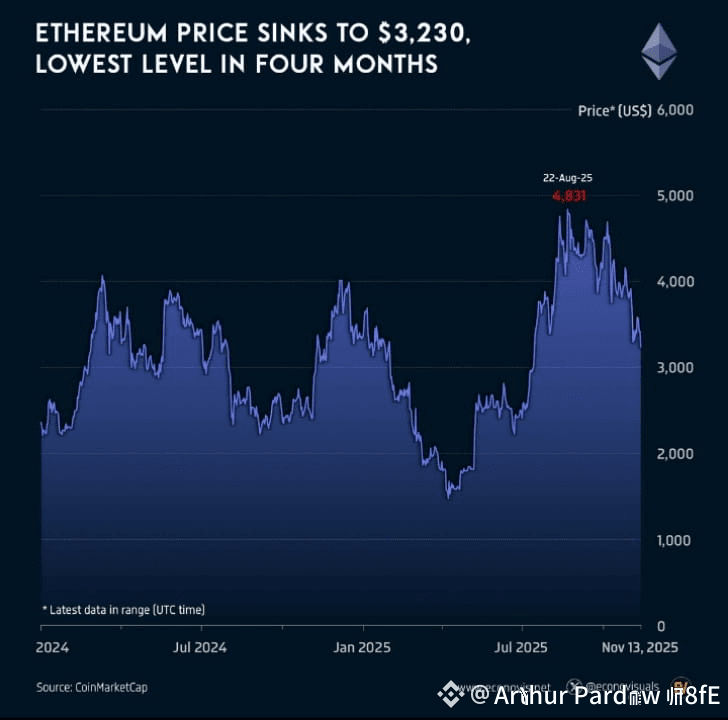
$ETH ETH recently dipped to around $3,230, marking its lowest level in four months, signaling short-term weakness.
2. Technical support is forming near $3,000–$3,500, with analysts warning that this zone is critical for bulls to defend.
3. There’s notable institutional accumulation: large “whales” have been buying ETH, suggesting long-term conviction.
4. On-chain activity is strong — Ethereum hit 24,192 transactions/sec, and burned $32M+ in fees, reinforcing its utility narrative.
5. Looking ahead, a rebound could aim for $4,300 if support holds and buying pressure returns.
6. But there are headwinds: ETF outflows recently weighed on sentiment, particularly from products like Fidelity’s FETH.
7. A major positive catalyst could arrive with the upcoming Fusaka upgrade, slated for December, which is expected to boost scalability via key EIPs. #StrategyBTCPurchase #MarketPullback #AmericaAIActionPlan #BuiltonSolayer #AITokensRally
{spot}(ETHUSDT)
$ETH ETH recently dipped to around $3,230, marking its lowest level in four months, signaling short-term weakness.
2. Technical support is forming near $3,000–$3,500, with analysts warning that this zone is critical for bulls to defend.
3. There’s notable institutional accumulation: large “whales” have been buying ETH, suggesting long-term conviction.
4. On-chain activity is strong — Ethereum hit 24,192 transactions/sec, and burned $32M+ in fees, reinforcing its utility narrative.
5. Looking ahead, a rebound could aim for $4,300 if support holds and buying pressure returns.
6. But there are headwinds: ETF outflows recently weighed on sentiment, particularly from products like Fidelity’s FETH.
7. A major positive catalyst could arrive with the upcoming Fusaka upgrade, slated for December, which is expected to boost scalability via key EIPs. #StrategyBTCPurchase #MarketPullback #AmericaAIActionPlan #BuiltonSolayer #AITokensRally
2. Technical support is forming near $3,000–$3,500, with analysts warning that this zone is critical for bulls to defend.
3. There’s notable institutional accumulation: large “whales” have been buying ETH, suggesting long-term conviction.
4. On-chain activity is strong — Ethereum hit 24,192 transactions/sec, and burned $32M+ in fees, reinforcing its utility narrative.
5. Looking ahead, a rebound could aim for $4,300 if support holds and buying pressure returns.
6. But there are headwinds: ETF outflows recently weighed on sentiment, particularly from products like Fidelity’s FETH.
7. A major positive catalyst could arrive with the upcoming Fusaka upgrade, slated for December, which is expected to boost scalability via key EIPs. #StrategyBTCPurchase #MarketPullback #AmericaAIActionPlan #BuiltonSolayer #AITokensRally
3
122
·
--
Übersetzung ansehen
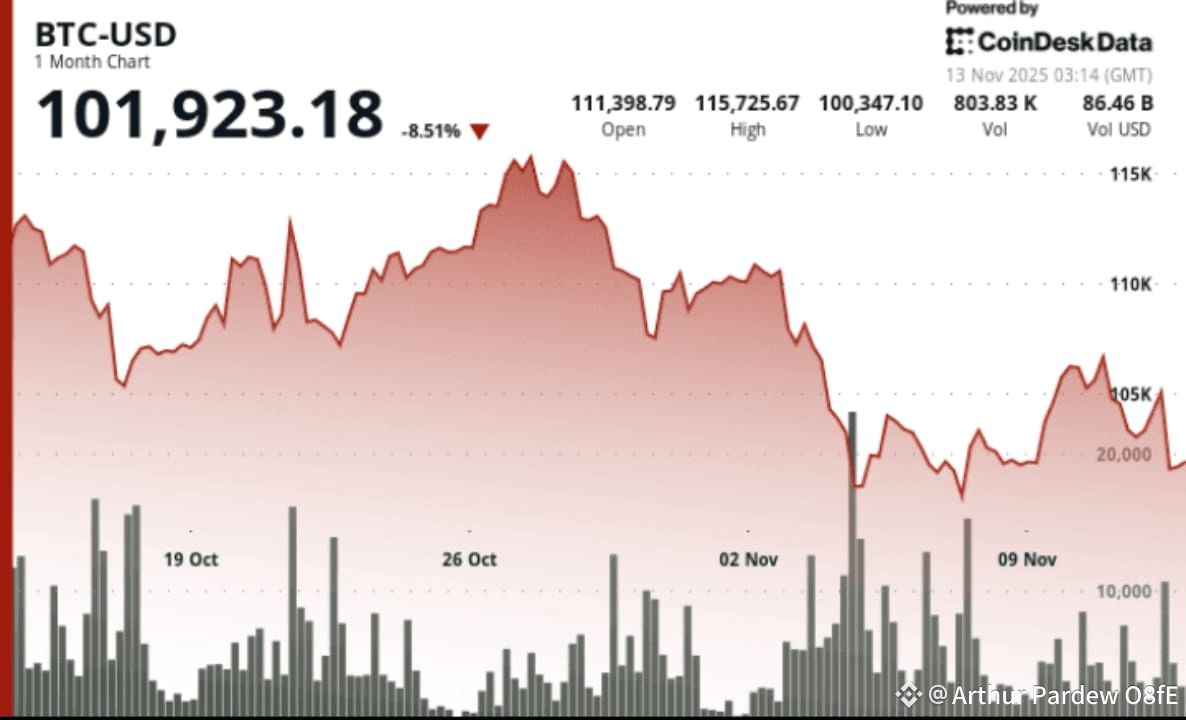
Current Price: Bitcoin is trading around $95,800–$96,000, after a recent dip.
Volatility: There’s been a breakdown on higher volume, testing key support in the $95K–$102K band.
Risk Zones:
Support: ~$95K — if broken, some analysts see risk of a drop toward $90K.
Upside Potential: On a rebound, models are eyeing targets between $BTC 125K–$134K. #StrategyBTCPurchase #MarketPullback #StablecoinLaw #IPOWave #US-EUTradeAgreement
{spot}(BTCUSDT)
Current Price: Bitcoin is trading around $95,800–$96,000, after a recent dip.
Volatility: There’s been a breakdown on higher volume, testing key support in the $95K–$102K band.
Risk Zones:
Support: ~$95K — if broken, some analysts see risk of a drop toward $90K.
Upside Potential: On a rebound, models are eyeing targets between $BTC 125K–$134K. #StrategyBTCPurchase #MarketPullback #StablecoinLaw #IPOWave #US-EUTradeAgreement
Volatility: There’s been a breakdown on higher volume, testing key support in the $95K–$102K band.
Risk Zones:
Support: ~$95K — if broken, some analysts see risk of a drop toward $90K.
Upside Potential: On a rebound, models are eyeing targets between $BTC 125K–$134K. #StrategyBTCPurchase #MarketPullback #StablecoinLaw #IPOWave #US-EUTradeAgreement
3
20
Anmelden und weiter Inhalte entdecken
Krypto-Nutzer weltweit auf Binance Square kennenlernen
⚡️ Bleib in Sachen Krypto stets am Puls.
💬 Die weltgrößte Kryptobörse vertraut darauf.
👍 Erhalte verlässliche Einblicke von verifizierten Creators.
E-Mail-Adresse/Telefonnummer
Trendthemen
WhoWillSucceedJensenHuangatNvidia?
4,398 Aufrufe
120 Kommentare
Nvidia: Gespräche über neue CEO-Kandidaten sind verfrüht
Binance News
·5 Likes
·1.5k Aufrufe
WhatWillDriveCryptoandStocks’NextRebound?
270,820 Aufrufe
2,076 Kommentare
USPPIMissMayEaseBTCPressure
119,399 Aufrufe
1,419 Kommentare