
Jamila Khatun
119 Beiträge

Jamila Khatun
Melden
Nutzer blockieren
Trade eröffnen
Regelmäßiger Trader
3.9 Monate
1 Following
8 Follower
53 Like gegeben
Beiträge
Portfolio
Alle
Zitierungen
Videos
·
--
Artikel
Übersetzung ansehen
ETH/USDT: Bulls Defend Ground After Sharp Rejection at $2,615 — Key Battle Zone Ahead ⚡📊**ETH/USDT: Bulls Defend Ground After Sharp Rejection at $2,615 — Key Battle Zone Ahead ⚡📊**
Ethereum is showing a textbook liquidity sweep pattern after a volatile session that tested both bulls and bears. 🐂🐻
📉 **Price Action Overview**
ETH/USDT slipped to an intraday low of **$2,460.65**, before staging a sharp recovery back into the key pivot zone around **$2,513**. The rally even printed a 24h high of **$2,615.00**, but the move was quickly rejected — a classic stop-hunt/absorption pattern that trapped late breakout buyers. 🎯
⏱️ **15-Minute Timeframe**
After the violent spike to $2,615, price got rejected and is now trading below the short-term EMAs:
• EMA7: $2,513.66
• EMA14: $2,520.08
• EMA28: $2,526.40
RSI6 has dropped to **38.50**, and MACD is showing short-term bearish momentum at **-2.69**, suggesting sellers are back in control on the micro timeframe. 🔻
🕐 **1-Hour Timeframe**
The same liquidity sweep story repeats — another push toward $2,615 failed to consolidate. The 7/14/28 EMA cluster (between **$2,518–$2,524**) is now acting as immediate resistance. RSI6 sits at **38.66**, confirming weakness, while MACD has crossed downward at **-1.67**. ⚠️
🕓 **4-Hour Timeframe — The Bigger Picture**
Zooming out, ETH is respecting a wide sideways range, supported by the EMA fan:
• EMA7: $2,514.26
• EMA14: $2,511.00
• EMA28: $2,504.63
RSI6 is dead neutral at **50.46**, and MACD is essentially flat (**-0.03**) — a market catching its breath before the next directional move. ⚖️
🔑 **Key Levels to Watch**
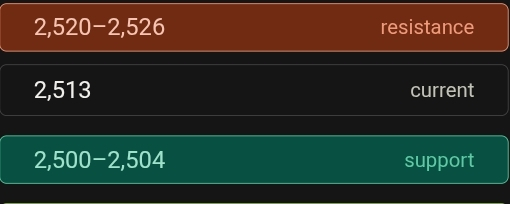
🟥 Immediate Resistance: $2,520 – $2,526
🟥 Strong Resistance: $2,615.00 & $2,670.98
🟩 Immediate Support: $2,500 – $2,504 (4h EMA28)
🟩 Critical Support: $2,460.65 – $2,478.68
🔮 **Possible Scenarios**
**1️⃣ Sideways / Short Correction 📉**
If ETH fails to reclaim the $2,526 resistance on the 1h chart, expect a defensive pullback toward the $2,500–$2,480 support zone. This would keep the range-bound structure intact.
**2️⃣ Bullish Continuation 🚀**
A break higher requires consolidating 1h candle closes **above $2,530**, which would open the path to retest the strong $2,615 barrier once again — and potentially challenge $2,670.98 beyond that.
💡 **Bottom Line**
ETH is currently trapped in a tight tug-of-war between $2,500 support and $2,526 resistance. The lower timeframes lean bearish short-term, but the 4h structure remains neutral, meaning this could just be consolidation before the next big move. Traders should watch for a decisive close above $2,530 or below $2,500 to confirm direction. 👀🔥
⚠️ *
#ETH #btc #CryptoAnalysis #Binance #TechnicalAnalysis
ETH/USDT: Bulls Defend Ground After Sharp Rejection at $2,615 — Key Battle Zone Ahead ⚡📊
**ETH/USDT: Bulls Defend Ground After Sharp Rejection at $2,615 — Key Battle Zone Ahead ⚡📊**
Ethereum is showing a textbook liquidity sweep pattern after a volatile session that tested both bulls and bears. 🐂🐻
📉 **Price Action Overview**
ETH/USDT slipped to an intraday low of **$2,460.65**, before staging a sharp recovery back into the key pivot zone around **$2,513**. The rally even printed a 24h high of **$2,615.00**, but the move was quickly rejected — a classic stop-hunt/absorption pattern that trapped late breakout buyers. 🎯
⏱️ **15-Minute Timeframe**
After the violent spike to $2,615, price got rejected and is now trading below the short-term EMAs:
• EMA7: $2,513.66
• EMA14: $2,520.08
• EMA28: $2,526.40
RSI6 has dropped to **38.50**, and MACD is showing short-term bearish momentum at **-2.69**, suggesting sellers are back in control on the micro timeframe. 🔻
🕐 **1-Hour Timeframe**
The same liquidity sweep story repeats — another push toward $2,615 failed to consolidate. The 7/14/28 EMA cluster (between **$2,518–$2,524**) is now acting as immediate resistance. RSI6 sits at **38.66**, confirming weakness, while MACD has crossed downward at **-1.67**. ⚠️
🕓 **4-Hour Timeframe — The Bigger Picture**
Zooming out, ETH is respecting a wide sideways range, supported by the EMA fan:
• EMA7: $2,514.26
• EMA14: $2,511.00
• EMA28: $2,504.63
RSI6 is dead neutral at **50.46**, and MACD is essentially flat (**-0.03**) — a market catching its breath before the next directional move. ⚖️
🔑 **Key Levels to Watch**
🟥 Immediate Resistance: $2,520 – $2,526
🟥 Strong Resistance: $2,615.00 & $2,670.98
🟩 Immediate Support: $2,500 – $2,504 (4h EMA28)
🟩 Critical Support: $2,460.65 – $2,478.68
🔮 **Possible Scenarios**
**1️⃣ Sideways / Short Correction 📉**
If ETH fails to reclaim the $2,526 resistance on the 1h chart, expect a defensive pullback toward the $2,500–$2,480 support zone. This would keep the range-bound structure intact.
**2️⃣ Bullish Continuation 🚀**
A break higher requires consolidating 1h candle closes **above $2,530**, which would open the path to retest the strong $2,615 barrier once again — and potentially challenge $2,670.98 beyond that.
💡 **Bottom Line**
ETH is currently trapped in a tight tug-of-war between $2,500 support and $2,526 resistance. The lower timeframes lean bearish short-term, but the 4h structure remains neutral, meaning this could just be consolidation before the next big move. Traders should watch for a decisive close above $2,530 or below $2,500 to confirm direction. 👀🔥
⚠️ *
#ETH #btc #CryptoAnalysis #Binance #TechnicalAnalysis
Ethereum is showing a textbook liquidity sweep pattern after a volatile session that tested both bulls and bears. 🐂🐻
📉 **Price Action Overview**
ETH/USDT slipped to an intraday low of **$2,460.65**, before staging a sharp recovery back into the key pivot zone around **$2,513**. The rally even printed a 24h high of **$2,615.00**, but the move was quickly rejected — a classic stop-hunt/absorption pattern that trapped late breakout buyers. 🎯
⏱️ **15-Minute Timeframe**
After the violent spike to $2,615, price got rejected and is now trading below the short-term EMAs:
• EMA7: $2,513.66
• EMA14: $2,520.08
• EMA28: $2,526.40
RSI6 has dropped to **38.50**, and MACD is showing short-term bearish momentum at **-2.69**, suggesting sellers are back in control on the micro timeframe. 🔻
🕐 **1-Hour Timeframe**
The same liquidity sweep story repeats — another push toward $2,615 failed to consolidate. The 7/14/28 EMA cluster (between **$2,518–$2,524**) is now acting as immediate resistance. RSI6 sits at **38.66**, confirming weakness, while MACD has crossed downward at **-1.67**. ⚠️
🕓 **4-Hour Timeframe — The Bigger Picture**
Zooming out, ETH is respecting a wide sideways range, supported by the EMA fan:
• EMA7: $2,514.26
• EMA14: $2,511.00
• EMA28: $2,504.63
RSI6 is dead neutral at **50.46**, and MACD is essentially flat (**-0.03**) — a market catching its breath before the next directional move. ⚖️
🔑 **Key Levels to Watch**
🟥 Immediate Resistance: $2,520 – $2,526
🟥 Strong Resistance: $2,615.00 & $2,670.98
🟩 Immediate Support: $2,500 – $2,504 (4h EMA28)
🟩 Critical Support: $2,460.65 – $2,478.68
🔮 **Possible Scenarios**
**1️⃣ Sideways / Short Correction 📉**
If ETH fails to reclaim the $2,526 resistance on the 1h chart, expect a defensive pullback toward the $2,500–$2,480 support zone. This would keep the range-bound structure intact.
**2️⃣ Bullish Continuation 🚀**
A break higher requires consolidating 1h candle closes **above $2,530**, which would open the path to retest the strong $2,615 barrier once again — and potentially challenge $2,670.98 beyond that.
💡 **Bottom Line**
ETH is currently trapped in a tight tug-of-war between $2,500 support and $2,526 resistance. The lower timeframes lean bearish short-term, but the 4h structure remains neutral, meaning this could just be consolidation before the next big move. Traders should watch for a decisive close above $2,530 or below $2,500 to confirm direction. 👀🔥
⚠️ *
#ETH #btc #CryptoAnalysis #Binance #TechnicalAnalysis
82
·
--

1
·
--
Artikel
Übersetzung ansehen
🔴 $SOL SHORT SETUP (10x) — THE ZONE IS HERE, RISK IS SET🔴 $SOL SHORT SETUP (10x) — THE ZONE IS HERE, RISK IS SET
Solana has printed itself right into a well-defined short zone, and the setup is clean enough that it doesn't need a long story attached. Price has climbed into resistance, momentum is stalling, and the risk-to-reward on the short side is stacking up in favor of sellers. Here's the full breakdown. 📉
⚡ THE SETUP
SOL is currently sitting at the zone — no chasing required, no guesswork needed. This is the kind of level where price either gets rejected hard or breaks clean through, so a tight, well-managed entry range is key. The plan below is built for a leveraged short (10x), meaning position sizing and stop-loss discipline are non-negotiable. ⚠️
📋 TRADE PLAN
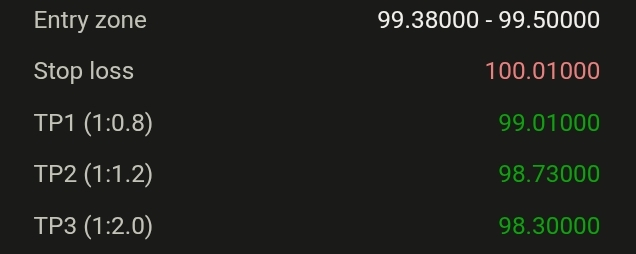
🎯 Entry zone: 99.38000 – 99.50000
🎯 Take-profit targets:
- TP1: 99.01000 (R:R 1:0.8)
- TP2: 98.73000 (R:R 1:1.2)
- TP3: 98.30000 (R:R 1:2.0)
🛑 Stop-loss: 100.01000
This is a layered take-profit structure — scaling out at TP1 locks in early gains and reduces risk on the remaining position, while TP2 and TP3 let the trade run further if momentum continues to build to the downside.
🧮 RISK-REWARD BREAKDOWN
The plan is structured so risk grows more favorable the further price moves in your direction:
- TP1 offers a modest 1:0.8 reward-to-risk — a quick, high-probability scalp exit
- TP2 improves to 1:1.2, a solid risk-adjusted target
- TP3 stretches to 1:2.0, rewarding patience if the move extends
With leverage in play, even small moves toward these targets translate into meaningful account impact — which is exactly why the stop-loss at 100.01000 is non-negotiable. 🧭
🔎 WHY THIS ZONE MATTERS
SOL reaching this level without needing extra confirmation or a "story" suggests the zone itself has done the technical work — it's an area where sellers have previously stepped in, making it a logical spot to fade strength rather than chase it. The tight entry range (99.38000–99.50000) keeps the trade precise rather than sloppy, and the defined stop above 100.01000 caps downside risk if the zone fails to hold.
💡 EXECUTION NOTES
- Enter within the defined zone — don't chase price above it
- Respect the stop-loss strictly; 10x leverage leaves little room for error
- Consider scaling out at each TP level rather than exiting all at once
- If price breaks and holds above 100.01000, the setup is invalidated — stand aside and reassess
📌 BOTTOM LINE
SOL is at the zone. The plan is simple: enter within range, respect the stop, and let the layered targets do the work. No overthinking required — just disciplined execution. 🎯
⚠️
#SOL #Solana #ShortTrade #Leverage #Binance
$SOL
{spot}(SOLUSDT)
🔴 $SOL SHORT SETUP (10x) — THE ZONE IS HERE, RISK IS SET
🔴 $SOL SHORT SETUP (10x) — THE ZONE IS HERE, RISK IS SET
Solana has printed itself right into a well-defined short zone, and the setup is clean enough that it doesn't need a long story attached. Price has climbed into resistance, momentum is stalling, and the risk-to-reward on the short side is stacking up in favor of sellers. Here's the full breakdown. 📉
⚡ THE SETUP
SOL is currently sitting at the zone — no chasing required, no guesswork needed. This is the kind of level where price either gets rejected hard or breaks clean through, so a tight, well-managed entry range is key. The plan below is built for a leveraged short (10x), meaning position sizing and stop-loss discipline are non-negotiable. ⚠️
📋 TRADE PLAN
🎯 Entry zone: 99.38000 – 99.50000
🎯 Take-profit targets:
- TP1: 99.01000 (R:R 1:0.8)
- TP2: 98.73000 (R:R 1:1.2)
- TP3: 98.30000 (R:R 1:2.0)
🛑 Stop-loss: 100.01000
This is a layered take-profit structure — scaling out at TP1 locks in early gains and reduces risk on the remaining position, while TP2 and TP3 let the trade run further if momentum continues to build to the downside.
🧮 RISK-REWARD BREAKDOWN
The plan is structured so risk grows more favorable the further price moves in your direction:
- TP1 offers a modest 1:0.8 reward-to-risk — a quick, high-probability scalp exit
- TP2 improves to 1:1.2, a solid risk-adjusted target
- TP3 stretches to 1:2.0, rewarding patience if the move extends
With leverage in play, even small moves toward these targets translate into meaningful account impact — which is exactly why the stop-loss at 100.01000 is non-negotiable. 🧭
🔎 WHY THIS ZONE MATTERS
SOL reaching this level without needing extra confirmation or a "story" suggests the zone itself has done the technical work — it's an area where sellers have previously stepped in, making it a logical spot to fade strength rather than chase it. The tight entry range (99.38000–99.50000) keeps the trade precise rather than sloppy, and the defined stop above 100.01000 caps downside risk if the zone fails to hold.
💡 EXECUTION NOTES
- Enter within the defined zone — don't chase price above it
- Respect the stop-loss strictly; 10x leverage leaves little room for error
- Consider scaling out at each TP level rather than exiting all at once
- If price breaks and holds above 100.01000, the setup is invalidated — stand aside and reassess
📌 BOTTOM LINE
SOL is at the zone. The plan is simple: enter within range, respect the stop, and let the layered targets do the work. No overthinking required — just disciplined execution. 🎯
⚠️
#SOL #Solana #ShortTrade #Leverage #Binance
$SOL
Solana has printed itself right into a well-defined short zone, and the setup is clean enough that it doesn't need a long story attached. Price has climbed into resistance, momentum is stalling, and the risk-to-reward on the short side is stacking up in favor of sellers. Here's the full breakdown. 📉
⚡ THE SETUP
SOL is currently sitting at the zone — no chasing required, no guesswork needed. This is the kind of level where price either gets rejected hard or breaks clean through, so a tight, well-managed entry range is key. The plan below is built for a leveraged short (10x), meaning position sizing and stop-loss discipline are non-negotiable. ⚠️
📋 TRADE PLAN
🎯 Entry zone: 99.38000 – 99.50000
🎯 Take-profit targets:
- TP1: 99.01000 (R:R 1:0.8)
- TP2: 98.73000 (R:R 1:1.2)
- TP3: 98.30000 (R:R 1:2.0)
🛑 Stop-loss: 100.01000
This is a layered take-profit structure — scaling out at TP1 locks in early gains and reduces risk on the remaining position, while TP2 and TP3 let the trade run further if momentum continues to build to the downside.
🧮 RISK-REWARD BREAKDOWN
The plan is structured so risk grows more favorable the further price moves in your direction:
- TP1 offers a modest 1:0.8 reward-to-risk — a quick, high-probability scalp exit
- TP2 improves to 1:1.2, a solid risk-adjusted target
- TP3 stretches to 1:2.0, rewarding patience if the move extends
With leverage in play, even small moves toward these targets translate into meaningful account impact — which is exactly why the stop-loss at 100.01000 is non-negotiable. 🧭
🔎 WHY THIS ZONE MATTERS
SOL reaching this level without needing extra confirmation or a "story" suggests the zone itself has done the technical work — it's an area where sellers have previously stepped in, making it a logical spot to fade strength rather than chase it. The tight entry range (99.38000–99.50000) keeps the trade precise rather than sloppy, and the defined stop above 100.01000 caps downside risk if the zone fails to hold.
💡 EXECUTION NOTES
- Enter within the defined zone — don't chase price above it
- Respect the stop-loss strictly; 10x leverage leaves little room for error
- Consider scaling out at each TP level rather than exiting all at once
- If price breaks and holds above 100.01000, the setup is invalidated — stand aside and reassess
📌 BOTTOM LINE
SOL is at the zone. The plan is simple: enter within range, respect the stop, and let the layered targets do the work. No overthinking required — just disciplined execution. 🎯
⚠️
#SOL #Solana #ShortTrade #Leverage #Binance
$SOL
1
91
·
--
Artikel
🟡 GOLD (XAU/USD) AUSBLICK — 14. SEPTEMBER 2026: HÄNDLER WAPPNEN SICH FÜR EINE VOLATILE FED-WOCHE🟡 GOLD (XAU/USD) AUSBLICK — 14. SEPTEMBER 2026: HÄNDLER WAPPNEN SICH FÜR EINE VOLATILE FED-WOCHE
Gold hält sich heute im Bereich von 4.335–4.345 $/oz stabil, aber lassen Sie sich von der Ruhe nicht täuschen — dies könnte eine der volatilsten Wochen für das Edelmetall in jüngster Zeit werden. Da die geldpolitische Entscheidung der Federal Reserve bevorsteht, positionieren sich Gold-Trader umsichtig rund um eine eng komprimierte Spanne, und die Ausbruchsrichtung von hier aus könnte den Ton für den Rest des Monats vorgeben. 📊
📉 WARUM GOLD UNTER DRUCK GERÄT
🟡 GOLD (XAU/USD) AUSBLICK — 14. SEPTEMBER 2026: HÄNDLER WAPPNEN SICH FÜR EINE VOLATILE FED-WOCHE
🟡 GOLD (XAU/USD) AUSBLICK — 14. SEPTEMBER 2026: HÄNDLER WAPPNEN SICH FÜR EINE VOLATILE FED-WOCHE
Gold hält sich heute im Bereich von 4.335–4.345 $/oz stabil, aber lassen Sie sich von der Ruhe nicht täuschen — dies könnte eine der volatilsten Wochen für das Edelmetall in jüngster Zeit werden. Da die geldpolitische Entscheidung der Federal Reserve bevorsteht, positionieren sich Gold-Trader umsichtig rund um eine eng komprimierte Spanne, und die Ausbruchsrichtung von hier aus könnte den Ton für den Rest des Monats vorgeben. 📊
📉 WARUM GOLD UNTER DRUCK GERÄT
Gold hält sich heute im Bereich von 4.335–4.345 $/oz stabil, aber lassen Sie sich von der Ruhe nicht täuschen — dies könnte eine der volatilsten Wochen für das Edelmetall in jüngster Zeit werden. Da die geldpolitische Entscheidung der Federal Reserve bevorsteht, positionieren sich Gold-Trader umsichtig rund um eine eng komprimierte Spanne, und die Ausbruchsrichtung von hier aus könnte den Ton für den Rest des Monats vorgeben. 📊
📉 WARUM GOLD UNTER DRUCK GERÄT
1
1
243
·
--
Artikel
Betrugsfalle in Bitcoins Psychologie: Warum „Warten auf den Boden“ Tradern die Bullenrallye kostet 🚀**Betrugsfalle in Bitcoins Psychologie: Warum „Warten auf den Boden“ Tradern die Bullenrallye kostet** 🚀
Im Jahr 2022 stürzte $BTC auf 15,5K $. Es war eines der brutalsten Bärenmärkte in der Krypto-Geschichte — FTX brach zusammen, Terra/LUNA implodierte, und Angst dominierte jede Zeitleiste. Trader, die gesehen hatten, wie Bitcoin von 69K $ fiel, waren überzeugt, dass die Blutung noch nicht vorbei war. Die Story war überall: „Wartet auf 12K $. Das muss diese Marke erneut testen, bevor es drehen kann.“
Diese 12K $ kamen nie. 😳
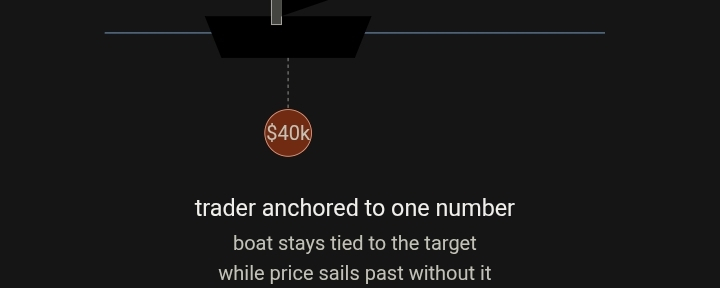
Bitcoin erreichte ein Tief nahe 15,5K $ und begann dann still eine der stärksten Erholungen in seiner Geschichte — bis hin zum Sprung auf neue Allzeithochs. Diejenigen, die abseits standen und auf eine Zahl warteten, die für sie "Sinn ergab", verpassten eines der besten Akkumulationsfenster des Jahrzehnts.
Betrugsfalle in Bitcoins Psychologie: Warum „Warten auf den Boden“ Tradern die Bullenrallye kostet 🚀
**Betrugsfalle in Bitcoins Psychologie: Warum „Warten auf den Boden“ Tradern die Bullenrallye kostet** 🚀
Im Jahr 2022 stürzte $BTC auf 15,5K $. Es war eines der brutalsten Bärenmärkte in der Krypto-Geschichte — FTX brach zusammen, Terra/LUNA implodierte, und Angst dominierte jede Zeitleiste. Trader, die gesehen hatten, wie Bitcoin von 69K $ fiel, waren überzeugt, dass die Blutung noch nicht vorbei war. Die Story war überall: „Wartet auf 12K $. Das muss diese Marke erneut testen, bevor es drehen kann.“
Diese 12K $ kamen nie. 😳
Bitcoin erreichte ein Tief nahe 15,5K $ und begann dann still eine der stärksten Erholungen in seiner Geschichte — bis hin zum Sprung auf neue Allzeithochs. Diejenigen, die abseits standen und auf eine Zahl warteten, die für sie "Sinn ergab", verpassten eines der besten Akkumulationsfenster des Jahrzehnts.
Im Jahr 2022 stürzte $BTC auf 15,5K $. Es war eines der brutalsten Bärenmärkte in der Krypto-Geschichte — FTX brach zusammen, Terra/LUNA implodierte, und Angst dominierte jede Zeitleiste. Trader, die gesehen hatten, wie Bitcoin von 69K $ fiel, waren überzeugt, dass die Blutung noch nicht vorbei war. Die Story war überall: „Wartet auf 12K $. Das muss diese Marke erneut testen, bevor es drehen kann.“
Diese 12K $ kamen nie. 😳
Bitcoin erreichte ein Tief nahe 15,5K $ und begann dann still eine der stärksten Erholungen in seiner Geschichte — bis hin zum Sprung auf neue Allzeithochs. Diejenigen, die abseits standen und auf eine Zahl warteten, die für sie "Sinn ergab", verpassten eines der besten Akkumulationsfenster des Jahrzehnts.
70
·
--
Artikel
ETH ist wieder über 2.600 $ — aber der echte Test beginnt jetzt 👀🔥# $ETH Ist wieder über 2.600 $ — aber der echte Test beginnt jetzt 👀🔥$BTC
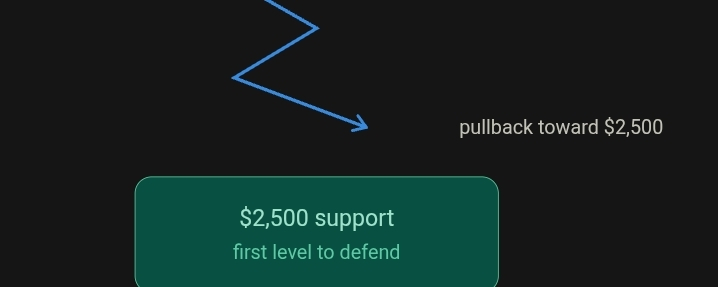
Zum ersten Mal seit Monaten hat **Ethereum** sich endlich über die Marke von 2.600 $ zurückgekämpft 🚀. Es ist ein Level, das ETH-Bullen seit Wochen verfolgt — und jedes Mal als hartnäckige Decke wirkt, wenn der Kurs versuchte, darüber zu klettern. Als es dann endlich durchbrach, kochte die Krypto-Community auf — aber die eigentliche Frage lautet nicht, ob ETH 2.600 $ noch einmal erreicht hat. Sondern: Kann es **diese Marke halten**.
## Der Move: Schnell, scharf — und ein bisschen zu schnell ⚡
ETH ist wieder über 2.600 $ — aber der echte Test beginnt jetzt 👀🔥
# $ETH Ist wieder über 2.600 $ — aber der echte Test beginnt jetzt 👀🔥$BTC
Zum ersten Mal seit Monaten hat **Ethereum** sich endlich über die Marke von 2.600 $ zurückgekämpft 🚀. Es ist ein Level, das ETH-Bullen seit Wochen verfolgt — und jedes Mal als hartnäckige Decke wirkt, wenn der Kurs versuchte, darüber zu klettern. Als es dann endlich durchbrach, kochte die Krypto-Community auf — aber die eigentliche Frage lautet nicht, ob ETH 2.600 $ noch einmal erreicht hat. Sondern: Kann es **diese Marke halten**.
## Der Move: Schnell, scharf — und ein bisschen zu schnell ⚡
Zum ersten Mal seit Monaten hat **Ethereum** sich endlich über die Marke von 2.600 $ zurückgekämpft 🚀. Es ist ein Level, das ETH-Bullen seit Wochen verfolgt — und jedes Mal als hartnäckige Decke wirkt, wenn der Kurs versuchte, darüber zu klettern. Als es dann endlich durchbrach, kochte die Krypto-Community auf — aber die eigentliche Frage lautet nicht, ob ETH 2.600 $ noch einmal erreicht hat. Sondern: Kann es **diese Marke halten**.
## Der Move: Schnell, scharf — und ein bisschen zu schnell ⚡
1
69
·
--
Artikel
🏛️ Bitcoin auf Abruf: Das Makro bestimmt den Trend🏛️ **Bitcoin auf Abruf: Das Makro bestimmt den Trend**
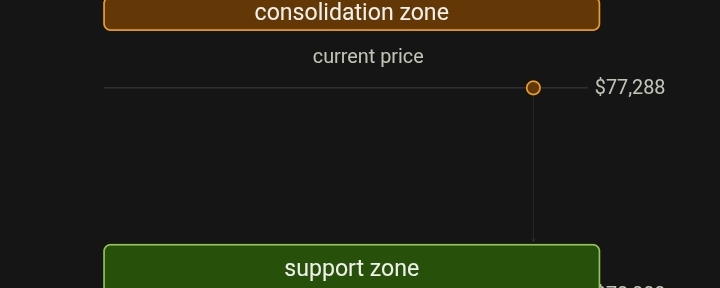
Die führende Kryptowährung wird derzeit rund um **77.288 US-Dollar** gehandelt und zeigt einen leichten lokalen Rückgang, während Käufer und Verkäufer auf eine klarere Richtung warten — und zwar von außerhalb des Krypto-Markts selbst. 📉
Das wirkt eher nicht wie ein Zeichen von Schwäche, sondern wie eine Marktpause — als würde sich der Markt erst einmal Luft holen. Bitcoin hat in den letzten Sitzungen in einer engen Spanne konsolidiert und ist nicht bereit, sich auf einen Ausbruch oder Breakdown festzulegen, bis das makroökonomische Bild klarer wird. Das ist eine Lehrbuch-„Aufschnürungs“-Phase — die Volatilität komprimiert sich vor der nächsten größeren Bewegung. 🌀
🏛️ Bitcoin auf Abruf: Das Makro bestimmt den Trend
🏛️ **Bitcoin auf Abruf: Das Makro bestimmt den Trend**
Die führende Kryptowährung wird derzeit rund um **77.288 US-Dollar** gehandelt und zeigt einen leichten lokalen Rückgang, während Käufer und Verkäufer auf eine klarere Richtung warten — und zwar von außerhalb des Krypto-Markts selbst. 📉
Das wirkt eher nicht wie ein Zeichen von Schwäche, sondern wie eine Marktpause — als würde sich der Markt erst einmal Luft holen. Bitcoin hat in den letzten Sitzungen in einer engen Spanne konsolidiert und ist nicht bereit, sich auf einen Ausbruch oder Breakdown festzulegen, bis das makroökonomische Bild klarer wird. Das ist eine Lehrbuch-„Aufschnürungs“-Phase — die Volatilität komprimiert sich vor der nächsten größeren Bewegung. 🌀
Die führende Kryptowährung wird derzeit rund um **77.288 US-Dollar** gehandelt und zeigt einen leichten lokalen Rückgang, während Käufer und Verkäufer auf eine klarere Richtung warten — und zwar von außerhalb des Krypto-Markts selbst. 📉
Das wirkt eher nicht wie ein Zeichen von Schwäche, sondern wie eine Marktpause — als würde sich der Markt erst einmal Luft holen. Bitcoin hat in den letzten Sitzungen in einer engen Spanne konsolidiert und ist nicht bereit, sich auf einen Ausbruch oder Breakdown festzulegen, bis das makroökonomische Bild klarer wird. Das ist eine Lehrbuch-„Aufschnürungs“-Phase — die Volatilität komprimiert sich vor der nächsten größeren Bewegung. 🌀
64
·
--
Artikel
Übersetzung ansehen
BTC 📉 Spot Volume Crisis: The Silent Warning Sign Crypto Traders Are Ignoring $BTC 📉 Spot Volume Crisis: The Silent Warning Sign Crypto Traders Are Ignoring
Something is happening beneath the surface of this market that deserves far more attention than it's currently getting. 🧊
While headlines chase price candles and social media obsesses over the next breakout, a quieter and arguably more important signal has been flashing red for weeks: **spot volume across the entire crypto market remains extremely low.** This is not a minor technical footnote buried in an exchange's data dashboard — it is a genuine red flag 🚩, and it deserves to be treated as one.
In this article, we're going to unpack exactly why thin spot volume matters so much, what it tells us about the psychology of the market right now, why leverage and derivatives have quietly become the dominant force in crypto trading, and — most importantly — what traders can actually do about it. This is a long read, but if you trade crypto in any capacity, on Binance or anywhere else, it's worth your full attention. ☕
---
## 1. Why Spot Volume Is the Market's Heartbeat 💓
Let's start with the basics, because understanding *why* spot volume matters is the foundation for everything else in this article.
Spot trading is the simplest form of market participation: you buy an asset, you own it outright, and you sell it when you choose to. No leverage, no borrowed funds, no liquidation price hovering over your head like a guillotine. When someone buys $BTC on the spot market, they are making a genuine, capital-backed bet on the asset. There's no artificial amplification — just real money changing hands for real ownership.
This is precisely why spot volume functions as one of the most honest barometers of market health. It reflects:
- 🧑💼 **Genuine capital deployment** — real money entering or exiting positions
- 📈 **Conviction** — spot buyers are not chasing quick leveraged gains; they're making longer-horizon bets
- 🌍 **Broad participation** — spot markets are where retail, institutions, and long-term holders interact most directly
- 🔍 **Price discovery integrity** — spot prices anchor the "fair value" that derivatives markets reference
When spot volume is healthy and rising, it usually means fresh capital — often retail capital — is flowing into the ecosystem. New wallets are being funded, new positions are being opened, and the market is widening its base of participants. This is the kind of activity that sustains multi-month uptrends, because it represents durable ownership rather than short-term speculative churn.
When spot volume collapses, as it has now, it tells a very different story. It suggests that:
1. Existing holders are simply sitting still, neither buying more nor selling
2. New capital isn't entering the market in meaningful size
3. Whatever price action *is* happening is increasingly being driven by leveraged bets rather than organic buying and selling
This third point is the crux of the entire problem, and we'll come back to it repeatedly throughout this piece.
---
## 2. What Low Spot Volume Really Tells Us 🔬
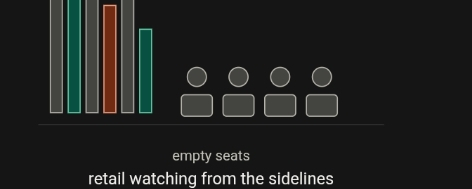
When spot trading activity dries up across the board — not just for Bitcoin, but across the broader crypto market — it is a strong sign of **retail disengagement**. 🚪
Retail traders, by nature, tend to be the most active spot participants. They buy coins on exchanges like Binance, hold them in their accounts or move them to personal wallets, and generally interact with the market in the most "vanilla" way possible. When retail interest is high, spot volume surges — think back to previous bull cycles where exchange sign-ups spiked, spot order books were thick, and social media buzzed with new entrants sharing screenshots of their portfolios.
Right now, that energy is conspicuously absent. And this absence tells us something important: **a large portion of existing holders are choosing to sit on their positions rather than actively trade them.**
This might sound harmless at first glance — "holding" is often praised as a virtuous, patient strategy in crypto culture. But when this kind of passive holding becomes market-wide and volume disappears almost entirely, it starts to resemble something closer to stagnation than conviction. It can indicate:
- 😴 **Fatigue** — traders who have been through multiple cycles are simply tired of chasing volatility
- 🤷 **Uncertainty** — without a clear catalyst, participants would rather wait than commit fresh capital
- 💤 **Complacency** — holders assume the asset will "figure itself out" over time without needing active management
- 🧱 **Illiquidity risk building silently** — thin books mean that when volume *does* return, moves can be far more violent in either direction
None of these are inherently catastrophic on their own. But together, they paint a picture of a market that has lost some of its organic vibrancy — the kind of vibrancy that comes from millions of individual participants actively expressing views through buying and selling.
And when the organic layer of the market goes quiet, guess what fills the void? 👇
---
## 3. Derivatives and Leverage Are Quietly Taking Over 🎰
At the same time that spot volume has been drying up, derivatives and leverage are becoming increasingly normalized — especially among inexperienced traders. This is arguably the most concerning half of the current market structure.
Perpetual futures, options, and other derivative products were originally designed as tools for sophisticated market participants: hedgers managing risk, market makers balancing exposure, and professional traders expressing nuanced views with defined risk parameters. Used correctly, derivatives are powerful and legitimate financial instruments. ⚙️
But that is not how they are being used by a growing share of the market today.
Instead, we're seeing:
- 🎯 Retail traders opening 20x, 50x, even 100x leveraged positions on volatile altcoins
- 📱 Trading apps gamifying leverage with slick interfaces that make it feel as casual as placing a bet on a sports app
- 🔁 A culture where "spot trading" is dismissed as slow or boring compared to the dopamine rush of leveraged plays
- 💸 Traders chasing quick, outsized returns rather than building long-term positions
The result? **The number of traders losing money right now is among the highest we've seen historically.** This is not speculation — it is a pattern that repeats itself across every market cycle, and crypto is no exception. Leverage doesn't just amplify gains; it amplifies losses at an even faster rate because of how liquidation mechanics work.
### 3.1 The Mathematics of Leverage Losses 🧮
It's worth pausing here to actually walk through *why* leverage is so punishing, because understanding the mechanics makes the danger much more concrete.
Imagine a trader opens a 20x leveraged long position on Bitcoin. This means their exposure to price movement is 20 times larger than their actual deposited capital. At 20x leverage, a mere **5% adverse move** against their position is enough to wipe out their entire margin and trigger liquidation.
Now consider that Bitcoin — and especially altcoins — routinely move 5%, 10%, even 20% in a single day, sometimes within a matter of hours. A trader using high leverage isn't just taking on directional risk; they're taking on a bet that the market won't experience *normal, everyday volatility* against them before they can react. Given how frequently crypto assets swing by these magnitudes, the odds are stacked heavily against leveraged retail traders over any extended period.
This is why exchange liquidation data consistently shows **billions of dollars in leveraged positions being wiped out** during even modest market corrections. It's not that these traders were "wrong" about the long-term direction of the asset — many of them may have even been directionally correct. They simply didn't survive the volatility long enough to be right.
### 3.2 Why Inexperienced Traders Are Especially Vulnerable 🎯
There's a specific reason this article emphasizes *inexperienced* traders in the context of leverage normalization. Experienced traders who use derivatives typically:
- ✅ Size their positions conservatively relative to their total capital
- ✅ Use stop-losses and clearly defined risk parameters
- ✅ Understand funding rates, liquidation mechanics, and margin requirements deeply
- ✅ Treat leverage as a tool for specific, calculated strategies — not a default mode of trading
Newer traders, by contrast, are often drawn into leverage because of:
- 📲 Marketing that emphasizes potential upside while downplaying risk
- 👀 Social media culture that celebrates "10x gains" screenshots while liquidation stories quietly disappear
- 🧠 A lack of understanding of exactly how quickly liquidation can occur
- 🎢 The emotional pull of wanting to "catch up" after missing previous rallies
This creates a dangerous feedback loop: as spot volume dries up and organic price discovery weakens, the market becomes more dependent on leveraged positioning to generate price movement — and that leveraged positioning is disproportionately held by traders least equipped to manage its risks.
---
## 4. The Feedback Loop Between Thin Spot Markets and Leverage-Driven Volatility 🔄
Let's connect these two phenomena directly, because they don't exist in isolation — they actively reinforce each other.
When spot volume is thin, order books are naturally shallower. This means it takes *less* actual capital to move price significantly in either direction. Combine this with a market where a large share of active participants are using leverage, and you get a structure that is prone to sharp, exaggerated moves — both up and down — that don't necessarily reflect genuine shifts in underlying value or sentiment.
Here's how the cycle typically plays out:
1. 🧊 Spot volume is low, meaning fewer genuine buyers/sellers are anchoring price
2. 📊 Leveraged positions build up in one direction (often driven by short-term sentiment or momentum)
3. ⚡ A relatively small price move triggers a cascade of liquidations
4. 💥 These forced liquidations cause an outsized, mechanical price swing — unrelated to any real news or fundamental shift
5. 😱 This volatility spooks remaining spot holders, who become even more hesitant to engage
6. 🔁 Spot volume drops further, and the cycle repeats
This is precisely the dynamic playing out in the current market. The relative absence of spot participants means that derivatives-driven volatility has an outsized effect on price, creating a market that *feels* far more chaotic and unpredictable than the underlying fundamentals might suggest.
For long-term holders, this can be genuinely disorienting. Prices swing violently on volumes that, historically, would have caused only modest movement. This isn't necessarily a reflection of changing fundamentals — it's a reflection of market *structure*, and understanding that distinction is critical for maintaining a clear head.
---
## 5. A Look Back: Historical Parallels 📚
This isn't the first time the crypto market has experienced a divergence between spot and derivatives activity. Understanding past cycles can offer useful — though never perfectly predictive — context.
In previous cycles, periods of low spot volume combined with elevated leverage usage have often preceded either:
- 🧹 **Sharp shakeouts** — where over-leveraged positions get flushed out violently, often followed by a healthier, more spot-driven recovery
- 😐 **Prolonged consolidation** — where the market essentially "waits" for genuine capital to return before any sustained trend can develop
What's notable is that in both scenarios, the eventual resolution tends to favor those who were positioned in spot rather than leverage. Traders holding spot positions can simply wait out volatility — they have no liquidation price, no margin calls, no forced exits. They can ride out even severe drawdowns as long as their underlying thesis about the asset remains intact.
Leveraged traders, on the other hand, often don't get the luxury of waiting. They can be right about the market's eventual direction and still lose everything simply because they didn't survive the interim volatility.
This is not a new lesson, but it's one that seems to need re-learning by each new wave of market entrants — which brings us to the most important part of this article.
---
## 6. Traders, Come Back to the Spot Market 🏠
Traders, come back to the spot market. Your chances of long-term success are much higher there. This isn't a moralistic statement or an attempt to shame anyone using derivatives — it's simply a reflection of risk mathematics and market structure.
Here's why spot participation tends to produce better long-term outcomes for the vast majority of traders:
### 6.1 No Liquidation Risk ✅
When you own an asset outright, there is no price at which your position is forcibly closed against your will. You can hold through drawdowns of 30%, 50%, even 80% if your conviction and risk tolerance allow for it. Leveraged traders rarely have this luxury — their liquidation price is fixed the moment they open a position, regardless of how the story ultimately unfolds.
### 6.2 Time Becomes Your Ally, Not Your Enemy ⏳
In spot markets, time works in your favor if your thesis is correct. You can simply wait for the market to validate your view. In leveraged positions, time often works against you — funding rates accumulate, margin requirements can tighten, and volatility has more opportunities to trigger a liquidation the longer a position stays open.
### 6.3 Reduced Emotional Decision-Making 🧘
Leverage inherently increases emotional intensity. Watching a highly leveraged position swing violently in either direction triggers stress responses that lead to poor decision-making — panic selling, revenge trading, or doubling down irrationally. Spot positions, by contrast, allow for a calmer, more rational approach to portfolio management.
### 6.4 Alignment With Long-Term Market Health 🌱
Spot buying genuinely contributes to price discovery and market health. Every spot purchase represents real capital that supports the underlying asset's price floor. Leveraged positions, by contrast, are often net-neutral or even destabilizing to the broader market — they don't represent new capital entering the ecosystem, just bets on price direction using borrowed exposure.
### 6.5 Simpler Risk Management 📐
Spot trading only requires you to manage one variable: how much capital you're willing to allocate to an asset. Leveraged trading requires managing margin, liquidation price, funding rates, and position sizing simultaneously — a far more complex task that leaves more room for costly mistakes, especially for less experienced traders.
---
## 7. What This Means for the Market Going Forward 🔮
So where does this leave us? The combination of thin spot volume and elevated leverage usage suggests the current market is more fragile than headline price action might suggest. This doesn't necessarily mean a crash is imminent — but it does mean that:
- 📉 Price moves may not accurately reflect genuine shifts in sentiment or fundamentals
- ⚡ Volatility is likely to remain elevated, driven by leverage-based liquidations rather than organic buying/selling
- 🕵️ Traders should be cautious about reading too much into short-term price action as a signal of underlying strength or weakness
- 🌊 A genuine, sustainable trend — in either direction — will likely require spot volume to meaningfully recover first
For those watching the market closely, spot volume recovery should be treated as one of the most important signals to track. When genuine buying and selling activity returns to healthy levels, it will indicate that real capital — not just leveraged speculation — is driving the market's next move.
---
## 8. Practical Takeaways for Traders 🛠️
Let's bring this back to something actionable. If you're actively trading in this environment, here are some principles worth internalizing:
1. 🧮 **Reassess your leverage usage.** If you're using high leverage as a default trading style rather than a deliberate, occasional tool, this is a good moment to reconsider that approach.
2. 🏗️ **Prioritize building your spot base.** A larger portion of your portfolio in spot-held assets reduces your vulnerability to liquidation cascades and gives you staying power through volatility.
3. 📖 **Study liquidation data alongside price charts.** Understanding when large liquidation events are driving price moves — rather than genuine sentiment shifts — can help you avoid overreacting to noise.
4. 🧘 **Manage position sizing conservatively.** Even when using derivatives, keeping position sizes small relative to your total capital preserves your ability to stay in the game long enough for your thesis to play out.
5. ⏳ **Adopt a longer time horizon where possible.** Spot holding rewards patience. The traders who tend to come out ahead across full market cycles are rarely the ones chasing every short-term swing with maximum leverage.
---
## 9. Closing Thoughts 💭
The current environment — extremely low spot volume paired with widespread leverage usage among inexperienced traders — is not a reason for panic, but it is absolutely a reason for awareness. Markets built primarily on leveraged speculation rather than genuine spot participation tend to be more fragile, more volatile, and ultimately less rewarding for the average participant.
The path forward for traders who want to improve their long-term odds is straightforward, even if it isn't always exciting: prioritize spot ownership, manage leverage with discipline and respect, and pay close attention to genuine market participation signals like spot volume rather than getting swept up in
short-term leveraged price swings.
Traders, come back to the spot market. Your chances of long-term success are much higher there. 🌱📈
---
#BTC #CryptoMarket #SpotTrading #Leverage #BİNANCE
$BTC
{future}(BTCUSDT)
BTC 📉 Spot Volume Crisis: The Silent Warning Sign Crypto Traders Are Ignoring
$BTC 📉 Spot Volume Crisis: The Silent Warning Sign Crypto Traders Are Ignoring
Something is happening beneath the surface of this market that deserves far more attention than it's currently getting. 🧊
While headlines chase price candles and social media obsesses over the next breakout, a quieter and arguably more important signal has been flashing red for weeks: **spot volume across the entire crypto market remains extremely low.** This is not a minor technical footnote buried in an exchange's data dashboard — it is a genuine red flag 🚩, and it deserves to be treated as one.
In this article, we're going to unpack exactly why thin spot volume matters so much, what it tells us about the psychology of the market right now, why leverage and derivatives have quietly become the dominant force in crypto trading, and — most importantly — what traders can actually do about it. This is a long read, but if you trade crypto in any capacity, on Binance or anywhere else, it's worth your full attention. ☕
---
## 1. Why Spot Volume Is the Market's Heartbeat 💓
Let's start with the basics, because understanding *why* spot volume matters is the foundation for everything else in this article.
Spot trading is the simplest form of market participation: you buy an asset, you own it outright, and you sell it when you choose to. No leverage, no borrowed funds, no liquidation price hovering over your head like a guillotine. When someone buys $BTC on the spot market, they are making a genuine, capital-backed bet on the asset. There's no artificial amplification — just real money changing hands for real ownership.
This is precisely why spot volume functions as one of the most honest barometers of market health. It reflects:
- 🧑💼 **Genuine capital deployment** — real money entering or exiting positions
- 📈 **Conviction** — spot buyers are not chasing quick leveraged gains; they're making longer-horizon bets
- 🌍 **Broad participation** — spot markets are where retail, institutions, and long-term holders interact most directly
- 🔍 **Price discovery integrity** — spot prices anchor the "fair value" that derivatives markets reference
When spot volume is healthy and rising, it usually means fresh capital — often retail capital — is flowing into the ecosystem. New wallets are being funded, new positions are being opened, and the market is widening its base of participants. This is the kind of activity that sustains multi-month uptrends, because it represents durable ownership rather than short-term speculative churn.
When spot volume collapses, as it has now, it tells a very different story. It suggests that:
1. Existing holders are simply sitting still, neither buying more nor selling
2. New capital isn't entering the market in meaningful size
3. Whatever price action *is* happening is increasingly being driven by leveraged bets rather than organic buying and selling
This third point is the crux of the entire problem, and we'll come back to it repeatedly throughout this piece.
---
## 2. What Low Spot Volume Really Tells Us 🔬
When spot trading activity dries up across the board — not just for Bitcoin, but across the broader crypto market — it is a strong sign of **retail disengagement**. 🚪
Retail traders, by nature, tend to be the most active spot participants. They buy coins on exchanges like Binance, hold them in their accounts or move them to personal wallets, and generally interact with the market in the most "vanilla" way possible. When retail interest is high, spot volume surges — think back to previous bull cycles where exchange sign-ups spiked, spot order books were thick, and social media buzzed with new entrants sharing screenshots of their portfolios.
Right now, that energy is conspicuously absent. And this absence tells us something important: **a large portion of existing holders are choosing to sit on their positions rather than actively trade them.**
This might sound harmless at first glance — "holding" is often praised as a virtuous, patient strategy in crypto culture. But when this kind of passive holding becomes market-wide and volume disappears almost entirely, it starts to resemble something closer to stagnation than conviction. It can indicate:
- 😴 **Fatigue** — traders who have been through multiple cycles are simply tired of chasing volatility
- 🤷 **Uncertainty** — without a clear catalyst, participants would rather wait than commit fresh capital
- 💤 **Complacency** — holders assume the asset will "figure itself out" over time without needing active management
- 🧱 **Illiquidity risk building silently** — thin books mean that when volume *does* return, moves can be far more violent in either direction
None of these are inherently catastrophic on their own. But together, they paint a picture of a market that has lost some of its organic vibrancy — the kind of vibrancy that comes from millions of individual participants actively expressing views through buying and selling.
And when the organic layer of the market goes quiet, guess what fills the void? 👇
---
## 3. Derivatives and Leverage Are Quietly Taking Over 🎰
At the same time that spot volume has been drying up, derivatives and leverage are becoming increasingly normalized — especially among inexperienced traders. This is arguably the most concerning half of the current market structure.
Perpetual futures, options, and other derivative products were originally designed as tools for sophisticated market participants: hedgers managing risk, market makers balancing exposure, and professional traders expressing nuanced views with defined risk parameters. Used correctly, derivatives are powerful and legitimate financial instruments. ⚙️
But that is not how they are being used by a growing share of the market today.
Instead, we're seeing:
- 🎯 Retail traders opening 20x, 50x, even 100x leveraged positions on volatile altcoins
- 📱 Trading apps gamifying leverage with slick interfaces that make it feel as casual as placing a bet on a sports app
- 🔁 A culture where "spot trading" is dismissed as slow or boring compared to the dopamine rush of leveraged plays
- 💸 Traders chasing quick, outsized returns rather than building long-term positions
The result? **The number of traders losing money right now is among the highest we've seen historically.** This is not speculation — it is a pattern that repeats itself across every market cycle, and crypto is no exception. Leverage doesn't just amplify gains; it amplifies losses at an even faster rate because of how liquidation mechanics work.
### 3.1 The Mathematics of Leverage Losses 🧮
It's worth pausing here to actually walk through *why* leverage is so punishing, because understanding the mechanics makes the danger much more concrete.
Imagine a trader opens a 20x leveraged long position on Bitcoin. This means their exposure to price movement is 20 times larger than their actual deposited capital. At 20x leverage, a mere **5% adverse move** against their position is enough to wipe out their entire margin and trigger liquidation.
Now consider that Bitcoin — and especially altcoins — routinely move 5%, 10%, even 20% in a single day, sometimes within a matter of hours. A trader using high leverage isn't just taking on directional risk; they're taking on a bet that the market won't experience *normal, everyday volatility* against them before they can react. Given how frequently crypto assets swing by these magnitudes, the odds are stacked heavily against leveraged retail traders over any extended period.
This is why exchange liquidation data consistently shows **billions of dollars in leveraged positions being wiped out** during even modest market corrections. It's not that these traders were "wrong" about the long-term direction of the asset — many of them may have even been directionally correct. They simply didn't survive the volatility long enough to be right.
### 3.2 Why Inexperienced Traders Are Especially Vulnerable 🎯
There's a specific reason this article emphasizes *inexperienced* traders in the context of leverage normalization. Experienced traders who use derivatives typically:
- ✅ Size their positions conservatively relative to their total capital
- ✅ Use stop-losses and clearly defined risk parameters
- ✅ Understand funding rates, liquidation mechanics, and margin requirements deeply
- ✅ Treat leverage as a tool for specific, calculated strategies — not a default mode of trading
Newer traders, by contrast, are often drawn into leverage because of:
- 📲 Marketing that emphasizes potential upside while downplaying risk
- 👀 Social media culture that celebrates "10x gains" screenshots while liquidation stories quietly disappear
- 🧠 A lack of understanding of exactly how quickly liquidation can occur
- 🎢 The emotional pull of wanting to "catch up" after missing previous rallies
This creates a dangerous feedback loop: as spot volume dries up and organic price discovery weakens, the market becomes more dependent on leveraged positioning to generate price movement — and that leveraged positioning is disproportionately held by traders least equipped to manage its risks.
---
## 4. The Feedback Loop Between Thin Spot Markets and Leverage-Driven Volatility 🔄
Let's connect these two phenomena directly, because they don't exist in isolation — they actively reinforce each other.
When spot volume is thin, order books are naturally shallower. This means it takes *less* actual capital to move price significantly in either direction. Combine this with a market where a large share of active participants are using leverage, and you get a structure that is prone to sharp, exaggerated moves — both up and down — that don't necessarily reflect genuine shifts in underlying value or sentiment.
Here's how the cycle typically plays out:
1. 🧊 Spot volume is low, meaning fewer genuine buyers/sellers are anchoring price
2. 📊 Leveraged positions build up in one direction (often driven by short-term sentiment or momentum)
3. ⚡ A relatively small price move triggers a cascade of liquidations
4. 💥 These forced liquidations cause an outsized, mechanical price swing — unrelated to any real news or fundamental shift
5. 😱 This volatility spooks remaining spot holders, who become even more hesitant to engage
6. 🔁 Spot volume drops further, and the cycle repeats
This is precisely the dynamic playing out in the current market. The relative absence of spot participants means that derivatives-driven volatility has an outsized effect on price, creating a market that *feels* far more chaotic and unpredictable than the underlying fundamentals might suggest.
For long-term holders, this can be genuinely disorienting. Prices swing violently on volumes that, historically, would have caused only modest movement. This isn't necessarily a reflection of changing fundamentals — it's a reflection of market *structure*, and understanding that distinction is critical for maintaining a clear head.
---
## 5. A Look Back: Historical Parallels 📚
This isn't the first time the crypto market has experienced a divergence between spot and derivatives activity. Understanding past cycles can offer useful — though never perfectly predictive — context.
In previous cycles, periods of low spot volume combined with elevated leverage usage have often preceded either:
- 🧹 **Sharp shakeouts** — where over-leveraged positions get flushed out violently, often followed by a healthier, more spot-driven recovery
- 😐 **Prolonged consolidation** — where the market essentially "waits" for genuine capital to return before any sustained trend can develop
What's notable is that in both scenarios, the eventual resolution tends to favor those who were positioned in spot rather than leverage. Traders holding spot positions can simply wait out volatility — they have no liquidation price, no margin calls, no forced exits. They can ride out even severe drawdowns as long as their underlying thesis about the asset remains intact.
Leveraged traders, on the other hand, often don't get the luxury of waiting. They can be right about the market's eventual direction and still lose everything simply because they didn't survive the interim volatility.
This is not a new lesson, but it's one that seems to need re-learning by each new wave of market entrants — which brings us to the most important part of this article.
---
## 6. Traders, Come Back to the Spot Market 🏠
Traders, come back to the spot market. Your chances of long-term success are much higher there. This isn't a moralistic statement or an attempt to shame anyone using derivatives — it's simply a reflection of risk mathematics and market structure.
Here's why spot participation tends to produce better long-term outcomes for the vast majority of traders:
### 6.1 No Liquidation Risk ✅
When you own an asset outright, there is no price at which your position is forcibly closed against your will. You can hold through drawdowns of 30%, 50%, even 80% if your conviction and risk tolerance allow for it. Leveraged traders rarely have this luxury — their liquidation price is fixed the moment they open a position, regardless of how the story ultimately unfolds.
### 6.2 Time Becomes Your Ally, Not Your Enemy ⏳
In spot markets, time works in your favor if your thesis is correct. You can simply wait for the market to validate your view. In leveraged positions, time often works against you — funding rates accumulate, margin requirements can tighten, and volatility has more opportunities to trigger a liquidation the longer a position stays open.
### 6.3 Reduced Emotional Decision-Making 🧘
Leverage inherently increases emotional intensity. Watching a highly leveraged position swing violently in either direction triggers stress responses that lead to poor decision-making — panic selling, revenge trading, or doubling down irrationally. Spot positions, by contrast, allow for a calmer, more rational approach to portfolio management.
### 6.4 Alignment With Long-Term Market Health 🌱
Spot buying genuinely contributes to price discovery and market health. Every spot purchase represents real capital that supports the underlying asset's price floor. Leveraged positions, by contrast, are often net-neutral or even destabilizing to the broader market — they don't represent new capital entering the ecosystem, just bets on price direction using borrowed exposure.
### 6.5 Simpler Risk Management 📐
Spot trading only requires you to manage one variable: how much capital you're willing to allocate to an asset. Leveraged trading requires managing margin, liquidation price, funding rates, and position sizing simultaneously — a far more complex task that leaves more room for costly mistakes, especially for less experienced traders.
---
## 7. What This Means for the Market Going Forward 🔮
So where does this leave us? The combination of thin spot volume and elevated leverage usage suggests the current market is more fragile than headline price action might suggest. This doesn't necessarily mean a crash is imminent — but it does mean that:
- 📉 Price moves may not accurately reflect genuine shifts in sentiment or fundamentals
- ⚡ Volatility is likely to remain elevated, driven by leverage-based liquidations rather than organic buying/selling
- 🕵️ Traders should be cautious about reading too much into short-term price action as a signal of underlying strength or weakness
- 🌊 A genuine, sustainable trend — in either direction — will likely require spot volume to meaningfully recover first
For those watching the market closely, spot volume recovery should be treated as one of the most important signals to track. When genuine buying and selling activity returns to healthy levels, it will indicate that real capital — not just leveraged speculation — is driving the market's next move.
---
## 8. Practical Takeaways for Traders 🛠️
Let's bring this back to something actionable. If you're actively trading in this environment, here are some principles worth internalizing:
1. 🧮 **Reassess your leverage usage.** If you're using high leverage as a default trading style rather than a deliberate, occasional tool, this is a good moment to reconsider that approach.
2. 🏗️ **Prioritize building your spot base.** A larger portion of your portfolio in spot-held assets reduces your vulnerability to liquidation cascades and gives you staying power through volatility.
3. 📖 **Study liquidation data alongside price charts.** Understanding when large liquidation events are driving price moves — rather than genuine sentiment shifts — can help you avoid overreacting to noise.
4. 🧘 **Manage position sizing conservatively.** Even when using derivatives, keeping position sizes small relative to your total capital preserves your ability to stay in the game long enough for your thesis to play out.
5. ⏳ **Adopt a longer time horizon where possible.** Spot holding rewards patience. The traders who tend to come out ahead across full market cycles are rarely the ones chasing every short-term swing with maximum leverage.
---
## 9. Closing Thoughts 💭
The current environment — extremely low spot volume paired with widespread leverage usage among inexperienced traders — is not a reason for panic, but it is absolutely a reason for awareness. Markets built primarily on leveraged speculation rather than genuine spot participation tend to be more fragile, more volatile, and ultimately less rewarding for the average participant.
The path forward for traders who want to improve their long-term odds is straightforward, even if it isn't always exciting: prioritize spot ownership, manage leverage with discipline and respect, and pay close attention to genuine market participation signals like spot volume rather than getting swept up in
short-term leveraged price swings.
Traders, come back to the spot market. Your chances of long-term success are much higher there. 🌱📈
---
#BTC #CryptoMarket #SpotTrading #Leverage #BİNANCE
$BTC
Something is happening beneath the surface of this market that deserves far more attention than it's currently getting. 🧊
While headlines chase price candles and social media obsesses over the next breakout, a quieter and arguably more important signal has been flashing red for weeks: **spot volume across the entire crypto market remains extremely low.** This is not a minor technical footnote buried in an exchange's data dashboard — it is a genuine red flag 🚩, and it deserves to be treated as one.
In this article, we're going to unpack exactly why thin spot volume matters so much, what it tells us about the psychology of the market right now, why leverage and derivatives have quietly become the dominant force in crypto trading, and — most importantly — what traders can actually do about it. This is a long read, but if you trade crypto in any capacity, on Binance or anywhere else, it's worth your full attention. ☕
---
## 1. Why Spot Volume Is the Market's Heartbeat 💓
Let's start with the basics, because understanding *why* spot volume matters is the foundation for everything else in this article.
Spot trading is the simplest form of market participation: you buy an asset, you own it outright, and you sell it when you choose to. No leverage, no borrowed funds, no liquidation price hovering over your head like a guillotine. When someone buys $BTC on the spot market, they are making a genuine, capital-backed bet on the asset. There's no artificial amplification — just real money changing hands for real ownership.
This is precisely why spot volume functions as one of the most honest barometers of market health. It reflects:
- 🧑💼 **Genuine capital deployment** — real money entering or exiting positions
- 📈 **Conviction** — spot buyers are not chasing quick leveraged gains; they're making longer-horizon bets
- 🌍 **Broad participation** — spot markets are where retail, institutions, and long-term holders interact most directly
- 🔍 **Price discovery integrity** — spot prices anchor the "fair value" that derivatives markets reference
When spot volume is healthy and rising, it usually means fresh capital — often retail capital — is flowing into the ecosystem. New wallets are being funded, new positions are being opened, and the market is widening its base of participants. This is the kind of activity that sustains multi-month uptrends, because it represents durable ownership rather than short-term speculative churn.
When spot volume collapses, as it has now, it tells a very different story. It suggests that:
1. Existing holders are simply sitting still, neither buying more nor selling
2. New capital isn't entering the market in meaningful size
3. Whatever price action *is* happening is increasingly being driven by leveraged bets rather than organic buying and selling
This third point is the crux of the entire problem, and we'll come back to it repeatedly throughout this piece.
---
## 2. What Low Spot Volume Really Tells Us 🔬
When spot trading activity dries up across the board — not just for Bitcoin, but across the broader crypto market — it is a strong sign of **retail disengagement**. 🚪
Retail traders, by nature, tend to be the most active spot participants. They buy coins on exchanges like Binance, hold them in their accounts or move them to personal wallets, and generally interact with the market in the most "vanilla" way possible. When retail interest is high, spot volume surges — think back to previous bull cycles where exchange sign-ups spiked, spot order books were thick, and social media buzzed with new entrants sharing screenshots of their portfolios.
Right now, that energy is conspicuously absent. And this absence tells us something important: **a large portion of existing holders are choosing to sit on their positions rather than actively trade them.**
This might sound harmless at first glance — "holding" is often praised as a virtuous, patient strategy in crypto culture. But when this kind of passive holding becomes market-wide and volume disappears almost entirely, it starts to resemble something closer to stagnation than conviction. It can indicate:
- 😴 **Fatigue** — traders who have been through multiple cycles are simply tired of chasing volatility
- 🤷 **Uncertainty** — without a clear catalyst, participants would rather wait than commit fresh capital
- 💤 **Complacency** — holders assume the asset will "figure itself out" over time without needing active management
- 🧱 **Illiquidity risk building silently** — thin books mean that when volume *does* return, moves can be far more violent in either direction
None of these are inherently catastrophic on their own. But together, they paint a picture of a market that has lost some of its organic vibrancy — the kind of vibrancy that comes from millions of individual participants actively expressing views through buying and selling.
And when the organic layer of the market goes quiet, guess what fills the void? 👇
---
## 3. Derivatives and Leverage Are Quietly Taking Over 🎰
At the same time that spot volume has been drying up, derivatives and leverage are becoming increasingly normalized — especially among inexperienced traders. This is arguably the most concerning half of the current market structure.
Perpetual futures, options, and other derivative products were originally designed as tools for sophisticated market participants: hedgers managing risk, market makers balancing exposure, and professional traders expressing nuanced views with defined risk parameters. Used correctly, derivatives are powerful and legitimate financial instruments. ⚙️
But that is not how they are being used by a growing share of the market today.
Instead, we're seeing:
- 🎯 Retail traders opening 20x, 50x, even 100x leveraged positions on volatile altcoins
- 📱 Trading apps gamifying leverage with slick interfaces that make it feel as casual as placing a bet on a sports app
- 🔁 A culture where "spot trading" is dismissed as slow or boring compared to the dopamine rush of leveraged plays
- 💸 Traders chasing quick, outsized returns rather than building long-term positions
The result? **The number of traders losing money right now is among the highest we've seen historically.** This is not speculation — it is a pattern that repeats itself across every market cycle, and crypto is no exception. Leverage doesn't just amplify gains; it amplifies losses at an even faster rate because of how liquidation mechanics work.
### 3.1 The Mathematics of Leverage Losses 🧮
It's worth pausing here to actually walk through *why* leverage is so punishing, because understanding the mechanics makes the danger much more concrete.
Imagine a trader opens a 20x leveraged long position on Bitcoin. This means their exposure to price movement is 20 times larger than their actual deposited capital. At 20x leverage, a mere **5% adverse move** against their position is enough to wipe out their entire margin and trigger liquidation.
Now consider that Bitcoin — and especially altcoins — routinely move 5%, 10%, even 20% in a single day, sometimes within a matter of hours. A trader using high leverage isn't just taking on directional risk; they're taking on a bet that the market won't experience *normal, everyday volatility* against them before they can react. Given how frequently crypto assets swing by these magnitudes, the odds are stacked heavily against leveraged retail traders over any extended period.
This is why exchange liquidation data consistently shows **billions of dollars in leveraged positions being wiped out** during even modest market corrections. It's not that these traders were "wrong" about the long-term direction of the asset — many of them may have even been directionally correct. They simply didn't survive the volatility long enough to be right.
### 3.2 Why Inexperienced Traders Are Especially Vulnerable 🎯
There's a specific reason this article emphasizes *inexperienced* traders in the context of leverage normalization. Experienced traders who use derivatives typically:
- ✅ Size their positions conservatively relative to their total capital
- ✅ Use stop-losses and clearly defined risk parameters
- ✅ Understand funding rates, liquidation mechanics, and margin requirements deeply
- ✅ Treat leverage as a tool for specific, calculated strategies — not a default mode of trading
Newer traders, by contrast, are often drawn into leverage because of:
- 📲 Marketing that emphasizes potential upside while downplaying risk
- 👀 Social media culture that celebrates "10x gains" screenshots while liquidation stories quietly disappear
- 🧠 A lack of understanding of exactly how quickly liquidation can occur
- 🎢 The emotional pull of wanting to "catch up" after missing previous rallies
This creates a dangerous feedback loop: as spot volume dries up and organic price discovery weakens, the market becomes more dependent on leveraged positioning to generate price movement — and that leveraged positioning is disproportionately held by traders least equipped to manage its risks.
---
## 4. The Feedback Loop Between Thin Spot Markets and Leverage-Driven Volatility 🔄
Let's connect these two phenomena directly, because they don't exist in isolation — they actively reinforce each other.
When spot volume is thin, order books are naturally shallower. This means it takes *less* actual capital to move price significantly in either direction. Combine this with a market where a large share of active participants are using leverage, and you get a structure that is prone to sharp, exaggerated moves — both up and down — that don't necessarily reflect genuine shifts in underlying value or sentiment.
Here's how the cycle typically plays out:
1. 🧊 Spot volume is low, meaning fewer genuine buyers/sellers are anchoring price
2. 📊 Leveraged positions build up in one direction (often driven by short-term sentiment or momentum)
3. ⚡ A relatively small price move triggers a cascade of liquidations
4. 💥 These forced liquidations cause an outsized, mechanical price swing — unrelated to any real news or fundamental shift
5. 😱 This volatility spooks remaining spot holders, who become even more hesitant to engage
6. 🔁 Spot volume drops further, and the cycle repeats
This is precisely the dynamic playing out in the current market. The relative absence of spot participants means that derivatives-driven volatility has an outsized effect on price, creating a market that *feels* far more chaotic and unpredictable than the underlying fundamentals might suggest.
For long-term holders, this can be genuinely disorienting. Prices swing violently on volumes that, historically, would have caused only modest movement. This isn't necessarily a reflection of changing fundamentals — it's a reflection of market *structure*, and understanding that distinction is critical for maintaining a clear head.
---
## 5. A Look Back: Historical Parallels 📚
This isn't the first time the crypto market has experienced a divergence between spot and derivatives activity. Understanding past cycles can offer useful — though never perfectly predictive — context.
In previous cycles, periods of low spot volume combined with elevated leverage usage have often preceded either:
- 🧹 **Sharp shakeouts** — where over-leveraged positions get flushed out violently, often followed by a healthier, more spot-driven recovery
- 😐 **Prolonged consolidation** — where the market essentially "waits" for genuine capital to return before any sustained trend can develop
What's notable is that in both scenarios, the eventual resolution tends to favor those who were positioned in spot rather than leverage. Traders holding spot positions can simply wait out volatility — they have no liquidation price, no margin calls, no forced exits. They can ride out even severe drawdowns as long as their underlying thesis about the asset remains intact.
Leveraged traders, on the other hand, often don't get the luxury of waiting. They can be right about the market's eventual direction and still lose everything simply because they didn't survive the interim volatility.
This is not a new lesson, but it's one that seems to need re-learning by each new wave of market entrants — which brings us to the most important part of this article.
---
## 6. Traders, Come Back to the Spot Market 🏠
Traders, come back to the spot market. Your chances of long-term success are much higher there. This isn't a moralistic statement or an attempt to shame anyone using derivatives — it's simply a reflection of risk mathematics and market structure.
Here's why spot participation tends to produce better long-term outcomes for the vast majority of traders:
### 6.1 No Liquidation Risk ✅
When you own an asset outright, there is no price at which your position is forcibly closed against your will. You can hold through drawdowns of 30%, 50%, even 80% if your conviction and risk tolerance allow for it. Leveraged traders rarely have this luxury — their liquidation price is fixed the moment they open a position, regardless of how the story ultimately unfolds.
### 6.2 Time Becomes Your Ally, Not Your Enemy ⏳
In spot markets, time works in your favor if your thesis is correct. You can simply wait for the market to validate your view. In leveraged positions, time often works against you — funding rates accumulate, margin requirements can tighten, and volatility has more opportunities to trigger a liquidation the longer a position stays open.
### 6.3 Reduced Emotional Decision-Making 🧘
Leverage inherently increases emotional intensity. Watching a highly leveraged position swing violently in either direction triggers stress responses that lead to poor decision-making — panic selling, revenge trading, or doubling down irrationally. Spot positions, by contrast, allow for a calmer, more rational approach to portfolio management.
### 6.4 Alignment With Long-Term Market Health 🌱
Spot buying genuinely contributes to price discovery and market health. Every spot purchase represents real capital that supports the underlying asset's price floor. Leveraged positions, by contrast, are often net-neutral or even destabilizing to the broader market — they don't represent new capital entering the ecosystem, just bets on price direction using borrowed exposure.
### 6.5 Simpler Risk Management 📐
Spot trading only requires you to manage one variable: how much capital you're willing to allocate to an asset. Leveraged trading requires managing margin, liquidation price, funding rates, and position sizing simultaneously — a far more complex task that leaves more room for costly mistakes, especially for less experienced traders.
---
## 7. What This Means for the Market Going Forward 🔮
So where does this leave us? The combination of thin spot volume and elevated leverage usage suggests the current market is more fragile than headline price action might suggest. This doesn't necessarily mean a crash is imminent — but it does mean that:
- 📉 Price moves may not accurately reflect genuine shifts in sentiment or fundamentals
- ⚡ Volatility is likely to remain elevated, driven by leverage-based liquidations rather than organic buying/selling
- 🕵️ Traders should be cautious about reading too much into short-term price action as a signal of underlying strength or weakness
- 🌊 A genuine, sustainable trend — in either direction — will likely require spot volume to meaningfully recover first
For those watching the market closely, spot volume recovery should be treated as one of the most important signals to track. When genuine buying and selling activity returns to healthy levels, it will indicate that real capital — not just leveraged speculation — is driving the market's next move.
---
## 8. Practical Takeaways for Traders 🛠️
Let's bring this back to something actionable. If you're actively trading in this environment, here are some principles worth internalizing:
1. 🧮 **Reassess your leverage usage.** If you're using high leverage as a default trading style rather than a deliberate, occasional tool, this is a good moment to reconsider that approach.
2. 🏗️ **Prioritize building your spot base.** A larger portion of your portfolio in spot-held assets reduces your vulnerability to liquidation cascades and gives you staying power through volatility.
3. 📖 **Study liquidation data alongside price charts.** Understanding when large liquidation events are driving price moves — rather than genuine sentiment shifts — can help you avoid overreacting to noise.
4. 🧘 **Manage position sizing conservatively.** Even when using derivatives, keeping position sizes small relative to your total capital preserves your ability to stay in the game long enough for your thesis to play out.
5. ⏳ **Adopt a longer time horizon where possible.** Spot holding rewards patience. The traders who tend to come out ahead across full market cycles are rarely the ones chasing every short-term swing with maximum leverage.
---
## 9. Closing Thoughts 💭
The current environment — extremely low spot volume paired with widespread leverage usage among inexperienced traders — is not a reason for panic, but it is absolutely a reason for awareness. Markets built primarily on leveraged speculation rather than genuine spot participation tend to be more fragile, more volatile, and ultimately less rewarding for the average participant.
The path forward for traders who want to improve their long-term odds is straightforward, even if it isn't always exciting: prioritize spot ownership, manage leverage with discipline and respect, and pay close attention to genuine market participation signals like spot volume rather than getting swept up in
short-term leveraged price swings.
Traders, come back to the spot market. Your chances of long-term success are much higher there. 🌱📈
---
#BTC #CryptoMarket #SpotTrading #Leverage #BİNANCE
$BTC
1
1
44
·
--
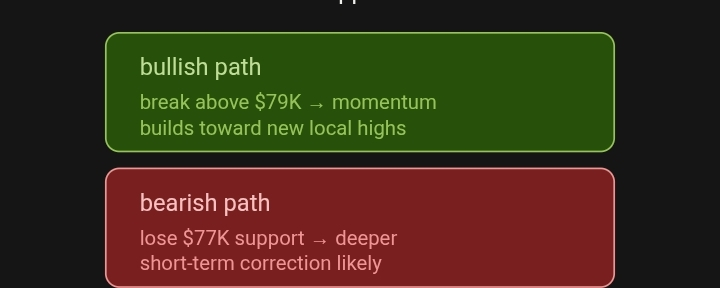
Artikel
Übersetzung ansehen
🚨 Bitcoin (BTC): The Market Is Waiting for a Breakout🚨 Bitcoin (BTC): The Market Is Waiting for a Breakout
$BTC is currently trading in the $77K–$79K region, after recently testing levels closer to $79K. Price action right now reflects a clear tug-of-war between buyers pushing to extend the recovery and sellers defending higher ground. Neither side has taken full control yet, which is why the market feels tense and directionless in the short term.
## 📊 A Battle at Key Levels
The $77K–$79K range has become a critical battleground zone. Buyers are attempting to build on the recent recovery, while sellers continue to cap upside near $79K. This kind of consolidation often happens before a decisive move — the longer price coils in a tight range, the bigger the eventual breakout tends to be.
## 🌍 Macro Is Driving the Narrative
Interestingly, the biggest catalyst right now isn't purely technical — it's macroeconomic. Fresh U.S. inflation data showed:
📌 August CPI rose **0.4% month-over-month**
📌 Year-over-year CPI came in at **3.4%**
📌 Core CPI remained elevated
This has significantly increased uncertainty around the Federal Reserve's next interest-rate decision. Sticky inflation numbers make it harder for the Fed to justify aggressive rate cuts, and that uncertainty is spilling directly into risk assets like Bitcoin.
## 💡 Why This Matters for BTC
Crypto markets have grown increasingly sensitive to Fed policy expectations. When inflation surprises to the upside:
⚠️ Rate-cut expectations get pushed back
⚠️ Risk appetite can cool temporarily
⚠️ Volatility tends to increase across BTC and altcoins
On the flip side, if markets interpret the data as "not hot enough to change the Fed's path," Bitcoin could resume its recovery attempt toward $79K and beyond.
#btc #eth #Binance #tradingknolege #NewsAboutCrypto
$BTC $ETH
🚨 Bitcoin (BTC): The Market Is Waiting for a Breakout
🚨 Bitcoin (BTC): The Market Is Waiting for a Breakout
$BTC is currently trading in the $77K–$79K region, after recently testing levels closer to $79K. Price action right now reflects a clear tug-of-war between buyers pushing to extend the recovery and sellers defending higher ground. Neither side has taken full control yet, which is why the market feels tense and directionless in the short term.
## 📊 A Battle at Key Levels
The $77K–$79K range has become a critical battleground zone. Buyers are attempting to build on the recent recovery, while sellers continue to cap upside near $79K. This kind of consolidation often happens before a decisive move — the longer price coils in a tight range, the bigger the eventual breakout tends to be.
## 🌍 Macro Is Driving the Narrative
Interestingly, the biggest catalyst right now isn't purely technical — it's macroeconomic. Fresh U.S. inflation data showed:
📌 August CPI rose **0.4% month-over-month**
📌 Year-over-year CPI came in at **3.4%**
📌 Core CPI remained elevated
This has significantly increased uncertainty around the Federal Reserve's next interest-rate decision. Sticky inflation numbers make it harder for the Fed to justify aggressive rate cuts, and that uncertainty is spilling directly into risk assets like Bitcoin.
## 💡 Why This Matters for BTC
Crypto markets have grown increasingly sensitive to Fed policy expectations. When inflation surprises to the upside:
⚠️ Rate-cut expectations get pushed back
⚠️ Risk appetite can cool temporarily
⚠️ Volatility tends to increase across BTC and altcoins
On the flip side, if markets interpret the data as "not hot enough to change the Fed's path," Bitcoin could resume its recovery attempt toward $79K and beyond.
#btc #eth #Binance #tradingknolege #NewsAboutCrypto
$BTC $ETH
$BTC is currently trading in the $77K–$79K region, after recently testing levels closer to $79K. Price action right now reflects a clear tug-of-war between buyers pushing to extend the recovery and sellers defending higher ground. Neither side has taken full control yet, which is why the market feels tense and directionless in the short term.
## 📊 A Battle at Key Levels
The $77K–$79K range has become a critical battleground zone. Buyers are attempting to build on the recent recovery, while sellers continue to cap upside near $79K. This kind of consolidation often happens before a decisive move — the longer price coils in a tight range, the bigger the eventual breakout tends to be.
## 🌍 Macro Is Driving the Narrative
Interestingly, the biggest catalyst right now isn't purely technical — it's macroeconomic. Fresh U.S. inflation data showed:
📌 August CPI rose **0.4% month-over-month**
📌 Year-over-year CPI came in at **3.4%**
📌 Core CPI remained elevated
This has significantly increased uncertainty around the Federal Reserve's next interest-rate decision. Sticky inflation numbers make it harder for the Fed to justify aggressive rate cuts, and that uncertainty is spilling directly into risk assets like Bitcoin.
## 💡 Why This Matters for BTC
Crypto markets have grown increasingly sensitive to Fed policy expectations. When inflation surprises to the upside:
⚠️ Rate-cut expectations get pushed back
⚠️ Risk appetite can cool temporarily
⚠️ Volatility tends to increase across BTC and altcoins
On the flip side, if markets interpret the data as "not hot enough to change the Fed's path," Bitcoin could resume its recovery attempt toward $79K and beyond.
#btc #eth #Binance #tradingknolege #NewsAboutCrypto
$BTC $ETH
50
·
--

Artikel
Übersetzung ansehen
🚀 $BTC — BIG LONG SETUP 🚀🚀 **$BTC — BIG LONG SETUP** 🚀
📈 Long **$BTC** — momentum building for a strong upside push!
🎯 Entry: **77,700 – 78,200**
💎 Take Profit Targets:
✅ TP1: 78,800
✅ TP2: 79,300
✅ TP3: 80,200
✅ TP4: 81,500
✅ TP5: 82,200
🛑 Stop Loss: **76,500**
🧠 **Better approach:** For a wider setup, you can keep your liquidation level below **60,000** to give the trade more room to breathe.
⚠️ Manage risk properly — never risk more than you can afford to lose.
👇 Trade here
#BTC #Bitcoin #crypto #LongSetup #eth
$BTC
---
$ETH
🚀 $BTC — BIG LONG SETUP 🚀
🚀 **$BTC — BIG LONG SETUP** 🚀
📈 Long **$BTC ** — momentum building for a strong upside push!
🎯 Entry: **77,700 – 78,200**
💎 Take Profit Targets:
✅ TP1: 78,800
✅ TP2: 79,300
✅ TP3: 80,200
✅ TP4: 81,500
✅ TP5: 82,200
🛑 Stop Loss: **76,500**
🧠 **Better approach:** For a wider setup, you can keep your liquidation level below **60,000** to give the trade more room to breathe.
⚠️ Manage risk properly — never risk more than you can afford to lose.
👇 Trade here
#BTC #Bitcoin #crypto #LongSetup #eth
$BTC
---
$ETH
📈 Long **$BTC ** — momentum building for a strong upside push!
🎯 Entry: **77,700 – 78,200**
💎 Take Profit Targets:
✅ TP1: 78,800
✅ TP2: 79,300
✅ TP3: 80,200
✅ TP4: 81,500
✅ TP5: 82,200
🛑 Stop Loss: **76,500**
🧠 **Better approach:** For a wider setup, you can keep your liquidation level below **60,000** to give the trade more room to breathe.
⚠️ Manage risk properly — never risk more than you can afford to lose.
👇 Trade here
#BTC #Bitcoin #crypto #LongSetup #eth
$BTC
---
$ETH
75
·
--

Artikel
⚡ Bitcoin an einem Fed-Kreuzweg: Warum $82K bis $79,5K die Zone ist, die alles entscheidet...⚡ Bitcoin an einem Fed-Kreuzweg: Warum $82K bis $79,5K die Zone ist, die alles entscheidet
Der Rücksetzer von Bitcoin von 82K ist keine zufällige Korrektur — es geht um die Makrolage vor einem der binärsten Ereignisse im Kalender: der nächsten Zinsentscheidung der Fed. Die Märkte preisen derzeit nahezu ausgeglichene Chancen für eine Anhebung um 25 Basispunkte ein, und genau diese Unsicherheit sorgt dafür, dass BTC tiefer tendiert. 🌊
📉 Was diesen Rücksetzer wirklich antreibt
Wenn eine Zinsentscheidung so nah ist wie ein Münzwurf, warten Trader nicht auf die Schlagzeile — sie reduzieren Risiko im Voraus. Genau das sehen wir jetzt: gehebelte Positionen werden zurückgefahren, Spot-Verkäufer nehmen nahe dem Widerstand Gewinne mit, und die Volatilität komprimiert sich vor der Veröffentlichung. Es ist die Angst vor dem Unbekannten — nicht ein grundlegender Bruch in der Struktur von BTC. 🔍
⚡ Bitcoin an einem Fed-Kreuzweg: Warum $82K bis $79,5K die Zone ist, die alles entscheidet...
⚡ Bitcoin an einem Fed-Kreuzweg: Warum $82K bis $79,5K die Zone ist, die alles entscheidet
Der Rücksetzer von Bitcoin von 82K ist keine zufällige Korrektur — es geht um die Makrolage vor einem der binärsten Ereignisse im Kalender: der nächsten Zinsentscheidung der Fed. Die Märkte preisen derzeit nahezu ausgeglichene Chancen für eine Anhebung um 25 Basispunkte ein, und genau diese Unsicherheit sorgt dafür, dass BTC tiefer tendiert. 🌊
📉 Was diesen Rücksetzer wirklich antreibt
Wenn eine Zinsentscheidung so nah ist wie ein Münzwurf, warten Trader nicht auf die Schlagzeile — sie reduzieren Risiko im Voraus. Genau das sehen wir jetzt: gehebelte Positionen werden zurückgefahren, Spot-Verkäufer nehmen nahe dem Widerstand Gewinne mit, und die Volatilität komprimiert sich vor der Veröffentlichung. Es ist die Angst vor dem Unbekannten — nicht ein grundlegender Bruch in der Struktur von BTC. 🔍
Der Rücksetzer von Bitcoin von 82K ist keine zufällige Korrektur — es geht um die Makrolage vor einem der binärsten Ereignisse im Kalender: der nächsten Zinsentscheidung der Fed. Die Märkte preisen derzeit nahezu ausgeglichene Chancen für eine Anhebung um 25 Basispunkte ein, und genau diese Unsicherheit sorgt dafür, dass BTC tiefer tendiert. 🌊
📉 Was diesen Rücksetzer wirklich antreibt
Wenn eine Zinsentscheidung so nah ist wie ein Münzwurf, warten Trader nicht auf die Schlagzeile — sie reduzieren Risiko im Voraus. Genau das sehen wir jetzt: gehebelte Positionen werden zurückgefahren, Spot-Verkäufer nehmen nahe dem Widerstand Gewinne mit, und die Volatilität komprimiert sich vor der Veröffentlichung. Es ist die Angst vor dem Unbekannten — nicht ein grundlegender Bruch in der Struktur von BTC. 🔍
1
46
·
--
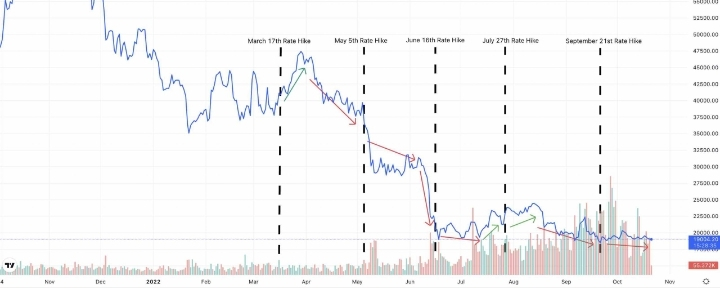
Artikel
🚨 $BTC Fällt von $82K wegen Fed-Sorgen — Deshalb gehe ich auf die Erzählung von der Zinserhöhung nicht ein🚨 $BTC Fällt von $82K wegen Fed-Sorgen — Deshalb gehe ich auf die Erzählung von der Zinserhöhung nicht ein
Bitcoin ist diese Woche von seinem $82K-Hoch abgerutscht — und der Grund ist kein Hack, keine regulatorische Schlagzeile und auch kein Börsen-Desaster, sondern die US-Notenbank (Federal Reserve). 📉
Der Markt preist aktuell grob eine 50/50-Chance ein, dass es bei der anstehenden FOMC-Entscheidung zu einer Zinserhöhung um 25 Basispunkte kommt. Diese Unsicherheit allein hat gereicht, um BTC tiefer zu drücken, da hoch gehebelte Longs ihr Risiko vor einem binären Makro-Ereignis reduzieren. Wenn das Ergebnis eines einzigen Treffens einen Vermögenswert so heftig bewegen kann, zählt bei der Positionierung mehr strategische Klugheit als Überzeugung.
🚨 $BTC Fällt von $82K wegen Fed-Sorgen — Deshalb gehe ich auf die Erzählung von der Zinserhöhung nicht ein
🚨 $BTC Fällt von $82K wegen Fed-Sorgen — Deshalb gehe ich auf die Erzählung von der Zinserhöhung nicht ein
Bitcoin ist diese Woche von seinem $82K-Hoch abgerutscht — und der Grund ist kein Hack, keine regulatorische Schlagzeile und auch kein Börsen-Desaster, sondern die US-Notenbank (Federal Reserve). 📉
Der Markt preist aktuell grob eine 50/50-Chance ein, dass es bei der anstehenden FOMC-Entscheidung zu einer Zinserhöhung um 25 Basispunkte kommt. Diese Unsicherheit allein hat gereicht, um BTC tiefer zu drücken, da hoch gehebelte Longs ihr Risiko vor einem binären Makro-Ereignis reduzieren. Wenn das Ergebnis eines einzigen Treffens einen Vermögenswert so heftig bewegen kann, zählt bei der Positionierung mehr strategische Klugheit als Überzeugung.
Bitcoin ist diese Woche von seinem $82K-Hoch abgerutscht — und der Grund ist kein Hack, keine regulatorische Schlagzeile und auch kein Börsen-Desaster, sondern die US-Notenbank (Federal Reserve). 📉
Der Markt preist aktuell grob eine 50/50-Chance ein, dass es bei der anstehenden FOMC-Entscheidung zu einer Zinserhöhung um 25 Basispunkte kommt. Diese Unsicherheit allein hat gereicht, um BTC tiefer zu drücken, da hoch gehebelte Longs ihr Risiko vor einem binären Makro-Ereignis reduzieren. Wenn das Ergebnis eines einzigen Treffens einen Vermögenswert so heftig bewegen kann, zählt bei der Positionierung mehr strategische Klugheit als Überzeugung.
1
51
·
--
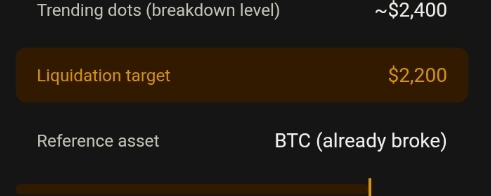
Artikel
🚨 $ETH sendet ein Warnsignal — darauf sollten Trader jetzt achten 📉 🚨 $ETH sendet ein Warnsignal — darauf sollten Trader jetzt achten 📉
Ethereum testet erneut die Geduld der Bullen. **$ETH** bewegt sich auf einen Kerzen-Schluss unter den trendenden Punkten zu — eine Konstellation, die unheimlich ähnlich ist, was **$BTC** gestern noch ausgegeben hat, bevor es dann seinen nächsten Rückschlag machte. Wenn zwei große Assets anfangen, ihre Struktur so zu spiegeln, ist das selten Zufall, und Trader schauen ganz genau hin. 👀
📊 Das aktuelle Bild
Beim Blick auf das **ETHUSDT Perpetual**-Chart:
🚨 $ETH sendet ein Warnsignal — darauf sollten Trader jetzt achten 📉
🚨 $ETH sendet ein Warnsignal — darauf sollten Trader jetzt achten 📉
Ethereum testet erneut die Geduld der Bullen. **$ETH** bewegt sich auf einen Kerzen-Schluss unter den trendenden Punkten zu — eine Konstellation, die unheimlich ähnlich ist, was **$BTC** gestern noch ausgegeben hat, bevor es dann seinen nächsten Rückschlag machte. Wenn zwei große Assets anfangen, ihre Struktur so zu spiegeln, ist das selten Zufall, und Trader schauen ganz genau hin. 👀
📊 Das aktuelle Bild
Beim Blick auf das **ETHUSDT Perpetual**-Chart:
Ethereum testet erneut die Geduld der Bullen. **$ETH** bewegt sich auf einen Kerzen-Schluss unter den trendenden Punkten zu — eine Konstellation, die unheimlich ähnlich ist, was **$BTC** gestern noch ausgegeben hat, bevor es dann seinen nächsten Rückschlag machte. Wenn zwei große Assets anfangen, ihre Struktur so zu spiegeln, ist das selten Zufall, und Trader schauen ganz genau hin. 👀
📊 Das aktuelle Bild
Beim Blick auf das **ETHUSDT Perpetual**-Chart:
1
44
·
--

Artikel
🟠 $BTC — Verkaufsdruck im Spot-Markt lässt immer noch nicht nach 📉🧭🟠 $BTC — Verkaufsdruck im Spot-Markt lässt immer noch nicht nach 📉🧭
Bitcoin-($BTC)-Trader konzentrieren sich erneut auf Marktdaten aus dem Spot-Markt und nicht nur auf den Preis. Ein aktueller Beitrag hebt hervor, dass eine negative Spot-Delta — insbesondere bei Coinbase und Binance — jeden anhaltenden Aufwärtsschub im Zaum hält. Solange sich das nicht dreht, könnte der Markt in einer defensiven Haltung feststecken. Lassen Sie uns aufschlüsseln, was Spot Delta eigentlich bedeutet, warum es wichtig ist und was die Geschichte uns über Märkte erzählt, die sich so verhalten. 🔍📊
🟠 $BTC — Verkaufsdruck im Spot-Markt lässt immer noch nicht nach 📉🧭
🟠 $BTC — Verkaufsdruck im Spot-Markt lässt immer noch nicht nach 📉🧭
Bitcoin-($BTC)-Trader konzentrieren sich erneut auf Marktdaten aus dem Spot-Markt und nicht nur auf den Preis. Ein aktueller Beitrag hebt hervor, dass eine negative Spot-Delta — insbesondere bei Coinbase und Binance — jeden anhaltenden Aufwärtsschub im Zaum hält. Solange sich das nicht dreht, könnte der Markt in einer defensiven Haltung feststecken. Lassen Sie uns aufschlüsseln, was Spot Delta eigentlich bedeutet, warum es wichtig ist und was die Geschichte uns über Märkte erzählt, die sich so verhalten. 🔍📊
Bitcoin-($BTC)-Trader konzentrieren sich erneut auf Marktdaten aus dem Spot-Markt und nicht nur auf den Preis. Ein aktueller Beitrag hebt hervor, dass eine negative Spot-Delta — insbesondere bei Coinbase und Binance — jeden anhaltenden Aufwärtsschub im Zaum hält. Solange sich das nicht dreht, könnte der Markt in einer defensiven Haltung feststecken. Lassen Sie uns aufschlüsseln, was Spot Delta eigentlich bedeutet, warum es wichtig ist und was die Geschichte uns über Märkte erzählt, die sich so verhalten. 🔍📊
1
30
·
--
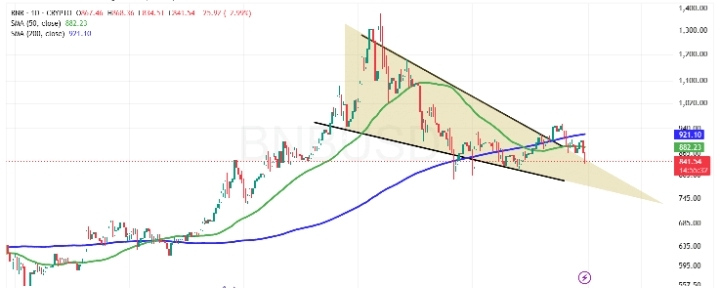
Artikel
🔴 $BNB bärischer Bruch — Könnte $722 als Nächstes kommen? 📉⚡ 🔴 $BNB bärischer Bruch — Könnte $722 als Nächstes kommen? 📉⚡
Binance Coin ($BNB) rückt nach einem viralen Trading-Post erneut in den Fokus, der einen möglichen bärischen Bruch gemeldet hat: Dem 15-Minuten-Chart zufolge reißt er Berichten zufolge durch wichtige Supports und öffnet damit die Tür für einen möglichen Rückgang in Richtung der $722-Zone. Lass uns das Setup, die dahinterliegende Logik und die Frage, wie man solche Trading-Ideen verantwortungsvoll betrachtet, genauer aufschlüsseln. 🧠📊
🚨 Das Setup, über das gerade gesprochen wird
Laut dem Beitrag, der in den sozialen Medien kursiert, sieht die Trading-These so aus:
🔴 $BNB bärischer Bruch — Könnte $722 als Nächstes kommen? 📉⚡
🔴 $BNB bärischer Bruch — Könnte $722 als Nächstes kommen? 📉⚡
Binance Coin ($BNB) rückt nach einem viralen Trading-Post erneut in den Fokus, der einen möglichen bärischen Bruch gemeldet hat: Dem 15-Minuten-Chart zufolge reißt er Berichten zufolge durch wichtige Supports und öffnet damit die Tür für einen möglichen Rückgang in Richtung der $722-Zone. Lass uns das Setup, die dahinterliegende Logik und die Frage, wie man solche Trading-Ideen verantwortungsvoll betrachtet, genauer aufschlüsseln. 🧠📊
🚨 Das Setup, über das gerade gesprochen wird
Laut dem Beitrag, der in den sozialen Medien kursiert, sieht die Trading-These so aus:
Binance Coin ($BNB) rückt nach einem viralen Trading-Post erneut in den Fokus, der einen möglichen bärischen Bruch gemeldet hat: Dem 15-Minuten-Chart zufolge reißt er Berichten zufolge durch wichtige Supports und öffnet damit die Tür für einen möglichen Rückgang in Richtung der $722-Zone. Lass uns das Setup, die dahinterliegende Logik und die Frage, wie man solche Trading-Ideen verantwortungsvoll betrachtet, genauer aufschlüsseln. 🧠📊
🚨 Das Setup, über das gerade gesprochen wird
Laut dem Beitrag, der in den sozialen Medien kursiert, sieht die Trading-These so aus:
1
60
Anmelden und weiter Inhalte entdecken
Krypto-Nutzer weltweit auf Binance Square kennenlernen
⚡️ Bleib in Sachen Krypto stets am Puls.
💬 Die weltgrößte Kryptobörse vertraut darauf.
👍 Erhalte verlässliche Einblicke von verifizierten Creators.
E-Mail-Adresse/Telefonnummer
Trendthemen
BitcoinReboundsTo$79K
11,756 Aufrufe
114 Kommentare
🚨 $BTC steigt weiter.
Bitcoin handelt bei etwa 78.804 $ und liegt damit ungefähr 1,9 % im Plus, nachdem die Marke von 78K zurückerobert wurde. Die nächste zu beobachtende Zone ist das Tageshoch im Intraday-Bereich nahe 78.905 $.
Ein klarer Ausbruch über diese Marke könnte den Weg in Richtung 79K–80K ebnen. Wenn BTC abgewiesen wird, liegt der Support bei etwa 78.300 $ und danach bei 77.975 $.
Die Bullen haben Momentum, aber BTC muss über 78K bleiben.
#Bitcoin #BTC #CryptoTrading #CryptoMarket #CryptoAnalysis
PulseON
·11 Likes
·11.9k Aufrufe
RussianCentralBankFlagsCryptoAsFinancialRisk
34 Aufrufe
26 Kommentare
GrayscalePutsXRPAt26.11%InAdvisorPortfolio
2,642 Aufrufe
123 Kommentare