
Mrs Nauman
12 Beiträge

Mrs Nauman
Melden
Nutzer blockieren
0 Following
13 Follower
29 Like gegeben
Beiträge
·
--

Artikel
Übersetzung ansehen
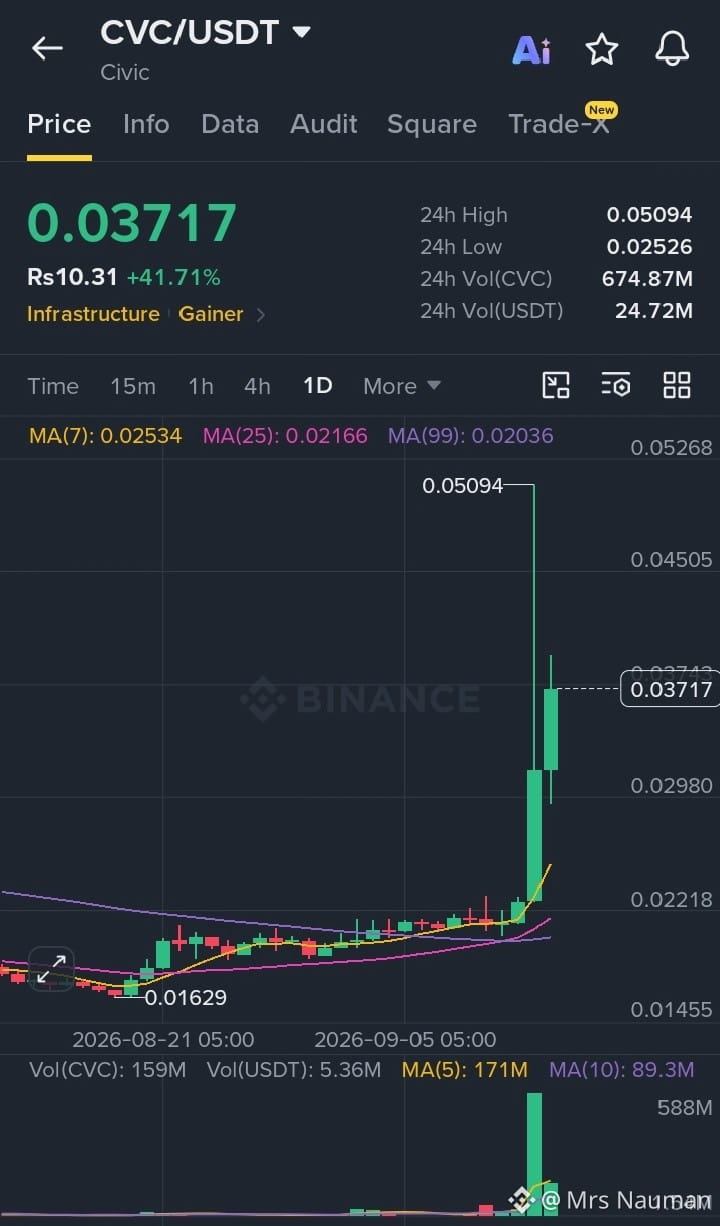
🚀 Why Is CVC (Civic) Price Pumping? — Detailed Analysis$CVC /USDT is showing a major breakout, with the price around $0.03717 (+41.71%) in the screenshot. The biggest signal is the explosion in trading volume: 24H volume is around 674.87M CVC, compared with much lower activity during the previous consolidation. This kind of volume expansion usually indicates aggressive speculative buying, momentum traders entering, and potentially short positions being forced to close. Recent market data also shows CVC had been trading around the $0.020–$0.022 area before this move, meaning the breakout came after a prolonged accumulation/consolidation phase. �
Investing.com +1
🔥 Main Reasons Behind the Pump
1️⃣ Strong technical breakout
$CVC spent weeks moving sideways around the $0.018–$0.022 region. The chart now shows a decisive move above that range. More importantly, the moving averages have turned strongly bullish:
MA(7): $0.02534
MA(25): $0.02166
MA(99): $0.02036
The short-term MA is above the medium- and long-term averages, showing strong momentum. The price is also trading substantially above all three averages.
2️⃣ Massive volume confirmation
The volume spike is arguably the most important part of this move. Price increases accompanied by a huge increase in volume are generally stronger than low-volume pumps because they show that market participation has increased substantially. Earlier September data showed CVC volume was much smaller, while the latest move has produced an exceptional expansion in activity. �
Investing.com
3️⃣ Civic's Web3 identity narrative
Civic has been shifting its focus toward Web3 authentication and embedded wallet onboarding, including its Civic Auth SDK for Ethereum, EVM networks and Solana. That gives CVC a fresh narrative around digital identity, wallet onboarding and Web3 infrastructure. Recent analysis also highlights this strategic pivot as an important part of CVC's current story. �
CoinMarketCap +1
4️⃣ Momentum + speculative rotation
There isn't strong evidence of one single new announcement responsible for today's huge move. Recent CVC analysis specifically noted that high-volume speculative trading can drive sharp moves when no clear coin-specific catalyst is present. � So this pump appears to be a combination of technical breakout + huge volume + renewed attention to the Civic/Web3 narrative + speculative trading.
CoinMarketCap
📊 Key Levels to Watch
Based on the chart you shared:
Resistance
🔴 $0.0374 — immediate resistance
🔴 $0.0450 — next major level
🔴 $0.05094 — current 24H high / major breakout target
Support
🟢 $0.0298 — first important support
🟢 $0.0253 — MA(7) / stronger short-term support
🟢 $0.0222 — major previous breakout area
The long upper wick reaching $0.05094 is important: buyers pushed $CVC extremely high but sellers rejected that area. Therefore, chasing after a 40%+ daily move carries considerably more risk.
⚠️ What Happens Next?
If CVC can hold $0.0298–$0.0300 after the pump and volume remains elevated, the move could attempt another test of $0.0450, followed by $0.0509. A clean breakout above $0.0509 would be a significant continuation signal.
However, if CVC loses $0.0298, a deeper retracement toward $0.0253 becomes possible. Losing that level could bring the price back toward the $0.0220 area, where the previous consolidation occurred.
Bottom line: CVC's pump is primarily supported by a high-volume technical breakout and renewed Civic/Web3 identity narrative, rather than a clearly confirmed single news catalyst. The volume is impressive, but the huge wick and rapid percentage gain mean volatility and profit-taking risk are also extremely high. �
#BinanceSquare #CVCUSDT #bullish #trading #crypto
🚀 Why Is CVC (Civic) Price Pumping? — Detailed Analysis
$CVC /USDT is showing a major breakout, with the price around $0.03717 (+41.71%) in the screenshot. The biggest signal is the explosion in trading volume: 24H volume is around 674.87M CVC, compared with much lower activity during the previous consolidation. This kind of volume expansion usually indicates aggressive speculative buying, momentum traders entering, and potentially short positions being forced to close. Recent market data also shows CVC had been trading around the $0.020–$0.022 area before this move, meaning the breakout came after a prolonged accumulation/consolidation phase. �
Investing.com +1
🔥 Main Reasons Behind the Pump
1️⃣ Strong technical breakout
$CVC spent weeks moving sideways around the $0.018–$0.022 region. The chart now shows a decisive move above that range. More importantly, the moving averages have turned strongly bullish:
MA(7): $0.02534
MA(25): $0.02166
MA(99): $0.02036
The short-term MA is above the medium- and long-term averages, showing strong momentum. The price is also trading substantially above all three averages.
2️⃣ Massive volume confirmation
The volume spike is arguably the most important part of this move. Price increases accompanied by a huge increase in volume are generally stronger than low-volume pumps because they show that market participation has increased substantially. Earlier September data showed CVC volume was much smaller, while the latest move has produced an exceptional expansion in activity. �
Investing.com
3️⃣ Civic's Web3 identity narrative
Civic has been shifting its focus toward Web3 authentication and embedded wallet onboarding, including its Civic Auth SDK for Ethereum, EVM networks and Solana. That gives CVC a fresh narrative around digital identity, wallet onboarding and Web3 infrastructure. Recent analysis also highlights this strategic pivot as an important part of CVC's current story. �
CoinMarketCap +1
4️⃣ Momentum + speculative rotation
There isn't strong evidence of one single new announcement responsible for today's huge move. Recent CVC analysis specifically noted that high-volume speculative trading can drive sharp moves when no clear coin-specific catalyst is present. � So this pump appears to be a combination of technical breakout + huge volume + renewed attention to the Civic/Web3 narrative + speculative trading.
CoinMarketCap
📊 Key Levels to Watch
Based on the chart you shared:
Resistance
🔴 $0.0374 — immediate resistance
🔴 $0.0450 — next major level
🔴 $0.05094 — current 24H high / major breakout target
Support
🟢 $0.0298 — first important support
🟢 $0.0253 — MA(7) / stronger short-term support
🟢 $0.0222 — major previous breakout area
The long upper wick reaching $0.05094 is important: buyers pushed $CVC extremely high but sellers rejected that area. Therefore, chasing after a 40%+ daily move carries considerably more risk.
⚠️ What Happens Next?
If CVC can hold $0.0298–$0.0300 after the pump and volume remains elevated, the move could attempt another test of $0.0450, followed by $0.0509. A clean breakout above $0.0509 would be a significant continuation signal.
However, if CVC loses $0.0298, a deeper retracement toward $0.0253 becomes possible. Losing that level could bring the price back toward the $0.0220 area, where the previous consolidation occurred.
Bottom line: CVC's pump is primarily supported by a high-volume technical breakout and renewed Civic/Web3 identity narrative, rather than a clearly confirmed single news catalyst. The volume is impressive, but the huge wick and rapid percentage gain mean volatility and profit-taking risk are also extremely high. �
#BinanceSquare #CVCUSDT #bullish #trading #crypto
Investing.com +1
🔥 Main Reasons Behind the Pump
1️⃣ Strong technical breakout
$CVC spent weeks moving sideways around the $0.018–$0.022 region. The chart now shows a decisive move above that range. More importantly, the moving averages have turned strongly bullish:
MA(7): $0.02534
MA(25): $0.02166
MA(99): $0.02036
The short-term MA is above the medium- and long-term averages, showing strong momentum. The price is also trading substantially above all three averages.
2️⃣ Massive volume confirmation
The volume spike is arguably the most important part of this move. Price increases accompanied by a huge increase in volume are generally stronger than low-volume pumps because they show that market participation has increased substantially. Earlier September data showed CVC volume was much smaller, while the latest move has produced an exceptional expansion in activity. �
Investing.com
3️⃣ Civic's Web3 identity narrative
Civic has been shifting its focus toward Web3 authentication and embedded wallet onboarding, including its Civic Auth SDK for Ethereum, EVM networks and Solana. That gives CVC a fresh narrative around digital identity, wallet onboarding and Web3 infrastructure. Recent analysis also highlights this strategic pivot as an important part of CVC's current story. �
CoinMarketCap +1
4️⃣ Momentum + speculative rotation
There isn't strong evidence of one single new announcement responsible for today's huge move. Recent CVC analysis specifically noted that high-volume speculative trading can drive sharp moves when no clear coin-specific catalyst is present. � So this pump appears to be a combination of technical breakout + huge volume + renewed attention to the Civic/Web3 narrative + speculative trading.
CoinMarketCap
📊 Key Levels to Watch
Based on the chart you shared:
Resistance
🔴 $0.0374 — immediate resistance
🔴 $0.0450 — next major level
🔴 $0.05094 — current 24H high / major breakout target
Support
🟢 $0.0298 — first important support
🟢 $0.0253 — MA(7) / stronger short-term support
🟢 $0.0222 — major previous breakout area
The long upper wick reaching $0.05094 is important: buyers pushed $CVC extremely high but sellers rejected that area. Therefore, chasing after a 40%+ daily move carries considerably more risk.
⚠️ What Happens Next?
If CVC can hold $0.0298–$0.0300 after the pump and volume remains elevated, the move could attempt another test of $0.0450, followed by $0.0509. A clean breakout above $0.0509 would be a significant continuation signal.
However, if CVC loses $0.0298, a deeper retracement toward $0.0253 becomes possible. Losing that level could bring the price back toward the $0.0220 area, where the previous consolidation occurred.
Bottom line: CVC's pump is primarily supported by a high-volume technical breakout and renewed Civic/Web3 identity narrative, rather than a clearly confirmed single news catalyst. The volume is impressive, but the huge wick and rapid percentage gain mean volatility and profit-taking risk are also extremely high. �
#BinanceSquare #CVCUSDT #bullish #trading #crypto
135
·
--
Übersetzung ansehen
🚀 $CVC (Civic) is making a powerful move, with price up more than 40% as buying pressure and trading activity surge. The breakout comes after weeks of consolidation around the $0.018–$0.022 zone, and the massive volume expansion suggests strong market participation. $CVC has also pushed well above its MA(7), MA(25), and MA(99), confirming strong short-term bullish momentum. The renewed attention around Civic’s Web3 identity and authentication infrastructure may also be supporting the narrative, while momentum traders and speculative buyers amplify the move.
⚠️ Key levels to watch: $CVC ’s immediate support is around $0.0298, followed by $0.0253 and the major breakout zone near $0.0222. On the upside, $0.0450 and the recent $0.05094 high are the key resistance areas. If CVC holds above $0.0298 with strong volume, another attempt toward $0.045–$0.051 could be possible. However, after such a sharp pump, profit-taking and a healthy pullback are also possible, so traders should avoid blindly chasing the green candle and watch volume and support levels carefully. 📊🔥 #CVC #crypto #BullRunAhead #BinanceSquare #trading
🚀 $CVC (Civic) is making a powerful move, with price up more than 40% as buying pressure and trading activity surge. The breakout comes after weeks of consolidation around the $0.018–$0.022 zone, and the massive volume expansion suggests strong market participation. $CVC has also pushed well above its MA(7), MA(25), and MA(99), confirming strong short-term bullish momentum. The renewed attention around Civic’s Web3 identity and authentication infrastructure may also be supporting the narrative, while momentum traders and speculative buyers amplify the move.
⚠️ Key levels to watch: $CVC ’s immediate support is around $0.0298, followed by $0.0253 and the major breakout zone near $0.0222. On the upside, $0.0450 and the recent $0.05094 high are the key resistance areas. If CVC holds above $0.0298 with strong volume, another attempt toward $0.045–$0.051 could be possible. However, after such a sharp pump, profit-taking and a healthy pullback are also possible, so traders should avoid blindly chasing the green candle and watch volume and support levels carefully. 📊🔥 #CVC #crypto #BullRunAhead #BinanceSquare #trading
⚠️ Key levels to watch: $CVC ’s immediate support is around $0.0298, followed by $0.0253 and the major breakout zone near $0.0222. On the upside, $0.0450 and the recent $0.05094 high are the key resistance areas. If CVC holds above $0.0298 with strong volume, another attempt toward $0.045–$0.051 could be possible. However, after such a sharp pump, profit-taking and a healthy pullback are also possible, so traders should avoid blindly chasing the green candle and watch volume and support levels carefully. 📊🔥 #CVC #crypto #BullRunAhead #BinanceSquare #trading
96
·
--
Übersetzung ansehen
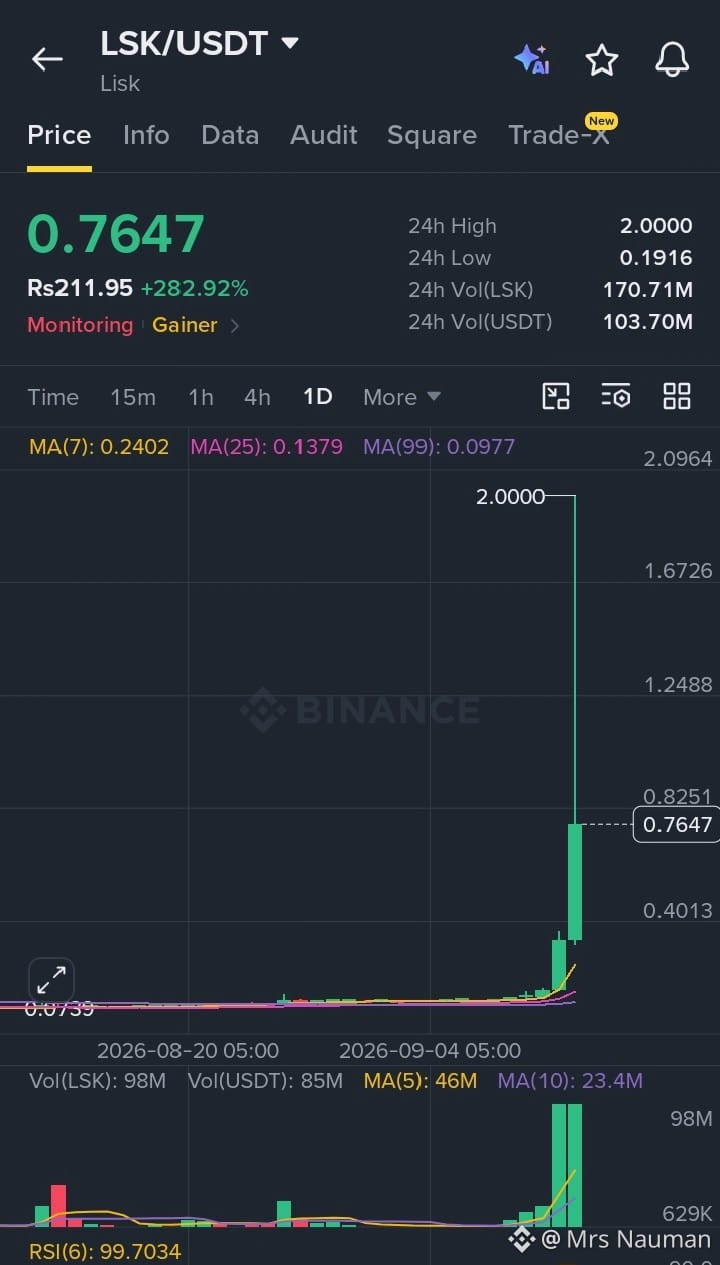
$LSK is witnessing a massive price surge, with the token climbing sharply alongside a dramatic increase in trading volume. The rally appears to be driven by renewed market attention around Lisk’s strategic pivot, proposed 100M LSK token burn, and changing tokenomics, which have created a strong bullish narrative. The chart shows a clear breakout from a prolonged low-price range, while the huge volume spike indicates aggressive participation from traders and momentum buyers. $LSK moving far above its MA(7), MA(25), and MA(99) further confirms the strength of the current trend.
However, the move has become extremely overheated, with the RSI(6) near 100 and the price experiencing a near-vertical rise. The $2.00 area is now an important psychological resistance, while $0.76–$0.80 becomes a key zone to watch for support after the breakout. If $LSK can consolidate above this area, bullish momentum may remain strong; a sharp rejection could instead trigger significant profit-taking and a rapid pullback. Traders should therefore watch volume, support levels, and confirmation carefully rather than chasing a parabolic move. 🚀📊⚠️
#BinanceSquare #BullRunAhead #crypto #LSK #trading
$LSK is witnessing a massive price surge, with the token climbing sharply alongside a dramatic increase in trading volume. The rally appears to be driven by renewed market attention around Lisk’s strategic pivot, proposed 100M LSK token burn, and changing tokenomics, which have created a strong bullish narrative. The chart shows a clear breakout from a prolonged low-price range, while the huge volume spike indicates aggressive participation from traders and momentum buyers. $LSK moving far above its MA(7), MA(25), and MA(99) further confirms the strength of the current trend.
However, the move has become extremely overheated, with the RSI(6) near 100 and the price experiencing a near-vertical rise. The $2.00 area is now an important psychological resistance, while $0.76–$0.80 becomes a key zone to watch for support after the breakout. If $LSK can consolidate above this area, bullish momentum may remain strong; a sharp rejection could instead trigger significant profit-taking and a rapid pullback. Traders should therefore watch volume, support levels, and confirmation carefully rather than chasing a parabolic move. 🚀📊⚠️
#BinanceSquare #BullRunAhead #crypto #LSK #trading
However, the move has become extremely overheated, with the RSI(6) near 100 and the price experiencing a near-vertical rise. The $2.00 area is now an important psychological resistance, while $0.76–$0.80 becomes a key zone to watch for support after the breakout. If $LSK can consolidate above this area, bullish momentum may remain strong; a sharp rejection could instead trigger significant profit-taking and a rapid pullback. Traders should therefore watch volume, support levels, and confirmation carefully rather than chasing a parabolic move. 🚀📊⚠️
#BinanceSquare #BullRunAhead #crypto #LSK #trading
204
·
--

Artikel
🚀 Warum pumpt der LSK-Kurs? — Detaillierte AnalyseBasierend auf deinem Chart zeigt $LSK /USDT einen extremen Ausbruch: Der Kurs liegt bei etwa 0,7647 $ (+282,92%), das 24H-Hoch liegt nahe 2,00 $ und das Handelsvolumen ist sehr hoch. Die Bewegung ist nicht nur ein normaler technischer Rückprall — mehrere fundamentale Katalysatoren + Supply-Erwartungen + Momentum-Trading kommen zusammen.
🔥 1. 100M LSK Token Burn Proposal
Eine der größten bullischen Narrativen ist Liskes Vorschlag, 100 Millionen $LSK aus dem DAO-Treasury zu verbrennen. Das würde das geplante Gesamtangebot von 400M auf 300M LSK reduzieren und effektiv 25% des Angebots entfernen. Der Vorschlag zielt außerdem darauf ab, zukünftiges DAO-bedingtes LSK-Verkaufen zu stoppen, was den Angebotsdruck reduzieren könnte. �
🚀 Warum pumpt der LSK-Kurs? — Detaillierte Analyse
Basierend auf deinem Chart zeigt $LSK /USDT einen extremen Ausbruch: Der Kurs liegt bei etwa 0,7647 $ (+282,92%), das 24H-Hoch liegt nahe 2,00 $ und das Handelsvolumen ist sehr hoch. Die Bewegung ist nicht nur ein normaler technischer Rückprall — mehrere fundamentale Katalysatoren + Supply-Erwartungen + Momentum-Trading kommen zusammen.
🔥 1. 100M LSK Token Burn Proposal
Eine der größten bullischen Narrativen ist Liskes Vorschlag, 100 Millionen $LSK aus dem DAO-Treasury zu verbrennen. Das würde das geplante Gesamtangebot von 400M auf 300M LSK reduzieren und effektiv 25% des Angebots entfernen. Der Vorschlag zielt außerdem darauf ab, zukünftiges DAO-bedingtes LSK-Verkaufen zu stoppen, was den Angebotsdruck reduzieren könnte. �
🔥 1. 100M LSK Token Burn Proposal
Eine der größten bullischen Narrativen ist Liskes Vorschlag, 100 Millionen $LSK aus dem DAO-Treasury zu verbrennen. Das würde das geplante Gesamtangebot von 400M auf 300M LSK reduzieren und effektiv 25% des Angebots entfernen. Der Vorschlag zielt außerdem darauf ab, zukünftiges DAO-bedingtes LSK-Verkaufen zu stoppen, was den Angebotsdruck reduzieren könnte. �
157
·
--
Übersetzung ansehen
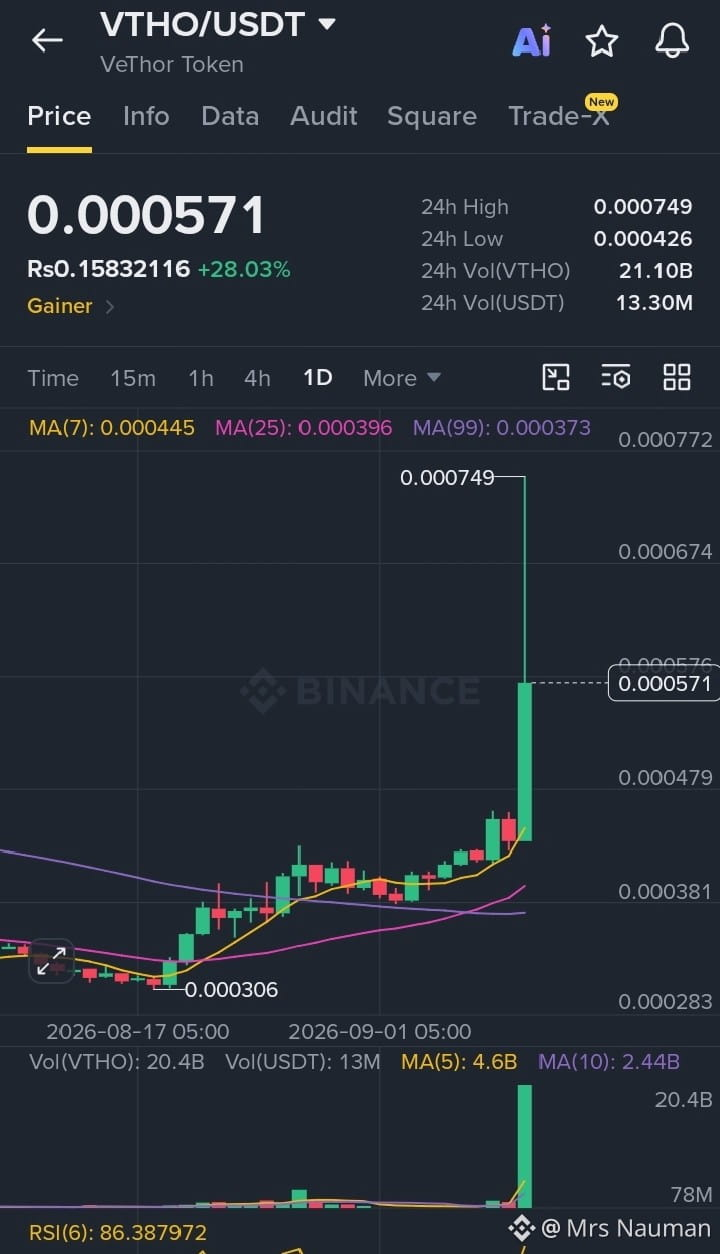
$VTHO is showing a powerful breakout, with price around $0.000571 and strong buying volume behind the move. The daily chart shows price trading well above the 7, 25 and 99-day moving averages, confirming a bullish momentum shift. The biggest signal is the huge volume expansion, suggesting that the move is being supported by increased market participation rather than a low-volume spike. VeThor’s role as the gas token of the VeChainThor network also keeps it directly connected to ecosystem activity, while renewed attention around VeChain’s development and tokenomics can attract additional speculative demand.
⚠️ But traders should watch the next move carefully. $VTHO reached approximately $0.000749 intraday before pulling back toward $0.000571, showing strong profit-taking at higher levels. The RSI(6) near 86 indicates an extremely overbought short-term condition, so consolidation or a pullback would not be surprising. The $0.00048–$0.00050 zone is an important near-term area to watch, while $0.00042–$0.00045 could become a stronger support zone. If buyers reclaim and hold above $0.00065–$0.00075, bullish momentum could continue; otherwise, cooling off before another attempt higher may be healthier. $VTHO is clearly in a high-momentum phase, but chasing a vertical candle carries significant risk. 📈🔥
#VTHO #VeThor #vechain #crypto #BİNANCESQUARE
$VTHO is showing a powerful breakout, with price around $0.000571 and strong buying volume behind the move. The daily chart shows price trading well above the 7, 25 and 99-day moving averages, confirming a bullish momentum shift. The biggest signal is the huge volume expansion, suggesting that the move is being supported by increased market participation rather than a low-volume spike. VeThor’s role as the gas token of the VeChainThor network also keeps it directly connected to ecosystem activity, while renewed attention around VeChain’s development and tokenomics can attract additional speculative demand.
⚠️ But traders should watch the next move carefully. $VTHO reached approximately $0.000749 intraday before pulling back toward $0.000571, showing strong profit-taking at higher levels. The RSI(6) near 86 indicates an extremely overbought short-term condition, so consolidation or a pullback would not be surprising. The $0.00048–$0.00050 zone is an important near-term area to watch, while $0.00042–$0.00045 could become a stronger support zone. If buyers reclaim and hold above $0.00065–$0.00075, bullish momentum could continue; otherwise, cooling off before another attempt higher may be healthier. $VTHO is clearly in a high-momentum phase, but chasing a vertical candle carries significant risk. 📈🔥
#VTHO #VeThor #vechain #crypto #BİNANCESQUARE
⚠️ But traders should watch the next move carefully. $VTHO reached approximately $0.000749 intraday before pulling back toward $0.000571, showing strong profit-taking at higher levels. The RSI(6) near 86 indicates an extremely overbought short-term condition, so consolidation or a pullback would not be surprising. The $0.00048–$0.00050 zone is an important near-term area to watch, while $0.00042–$0.00045 could become a stronger support zone. If buyers reclaim and hold above $0.00065–$0.00075, bullish momentum could continue; otherwise, cooling off before another attempt higher may be healthier. $VTHO is clearly in a high-momentum phase, but chasing a vertical candle carries significant risk. 📈🔥
#VTHO #VeThor #vechain #crypto #BİNANCESQUARE
1
140
·
--

Artikel
🚀 Warum der VTHO-Preis gerade pumpt$VTHO zeigt eine starke Ausbruchsbewgung, wobei der Chart in Ihrem Screenshot einen Preis um $0.000571 zeigt, der ungefähr 28% gestiegen ist, während das Volumen auf etwa 21B $VTHO explodiert ist. Der größte unmittelbare Treiber scheint spekulatives Interesse rund um bevorstehende VeChain-Ökosystem-Katalysatoren zu sein, insbesondere das erwartete Interstellar-Upgrade und die breitere Aufmerksamkeit für VeChains Roadmap. Jüngste Marktanalysen deuten außerdem auf einen großen Anstieg des Handelsvolumens als wichtigen Impuls-Verstärker hin. �
CoinMarketCap
Grundsätzlich wird $VTHO zunehmend interessanter, weil VeChain sein Tokenomics-Design überarbeitet hat. VTHO ist der Gas-Token von VeChainThor, und im neuen Modell ist die VTHO-Erzeugung an gestaktes VET gekoppelt, statt einfach durch das Halten von VET generiert zu werden. Gleichzeitig werden 100% des VTHO, der als Basis-Transaktionsgebühren genutzt wird, verbrannt, was bei steigender Netzwerkaktivität eine stärkere Knappheitsmechanik schafft. �
🚀 Warum der VTHO-Preis gerade pumpt
$VTHO zeigt eine starke Ausbruchsbewgung, wobei der Chart in Ihrem Screenshot einen Preis um $0.000571 zeigt, der ungefähr 28% gestiegen ist, während das Volumen auf etwa 21B $VTHO explodiert ist. Der größte unmittelbare Treiber scheint spekulatives Interesse rund um bevorstehende VeChain-Ökosystem-Katalysatoren zu sein, insbesondere das erwartete Interstellar-Upgrade und die breitere Aufmerksamkeit für VeChains Roadmap. Jüngste Marktanalysen deuten außerdem auf einen großen Anstieg des Handelsvolumens als wichtigen Impuls-Verstärker hin. �
CoinMarketCap
Grundsätzlich wird $VTHO zunehmend interessanter, weil VeChain sein Tokenomics-Design überarbeitet hat. VTHO ist der Gas-Token von VeChainThor, und im neuen Modell ist die VTHO-Erzeugung an gestaktes VET gekoppelt, statt einfach durch das Halten von VET generiert zu werden. Gleichzeitig werden 100% des VTHO, der als Basis-Transaktionsgebühren genutzt wird, verbrannt, was bei steigender Netzwerkaktivität eine stärkere Knappheitsmechanik schafft. �
CoinMarketCap
Grundsätzlich wird $VTHO zunehmend interessanter, weil VeChain sein Tokenomics-Design überarbeitet hat. VTHO ist der Gas-Token von VeChainThor, und im neuen Modell ist die VTHO-Erzeugung an gestaktes VET gekoppelt, statt einfach durch das Halten von VET generiert zu werden. Gleichzeitig werden 100% des VTHO, der als Basis-Transaktionsgebühren genutzt wird, verbrannt, was bei steigender Netzwerkaktivität eine stärkere Knappheitsmechanik schafft. �
1
1
104
·
--
Artikel
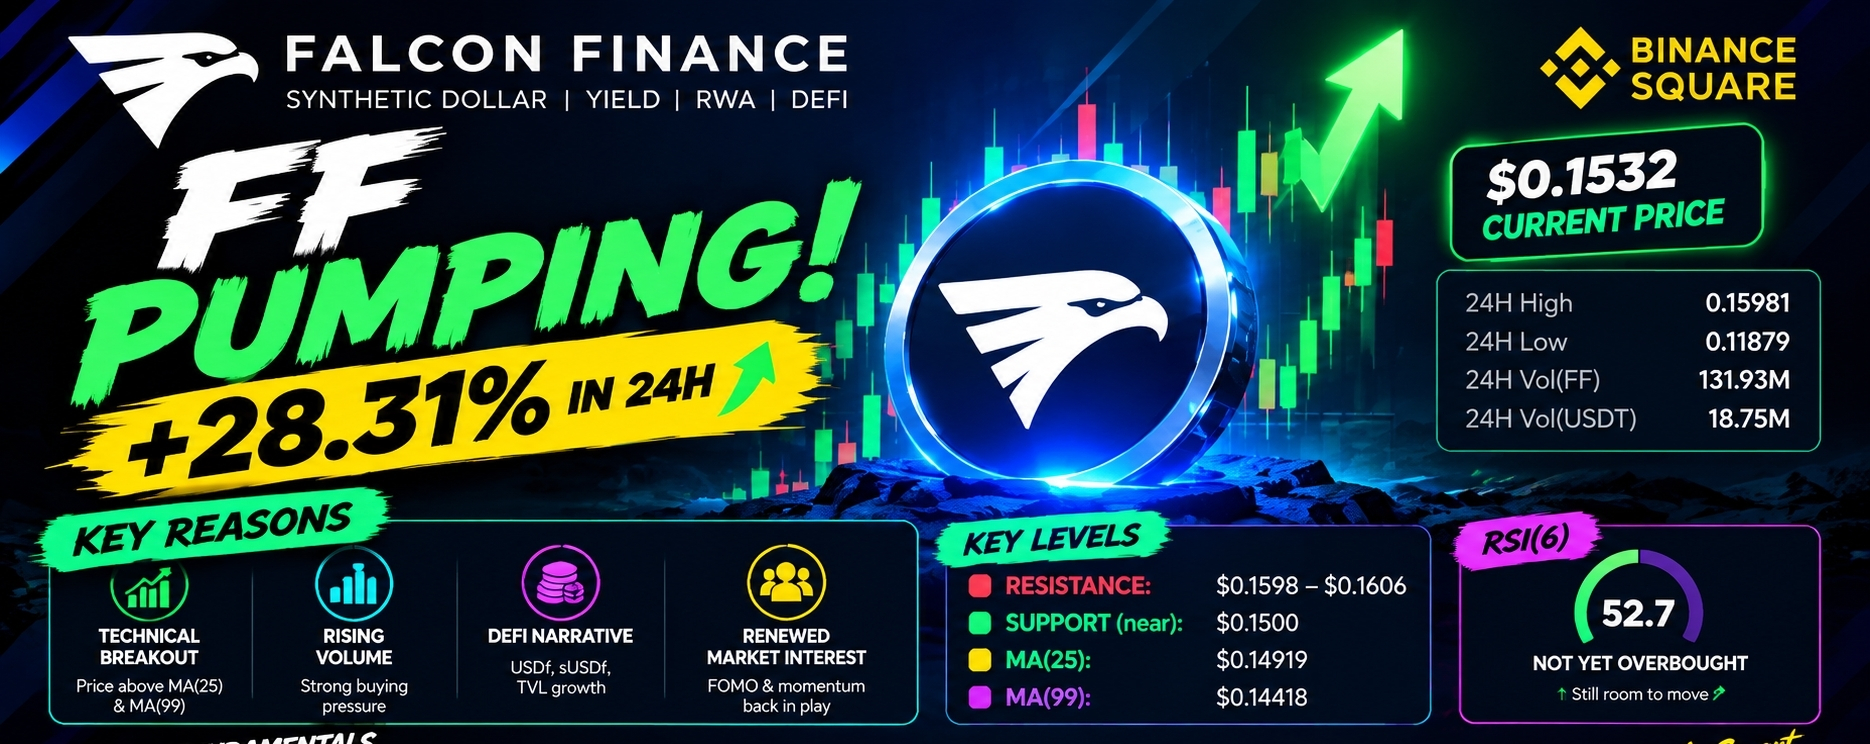
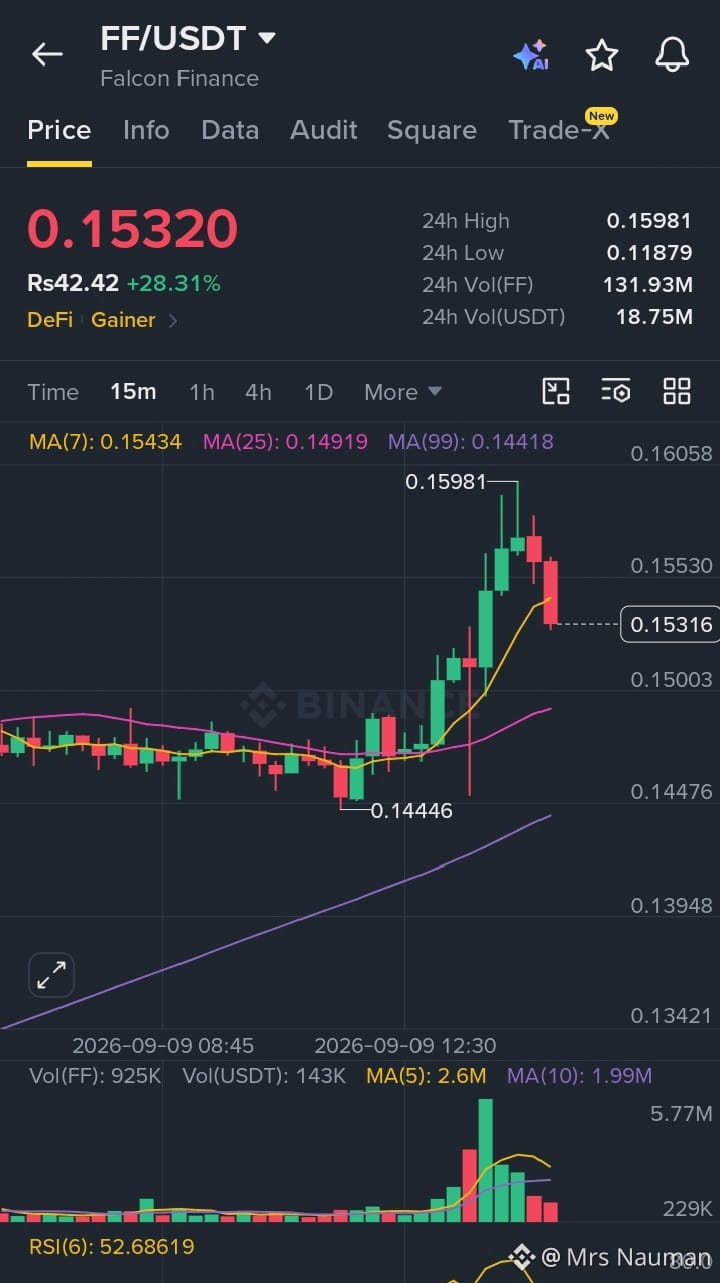
🚀 Warum pumpt $FF? Falcon-Finance-Rallye erklärt$FF (Falcon Finance) zeigt eine starke bullische Bewegung, wobei der Chart in deinem Screenshot einen Preis um $0.1532 zeigt, +28.31% in 24H nach oben, nachdem zuvor $0.15981 erreicht wurde. Der erste wichtige Grund ist ein klarer technischer Ausbruch: $FF ist scharf von der vorherigen Konsolidierung um $0.145–$0.150 weggegangen, während das Handelsvolumen deutlich angestiegen ist. Dein 15-Minuten-Chart zeigt MA(25) bei $0.14919 und MA(99) bei $0.14418, beide unter dem Preis, was bestätigt, dass die kurzfristige Struktur bullisch geworden ist. Der Volumen-Boost ist besonders wichtig, weil er darauf hindeutet, dass die Bewegung frische Beteiligung anzieht und nicht nur ein reiner Sprung bei niedrigem Volumen ist. Aktuelle Marktdaten zeigen außerdem, dass FF heute zu den stärker performenden Krypto-Assets zählt, mit grob +23%–24% Zuwächsen, je nach Datenquelle/Zeit. �
🚀 Warum pumpt $FF? Falcon-Finance-Rallye erklärt
$FF (Falcon Finance) zeigt eine starke bullische Bewegung, wobei der Chart in deinem Screenshot einen Preis um $0.1532 zeigt, +28.31% in 24H nach oben, nachdem zuvor $0.15981 erreicht wurde. Der erste wichtige Grund ist ein klarer technischer Ausbruch: $FF ist scharf von der vorherigen Konsolidierung um $0.145–$0.150 weggegangen, während das Handelsvolumen deutlich angestiegen ist. Dein 15-Minuten-Chart zeigt MA(25) bei $0.14919 und MA(99) bei $0.14418, beide unter dem Preis, was bestätigt, dass die kurzfristige Struktur bullisch geworden ist. Der Volumen-Boost ist besonders wichtig, weil er darauf hindeutet, dass die Bewegung frische Beteiligung anzieht und nicht nur ein reiner Sprung bei niedrigem Volumen ist. Aktuelle Marktdaten zeigen außerdem, dass FF heute zu den stärker performenden Krypto-Assets zählt, mit grob +23%–24% Zuwächsen, je nach Datenquelle/Zeit. �
1
72
·
--
$FF (Falcon Finance) macht eine starke Bewegung! 🔥📈 $FF handelt um $0.1532, +28,31% in 24 Std. nach einem Anstieg auf $0.15981. Der Aufschwung wird durch einen klaren Ausbruch aus der vorherigen Konsolidierungszone, eine große Volumen-Expansion und eine bullische Struktur der gleitenden Durchschnitte gestützt. Der Kurs hält sich über MA(25) $0.14919 und MA(99) $0.14418, was zeigt, dass Käufer die Kontrolle über den kurzfristigen Trend übernommen haben. 📊💰
Der nächste große Kampf findet sich bei $0.1598–$0.1606. Ein starker Ausbruch und ein Verbleib über dieser Zone könnte den Weg für weiteres Upside ebnen, während $0.1500–$0.1490 der entscheidende Unterstützungsbereich ist, den man bei jedem Rücksetzer im Blick behalten sollte. RSI um 52,7 ist noch nicht extrem überkauft, sodass die Bewegung noch Luft hat – aber die Volatilität bleibt nach dem +28%-Anstieg hoch. Starkes Volumen + Ausbruch + DeFi-Narrativ = $FF ist eine der Coins, die man genau beobachten sollte. 👀🔥 #FalconFinance #FFUSDT #Crypto #BinanceSquare #DeFi
$FF (Falcon Finance) macht eine starke Bewegung! 🔥📈 $FF handelt um $0.1532, +28,31% in 24 Std. nach einem Anstieg auf $0.15981. Der Aufschwung wird durch einen klaren Ausbruch aus der vorherigen Konsolidierungszone, eine große Volumen-Expansion und eine bullische Struktur der gleitenden Durchschnitte gestützt. Der Kurs hält sich über MA(25) $0.14919 und MA(99) $0.14418, was zeigt, dass Käufer die Kontrolle über den kurzfristigen Trend übernommen haben. 📊💰
Der nächste große Kampf findet sich bei $0.1598–$0.1606. Ein starker Ausbruch und ein Verbleib über dieser Zone könnte den Weg für weiteres Upside ebnen, während $0.1500–$0.1490 der entscheidende Unterstützungsbereich ist, den man bei jedem Rücksetzer im Blick behalten sollte. RSI um 52,7 ist noch nicht extrem überkauft, sodass die Bewegung noch Luft hat – aber die Volatilität bleibt nach dem +28%-Anstieg hoch. Starkes Volumen + Ausbruch + DeFi-Narrativ = $FF ist eine der Coins, die man genau beobachten sollte. 👀🔥 #FalconFinance #FFUSDT #Crypto #BinanceSquare #DeFi
Der nächste große Kampf findet sich bei $0.1598–$0.1606. Ein starker Ausbruch und ein Verbleib über dieser Zone könnte den Weg für weiteres Upside ebnen, während $0.1500–$0.1490 der entscheidende Unterstützungsbereich ist, den man bei jedem Rücksetzer im Blick behalten sollte. RSI um 52,7 ist noch nicht extrem überkauft, sodass die Bewegung noch Luft hat – aber die Volatilität bleibt nach dem +28%-Anstieg hoch. Starkes Volumen + Ausbruch + DeFi-Narrativ = $FF ist eine der Coins, die man genau beobachten sollte. 👀🔥 #FalconFinance #FFUSDT #Crypto #BinanceSquare #DeFi
1
82
·
--
Verifiziert
Artikel
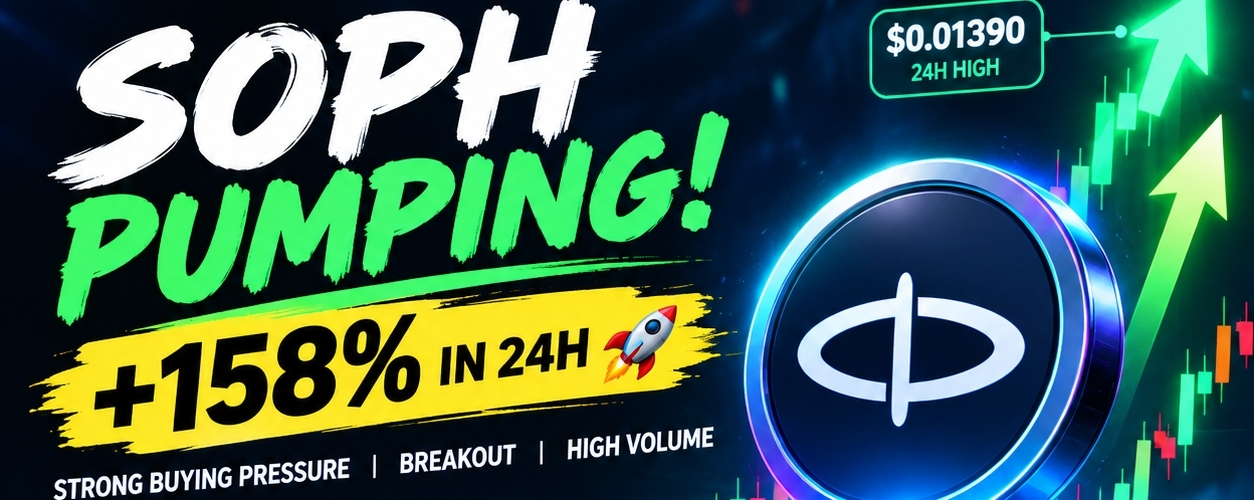
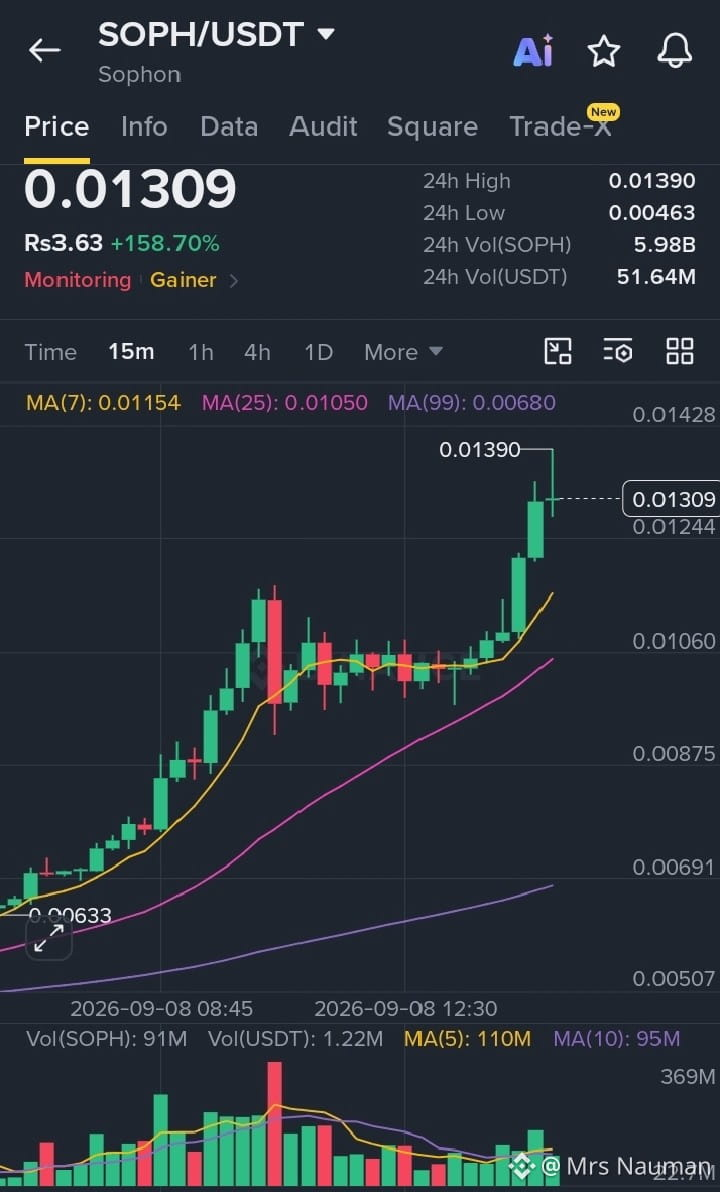
🚀 Warum pumpt SOPH so stark? +158% erklärt 📈🔥$SOPH zeigt heute eine explosive Bewegung: Handel bei rund 0,01309 $ mit einem +158,70%-Gewinn in 24 Stunden und einem 24H-Hoch von 0,01390 $. Die Bewegung wird durch starke Dynamik und einen deutlichen Anstieg der Handelsaktivität gestützt. Historische Daten zeigen außerdem, dass SOPH am 7. September bereits +35,48% gewonnen hatte — diese Rallye entwickelte sich also über aufeinanderfolgende Sessions, statt völlig aus dem Nichts zu erscheinen. �
Investing.com Kanada +1
🔥 1. Starker technischer Ausbruch
Auf dem 15-Minuten-Chart hat $SOPH seine vorherige Konsolidierungszone bei etwa 0,0100–0,0106 durchbrochen — mit mehreren großen bullischen Kerzen.
🚀 Warum pumpt SOPH so stark? +158% erklärt 📈🔥
$SOPH zeigt heute eine explosive Bewegung: Handel bei rund 0,01309 $ mit einem +158,70%-Gewinn in 24 Stunden und einem 24H-Hoch von 0,01390 $. Die Bewegung wird durch starke Dynamik und einen deutlichen Anstieg der Handelsaktivität gestützt. Historische Daten zeigen außerdem, dass SOPH am 7. September bereits +35,48% gewonnen hatte — diese Rallye entwickelte sich also über aufeinanderfolgende Sessions, statt völlig aus dem Nichts zu erscheinen. �
Investing.com Kanada +1
🔥 1. Starker technischer Ausbruch
Auf dem 15-Minuten-Chart hat $SOPH seine vorherige Konsolidierungszone bei etwa 0,0100–0,0106 durchbrochen — mit mehreren großen bullischen Kerzen.
Investing.com Kanada +1
🔥 1. Starker technischer Ausbruch
Auf dem 15-Minuten-Chart hat $SOPH seine vorherige Konsolidierungszone bei etwa 0,0100–0,0106 durchbrochen — mit mehreren großen bullischen Kerzen.
2
162
·
--
$SOPH explodiert! 🔥📈 Der Token ist in 24H um ca. +158% gestiegen und erreicht einen Hochstand nahe $0.01390. Der Anstieg wird von starkem Kaufdruck, steigender Handelsaktivität und einem bedeutenden technischen Ausbruch über die vorherige Konsolidierungszone $0.0100–$0.0106 getrieben. $SOPH handelt deutlich über seinem MA(7), MA(25) und MA(99), was einen starken kurzfristig bullischen Trend bestätigt. 🚀💰
Allerdings ist die Bewegung jetzt extrem überhitzt. RSI(6) liegt bei etwa 89, was auf stark überkaufte Bedingungen hindeutet; ein Rücksetzer oder eine Konsolidierung wäre daher nicht überraschend. Trader sollten $0.0124 und $0.0115 als kurzfristige Unterstützungen im Blick behalten, während $0.0139–$0.0143 der zentrale Widerstandsbereich ist. Wenn Käufer das Volumen aufrechterhalten und SOPH die Ausbruchszonen hält, ist ein weiterer Anstieg möglich – aber ein massiver Pump hinterherzulaufen birgt ein erhebliches Risiko. ⚠️📊 Trade klug, steuere dein Risiko und lass nicht FOMO deine Einstiege kontrollieren.
#SOPH #Crypto #Binance #Altcoins #BinanceSquareTalks 🚀$SOPH
$SOPH explodiert! 🔥📈 Der Token ist in 24H um ca. +158% gestiegen und erreicht einen Hochstand nahe $0.01390. Der Anstieg wird von starkem Kaufdruck, steigender Handelsaktivität und einem bedeutenden technischen Ausbruch über die vorherige Konsolidierungszone $0.0100–$0.0106 getrieben. $SOPH handelt deutlich über seinem MA(7), MA(25) und MA(99), was einen starken kurzfristig bullischen Trend bestätigt. 🚀💰
Allerdings ist die Bewegung jetzt extrem überhitzt. RSI(6) liegt bei etwa 89, was auf stark überkaufte Bedingungen hindeutet; ein Rücksetzer oder eine Konsolidierung wäre daher nicht überraschend. Trader sollten $0.0124 und $0.0115 als kurzfristige Unterstützungen im Blick behalten, während $0.0139–$0.0143 der zentrale Widerstandsbereich ist. Wenn Käufer das Volumen aufrechterhalten und SOPH die Ausbruchszonen hält, ist ein weiterer Anstieg möglich – aber ein massiver Pump hinterherzulaufen birgt ein erhebliches Risiko. ⚠️📊 Trade klug, steuere dein Risiko und lass nicht FOMO deine Einstiege kontrollieren.
#SOPH #Crypto #Binance #Altcoins #BinanceSquareTalks 🚀$SOPH
Allerdings ist die Bewegung jetzt extrem überhitzt. RSI(6) liegt bei etwa 89, was auf stark überkaufte Bedingungen hindeutet; ein Rücksetzer oder eine Konsolidierung wäre daher nicht überraschend. Trader sollten $0.0124 und $0.0115 als kurzfristige Unterstützungen im Blick behalten, während $0.0139–$0.0143 der zentrale Widerstandsbereich ist. Wenn Käufer das Volumen aufrechterhalten und SOPH die Ausbruchszonen hält, ist ein weiterer Anstieg möglich – aber ein massiver Pump hinterherzulaufen birgt ein erhebliches Risiko. ⚠️📊 Trade klug, steuere dein Risiko und lass nicht FOMO deine Einstiege kontrollieren.
#SOPH #Crypto #Binance #Altcoins #BinanceSquareTalks 🚀$SOPH
2
138
·
--
Übersetzung ansehen
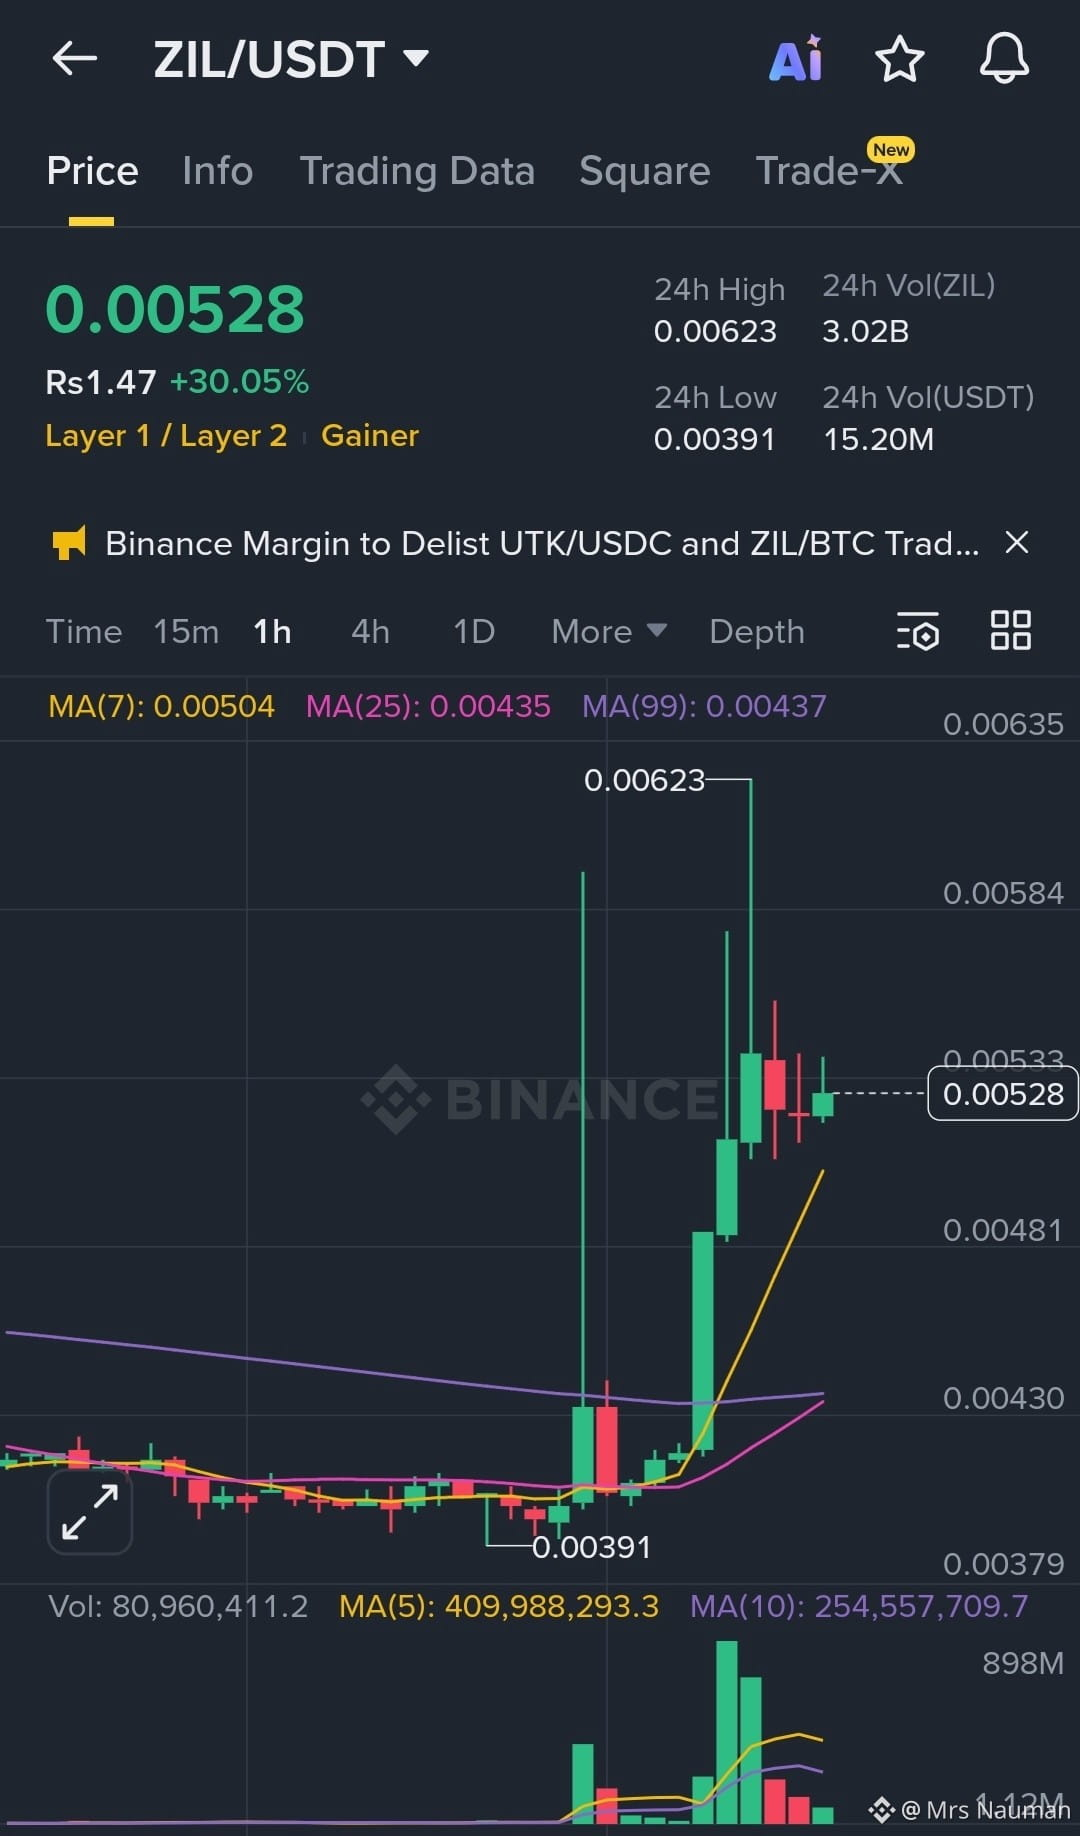
Zilliqa ($ZIL ) surged over 30% after breaking out of a long consolidation range near 0.0039–0.0042, a zone where accumulation had been building for weeks. The breakout above key moving averages (MA25 and MA99 on the 1H chart) flipped market structure bullish and triggered strong momentum buying. This move was backed by a sharp increase in volume, confirming real participation rather than a low-liquidity spike. Once price reclaimed 0.0045, a wave of short liquidations accelerated the rally, pushing $ZIL quickly toward the 0.0062 resistance area as stop-losses were triggered and liquidity was grabbed above previous highs.
After the spike, $ZIL is now cooling off and consolidating above former resistance, which is a healthy sign rather than weakness. Holding above the 0.0050–0.0048 zone keeps the bullish structure intact and opens the door for continuation if broader market conditions remain stable. The pump also aligns with ongoing capital rotation into Layer-1 and Layer-2 altcoins, where lower market caps tend to move faster once momentum enters. While short-term volatility is expected after such a rapid move, the combination of structure break, volume confirmation, and market rotation explains why ZIL pumped and why traders are still watching it closely.
{future}(ZILUSDT)
#MarketCorrection
Zilliqa ($ZIL ) surged over 30% after breaking out of a long consolidation range near 0.0039–0.0042, a zone where accumulation had been building for weeks. The breakout above key moving averages (MA25 and MA99 on the 1H chart) flipped market structure bullish and triggered strong momentum buying. This move was backed by a sharp increase in volume, confirming real participation rather than a low-liquidity spike. Once price reclaimed 0.0045, a wave of short liquidations accelerated the rally, pushing $ZIL quickly toward the 0.0062 resistance area as stop-losses were triggered and liquidity was grabbed above previous highs.
After the spike, $ZIL is now cooling off and consolidating above former resistance, which is a healthy sign rather than weakness. Holding above the 0.0050–0.0048 zone keeps the bullish structure intact and opens the door for continuation if broader market conditions remain stable. The pump also aligns with ongoing capital rotation into Layer-1 and Layer-2 altcoins, where lower market caps tend to move faster once momentum enters. While short-term volatility is expected after such a rapid move, the combination of structure break, volume confirmation, and market rotation explains why ZIL pumped and why traders are still watching it closely.
#MarketCorrection
After the spike, $ZIL is now cooling off and consolidating above former resistance, which is a healthy sign rather than weakness. Holding above the 0.0050–0.0048 zone keeps the bullish structure intact and opens the door for continuation if broader market conditions remain stable. The pump also aligns with ongoing capital rotation into Layer-1 and Layer-2 altcoins, where lower market caps tend to move faster once momentum enters. While short-term volatility is expected after such a rapid move, the combination of structure break, volume confirmation, and market rotation explains why ZIL pumped and why traders are still watching it closely.
#MarketCorrection
10
278
·
--
Übersetzung ansehen
Why ZIL Price Pumped??🚀 Why $ZIL Price Pumped – Full Breakdown (ZIL/USDT)
Zilliqa (ZIL) just printed a +30% move in a very short time, and this pump wasn’t accidental. It was a perfect mix of technical breakout + liquidity dynamics + market psychology.
Let’s break it down step by step 👇
🔹 1. Long Accumulation Phase (Smart Money Setup)
Before the pump, $ZIL was moving sideways around 0.0039–0.0042 for a long time.
Low volatility
Flat price action
Weak retail interest
This is classic accumulation, where smart money builds positions quietly while price looks “dead”.
➡️ The 0.00391 level acted as a strong demand zone, clearly visible on the chart.
🔹 2. Major Moving Average Breakout
On the 1H chart:
Price broke above MA(25) and MA(99)
MA(7) crossed sharply upward
This crossover is a bullish momentum signal, often used by short-term and swing traders.
📈 Once price reclaimed these MAs, algos and momentum traders entered aggressively.
🔹 3. Volume Explosion = Real Pump
This wasn’t a fake pump.
Volume jumped massively (hundreds of millions $ZIL traded)
Green volume candles dominated red ones
Confirms strong participation, not just one whale
🔥 Volume always comes before sustained price movement.
🔹 4. Short Squeeze Effect
ZIL was heavily shorted because:
Downtrend for weeks
Low expectations
“Dead coin” narrative
When price broke above 0.0043–0.0045, shorts started getting liquidated.
💥 Liquidations = forced market buys = vertical candles
That’s why you see long green wicks straight to 0.00623
🔹 5. Liquidity Grab Above Resistance
The zone around 0.0058–0.0062 was a known resistance.
What happened?
Price spiked above it
Triggered stop-losses
Grabbed liquidity
Then cooled down slightly
📌 This is a healthy move, not bearish — price is now consolidating above previous resistance.
🔹 6. Market Rotation into Layer-1 / Layer-2 Coins
ZIL is tagged as Layer 1 / Layer 2, and right now:
Capital is rotating from BTC → Altcoins
Low-cap L1s pump faster due to thinner order books
ZIL benefits strongly from this phase of the market cycle.
🔹 7. Current Structure (Important)
At the moment:
Price holding above 0.0050
Previous resistance turned support
No panic selling despite pullback
📊 This suggests continuation potential if BTC stays stable.
🔮 What to Watch Next
Support: 0.0050 – 0.0048
Resistance: 0.0062
Break and hold above 0.0062 = next leg possible
Lose 0.0048 = deeper correction
🧠 Final Thoughts
This ZIL pump was: ✅ Technically justified
✅ Volume-backed
✅ Fueled by short liquidations
✅ Supported by market rotation
Not random. Not luck.
⚠️ As always: pumps cool down, entries matter, and risk management is key.
{future}(ZILUSDT)
#StrategyBTCPurchase #AISocialNetworkMoltbook
Why ZIL Price Pumped??
🚀 Why $ZIL Price Pumped – Full Breakdown (ZIL/USDT)
Zilliqa (ZIL) just printed a +30% move in a very short time, and this pump wasn’t accidental. It was a perfect mix of technical breakout + liquidity dynamics + market psychology.
Let’s break it down step by step 👇
🔹 1. Long Accumulation Phase (Smart Money Setup)
Before the pump, $ZIL was moving sideways around 0.0039–0.0042 for a long time.
Low volatility
Flat price action
Weak retail interest
This is classic accumulation, where smart money builds positions quietly while price looks “dead”.
➡️ The 0.00391 level acted as a strong demand zone, clearly visible on the chart.
🔹 2. Major Moving Average Breakout
On the 1H chart:
Price broke above MA(25) and MA(99)
MA(7) crossed sharply upward
This crossover is a bullish momentum signal, often used by short-term and swing traders.
📈 Once price reclaimed these MAs, algos and momentum traders entered aggressively.
🔹 3. Volume Explosion = Real Pump
This wasn’t a fake pump.
Volume jumped massively (hundreds of millions $ZIL traded)
Green volume candles dominated red ones
Confirms strong participation, not just one whale
🔥 Volume always comes before sustained price movement.
🔹 4. Short Squeeze Effect
ZIL was heavily shorted because:
Downtrend for weeks
Low expectations
“Dead coin” narrative
When price broke above 0.0043–0.0045, shorts started getting liquidated.
💥 Liquidations = forced market buys = vertical candles
That’s why you see long green wicks straight to 0.00623
🔹 5. Liquidity Grab Above Resistance
The zone around 0.0058–0.0062 was a known resistance.
What happened?
Price spiked above it
Triggered stop-losses
Grabbed liquidity
Then cooled down slightly
📌 This is a healthy move, not bearish — price is now consolidating above previous resistance.
🔹 6. Market Rotation into Layer-1 / Layer-2 Coins
ZIL is tagged as Layer 1 / Layer 2, and right now:
Capital is rotating from BTC → Altcoins
Low-cap L1s pump faster due to thinner order books
ZIL benefits strongly from this phase of the market cycle.
🔹 7. Current Structure (Important)
At the moment:
Price holding above 0.0050
Previous resistance turned support
No panic selling despite pullback
📊 This suggests continuation potential if BTC stays stable.
🔮 What to Watch Next
Support: 0.0050 – 0.0048
Resistance: 0.0062
Break and hold above 0.0062 = next leg possible
Lose 0.0048 = deeper correction
🧠 Final Thoughts
This ZIL pump was: ✅ Technically justified
✅ Volume-backed
✅ Fueled by short liquidations
✅ Supported by market rotation
Not random. Not luck.
⚠️ As always: pumps cool down, entries matter, and risk management is key.
#StrategyBTCPurchase #AISocialNetworkMoltbook
Zilliqa (ZIL) just printed a +30% move in a very short time, and this pump wasn’t accidental. It was a perfect mix of technical breakout + liquidity dynamics + market psychology.
Let’s break it down step by step 👇
🔹 1. Long Accumulation Phase (Smart Money Setup)
Before the pump, $ZIL was moving sideways around 0.0039–0.0042 for a long time.
Low volatility
Flat price action
Weak retail interest
This is classic accumulation, where smart money builds positions quietly while price looks “dead”.
➡️ The 0.00391 level acted as a strong demand zone, clearly visible on the chart.
🔹 2. Major Moving Average Breakout
On the 1H chart:
Price broke above MA(25) and MA(99)
MA(7) crossed sharply upward
This crossover is a bullish momentum signal, often used by short-term and swing traders.
📈 Once price reclaimed these MAs, algos and momentum traders entered aggressively.
🔹 3. Volume Explosion = Real Pump
This wasn’t a fake pump.
Volume jumped massively (hundreds of millions $ZIL traded)
Green volume candles dominated red ones
Confirms strong participation, not just one whale
🔥 Volume always comes before sustained price movement.
🔹 4. Short Squeeze Effect
ZIL was heavily shorted because:
Downtrend for weeks
Low expectations
“Dead coin” narrative
When price broke above 0.0043–0.0045, shorts started getting liquidated.
💥 Liquidations = forced market buys = vertical candles
That’s why you see long green wicks straight to 0.00623
🔹 5. Liquidity Grab Above Resistance
The zone around 0.0058–0.0062 was a known resistance.
What happened?
Price spiked above it
Triggered stop-losses
Grabbed liquidity
Then cooled down slightly
📌 This is a healthy move, not bearish — price is now consolidating above previous resistance.
🔹 6. Market Rotation into Layer-1 / Layer-2 Coins
ZIL is tagged as Layer 1 / Layer 2, and right now:
Capital is rotating from BTC → Altcoins
Low-cap L1s pump faster due to thinner order books
ZIL benefits strongly from this phase of the market cycle.
🔹 7. Current Structure (Important)
At the moment:
Price holding above 0.0050
Previous resistance turned support
No panic selling despite pullback
📊 This suggests continuation potential if BTC stays stable.
🔮 What to Watch Next
Support: 0.0050 – 0.0048
Resistance: 0.0062
Break and hold above 0.0062 = next leg possible
Lose 0.0048 = deeper correction
🧠 Final Thoughts
This ZIL pump was: ✅ Technically justified
✅ Volume-backed
✅ Fueled by short liquidations
✅ Supported by market rotation
Not random. Not luck.
⚠️ As always: pumps cool down, entries matter, and risk management is key.
#StrategyBTCPurchase #AISocialNetworkMoltbook
11
11
Anmelden und weiter Inhalte entdecken
Krypto-Nutzer weltweit auf Binance Square kennenlernen
⚡️ Bleib in Sachen Krypto stets am Puls.
💬 Die weltgrößte Kryptobörse vertraut darauf.
👍 Erhalte verlässliche Einblicke von verifizierten Creators.
E-Mail-Adresse/Telefonnummer
Trendthemen
BitcoinReboundsTo$79K
24,886 Aufrufe
236 Kommentare
🚨 $BTC steigt weiter.
Bitcoin handelt bei etwa 78.804 $ und liegt damit ungefähr 1,9 % im Plus, nachdem die Marke von 78K zurückerobert wurde. Die nächste zu beobachtende Zone ist das Tageshoch im Intraday-Bereich nahe 78.905 $.
Ein klarer Ausbruch über diese Marke könnte den Weg in Richtung 79K–80K ebnen. Wenn BTC abgewiesen wird, liegt der Support bei etwa 78.300 $ und danach bei 77.975 $.
Die Bullen haben Momentum, aber BTC muss über 78K bleiben.
#Bitcoin #BTC #CryptoTrading #CryptoMarket #CryptoAnalysis
PulseON
·20 Likes
·19.4k Aufrufe
USDCOnChainVolumeTops$100Trillion
11 Aufrufe
7 Kommentare
BitcoinSpotETFsNetInflow$160M
917 Aufrufe
57 Kommentare