
green view
18 Beiträge

green view
Melden
Nutzer blockieren
Trade eröffnen
3.1 Monate
0 Following
0 Follower
1 Like gegeben
Beiträge
Portfolio
·
--
Übersetzung ansehen
Bitcoin (BTC) – Latest Analysis (June 26, 2026)
Bitcoin is trading under pressure after a sharp sell-off, briefly falling below $60,000 before stabilizing near the $59,000–$60,000 range. The decline was fueled by geopolitical uncertainty, increased market volatility, and large-scale crypto liquidations.
Key Points
📉 Support: $58,000–$59,000
📈 Resistance: $62,000–$64,000
⚠️ Market sentiment remains cautious, with high volatility.
🐂 A move back above $62,000 could improve short-term bullish momentum.
🐻 Losing the $58,000 level could trigger another wave of selling.
Outlook: Bitcoin is at an important technical level. Traders should watch the $58K support and $62K resistance closely. A breakout in either direction is likely to determine the next major move.
#USPCEInflationHits4.1% #MemeCoreMTokenCrashes80%
{spot}(BTCUSDT)
Bitcoin (BTC) – Latest Analysis (June 26, 2026)
Bitcoin is trading under pressure after a sharp sell-off, briefly falling below $60,000 before stabilizing near the $59,000–$60,000 range. The decline was fueled by geopolitical uncertainty, increased market volatility, and large-scale crypto liquidations.
Key Points
📉 Support: $58,000–$59,000
📈 Resistance: $62,000–$64,000
⚠️ Market sentiment remains cautious, with high volatility.
🐂 A move back above $62,000 could improve short-term bullish momentum.
🐻 Losing the $58,000 level could trigger another wave of selling.
Outlook: Bitcoin is at an important technical level. Traders should watch the $58K support and $62K resistance closely. A breakout in either direction is likely to determine the next major move.
#USPCEInflationHits4.1% #MemeCoreMTokenCrashes80%
Bitcoin is trading under pressure after a sharp sell-off, briefly falling below $60,000 before stabilizing near the $59,000–$60,000 range. The decline was fueled by geopolitical uncertainty, increased market volatility, and large-scale crypto liquidations.
Key Points
📉 Support: $58,000–$59,000
📈 Resistance: $62,000–$64,000
⚠️ Market sentiment remains cautious, with high volatility.
🐂 A move back above $62,000 could improve short-term bullish momentum.
🐻 Losing the $58,000 level could trigger another wave of selling.
Outlook: Bitcoin is at an important technical level. Traders should watch the $58K support and $62K resistance closely. A breakout in either direction is likely to determine the next major move.
#USPCEInflationHits4.1% #MemeCoreMTokenCrashes80%
69
·
--
Übersetzung ansehen
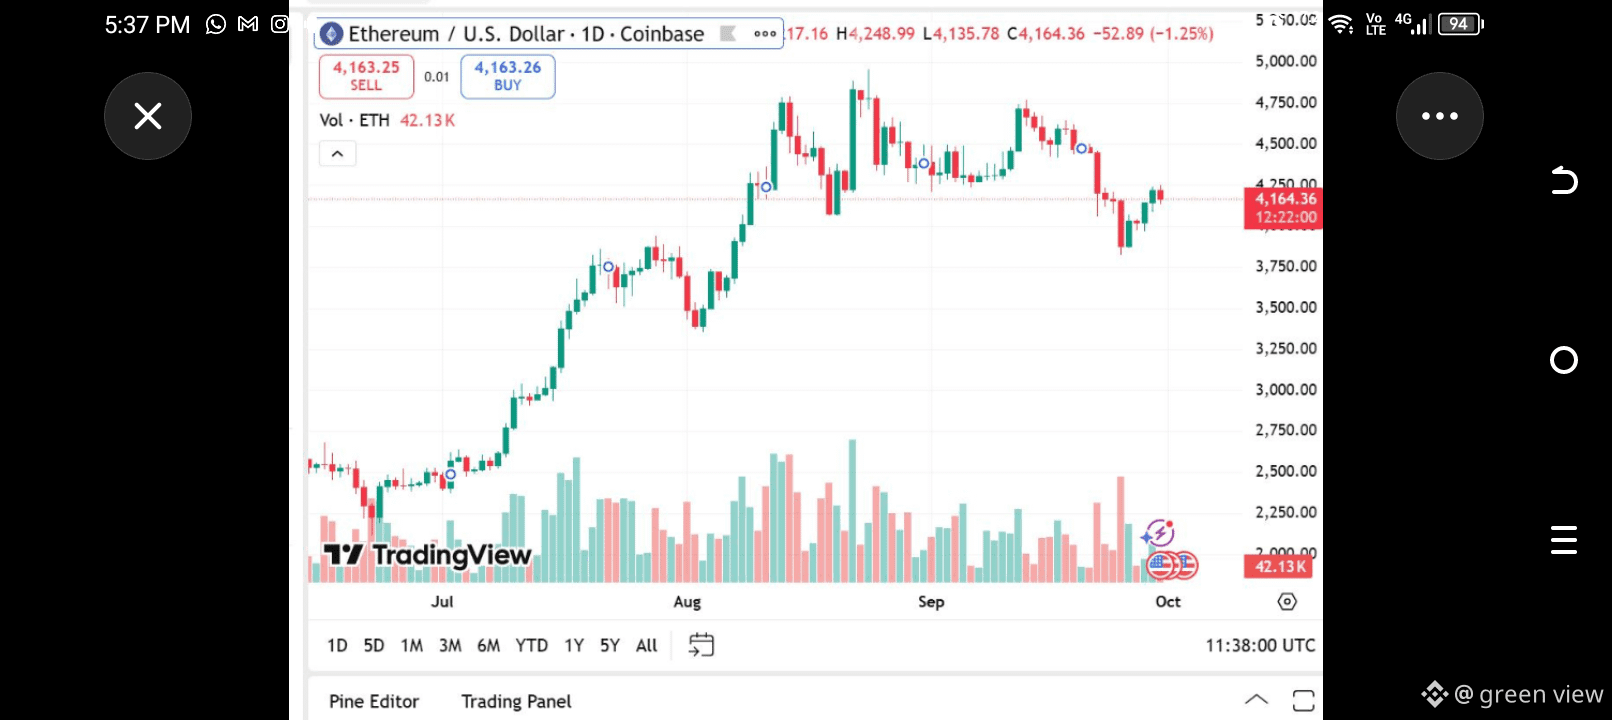
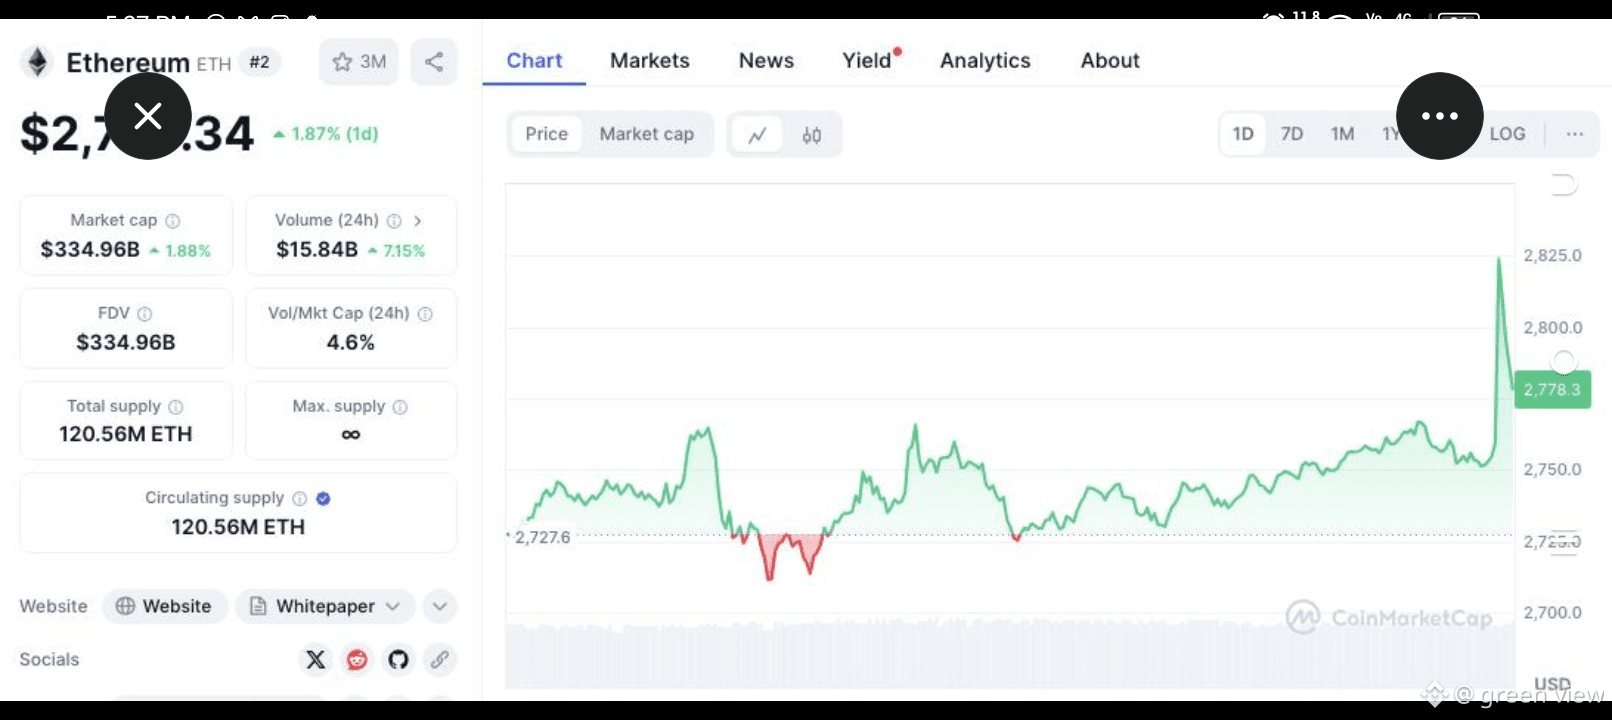
Ethereum (ETH) – Latest Analysis (23 June 2026)
Ethereum (ETH) is currently trading around the $1,650–$1,750 range after a volatile period in the broader cryptocurrency market. Recent price action shows ETH holding a major support zone while investors continue to monitor ETF flows, network activity, and overall market sentiment.
Key Points
📊 ETH remains the second-largest cryptocurrency by market capitalization.
🛡️ Strong support is developing near the current price region, helping limit downside pressure.
🚀 Ethereum's ecosystem continues to benefit from staking, Layer-2 growth, and smart contract adoption.
⚠️ Continued ETF outflows and macroeconomic uncertainty remain short-term risks for ETH.
Outlook
If buyers maintain control above key support levels, Ethereum could attempt a move toward higher resistance zones in the coming weeks. However, traders should expect continued volatility as the crypto market reacts to economic and institutional developments.
Overall Sentiment: 🟡 Cautiously Bullish — Ethereum's long-term fundamentals remain strong, but short-term price action is still sensitive to market conditions.
#NakamotoShiftsToBitcoinFocusedBusiness BendingSpoonsSeeking$1.62BIPO#NakamotoShiftsToBitcoinFocusedBusiness
{spot}(ETHUSDT)
Ethereum (ETH) – Latest Analysis (23 June 2026)
Ethereum (ETH) is currently trading around the $1,650–$1,750 range after a volatile period in the broader cryptocurrency market. Recent price action shows ETH holding a major support zone while investors continue to monitor ETF flows, network activity, and overall market sentiment.
Key Points
📊 ETH remains the second-largest cryptocurrency by market capitalization.
🛡️ Strong support is developing near the current price region, helping limit downside pressure.
🚀 Ethereum's ecosystem continues to benefit from staking, Layer-2 growth, and smart contract adoption.
⚠️ Continued ETF outflows and macroeconomic uncertainty remain short-term risks for ETH.
Outlook
If buyers maintain control above key support levels, Ethereum could attempt a move toward higher resistance zones in the coming weeks. However, traders should expect continued volatility as the crypto market reacts to economic and institutional developments.
Overall Sentiment: 🟡 Cautiously Bullish — Ethereum's long-term fundamentals remain strong, but short-term price action is still sensitive to market conditions.
#NakamotoShiftsToBitcoinFocusedBusiness BendingSpoonsSeeking$1.62BIPO#NakamotoShiftsToBitcoinFocusedBusiness
Ethereum (ETH) is currently trading around the $1,650–$1,750 range after a volatile period in the broader cryptocurrency market. Recent price action shows ETH holding a major support zone while investors continue to monitor ETF flows, network activity, and overall market sentiment.
Key Points
📊 ETH remains the second-largest cryptocurrency by market capitalization.
🛡️ Strong support is developing near the current price region, helping limit downside pressure.
🚀 Ethereum's ecosystem continues to benefit from staking, Layer-2 growth, and smart contract adoption.
⚠️ Continued ETF outflows and macroeconomic uncertainty remain short-term risks for ETH.
Outlook
If buyers maintain control above key support levels, Ethereum could attempt a move toward higher resistance zones in the coming weeks. However, traders should expect continued volatility as the crypto market reacts to economic and institutional developments.
Overall Sentiment: 🟡 Cautiously Bullish — Ethereum's long-term fundamentals remain strong, but short-term price action is still sensitive to market conditions.
#NakamotoShiftsToBitcoinFocusedBusiness BendingSpoonsSeeking$1.62BIPO#NakamotoShiftsToBitcoinFocusedBusiness
63
·
--
Übersetzung ansehen
$BTC
(BTC) Analysis – 23 June 2026
Bitcoin (BTC) is trading around $62,000–$63,000 after a recent pullback. Selling pressure increased due to broader market uncertainty, but BTC continues to hold above an important support zone near $60,000–$62,000.
Key Levels
🟢 Support: $60,000 – $62,000
🔴 Resistance: $63,500 – $66,000
📈 A move above resistance could trigger a recovery toward higher levels.
⚠️ A break below $60,000 may increase bearish momentum.
Market Outlook
Bitcoin remains in a short-term correction phase, but long-term adoption and institutional interest continue to support the market. Traders are watching whether buyers can defend the current support zone and start a rebound.
Short View: Neutral to slightly bullish if BTC stays above $60K–$62K. A recovery above $65K would strengthen bullish sentiment.
#USPostQuantumCryptographyDeadline2031 #SpaceXToJoinBloombergGlobalLargeCapIndex
{spot}(BTCUSDT)
$BTC
(BTC) Analysis – 23 June 2026
Bitcoin (BTC) is trading around $62,000–$63,000 after a recent pullback. Selling pressure increased due to broader market uncertainty, but BTC continues to hold above an important support zone near $60,000–$62,000.
Key Levels
🟢 Support: $60,000 – $62,000
🔴 Resistance: $63,500 – $66,000
📈 A move above resistance could trigger a recovery toward higher levels.
⚠️ A break below $60,000 may increase bearish momentum.
Market Outlook
Bitcoin remains in a short-term correction phase, but long-term adoption and institutional interest continue to support the market. Traders are watching whether buyers can defend the current support zone and start a rebound.
Short View: Neutral to slightly bullish if BTC stays above $60K–$62K. A recovery above $65K would strengthen bullish sentiment.
#USPostQuantumCryptographyDeadline2031 #SpaceXToJoinBloombergGlobalLargeCapIndex
(BTC) Analysis – 23 June 2026
Bitcoin (BTC) is trading around $62,000–$63,000 after a recent pullback. Selling pressure increased due to broader market uncertainty, but BTC continues to hold above an important support zone near $60,000–$62,000.
Key Levels
🟢 Support: $60,000 – $62,000
🔴 Resistance: $63,500 – $66,000
📈 A move above resistance could trigger a recovery toward higher levels.
⚠️ A break below $60,000 may increase bearish momentum.
Market Outlook
Bitcoin remains in a short-term correction phase, but long-term adoption and institutional interest continue to support the market. Traders are watching whether buyers can defend the current support zone and start a rebound.
Short View: Neutral to slightly bullish if BTC stays above $60K–$62K. A recovery above $65K would strengthen bullish sentiment.
#USPostQuantumCryptographyDeadline2031 #SpaceXToJoinBloombergGlobalLargeCapIndex
80
·
--
Übersetzung ansehen
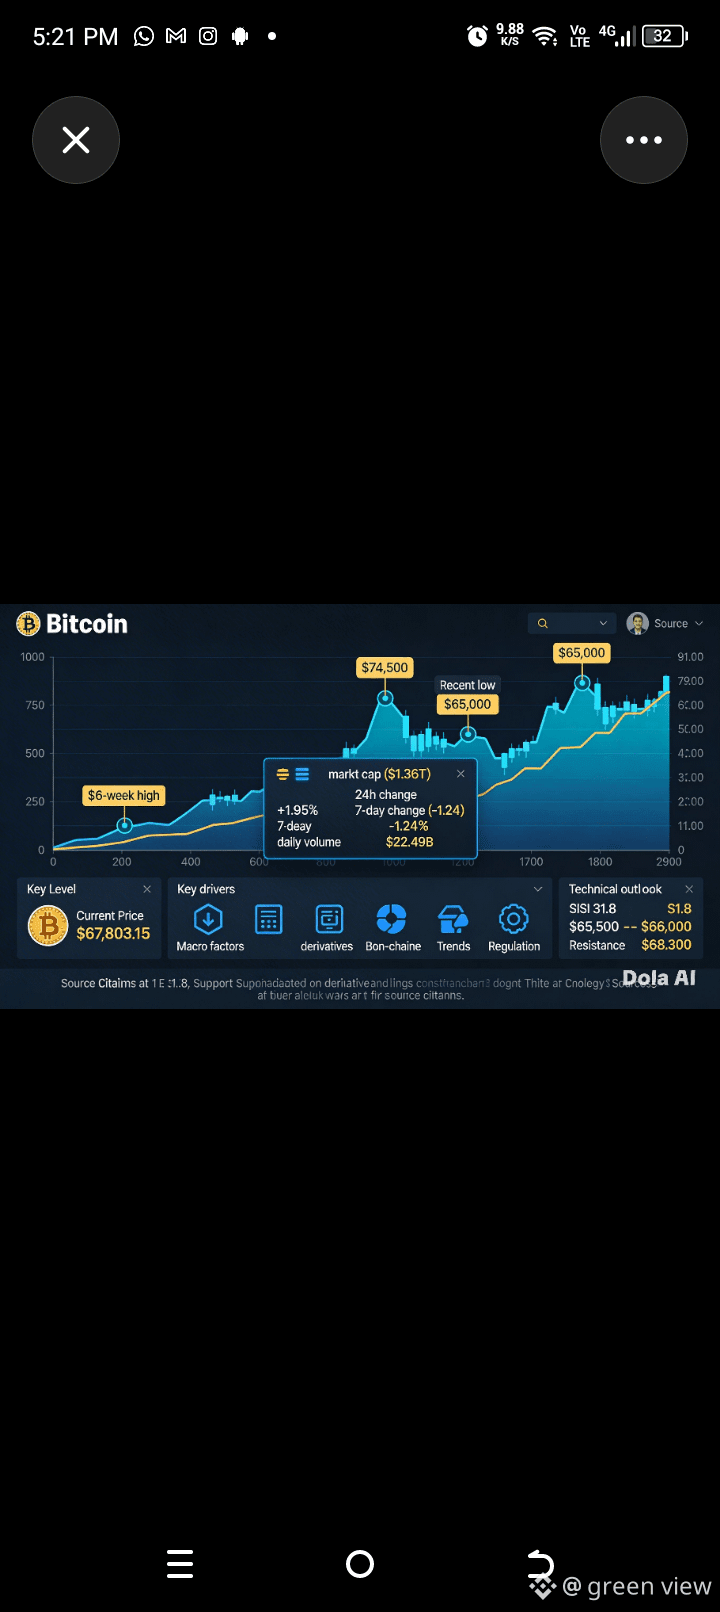
📊 Bitcoin$BTC Bitcoin remains in a cautiously bullish trend, holding above key support levels after recovering from recent market weakness. Slower ETF outflows and renewed buying interest have improved sentiment, while resistance near $73,000–$74,000 remains the next major hurdle.
Outlook: 🟢 Bullish in the short term, but traders should expect continued volatility as Bitcoin tests higher price levels.
{spot}(BTCUSDT)
#VanceSeesNoEvidenceOfHormuzClosure #TrumpSaysCollapseRiskDroveUSIranDeal
📊 Bitcoin$BTC Bitcoin remains in a cautiously bullish trend, holding above key support levels after recovering from recent market weakness. Slower ETF outflows and renewed buying interest have improved sentiment, while resistance near $73,000–$74,000 remains the next major hurdle.
Outlook: 🟢 Bullish in the short term, but traders should expect continued volatility as Bitcoin tests higher price levels.
#VanceSeesNoEvidenceOfHormuzClosure #TrumpSaysCollapseRiskDroveUSIranDeal
Outlook: 🟢 Bullish in the short term, but traders should expect continued volatility as Bitcoin tests higher price levels.
#VanceSeesNoEvidenceOfHormuzClosure #TrumpSaysCollapseRiskDroveUSIranDeal
29
·
--
Übersetzung ansehen
believe $SUI will reach $100 with 400B marketcap sui is the only coin that make the transaction unknown and most whales love that
SUI is the native coin of the Sui blockchain, a fast Layer 1 network built for scalable apps, gaming, NFTs, and DeFi.
![Picture: Price chart]
SUI has strong technology and useful features like gas fees and staking, which give the coin real utility. Its main strengths are speed, modern design, and growth potential.
![Picture: Bull vs bear graphic]
However, SUI is still a high-risk altcoin. It faces strong competition from other blockchains, and future token unlocks may affect its price.
Short verdict:
SUI is a promising crypto project, but investors should watch adoption, competition, and market volatility.
If you want, I can make it ultra short in 3 lines.#MSCIGivesSpaceXLowestESGRatingCCC
#VanceSeesNoEvidenceOfHormuzClosure
{spot}(SUIUSDT)
believe $SUI will reach $100 with 400B marketcap sui is the only coin that make the transaction unknown and most whales love that
SUI is the native coin of the Sui blockchain, a fast Layer 1 network built for scalable apps, gaming, NFTs, and DeFi.
![Picture: Price chart]
SUI has strong technology and useful features like gas fees and staking, which give the coin real utility. Its main strengths are speed, modern design, and growth potential.
![Picture: Bull vs bear graphic]
However, SUI is still a high-risk altcoin. It faces strong competition from other blockchains, and future token unlocks may affect its price.
Short verdict:
SUI is a promising crypto project, but investors should watch adoption, competition, and market volatility.
If you want, I can make it ultra short in 3 lines.#MSCIGivesSpaceXLowestESGRatingCCC
#VanceSeesNoEvidenceOfHormuzClosure
SUI is the native coin of the Sui blockchain, a fast Layer 1 network built for scalable apps, gaming, NFTs, and DeFi.
![Picture: Price chart]
SUI has strong technology and useful features like gas fees and staking, which give the coin real utility. Its main strengths are speed, modern design, and growth potential.
![Picture: Bull vs bear graphic]
However, SUI is still a high-risk altcoin. It faces strong competition from other blockchains, and future token unlocks may affect its price.
Short verdict:
SUI is a promising crypto project, but investors should watch adoption, competition, and market volatility.
If you want, I can make it ultra short in 3 lines.#MSCIGivesSpaceXLowestESGRatingCCC
#VanceSeesNoEvidenceOfHormuzClosure
30
·
--
Übersetzung ansehen
Ethereum (ETH) – Short Analysis (June 2026)
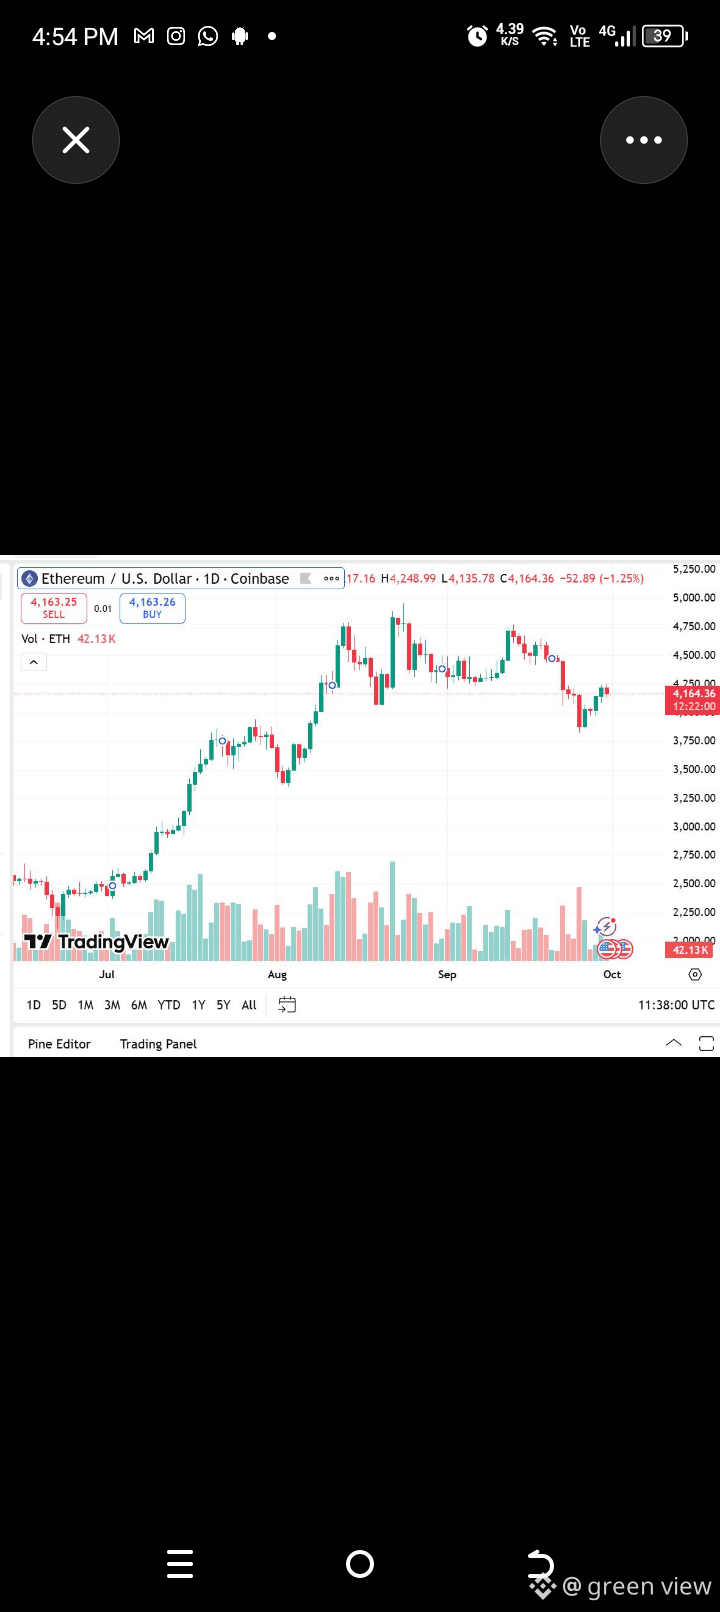
Ethereum $ETH remains the second-largest cryptocurrency by market capitalization and continues to benefit from growing adoption in decentralized finance (DeFi), tokenization, and blockchain-based applications.
Key Points
📈 Bullish Factors: Increasing institutional interest, expanding Layer-2 ecosystems, and steady network activity support long-term growth.
⚡ Network Strength: Ethereum remains the leading smart-contract platform, hosting thousands of decentralized applications.
💰 Staking Demand: ETH staking continues to reduce circulating supply, which can support prices during periods of strong demand.
⚠️ Risks: Market volatility, regulatory developments, and competition from other blockchains could create short-term pressure.
Outlook
Ethereum's overall trend remains constructive as long as adoption and network usage continue to grow. Traders are watching key support and resistance levels closely, while long-term investors remain focused on Ethereum's role as the backbone of the decentralized economy.
Market Sentiment: 🟢 Moderately Bullish (Long-Term) | 🟡 Neutral to Bullish (Short-Term)#VanceSeesNoEvidenceOfHormuzClosure #VanceSeesNoEvidenceOfHormuzClosure
{spot}(ETHUSDT)
Ethereum (ETH) – Short Analysis (June 2026)
Ethereum $ETH remains the second-largest cryptocurrency by market capitalization and continues to benefit from growing adoption in decentralized finance (DeFi), tokenization, and blockchain-based applications.
Key Points
📈 Bullish Factors: Increasing institutional interest, expanding Layer-2 ecosystems, and steady network activity support long-term growth.
⚡ Network Strength: Ethereum remains the leading smart-contract platform, hosting thousands of decentralized applications.
💰 Staking Demand: ETH staking continues to reduce circulating supply, which can support prices during periods of strong demand.
⚠️ Risks: Market volatility, regulatory developments, and competition from other blockchains could create short-term pressure.
Outlook
Ethereum's overall trend remains constructive as long as adoption and network usage continue to grow. Traders are watching key support and resistance levels closely, while long-term investors remain focused on Ethereum's role as the backbone of the decentralized economy.
Market Sentiment: 🟢 Moderately Bullish (Long-Term) | 🟡 Neutral to Bullish (Short-Term)#VanceSeesNoEvidenceOfHormuzClosure #VanceSeesNoEvidenceOfHormuzClosure
Ethereum $ETH remains the second-largest cryptocurrency by market capitalization and continues to benefit from growing adoption in decentralized finance (DeFi), tokenization, and blockchain-based applications.
Key Points
📈 Bullish Factors: Increasing institutional interest, expanding Layer-2 ecosystems, and steady network activity support long-term growth.
⚡ Network Strength: Ethereum remains the leading smart-contract platform, hosting thousands of decentralized applications.
💰 Staking Demand: ETH staking continues to reduce circulating supply, which can support prices during periods of strong demand.
⚠️ Risks: Market volatility, regulatory developments, and competition from other blockchains could create short-term pressure.
Outlook
Ethereum's overall trend remains constructive as long as adoption and network usage continue to grow. Traders are watching key support and resistance levels closely, while long-term investors remain focused on Ethereum's role as the backbone of the decentralized economy.
Market Sentiment: 🟢 Moderately Bullish (Long-Term) | 🟡 Neutral to Bullish (Short-Term)#VanceSeesNoEvidenceOfHormuzClosure #VanceSeesNoEvidenceOfHormuzClosure
48
·
--
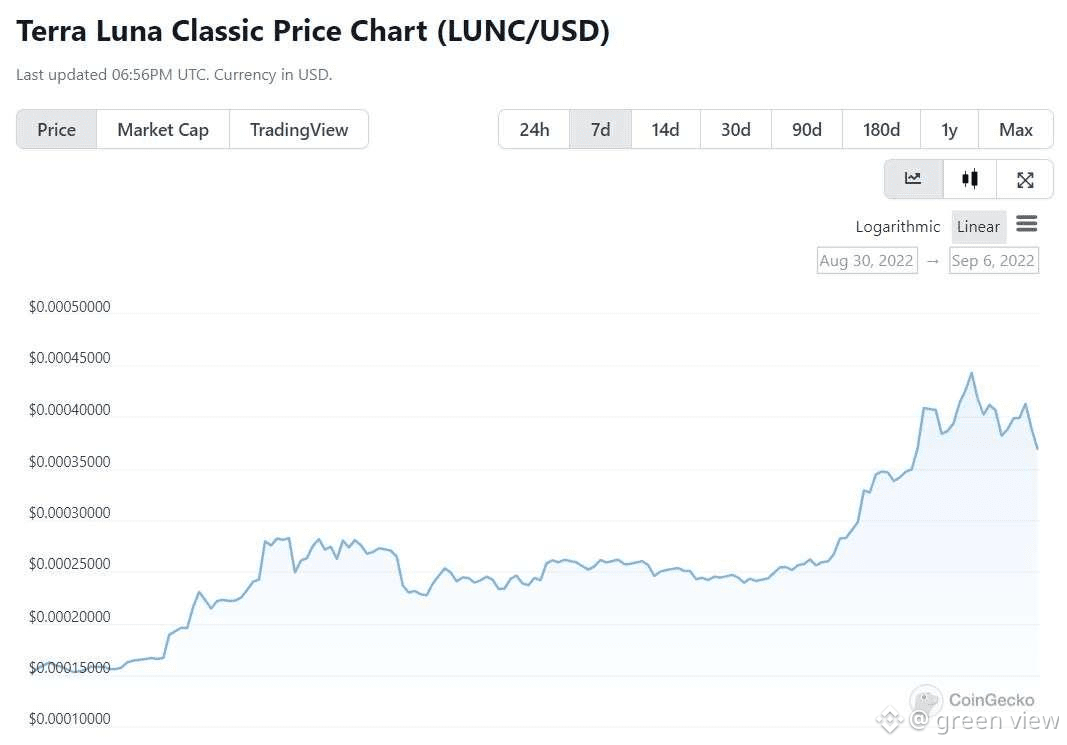
$LUNC (Terra Luna Classic) bleibt eine hochspekulative Kryptowährung, die größtenteils von der Community-Unterstützung, Token-Burning-Initiativen und dem allgemeinen Marktsentiment getragen wird. Während das Projekt weiterhin Anstrengungen unternimmt, um das zirkulierende Angebot zu reduzieren, wurde das Preiswachstum durch die enorme Anzahl an Tokens, die noch im Umlauf sind, begrenzt. Aktuelle Aussichten: ✅ Starke und aktive Community-Unterstützung. ✅ Laufende Token-Burns helfen, langfristige Knappheit zu unterstützen. ⚠️ Begrenztes Ökosystemwachstum im Vergleich zu großen Layer-1-Netzwerken. ⚠️ Hohe Volatilität macht LUNC zu einer risikobehafteten Investition. Technische Sicht:
LUNC handelt derzeit in einer Konsolidierungsphase, wobei Trader auf einen Ausbruch über wichtige Widerstandsniveaus achten. Ein anhaltender Krypto-Marktrally könnte LUNC helfen, Momentum zu gewinnen, aber Investoren sollten mit starken Preisschwankungen rechnen. Zusammenfassung:
LUNC bleibt ein spekulatives Spiel mit Potenzial nach oben, wenn die Burn-Programme fortgesetzt werden und das Marktsentiment sich verbessert, aber es birgt erheblich höhere Risiken als etablierte Kryptowährungen wie Bitcoin und Ethereum. jetzt geht es nach oben
{spot}(LUNCUSDT)
$LUNC (Terra Luna Classic) bleibt eine hochspekulative Kryptowährung, die größtenteils von der Community-Unterstützung, Token-Burning-Initiativen und dem allgemeinen Marktsentiment getragen wird. Während das Projekt weiterhin Anstrengungen unternimmt, um das zirkulierende Angebot zu reduzieren, wurde das Preiswachstum durch die enorme Anzahl an Tokens, die noch im Umlauf sind, begrenzt. Aktuelle Aussichten: ✅ Starke und aktive Community-Unterstützung. ✅ Laufende Token-Burns helfen, langfristige Knappheit zu unterstützen. ⚠️ Begrenztes Ökosystemwachstum im Vergleich zu großen Layer-1-Netzwerken. ⚠️ Hohe Volatilität macht LUNC zu einer risikobehafteten Investition. Technische Sicht:
LUNC handelt derzeit in einer Konsolidierungsphase, wobei Trader auf einen Ausbruch über wichtige Widerstandsniveaus achten. Ein anhaltender Krypto-Marktrally könnte LUNC helfen, Momentum zu gewinnen, aber Investoren sollten mit starken Preisschwankungen rechnen. Zusammenfassung:
LUNC bleibt ein spekulatives Spiel mit Potenzial nach oben, wenn die Burn-Programme fortgesetzt werden und das Marktsentiment sich verbessert, aber es birgt erheblich höhere Risiken als etablierte Kryptowährungen wie Bitcoin und Ethereum. jetzt geht es nach oben
LUNC handelt derzeit in einer Konsolidierungsphase, wobei Trader auf einen Ausbruch über wichtige Widerstandsniveaus achten. Ein anhaltender Krypto-Marktrally könnte LUNC helfen, Momentum zu gewinnen, aber Investoren sollten mit starken Preisschwankungen rechnen. Zusammenfassung:
LUNC bleibt ein spekulatives Spiel mit Potenzial nach oben, wenn die Burn-Programme fortgesetzt werden und das Marktsentiment sich verbessert, aber es birgt erheblich höhere Risiken als etablierte Kryptowährungen wie Bitcoin und Ethereum. jetzt geht es nach oben
193
·
--
Übersetzung ansehen
$BTC
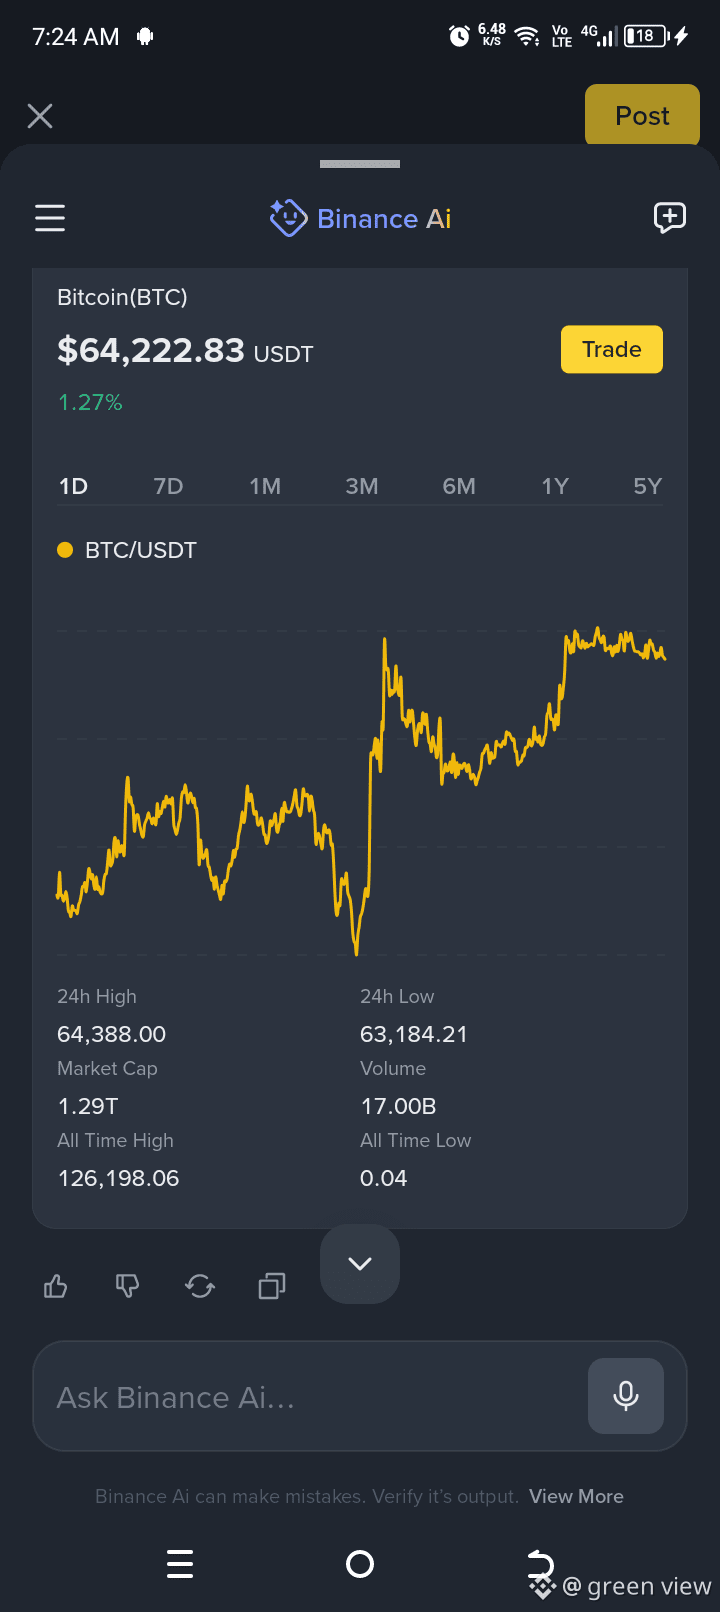
BTC is trading at 64,222.93 USDT right now, up about 1.27% over the last 24 hours.
24h open: 63,416.32 · high: 64,388.00 · low: 63,184.21
BTC is sitting close to today’s high, which suggests buyers still have some short-term
control
#IranAnnouncesStraitOfHormuzClosure #IraqOrders5OilFieldsToBoostOutput
{spot}(BTCUSDT)
$BTC
BTC is trading at 64,222.93 USDT right now, up about 1.27% over the last 24 hours.
24h open: 63,416.32 · high: 64,388.00 · low: 63,184.21
BTC is sitting close to today’s high, which suggests buyers still have some short-term
control
#IranAnnouncesStraitOfHormuzClosure #IraqOrders5OilFieldsToBoostOutput
BTC is trading at 64,222.93 USDT right now, up about 1.27% over the last 24 hours.
24h open: 63,416.32 · high: 64,388.00 · low: 63,184.21
BTC is sitting close to today’s high, which suggests buyers still have some short-term
control
#IranAnnouncesStraitOfHormuzClosure #IraqOrders5OilFieldsToBoostOutput
79
·
--
Übersetzung ansehen
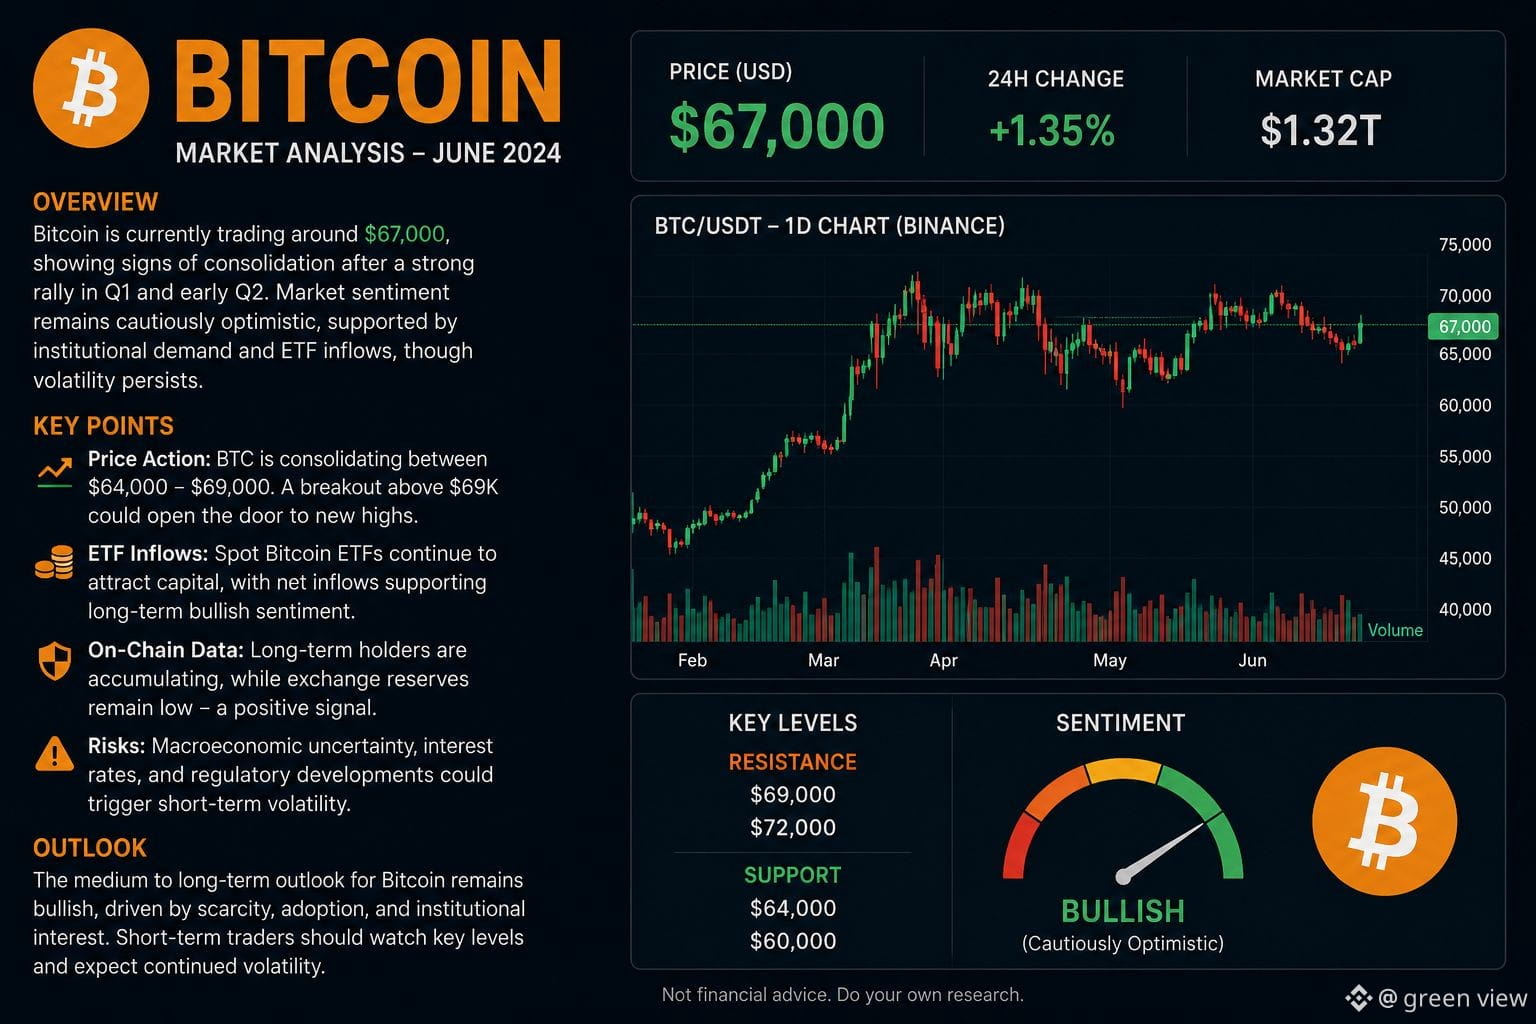
$BTC HAS HONESTLY VERY RISKY MOMENT
{spot}(BTCUSDT)
$BTC HAS HONESTLY VERY RISKY MOMENT
21
·
--
Übersetzung ansehen
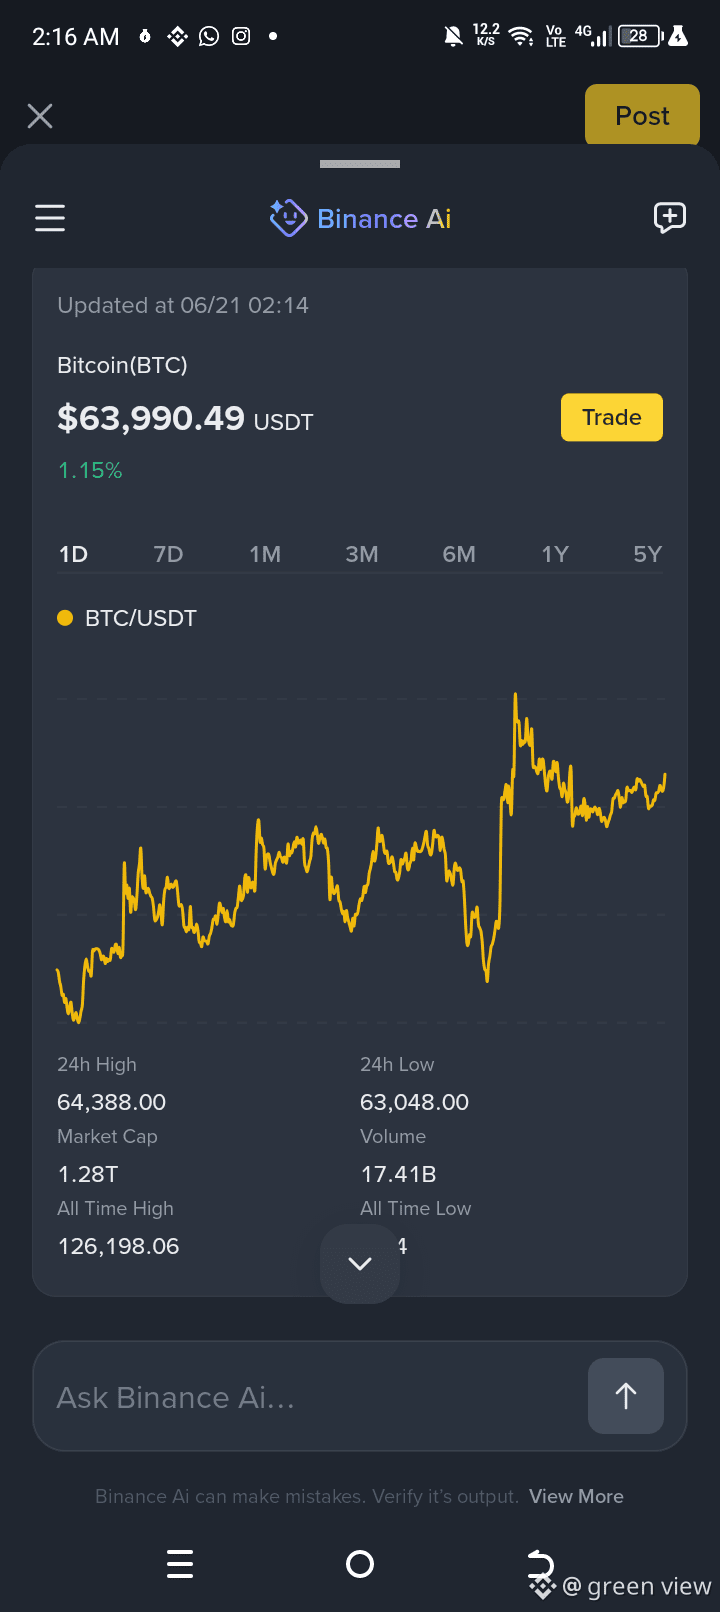
$BTC BTC is trading at $63,926.02 right now on Binance, up about 1.1% over the last 24 hours. The 24h range is $63,048.00 to $64,388.00, with the session opening around $63,205.44.
A quick read: BTC looks relatively steady today, holding above $63k with a modest positive move. If you want, I can also break this into bullish/bearish levels, support/resistance, or a short-term trading view.
{spot}(BTCUSDT)
#IranAnnouncesStraitOfHormuzClosure #USHouseToHostDigitalFinanceRoundtable #IranAnnouncesStraitOfHormuzClosure
$BTC BTC is trading at $63,926.02 right now on Binance, up about 1.1% over the last 24 hours. The 24h range is $63,048.00 to $64,388.00, with the session opening around $63,205.44.
A quick read: BTC looks relatively steady today, holding above $63k with a modest positive move. If you want, I can also break this into bullish/bearish levels, support/resistance, or a short-term trading view.
#IranAnnouncesStraitOfHormuzClosure #USHouseToHostDigitalFinanceRoundtable #IranAnnouncesStraitOfHormuzClosure
A quick read: BTC looks relatively steady today, holding above $63k with a modest positive move. If you want, I can also break this into bullish/bearish levels, support/resistance, or a short-term trading view.
#IranAnnouncesStraitOfHormuzClosure #USHouseToHostDigitalFinanceRoundtable #IranAnnouncesStraitOfHormuzClosure
1
11
·
--
Übersetzung ansehen
$BTC Here’s a short latest-style analysis for TSLAB coin (often traded as a low-cap/high-volatility token in speculative crypto segments). If you meant a specific exchange listing, tell me and I can refine it.
📊 TSLAB Coin – Latest Market Snapshot
TSLAB is currently behaving like a high-volatility speculative asset, with price action mainly driven by short-term traders rather than long-term holders. The market structure shows rapid spikes followed by sharp retracements, which is typical for low-liquidity tokens.
Key behavior right now:
Strong intraday volatility (fast pumps and corrections)
Thin liquidity → price easily moved by large orders
Sentiment-driven trading (news/social hype > fundamentals)
📈 Price Action & Trend Outlook
Short-term trend: sideways with sudden breakout attempts
Momentum: weak follow-through after spikes
Resistance zones: repeated rejection at recent highs
Support: holding only temporarily during sell pressure drops
Overall, the structure suggests distribution phase behavior, where traders are taking profits quickly.
🧠 Market Sentiment View
Retail interest is spiky and emotional
Social buzz is the main driver (not fundamentals)
Fear/greed cycles are very short-lived
Traders are mostly scalping rather than investing
🔮 Short-Term Outlook
Bull case: If volume increases steadily, TSLAB could attempt another breakout leg
Bear case: Low liquidity + profit-taking could push it into a slow bleed
Most likely: continued range-bound volatility with fake breakouts
{spot}(TSLABUSDT)
#BitcoinNetworkActivityNearAllTimeHigh #USHouseToHostDigitalFinanceRoundtable
$BTC Here’s a short latest-style analysis for TSLAB coin (often traded as a low-cap/high-volatility token in speculative crypto segments). If you meant a specific exchange listing, tell me and I can refine it.
📊 TSLAB Coin – Latest Market Snapshot
TSLAB is currently behaving like a high-volatility speculative asset, with price action mainly driven by short-term traders rather than long-term holders. The market structure shows rapid spikes followed by sharp retracements, which is typical for low-liquidity tokens.
Key behavior right now:
Strong intraday volatility (fast pumps and corrections)
Thin liquidity → price easily moved by large orders
Sentiment-driven trading (news/social hype > fundamentals)
📈 Price Action & Trend Outlook
Short-term trend: sideways with sudden breakout attempts
Momentum: weak follow-through after spikes
Resistance zones: repeated rejection at recent highs
Support: holding only temporarily during sell pressure drops
Overall, the structure suggests distribution phase behavior, where traders are taking profits quickly.
🧠 Market Sentiment View
Retail interest is spiky and emotional
Social buzz is the main driver (not fundamentals)
Fear/greed cycles are very short-lived
Traders are mostly scalping rather than investing
🔮 Short-Term Outlook
Bull case: If volume increases steadily, TSLAB could attempt another breakout leg
Bear case: Low liquidity + profit-taking could push it into a slow bleed
Most likely: continued range-bound volatility with fake breakouts
#BitcoinNetworkActivityNearAllTimeHigh #USHouseToHostDigitalFinanceRoundtable
📊 TSLAB Coin – Latest Market Snapshot
TSLAB is currently behaving like a high-volatility speculative asset, with price action mainly driven by short-term traders rather than long-term holders. The market structure shows rapid spikes followed by sharp retracements, which is typical for low-liquidity tokens.
Key behavior right now:
Strong intraday volatility (fast pumps and corrections)
Thin liquidity → price easily moved by large orders
Sentiment-driven trading (news/social hype > fundamentals)
📈 Price Action & Trend Outlook
Short-term trend: sideways with sudden breakout attempts
Momentum: weak follow-through after spikes
Resistance zones: repeated rejection at recent highs
Support: holding only temporarily during sell pressure drops
Overall, the structure suggests distribution phase behavior, where traders are taking profits quickly.
🧠 Market Sentiment View
Retail interest is spiky and emotional
Social buzz is the main driver (not fundamentals)
Fear/greed cycles are very short-lived
Traders are mostly scalping rather than investing
🔮 Short-Term Outlook
Bull case: If volume increases steadily, TSLAB could attempt another breakout leg
Bear case: Low liquidity + profit-taking could push it into a slow bleed
Most likely: continued range-bound volatility with fake breakouts
#BitcoinNetworkActivityNearAllTimeHigh #USHouseToHostDigitalFinanceRoundtable
35
·
--
Übersetzung ansehen
Bitcoin ETF News Summary
$BTC
Bitcoin ETF outflows have fallen sharply compared to previous weeks, which means selling pressure from institutional investors is decreasing. This is a positive sign for Bitcoin because it suggests investors are becoming less eager to sell.
However, ETFs are still seeing net outflows, so money is still leaving Bitcoin investment products overall. Therefore, it is too early to say that institutions have turned bullish again.
Bottom line: The news is moderately bullish. Reduced ETF outflows show improving sentiment, but a true bullish trend would require ETF inflows (more money entering than leaving) and continued Bitcoin price strength. 📈🟠
{spot}(BTCUSDT)
#THORChainRecoveryEntersFinalPhase #USHouseToHostDigitalFinanceRoundtable
Bitcoin ETF News Summary
$BTC
Bitcoin ETF outflows have fallen sharply compared to previous weeks, which means selling pressure from institutional investors is decreasing. This is a positive sign for Bitcoin because it suggests investors are becoming less eager to sell.
However, ETFs are still seeing net outflows, so money is still leaving Bitcoin investment products overall. Therefore, it is too early to say that institutions have turned bullish again.
Bottom line: The news is moderately bullish. Reduced ETF outflows show improving sentiment, but a true bullish trend would require ETF inflows (more money entering than leaving) and continued Bitcoin price strength. 📈🟠
#THORChainRecoveryEntersFinalPhase #USHouseToHostDigitalFinanceRoundtable
$BTC
Bitcoin ETF outflows have fallen sharply compared to previous weeks, which means selling pressure from institutional investors is decreasing. This is a positive sign for Bitcoin because it suggests investors are becoming less eager to sell.
However, ETFs are still seeing net outflows, so money is still leaving Bitcoin investment products overall. Therefore, it is too early to say that institutions have turned bullish again.
Bottom line: The news is moderately bullish. Reduced ETF outflows show improving sentiment, but a true bullish trend would require ETF inflows (more money entering than leaving) and continued Bitcoin price strength. 📈🟠
#THORChainRecoveryEntersFinalPhase #USHouseToHostDigitalFinanceRoundtable
49
·
--
Ethereum$BTC (ETH) Heute – 21. Juni 2026
Kurze Analyse
Ethereum handelt heute etwa bei 1.700–1.775 US-Dollar und zeigt Anzeichen einer Stabilisierung nach einer volatilen Phase zu Beginn dieses Monats. Aktuelle Marktdaten deuten darauf hin, dass ETH sich von seinen Juni-Tiefs nahe 1.550 US-Dollar erholt hat und versucht, Unterstützung oberhalb der 1.700-US-Dollar-Marke aufzubauen.
📈 Bullische Faktoren
Starke Entwickleraktivität und das anhaltende Wachstum des Ethereum-DeFi- und Layer-2-Ökosystems stützen die langfristige Nachfrage.
ETH bleibt die führende Smart-Contract-Blockchain und behauptet eine dominante Position bei dezentralen Anwendungen sowie beim Staking.
⚠️ Risiken
Die institutionellen Zuflüsse sind gemischt: Einige Berichte über ETF-bedingte Abflüsse belasten die Stimmung.
Schwäche im breiteren Krypto-Markt und makroökonomische Unsicherheit könnten das Aufwärtspotenzial begrenzen.
Technische Prognose
Widerstand: 1.800 ▲ │ Aktuell: 1.730 │ ▼ Unterstützung: 1.650
Fazit: Ethereum scheint sich in einer Erholungsphase zu befinden. Ein Ausbruch über 1.800 US-Dollar könnte den bullischen Schwung verstärken, während ein Rückgang unter 1.650 US-Dollar zu erneutem Verkaufsdruck führen kann. Vorerst ist der Trend vorsichtig positiv, bleibt jedoch von der allgemeinen Krypto-Marktsentiments abhängig. #THORChainRecoveryEntersFinalPhase #BitcoinNetworkActivityNearAllTimeHigh #USHouseToHostDigitalFinanceRoundtable
{spot}(ETHUSDT)
Widerstand: 1.800
▲
│
Aktuell: 1.730
│
▼
Unterstützung: 1.650
Ethereum$BTC (ETH) Heute – 21. Juni 2026
Kurze Analyse
Ethereum handelt heute etwa bei 1.700–1.775 US-Dollar und zeigt Anzeichen einer Stabilisierung nach einer volatilen Phase zu Beginn dieses Monats. Aktuelle Marktdaten deuten darauf hin, dass ETH sich von seinen Juni-Tiefs nahe 1.550 US-Dollar erholt hat und versucht, Unterstützung oberhalb der 1.700-US-Dollar-Marke aufzubauen.
📈 Bullische Faktoren
Starke Entwickleraktivität und das anhaltende Wachstum des Ethereum-DeFi- und Layer-2-Ökosystems stützen die langfristige Nachfrage.
ETH bleibt die führende Smart-Contract-Blockchain und behauptet eine dominante Position bei dezentralen Anwendungen sowie beim Staking.
⚠️ Risiken
Die institutionellen Zuflüsse sind gemischt: Einige Berichte über ETF-bedingte Abflüsse belasten die Stimmung.
Schwäche im breiteren Krypto-Markt und makroökonomische Unsicherheit könnten das Aufwärtspotenzial begrenzen.
Technische Prognose
Widerstand: 1.800 ▲ │ Aktuell: 1.730 │ ▼ Unterstützung: 1.650
Fazit: Ethereum scheint sich in einer Erholungsphase zu befinden. Ein Ausbruch über 1.800 US-Dollar könnte den bullischen Schwung verstärken, während ein Rückgang unter 1.650 US-Dollar zu erneutem Verkaufsdruck führen kann. Vorerst ist der Trend vorsichtig positiv, bleibt jedoch von der allgemeinen Krypto-Marktsentiments abhängig. #THORChainRecoveryEntersFinalPhase #BitcoinNetworkActivityNearAllTimeHigh #USHouseToHostDigitalFinanceRoundtable
Widerstand: 1.800
▲
│
Aktuell: 1.730
│
▼
Unterstützung: 1.650
Kurze Analyse
Ethereum handelt heute etwa bei 1.700–1.775 US-Dollar und zeigt Anzeichen einer Stabilisierung nach einer volatilen Phase zu Beginn dieses Monats. Aktuelle Marktdaten deuten darauf hin, dass ETH sich von seinen Juni-Tiefs nahe 1.550 US-Dollar erholt hat und versucht, Unterstützung oberhalb der 1.700-US-Dollar-Marke aufzubauen.
📈 Bullische Faktoren
Starke Entwickleraktivität und das anhaltende Wachstum des Ethereum-DeFi- und Layer-2-Ökosystems stützen die langfristige Nachfrage.
ETH bleibt die führende Smart-Contract-Blockchain und behauptet eine dominante Position bei dezentralen Anwendungen sowie beim Staking.
⚠️ Risiken
Die institutionellen Zuflüsse sind gemischt: Einige Berichte über ETF-bedingte Abflüsse belasten die Stimmung.
Schwäche im breiteren Krypto-Markt und makroökonomische Unsicherheit könnten das Aufwärtspotenzial begrenzen.
Technische Prognose
Widerstand: 1.800 ▲ │ Aktuell: 1.730 │ ▼ Unterstützung: 1.650
Fazit: Ethereum scheint sich in einer Erholungsphase zu befinden. Ein Ausbruch über 1.800 US-Dollar könnte den bullischen Schwung verstärken, während ein Rückgang unter 1.650 US-Dollar zu erneutem Verkaufsdruck führen kann. Vorerst ist der Trend vorsichtig positiv, bleibt jedoch von der allgemeinen Krypto-Marktsentiments abhängig. #THORChainRecoveryEntersFinalPhase #BitcoinNetworkActivityNearAllTimeHigh #USHouseToHostDigitalFinanceRoundtable
Widerstand: 1.800
▲
│
Aktuell: 1.730
│
▼
Unterstützung: 1.650
30
·
--
Übersetzung ansehen
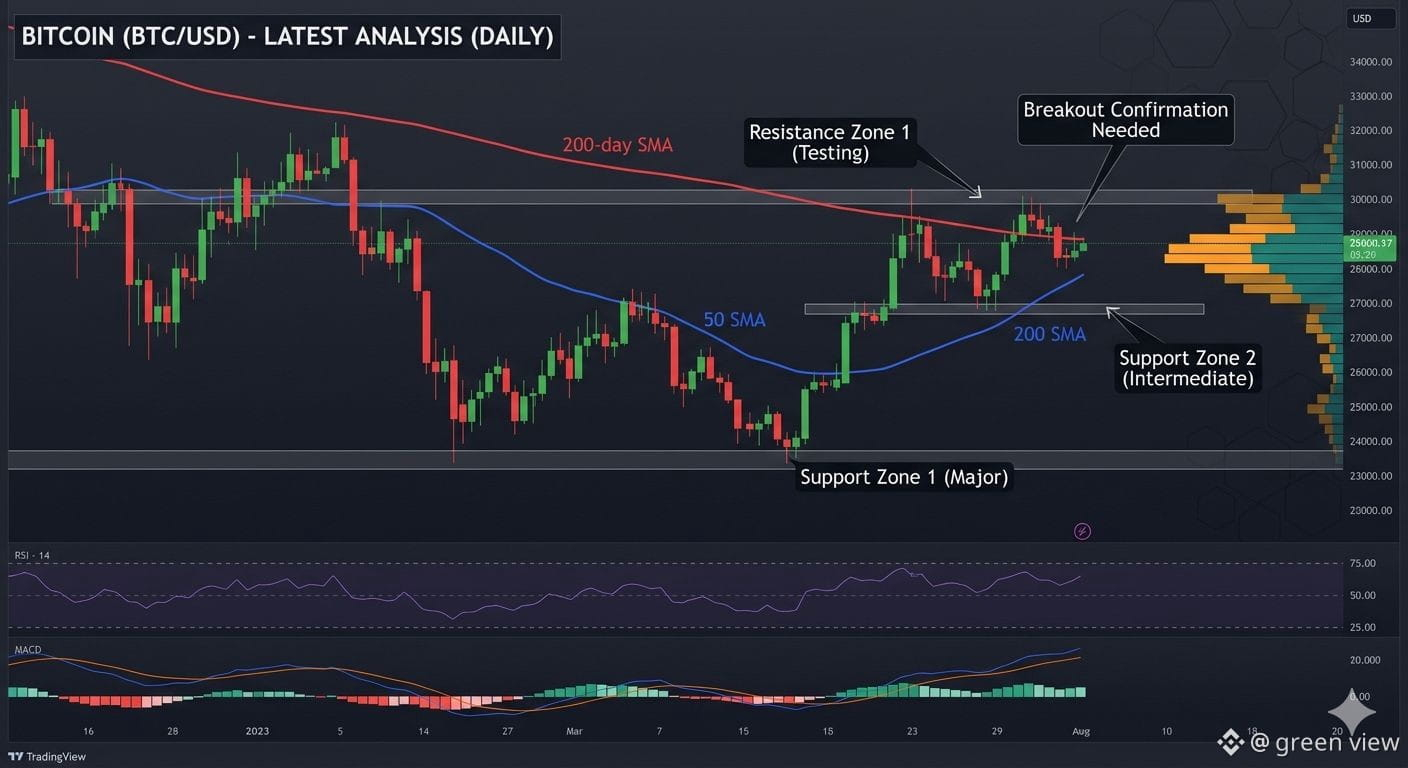
$BTC Current Market Snapshot Bitcoin is trading around $63,000–$64,000 on 20 June 2026 after recovering from recent lows near $60,000. The market remains volatile but has shown resilience despite macroeconomic pressure and higher interest-rate expectations. Technical Outlook Support: $62,000–$63,000 Major Support: $60,000 Resistance: $66,000–$67,000 Stronger Resistance: $70,000+ Bitcoin is currently consolidating after a significant correction from its 2025 all-time high above $126,000. Technical indicators suggest a neutral-to-slightly bearish short-term trend, while the longer-term structure remains constructive if BTC stays above key moving averages. Bullish Factors ✅ Continued institutional interest and ETF inflows support demand.
✅ Bitcoin has maintained the $60k area despite global market uncertainty.
✅ Liquidity analysis indicates large investors are accumulating at lower levels. Bearish Risks ⚠️ Hawkish U.S. Federal Reserve policy could pressure risk assets.
⚠️ Recent ETF outflows and profit-taking by some large holders remain concerns.
⚠️ Failure to hold $60,000 could trigger another wave of selling. Short-Term Forecast If Bitcoin breaks above $66,000, momentum could carry it toward $70,000–$75,000. However, a drop below $60,000 would likely expose the market to further downside. Current price action suggests consolidation rather than a strong trend in either direction. Conclusion Bitcoin remains in a recovery phase after a major correction. The long-term outlook is still positive due to institutional adoption and scarcity, but traders should expect continued volatility in the coming weeks. For now, the $60k support and $66k resistance levels are the most important zones to watch.
{spot}(BTCUSDT)
$BTC Current Market Snapshot Bitcoin is trading around $63,000–$64,000 on 20 June 2026 after recovering from recent lows near $60,000. The market remains volatile but has shown resilience despite macroeconomic pressure and higher interest-rate expectations. Technical Outlook Support: $62,000–$63,000 Major Support: $60,000 Resistance: $66,000–$67,000 Stronger Resistance: $70,000+ Bitcoin is currently consolidating after a significant correction from its 2025 all-time high above $126,000. Technical indicators suggest a neutral-to-slightly bearish short-term trend, while the longer-term structure remains constructive if BTC stays above key moving averages. Bullish Factors ✅ Continued institutional interest and ETF inflows support demand.
✅ Bitcoin has maintained the $60k area despite global market uncertainty.
✅ Liquidity analysis indicates large investors are accumulating at lower levels. Bearish Risks ⚠️ Hawkish U.S. Federal Reserve policy could pressure risk assets.
⚠️ Recent ETF outflows and profit-taking by some large holders remain concerns.
⚠️ Failure to hold $60,000 could trigger another wave of selling. Short-Term Forecast If Bitcoin breaks above $66,000, momentum could carry it toward $70,000–$75,000. However, a drop below $60,000 would likely expose the market to further downside. Current price action suggests consolidation rather than a strong trend in either direction. Conclusion Bitcoin remains in a recovery phase after a major correction. The long-term outlook is still positive due to institutional adoption and scarcity, but traders should expect continued volatility in the coming weeks. For now, the $60k support and $66k resistance levels are the most important zones to watch.
✅ Bitcoin has maintained the $60k area despite global market uncertainty.
✅ Liquidity analysis indicates large investors are accumulating at lower levels. Bearish Risks ⚠️ Hawkish U.S. Federal Reserve policy could pressure risk assets.
⚠️ Recent ETF outflows and profit-taking by some large holders remain concerns.
⚠️ Failure to hold $60,000 could trigger another wave of selling. Short-Term Forecast If Bitcoin breaks above $66,000, momentum could carry it toward $70,000–$75,000. However, a drop below $60,000 would likely expose the market to further downside. Current price action suggests consolidation rather than a strong trend in either direction. Conclusion Bitcoin remains in a recovery phase after a major correction. The long-term outlook is still positive due to institutional adoption and scarcity, but traders should expect continued volatility in the coming weeks. For now, the $60k support and $66k resistance levels are the most important zones to watch.
53
·
--
Übersetzung ansehen
$BTC Bitcoin (BTC) Analysis — 20 June 2026 Bitcoin is trading around $63,500–$63,600, showing signs of stabilization after the sharp volatility seen earlier this month. Institutional demand and ETF inflows are helping support the market, while traders remain cautious near key resistance levels. Key Levels Support: $62,000 Current Price: ~$63,550 Resistance: $65,000–$66,000 Trend: Neutral to slightly bullish if BTC stays above $62,000. Market Sentiment ETF inflows and institutional buying remain positive for Bitcoin. Technical indicators suggest consolidation rather than a strong breakout. A move above $66,000 could trigger renewed bullish momentum, while a break below $62,000 may lead to further downside pressure. Price Graph (Illustrative) Bitcoin recent price trendIllustrative BTC price movement around June 2026 based on reported market levels.$61.5K$63K$64.5K$66K$67.5KJun 16Jun 17Jun 18Jun 19Jun 20 Short Outlook: Bitcoin remains in a consolidation zone. Holding above $62k favors a recovery toward $66k, while failure to hold support could retest lower levels.
$BTC Bitcoin (BTC) Analysis — 20 June 2026 Bitcoin is trading around $63,500–$63,600, showing signs of stabilization after the sharp volatility seen earlier this month. Institutional demand and ETF inflows are helping support the market, while traders remain cautious near key resistance levels. Key Levels Support: $62,000 Current Price: ~$63,550 Resistance: $65,000–$66,000 Trend: Neutral to slightly bullish if BTC stays above $62,000. Market Sentiment ETF inflows and institutional buying remain positive for Bitcoin. Technical indicators suggest consolidation rather than a strong breakout. A move above $66,000 could trigger renewed bullish momentum, while a break below $62,000 may lead to further downside pressure. Price Graph (Illustrative) Bitcoin recent price trendIllustrative BTC price movement around June 2026 based on reported market levels.$61.5K$63K$64.5K$66K$67.5KJun 16Jun 17Jun 18Jun 19Jun 20 Short Outlook: Bitcoin remains in a consolidation zone. Holding above $62k favors a recovery toward $66k, while failure to hold support could retest lower levels.
64
·
--
Übersetzung ansehen
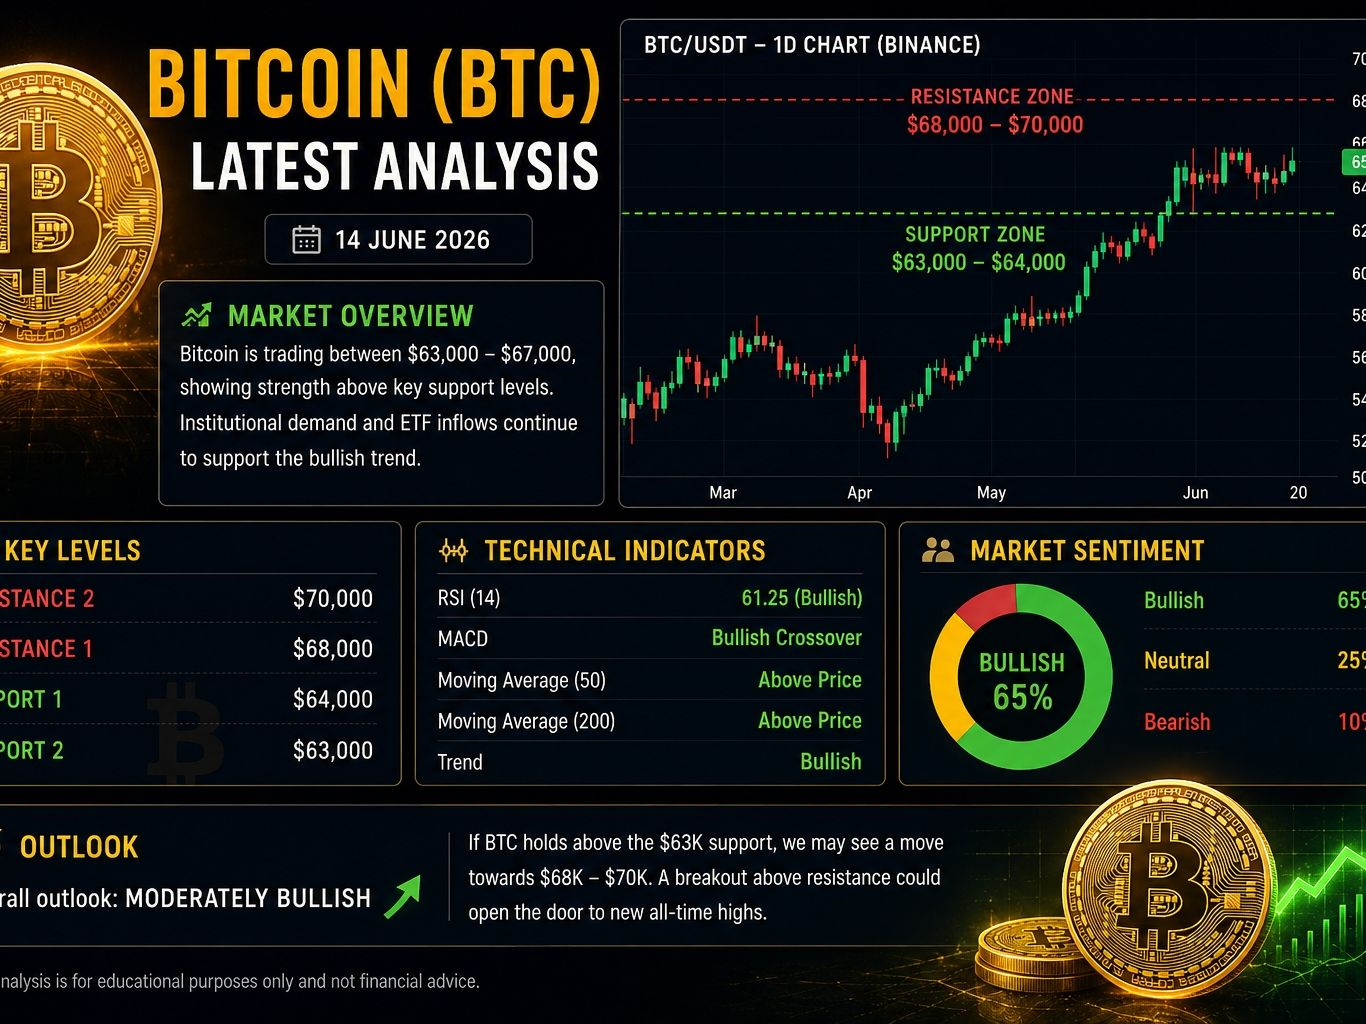
Bitcoin (BTC) Latest Analysis – June 2026
Market Overview
Bitcoin has remained relatively strong despite recent market volatility. BTC has been trading in the $63,000–$67,000 range, supported by continued institutional interest and steady ETF inflows. Recent geopolitical developments also boosted investor sentiment, helping Bitcoin recover from lower levels seen earlier this month. �
The Economic Times +1
Technical Analysis
Bullish Trend: Bitcoin recently broke above the important $65,000 resistance zone, a positive technical signal. �
TrendXBit +1
Key Support: $63,000–$64,000
Key Resistance: $68,000–$70,000
If BTC stays above support, buyers may attempt another move toward the $70,000 area. A break below support could trigger a correction toward $60,000. �
CoinMarketCap +1
Market Sentiment
Institutional buying and Bitcoin ETF demand continue to provide long-term support. However, traders should remain cautious because short-term indicators suggest occasional pullbacks are still possible. �
The Economic Times +1
Conclusion
Overall outlook: Moderately Bullish 📈
Bitcoin's long-term trend remains positive, but traders should watch the $63K support and $68K–$70K resistance levels closely. A successful breakout above resistance could signal further upside, while losing support may lead to a short-term correction. �
TrendXBit +1
*This analysis is for educational purposes only and not financial advice.*
{spot}(BTCUSDT)
Bitcoin (BTC) Latest Analysis – June 2026
Market Overview
Bitcoin has remained relatively strong despite recent market volatility. BTC has been trading in the $63,000–$67,000 range, supported by continued institutional interest and steady ETF inflows. Recent geopolitical developments also boosted investor sentiment, helping Bitcoin recover from lower levels seen earlier this month. �
The Economic Times +1
Technical Analysis
Bullish Trend: Bitcoin recently broke above the important $65,000 resistance zone, a positive technical signal. �
TrendXBit +1
Key Support: $63,000–$64,000
Key Resistance: $68,000–$70,000
If BTC stays above support, buyers may attempt another move toward the $70,000 area. A break below support could trigger a correction toward $60,000. �
CoinMarketCap +1
Market Sentiment
Institutional buying and Bitcoin ETF demand continue to provide long-term support. However, traders should remain cautious because short-term indicators suggest occasional pullbacks are still possible. �
The Economic Times +1
Conclusion
Overall outlook: Moderately Bullish 📈
Bitcoin's long-term trend remains positive, but traders should watch the $63K support and $68K–$70K resistance levels closely. A successful breakout above resistance could signal further upside, while losing support may lead to a short-term correction. �
TrendXBit +1
*This analysis is for educational purposes only and not financial advice.*
Market Overview
Bitcoin has remained relatively strong despite recent market volatility. BTC has been trading in the $63,000–$67,000 range, supported by continued institutional interest and steady ETF inflows. Recent geopolitical developments also boosted investor sentiment, helping Bitcoin recover from lower levels seen earlier this month. �
The Economic Times +1
Technical Analysis
Bullish Trend: Bitcoin recently broke above the important $65,000 resistance zone, a positive technical signal. �
TrendXBit +1
Key Support: $63,000–$64,000
Key Resistance: $68,000–$70,000
If BTC stays above support, buyers may attempt another move toward the $70,000 area. A break below support could trigger a correction toward $60,000. �
CoinMarketCap +1
Market Sentiment
Institutional buying and Bitcoin ETF demand continue to provide long-term support. However, traders should remain cautious because short-term indicators suggest occasional pullbacks are still possible. �
The Economic Times +1
Conclusion
Overall outlook: Moderately Bullish 📈
Bitcoin's long-term trend remains positive, but traders should watch the $63K support and $68K–$70K resistance levels closely. A successful breakout above resistance could signal further upside, while losing support may lead to a short-term correction. �
TrendXBit +1
*This analysis is for educational purposes only and not financial advice.*
77
Anmelden und weiter Inhalte entdecken
Krypto-Nutzer weltweit auf Binance Square kennenlernen
⚡️ Bleib in Sachen Krypto stets am Puls.
💬 Die weltgrößte Kryptobörse vertraut darauf.
👍 Erhalte verlässliche Einblicke von verifizierten Creators.
E-Mail-Adresse/Telefonnummer
Trendthemen
BOJRaisesRatesTo31YearHigh
134,447 Aufrufe
2,102 Kommentare
#BOJRaisesRatesTo31YearHigh
#BOJRaisesRatesTo31YearHigh 🇯🇵📈
Die Bank of Japan hat einen weiteren großen Schritt unternommen, indem sie die Zinsen auf ihr höchstes Niveau seit 31 Jahren angehoben hat und damit die globalen Märkte in Alarmbereitschaft versetzt. Die Maßnahme signalisiert eine fortgesetzte Abkehr von Japans langjähriger ultralockerer Geldpolitik. Höhere japanische Zinsen könnten den Yen stärken, die globalen Renditen beeinflussen und möglicherweise Kapitalströme über die Finanzmärkte hinweg auswirken. Auch Krypto- und andere risikoreiche Assets könnten reagieren, da Anleger die Liquidität und das Risikoprofil neu bewerten. Trader beobachten nun die nächsten Aussagen der BOJ genau auf Hinweise für künftige Zinsentscheidungen. Die Volatilität könnte zunehmen, während die Märkte die geldpolitische Änderung und ihre potenzielle globale Wirkung verdauen. #BOJ #Japan #Crypto #Märkte #InterestRates $NVDAB
maqsoodahmed1
·1 Likes
·170 Aufrufe
BuffettStepsDownAsBerkshireChairman
63,857 Aufrufe
1,053 Kommentare
XRPExchangeReservesHitSevenYearLow
68,874 Aufrufe
972 Kommentare