

SmartWin_Crypto
30 Beiträge

SmartWin_Crypto
Melden
Nutzer blockieren
13 Following
2 Follower
2 Like gegeben
Beiträge
Übersetzung ansehen
If you want to tailor the text accompanying this visual for a specific platform, could you let me know:
Your target platform? (e.g., X/Twitter, LinkedIn, Binance Square)The desired tone? (e.g., analytical and technical, dramatic headline, or casual trader style)Any specific crypto or stock tickers you want to explicitly tag?
I can draft a high-engagement post to match your chosen style.
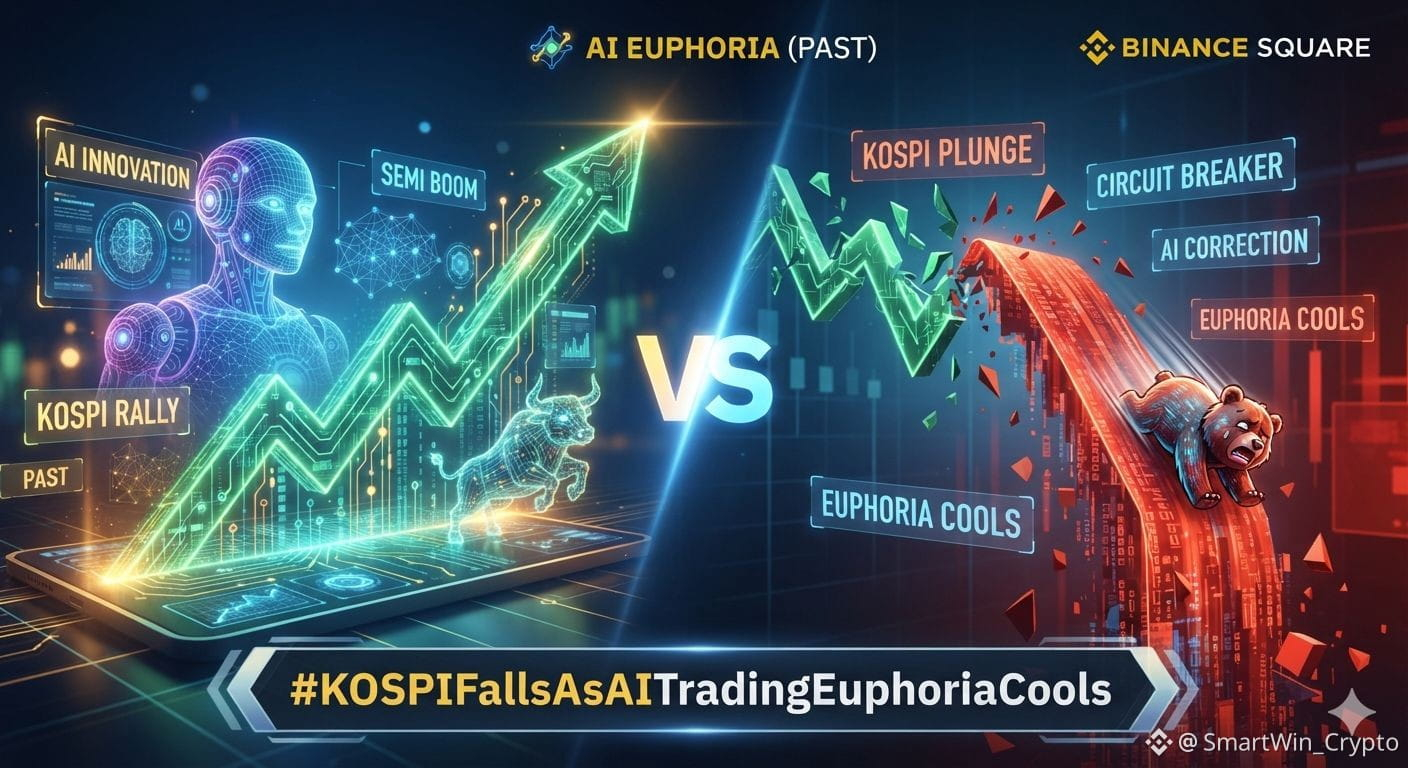
[https://www.binance.com/square/hashtag/kospifallsasaitradingeuphoriacools](https://www.binance.com/square/hashtag/kospifallsasaitradingeuphoriacools)
If you want to tailor the text accompanying this visual for a specific platform, could you let me know:
Your target platform? (e.g., X/Twitter, LinkedIn, Binance Square)The desired tone? (e.g., analytical and technical, dramatic headline, or casual trader style)Any specific crypto or stock tickers you want to explicitly tag?
I can draft a high-engagement post to match your chosen style.
https://www.binance.com/square/hashtag/kospifallsasaitradingeuphoriacools
Your target platform? (e.g., X/Twitter, LinkedIn, Binance Square)The desired tone? (e.g., analytical and technical, dramatic headline, or casual trader style)Any specific crypto or stock tickers you want to explicitly tag?
I can draft a high-engagement post to match your chosen style.
https://www.binance.com/square/hashtag/kospifallsasaitradingeuphoriacools
74
·
--
Bullisch
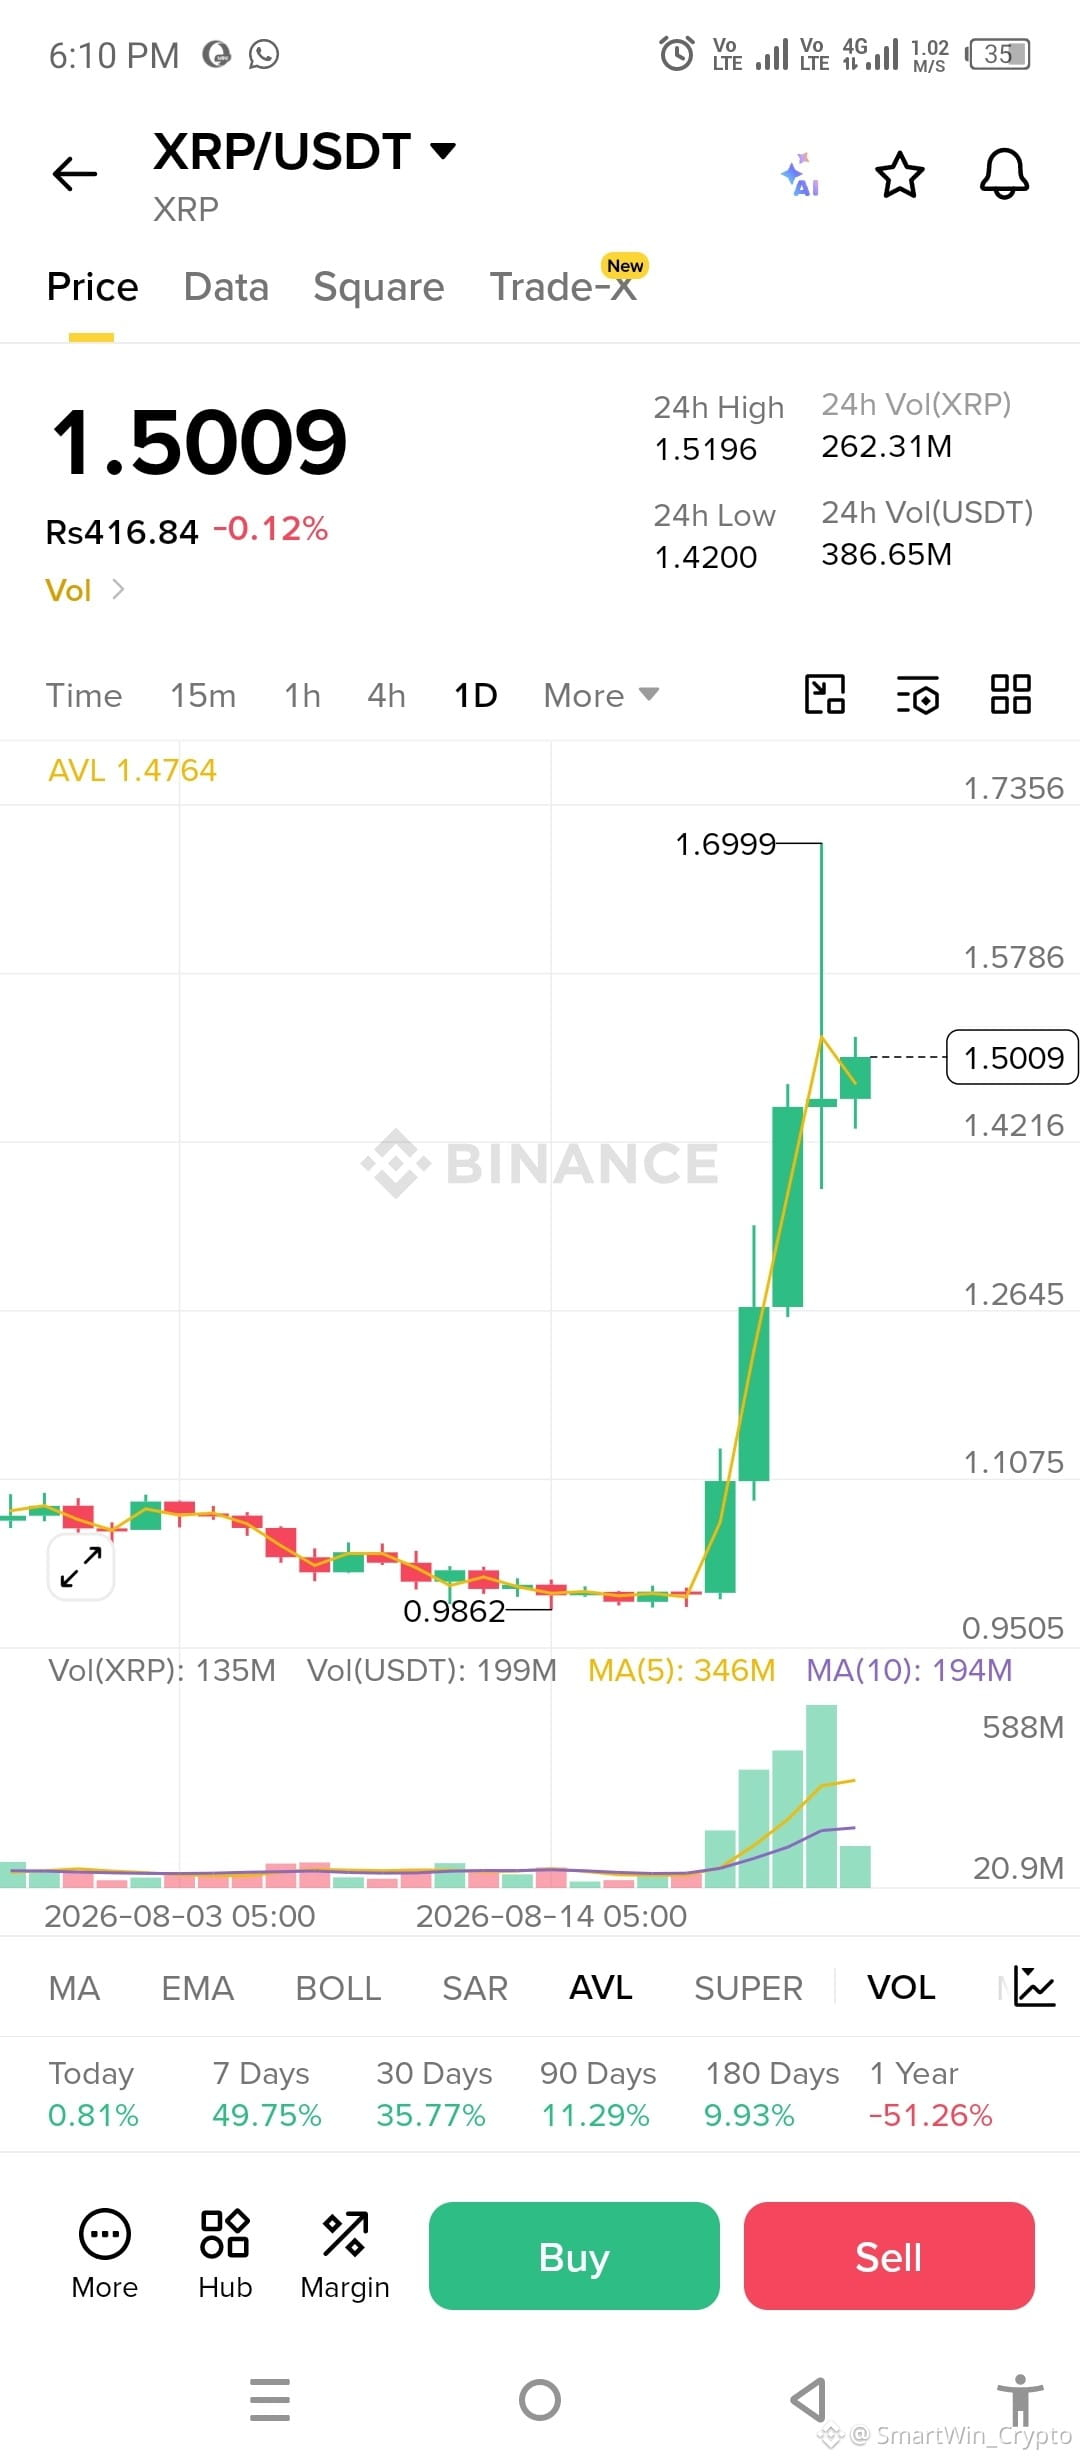
📊 $XRP /USDT Spot Setup
Einstieg: $1.45–1.50
🛑 SL: $1.39
🎯 TP1: $1.58
🎯 TP2: $1.68
Starker Ausbruch + Volumen, aber warte auf einen Rücksetzer/eine Bestätigung. Risk Management. 🤑
#Xrp🔥🔥 #crypto #SpotTrading.
HINWEIS : MACH DEINE EIGENE RECHERCHE (DYOR)
Die obige Analyse ist meine eigene Arbeit. Das ist keine Finanzberatung. Bitte mach deine eigene Recherche, bevor du investierst.
📊 $XRP /USDT Spot Setup
Einstieg: $1.45–1.50
🛑 SL: $1.39
🎯 TP1: $1.58
🎯 TP2: $1.68
Starker Ausbruch + Volumen, aber warte auf einen Rücksetzer/eine Bestätigung. Risk Management. 🤑
#Xrp🔥🔥 #crypto #SpotTrading.
HINWEIS : MACH DEINE EIGENE RECHERCHE (DYOR)
Die obige Analyse ist meine eigene Arbeit. Das ist keine Finanzberatung. Bitte mach deine eigene Recherche, bevor du investierst.
Einstieg: $1.45–1.50
🛑 SL: $1.39
🎯 TP1: $1.58
🎯 TP2: $1.68
Starker Ausbruch + Volumen, aber warte auf einen Rücksetzer/eine Bestätigung. Risk Management. 🤑
#Xrp🔥🔥 #crypto #SpotTrading.
HINWEIS : MACH DEINE EIGENE RECHERCHE (DYOR)
Die obige Analyse ist meine eigene Arbeit. Das ist keine Finanzberatung. Bitte mach deine eigene Recherche, bevor du investierst.
123
·
--
Bullisch
$BTC /USDT — Spot-Setup
🟢 Einstieg: 73.000–74.000 bei Rücksetzer/Retest
🛑 Stop-Loss: 71.800
🎯 TP1: 79.500
🎯 TP2: 82.000
🎯 TP3: 85.000
Risiko: Positionsgröße klein halten; riskiere nur ~1–2% des gesamten Trading-Kapitals.
HINWEIS: Recherchiere selbst (DYOR)
Die oben erklärte Analyse ist meine eigene Arbeit. Das ist keine Finanzberatung. Bitte mach vor einer Investition deine eigene Recherche.
#BTC #Binance
$BTC /USDT — Spot-Setup
🟢 Einstieg: 73.000–74.000 bei Rücksetzer/Retest
🛑 Stop-Loss: 71.800
🎯 TP1: 79.500
🎯 TP2: 82.000
🎯 TP3: 85.000
Risiko: Positionsgröße klein halten; riskiere nur ~1–2% des gesamten Trading-Kapitals.
HINWEIS: Recherchiere selbst (DYOR)
Die oben erklärte Analyse ist meine eigene Arbeit. Das ist keine Finanzberatung. Bitte mach vor einer Investition deine eigene Recherche.
#BTC #Binance
🟢 Einstieg: 73.000–74.000 bei Rücksetzer/Retest
🛑 Stop-Loss: 71.800
🎯 TP1: 79.500
🎯 TP2: 82.000
🎯 TP3: 85.000
Risiko: Positionsgröße klein halten; riskiere nur ~1–2% des gesamten Trading-Kapitals.
HINWEIS: Recherchiere selbst (DYOR)
Die oben erklärte Analyse ist meine eigene Arbeit. Das ist keine Finanzberatung. Bitte mach vor einer Investition deine eigene Recherche.
#BTC #Binance
85
Übersetzung ansehen
#cryptorally The popular social media trend #CryptoRally highlights strong upwards price movements across digital asset markets. Current momentum shows Bitcoin climbing back into the $64,000–$65,000 range, driven by massive institutional spot ETF inflows and multi-billion dollar whale accumulations. [1, 2, 3]
📊 Crypto Market Visuals & Indicators
📈 Current Market Drivers
ETF Inflows: Spot Bitcoin ETFs reversed previous outflow streaks with major net inflows led by institutional funds.Whale Accumulation: Large-scale buyers accumulated nearly $2.9 billion in crypto assets, ending a multi-month period of selling pressure.Regulatory Frameworks: The regulatory landscape continues to shift as agencies propose updated compliance rules for asset issuers. [3]
⚠️ Risk Notice: Despite improving prices, indices like the Crypto Fear & Greed Index remain hovering in "Fear" territory. Divergences between price jumps and cautious sentiment frequently happen before sudden pullbacks. High concentration in individual assets can lead to total capital loss if market conditions shift rapidly. [3, 4]
Are you tracking a specific cryptocurrency (like Bitcoin, Ethereum, or Altcoins), or would you like to explore technical price charts for a particular asset? [3, 5]
[1] [https://www.binance.com](https://www.binance.com/en/square/post/28621867580810)
[2] [https://www.binance.com](https://www.binance.com/en/square/post/28746643461514)
[3] [https://www.binance.com](https://www.binance.com/en/square/post/357463068844305)
[4] [https://www.binance.com](https://www.binance.com/ru-KZ/square/post/357463068844305)
[5] [https://www.binance.com](https://www.binance.com/en/square/post/357437200548850)
#cryptorally The popular social media trend #CryptoRally highlights strong upwards price movements across digital asset markets. Current momentum shows Bitcoin climbing back into the $64,000–$65,000 range, driven by massive institutional spot ETF inflows and multi-billion dollar whale accumulations. [1, 2, 3]
📊 Crypto Market Visuals & Indicators
📈 Current Market Drivers
ETF Inflows: Spot Bitcoin ETFs reversed previous outflow streaks with major net inflows led by institutional funds.Whale Accumulation: Large-scale buyers accumulated nearly $2.9 billion in crypto assets, ending a multi-month period of selling pressure.Regulatory Frameworks: The regulatory landscape continues to shift as agencies propose updated compliance rules for asset issuers. [3]
⚠️ Risk Notice: Despite improving prices, indices like the Crypto Fear & Greed Index remain hovering in "Fear" territory. Divergences between price jumps and cautious sentiment frequently happen before sudden pullbacks. High concentration in individual assets can lead to total capital loss if market conditions shift rapidly. [3, 4]
Are you tracking a specific cryptocurrency (like Bitcoin, Ethereum, or Altcoins), or would you like to explore technical price charts for a particular asset? [3, 5]
[1] https://www.binance.com
[2] https://www.binance.com
[3] https://www.binance.com
[4] https://www.binance.com
[5] https://www.binance.com
📊 Crypto Market Visuals & Indicators
📈 Current Market Drivers
ETF Inflows: Spot Bitcoin ETFs reversed previous outflow streaks with major net inflows led by institutional funds.Whale Accumulation: Large-scale buyers accumulated nearly $2.9 billion in crypto assets, ending a multi-month period of selling pressure.Regulatory Frameworks: The regulatory landscape continues to shift as agencies propose updated compliance rules for asset issuers. [3]
⚠️ Risk Notice: Despite improving prices, indices like the Crypto Fear & Greed Index remain hovering in "Fear" territory. Divergences between price jumps and cautious sentiment frequently happen before sudden pullbacks. High concentration in individual assets can lead to total capital loss if market conditions shift rapidly. [3, 4]
Are you tracking a specific cryptocurrency (like Bitcoin, Ethereum, or Altcoins), or would you like to explore technical price charts for a particular asset? [3, 5]
[1] https://www.binance.com
[2] https://www.binance.com
[3] https://www.binance.com
[4] https://www.binance.com
[5] https://www.binance.com
91
#dusk $DUSK
Dusk Network ist eine Layer-1-Blockchain, die speziell für regulierte Finanzanwendungen entwickelt wurde – mit Privatsphäre, Compliance, Sicherheit und schneller Abwicklung im Kern. Im Gegensatz zu traditionellen öffentlichen Blockchains, bei denen Transaktionsdaten offen sichtbar sind, ist Dusk darauf ausgelegt, sensible Finanzinformationen vertraulich zu halten, während dennoch autorisierten Teilnehmern und Regulierungsbehörden die Informationen zur Verfügung gestellt werden, die sie zu sehen berechtigt sind.
Eine der wichtigsten Innovationen von Dusk ist der Standard für „Confidential Security Contract“ (XSC), der speziell für die Ausgabe, Verwaltung und Übertragung von datenschutzaktivierten, tokenisierten Wertpapieren entwickelt wurde. XSC kann wichtige finanzielle Funktionen unterstützen, wie z. B. kontrollierte Übertragungen, Compliance-Regeln, Whitelisting, Dividendenverteilung, Abstimmungen und weitere Anforderungen an das Asset-Management.
Dusk ermöglicht außerdem vertrauliche Smart Contracts: Institutionen und Unternehmen können so finanzielle Prozesse automatisieren, ohne sensible Informationen wie Salden, Positionen, Gegenparteien oder proprietäre Geschäftslogik öffentlich offenzulegen. Dadurch ist das Netzwerk besonders relevant für institutionelles Finanzwesen, Wertpapiermärkte, private Transaktionen, Kreditvergabe und tokenisierte Real-World-Assets (RWAs).
Aus technischer Sicht kombiniert Dusk Zero-Knowledge-Technologie, geschützte Transaktionen, selektive Offenlegung und deterministische Abwicklung, um ein Umfeld zu schaffen, in dem Privatsphäre und regulatorische Transparenz nebeneinander existieren können. Die Architektur umfasst DuskVM, das Smart Contracts auf Basis von Rust/WASM unterstützt, sowie DuskEVM, das EVM-Kompatibilität bereitstellt und es Entwicklern erleichtert, Ethereum-basierte Anwendungen zu bauen oder zu migrieren.
Einfach gesagt versucht Dusk, traditionelle Finanzmärkte auf die Blockchain zu bringen, ohne sensible Finanzdaten in eine vollständig öffentliche Umgebung zu zwingen. Dieser Ansatz macht Privatsphäre, Compliance und Nachprüfbarkeit zu grundlegenden Bestandteilen der Infrastruktur – statt zu nachträglich hinzugefügten Features.
#Dusk/usdt✅
#dusk $DUSK
Dusk Network ist eine Layer-1-Blockchain, die speziell für regulierte Finanzanwendungen entwickelt wurde – mit Privatsphäre, Compliance, Sicherheit und schneller Abwicklung im Kern. Im Gegensatz zu traditionellen öffentlichen Blockchains, bei denen Transaktionsdaten offen sichtbar sind, ist Dusk darauf ausgelegt, sensible Finanzinformationen vertraulich zu halten, während dennoch autorisierten Teilnehmern und Regulierungsbehörden die Informationen zur Verfügung gestellt werden, die sie zu sehen berechtigt sind.
Eine der wichtigsten Innovationen von Dusk ist der Standard für „Confidential Security Contract“ (XSC), der speziell für die Ausgabe, Verwaltung und Übertragung von datenschutzaktivierten, tokenisierten Wertpapieren entwickelt wurde. XSC kann wichtige finanzielle Funktionen unterstützen, wie z. B. kontrollierte Übertragungen, Compliance-Regeln, Whitelisting, Dividendenverteilung, Abstimmungen und weitere Anforderungen an das Asset-Management.
Dusk ermöglicht außerdem vertrauliche Smart Contracts: Institutionen und Unternehmen können so finanzielle Prozesse automatisieren, ohne sensible Informationen wie Salden, Positionen, Gegenparteien oder proprietäre Geschäftslogik öffentlich offenzulegen. Dadurch ist das Netzwerk besonders relevant für institutionelles Finanzwesen, Wertpapiermärkte, private Transaktionen, Kreditvergabe und tokenisierte Real-World-Assets (RWAs).
Aus technischer Sicht kombiniert Dusk Zero-Knowledge-Technologie, geschützte Transaktionen, selektive Offenlegung und deterministische Abwicklung, um ein Umfeld zu schaffen, in dem Privatsphäre und regulatorische Transparenz nebeneinander existieren können. Die Architektur umfasst DuskVM, das Smart Contracts auf Basis von Rust/WASM unterstützt, sowie DuskEVM, das EVM-Kompatibilität bereitstellt und es Entwicklern erleichtert, Ethereum-basierte Anwendungen zu bauen oder zu migrieren.
Einfach gesagt versucht Dusk, traditionelle Finanzmärkte auf die Blockchain zu bringen, ohne sensible Finanzdaten in eine vollständig öffentliche Umgebung zu zwingen. Dieser Ansatz macht Privatsphäre, Compliance und Nachprüfbarkeit zu grundlegenden Bestandteilen der Infrastruktur – statt zu nachträglich hinzugefügten Features.
#Dusk/usdt✅
Dusk Network ist eine Layer-1-Blockchain, die speziell für regulierte Finanzanwendungen entwickelt wurde – mit Privatsphäre, Compliance, Sicherheit und schneller Abwicklung im Kern. Im Gegensatz zu traditionellen öffentlichen Blockchains, bei denen Transaktionsdaten offen sichtbar sind, ist Dusk darauf ausgelegt, sensible Finanzinformationen vertraulich zu halten, während dennoch autorisierten Teilnehmern und Regulierungsbehörden die Informationen zur Verfügung gestellt werden, die sie zu sehen berechtigt sind.
Eine der wichtigsten Innovationen von Dusk ist der Standard für „Confidential Security Contract“ (XSC), der speziell für die Ausgabe, Verwaltung und Übertragung von datenschutzaktivierten, tokenisierten Wertpapieren entwickelt wurde. XSC kann wichtige finanzielle Funktionen unterstützen, wie z. B. kontrollierte Übertragungen, Compliance-Regeln, Whitelisting, Dividendenverteilung, Abstimmungen und weitere Anforderungen an das Asset-Management.
Dusk ermöglicht außerdem vertrauliche Smart Contracts: Institutionen und Unternehmen können so finanzielle Prozesse automatisieren, ohne sensible Informationen wie Salden, Positionen, Gegenparteien oder proprietäre Geschäftslogik öffentlich offenzulegen. Dadurch ist das Netzwerk besonders relevant für institutionelles Finanzwesen, Wertpapiermärkte, private Transaktionen, Kreditvergabe und tokenisierte Real-World-Assets (RWAs).
Aus technischer Sicht kombiniert Dusk Zero-Knowledge-Technologie, geschützte Transaktionen, selektive Offenlegung und deterministische Abwicklung, um ein Umfeld zu schaffen, in dem Privatsphäre und regulatorische Transparenz nebeneinander existieren können. Die Architektur umfasst DuskVM, das Smart Contracts auf Basis von Rust/WASM unterstützt, sowie DuskEVM, das EVM-Kompatibilität bereitstellt und es Entwicklern erleichtert, Ethereum-basierte Anwendungen zu bauen oder zu migrieren.
Einfach gesagt versucht Dusk, traditionelle Finanzmärkte auf die Blockchain zu bringen, ohne sensible Finanzdaten in eine vollständig öffentliche Umgebung zu zwingen. Dieser Ansatz macht Privatsphäre, Compliance und Nachprüfbarkeit zu grundlegenden Bestandteilen der Infrastruktur – statt zu nachträglich hinzugefügten Features.
#Dusk/usdt✅
1
1
61
·
--
Bullisch
Übersetzung ansehen
$DUSK Network is a Layer-1 blockchain designed specifically for regulated financial applications, with privacy, compliance, and fast settlement at its core. Rather than making every transaction completely transparent, Dusk allows financial data to remain confidential while still enabling authorized parties to verify required information.
A major part of Dusk’s technology is the Confidential Security Contract (XSC) standard, which is designed for issuing and managing privacy-enabled tokenized securities. XSC can support features such as controlled transfers, compliance requirements, whitelisting, dividend distribution, voting, and other financial-asset functions.
Dusk also supports confidential smart contracts, allowing businesses to use blockchain-based automation without exposing sensitive balances, positions, counterparties, or business logic to everyone on the network. This is particularly relevant to institutions, securities markets, private transactions, lending, and tokenized real-world assets.
Technically, Dusk combines zero-knowledge technology, shielded transactions, selective disclosure, and deterministic settlement. Its architecture includes DuskVM for Rust/WASM smart contracts and DuskEVM for EVM-compatible applications.
In simple terms, Dusk aims to bring traditional finance on-chain without forcing sensitive financial information into a fully public environment, making privacy and regulatory compliance fundamental parts of the blockchain rather than afterthoughts. #Dusk/usdt✅
$DUSK Network is a Layer-1 blockchain designed specifically for regulated financial applications, with privacy, compliance, and fast settlement at its core. Rather than making every transaction completely transparent, Dusk allows financial data to remain confidential while still enabling authorized parties to verify required information.
A major part of Dusk’s technology is the Confidential Security Contract (XSC) standard, which is designed for issuing and managing privacy-enabled tokenized securities. XSC can support features such as controlled transfers, compliance requirements, whitelisting, dividend distribution, voting, and other financial-asset functions.
Dusk also supports confidential smart contracts, allowing businesses to use blockchain-based automation without exposing sensitive balances, positions, counterparties, or business logic to everyone on the network. This is particularly relevant to institutions, securities markets, private transactions, lending, and tokenized real-world assets.
Technically, Dusk combines zero-knowledge technology, shielded transactions, selective disclosure, and deterministic settlement. Its architecture includes DuskVM for Rust/WASM smart contracts and DuskEVM for EVM-compatible applications.
In simple terms, Dusk aims to bring traditional finance on-chain without forcing sensitive financial information into a fully public environment, making privacy and regulatory compliance fundamental parts of the blockchain rather than afterthoughts. #Dusk/usdt✅
A major part of Dusk’s technology is the Confidential Security Contract (XSC) standard, which is designed for issuing and managing privacy-enabled tokenized securities. XSC can support features such as controlled transfers, compliance requirements, whitelisting, dividend distribution, voting, and other financial-asset functions.
Dusk also supports confidential smart contracts, allowing businesses to use blockchain-based automation without exposing sensitive balances, positions, counterparties, or business logic to everyone on the network. This is particularly relevant to institutions, securities markets, private transactions, lending, and tokenized real-world assets.
Technically, Dusk combines zero-knowledge technology, shielded transactions, selective disclosure, and deterministic settlement. Its architecture includes DuskVM for Rust/WASM smart contracts and DuskEVM for EVM-compatible applications.
In simple terms, Dusk aims to bring traditional finance on-chain without forcing sensitive financial information into a fully public environment, making privacy and regulatory compliance fundamental parts of the blockchain rather than afterthoughts. #Dusk/usdt✅
69
·
--
Bullisch
#dusk $DUSK
Je tiefer ich in Dusk hineinschaue, desto mehr denke ich, dass seine eigentliche Stärke nicht einfach „Privatsphäre“ ist. Es ist Privatsphäre, ohne die Nachprüfbarkeit zu opfern.
Traditionelle Blockchains machten Transparenz zu einer Kernfunktion: Transaktionen sind sichtbar, auditierbar und unabhängig verifizierbar. Doch während Blockchain in Richtung regulierter Finanzmärkte, Wertpapiere, tokenisierte Vermögenswerte und institutionelle Märkte vorrückt, kann vollständige Transparenz zur Einschränkung werden.
Ein Anleger muss möglicherweise seine Berechtigung nachweisen, ohne seine gesamte finanzielle Historie offenzulegen. Ein Finanzinstitut muss möglicherweise Compliance demonstrieren, ohne jede Transaktion preiszugeben. Ein Regulierer muss möglicherweise auf spezifische Informationen zugreifen können, ohne dass das gesamte Netzwerk sie sehen muss.
Genau dort wird Dusk interessant.
Dusk behandelt Privatsphäre als Fähigkeit auf Protokollebene. Seine Architektur kombiniert Zero-Knowledge-Beweise, geschützte Transfers, Identitätskontrollen, selektive Offenlegung und programmierbare Smart Contracts. Phoenix unterstützt geschützte Transaktionen, Moonlight ermöglicht transparente Kontoflüsse, während Citadel sich auf Identität und selektive Offenlegung konzentriert.
Die große Idee ist einfach: Statt zu fragen, wie man eine Blockchain vollständig privat macht, sollte man fragen, welche Informationen offengelegt werden müssen, für wen und warum.
Mit DuskVM, DuskEVM und DuskDS zielt das Ökosystem außerdem auf regulierte digitale Vermögenswerte, institutionelles DeFi, Zahlungen und Abwicklung.
Dusk’ These ist überzeugend: Privatsphäre sollte programmierbar sein—transparent, wenn nötig, vertraulich, wenn es angemessen ist, und selektiv offengelegt, wenn ein Nachweis erforderlich ist. 🔒⚡
#dusk $DUSK
Je tiefer ich in Dusk hineinschaue, desto mehr denke ich, dass seine eigentliche Stärke nicht einfach „Privatsphäre“ ist. Es ist Privatsphäre, ohne die Nachprüfbarkeit zu opfern.
Traditionelle Blockchains machten Transparenz zu einer Kernfunktion: Transaktionen sind sichtbar, auditierbar und unabhängig verifizierbar. Doch während Blockchain in Richtung regulierter Finanzmärkte, Wertpapiere, tokenisierte Vermögenswerte und institutionelle Märkte vorrückt, kann vollständige Transparenz zur Einschränkung werden.
Ein Anleger muss möglicherweise seine Berechtigung nachweisen, ohne seine gesamte finanzielle Historie offenzulegen. Ein Finanzinstitut muss möglicherweise Compliance demonstrieren, ohne jede Transaktion preiszugeben. Ein Regulierer muss möglicherweise auf spezifische Informationen zugreifen können, ohne dass das gesamte Netzwerk sie sehen muss.
Genau dort wird Dusk interessant.
Dusk behandelt Privatsphäre als Fähigkeit auf Protokollebene. Seine Architektur kombiniert Zero-Knowledge-Beweise, geschützte Transfers, Identitätskontrollen, selektive Offenlegung und programmierbare Smart Contracts. Phoenix unterstützt geschützte Transaktionen, Moonlight ermöglicht transparente Kontoflüsse, während Citadel sich auf Identität und selektive Offenlegung konzentriert.
Die große Idee ist einfach: Statt zu fragen, wie man eine Blockchain vollständig privat macht, sollte man fragen, welche Informationen offengelegt werden müssen, für wen und warum.
Mit DuskVM, DuskEVM und DuskDS zielt das Ökosystem außerdem auf regulierte digitale Vermögenswerte, institutionelles DeFi, Zahlungen und Abwicklung.
Dusk’ These ist überzeugend: Privatsphäre sollte programmierbar sein—transparent, wenn nötig, vertraulich, wenn es angemessen ist, und selektiv offengelegt, wenn ein Nachweis erforderlich ist. 🔒⚡
Je tiefer ich in Dusk hineinschaue, desto mehr denke ich, dass seine eigentliche Stärke nicht einfach „Privatsphäre“ ist. Es ist Privatsphäre, ohne die Nachprüfbarkeit zu opfern.
Traditionelle Blockchains machten Transparenz zu einer Kernfunktion: Transaktionen sind sichtbar, auditierbar und unabhängig verifizierbar. Doch während Blockchain in Richtung regulierter Finanzmärkte, Wertpapiere, tokenisierte Vermögenswerte und institutionelle Märkte vorrückt, kann vollständige Transparenz zur Einschränkung werden.
Ein Anleger muss möglicherweise seine Berechtigung nachweisen, ohne seine gesamte finanzielle Historie offenzulegen. Ein Finanzinstitut muss möglicherweise Compliance demonstrieren, ohne jede Transaktion preiszugeben. Ein Regulierer muss möglicherweise auf spezifische Informationen zugreifen können, ohne dass das gesamte Netzwerk sie sehen muss.
Genau dort wird Dusk interessant.
Dusk behandelt Privatsphäre als Fähigkeit auf Protokollebene. Seine Architektur kombiniert Zero-Knowledge-Beweise, geschützte Transfers, Identitätskontrollen, selektive Offenlegung und programmierbare Smart Contracts. Phoenix unterstützt geschützte Transaktionen, Moonlight ermöglicht transparente Kontoflüsse, während Citadel sich auf Identität und selektive Offenlegung konzentriert.
Die große Idee ist einfach: Statt zu fragen, wie man eine Blockchain vollständig privat macht, sollte man fragen, welche Informationen offengelegt werden müssen, für wen und warum.
Mit DuskVM, DuskEVM und DuskDS zielt das Ökosystem außerdem auf regulierte digitale Vermögenswerte, institutionelles DeFi, Zahlungen und Abwicklung.
Dusk’ These ist überzeugend: Privatsphäre sollte programmierbar sein—transparent, wenn nötig, vertraulich, wenn es angemessen ist, und selektiv offengelegt, wenn ein Nachweis erforderlich ist. 🔒⚡
59
·
--
Bullisch
#dusk $DUSK
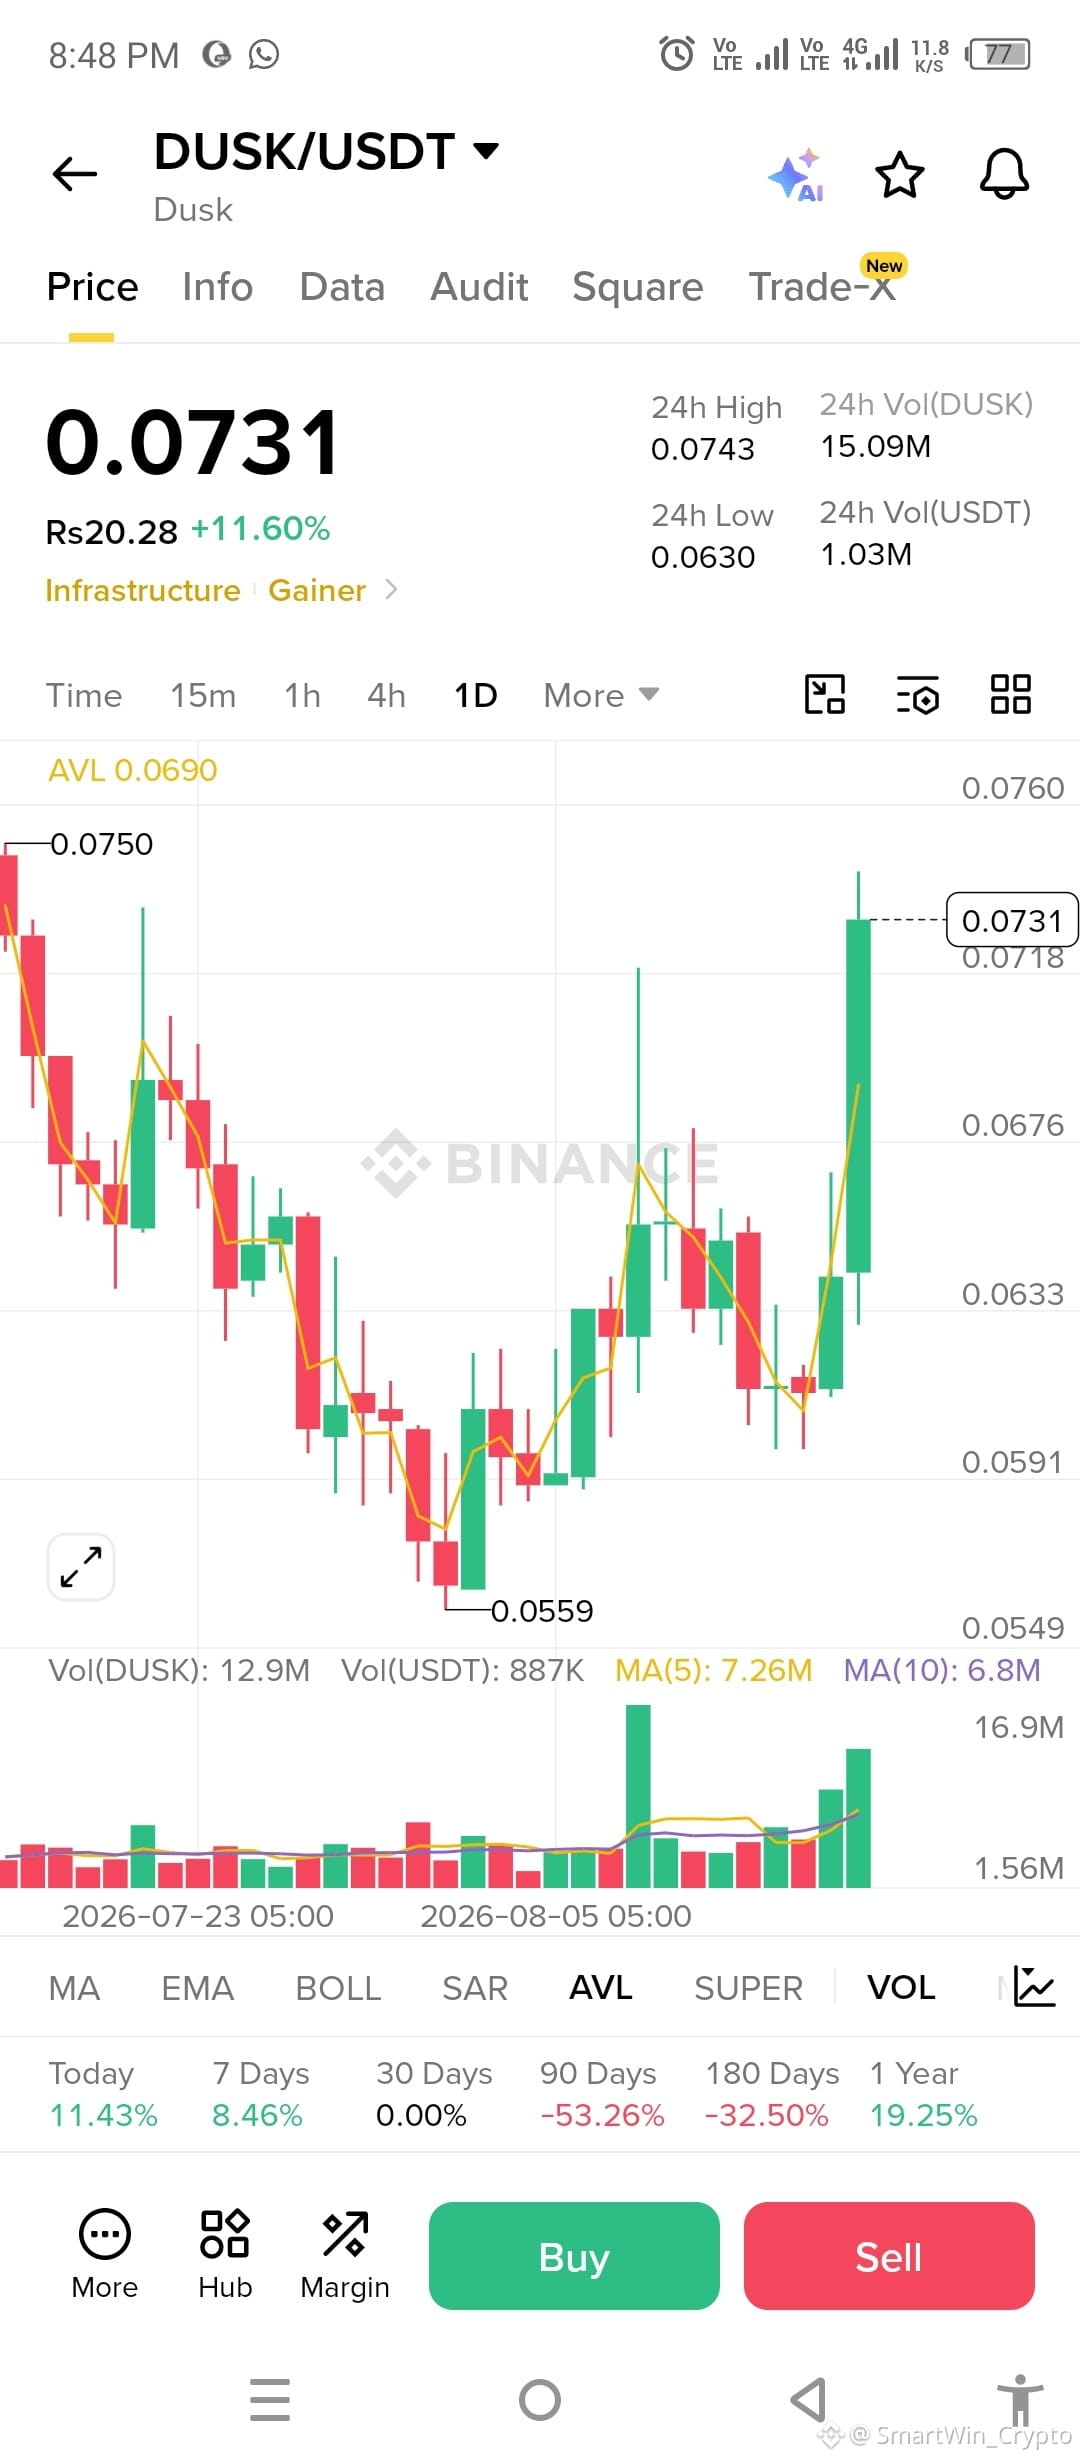
$DUSK bricht mit ansteigendem Volumen aus 🚀 Beobachte den Widerstand bei 0.0743–0.0760; Spot-Trader sollten diszipliniert bleiben.
$DUSK/USDT Spot-Analyse
$DUSK zeigt starke bullische Dynamik, aber der aktuelle Preis um 0.0731 liegt bereits nahe am 24h-Hoch von 0.0743, daher ist dem grünen Kerzen nachzujagen riskant.
Wichtige Levels
🟢 Aktuell: 0.0731
🔴 Widerstand: 0.0743 → 0.0750 → 0.0760
🟢 Support: 0.0718 → 0.0676 → 0.0633
📈 Das Volumen steigt, was den Ausbruchsversuch unterstützt.
Spot-Long-Plan
Kaufe nicht die komplette Position bei 0.0731:
Einstieg 1: 0.0715–0.0720
Einstieg 2: 0.0680–0.0690
Einstieg 3: 0.0635–0.0650 bei einem tieferen Pullback
TP1: 0.0743
TP2: 0.0760
TP3: 0.0800+
Invalidierung: anhaltender täglicher Schlusskurs unter ~0.0630
HINWEIS: DYOR
Die obige Analyse ist meine eigene Arbeit. Das ist keine Finanzberatung. Bitte mach deine eigene Recherche, bevor du investierst.
#dusk $DUSK
$DUSK bricht mit ansteigendem Volumen aus 🚀 Beobachte den Widerstand bei 0.0743–0.0760; Spot-Trader sollten diszipliniert bleiben.
$DUSK /USDT Spot-Analyse
$DUSK zeigt starke bullische Dynamik, aber der aktuelle Preis um 0.0731 liegt bereits nahe am 24h-Hoch von 0.0743, daher ist dem grünen Kerzen nachzujagen riskant.
Wichtige Levels
🟢 Aktuell: 0.0731
🔴 Widerstand: 0.0743 → 0.0750 → 0.0760
🟢 Support: 0.0718 → 0.0676 → 0.0633
📈 Das Volumen steigt, was den Ausbruchsversuch unterstützt.
Spot-Long-Plan
Kaufe nicht die komplette Position bei 0.0731:
Einstieg 1: 0.0715–0.0720
Einstieg 2: 0.0680–0.0690
Einstieg 3: 0.0635–0.0650 bei einem tieferen Pullback
TP1: 0.0743
TP2: 0.0760
TP3: 0.0800+
Invalidierung: anhaltender täglicher Schlusskurs unter ~0.0630
HINWEIS: DYOR
Die obige Analyse ist meine eigene Arbeit. Das ist keine Finanzberatung. Bitte mach deine eigene Recherche, bevor du investierst.
$DUSK bricht mit ansteigendem Volumen aus 🚀 Beobachte den Widerstand bei 0.0743–0.0760; Spot-Trader sollten diszipliniert bleiben.
$DUSK /USDT Spot-Analyse
$DUSK zeigt starke bullische Dynamik, aber der aktuelle Preis um 0.0731 liegt bereits nahe am 24h-Hoch von 0.0743, daher ist dem grünen Kerzen nachzujagen riskant.
Wichtige Levels
🟢 Aktuell: 0.0731
🔴 Widerstand: 0.0743 → 0.0750 → 0.0760
🟢 Support: 0.0718 → 0.0676 → 0.0633
📈 Das Volumen steigt, was den Ausbruchsversuch unterstützt.
Spot-Long-Plan
Kaufe nicht die komplette Position bei 0.0731:
Einstieg 1: 0.0715–0.0720
Einstieg 2: 0.0680–0.0690
Einstieg 3: 0.0635–0.0650 bei einem tieferen Pullback
TP1: 0.0743
TP2: 0.0760
TP3: 0.0800+
Invalidierung: anhaltender täglicher Schlusskurs unter ~0.0630
HINWEIS: DYOR
Die obige Analyse ist meine eigene Arbeit. Das ist keine Finanzberatung. Bitte mach deine eigene Recherche, bevor du investierst.
85
·
--
Bullisch
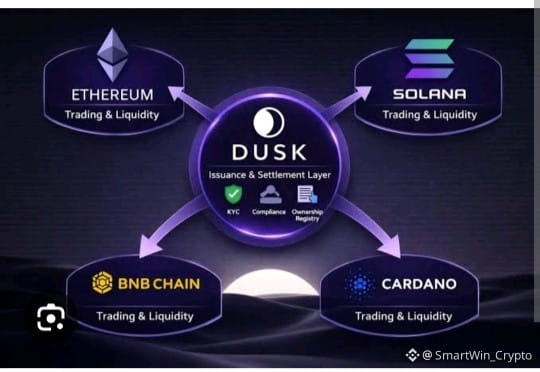
#dusk $DUSK ist eine datenschutzorientierte, compliance-fähige Blockchain, die dezentrale Technologie mit traditionellen Finanzmärkten verbindet. Sie kombiniert schnelle Finalität, vertrauliche Transaktionen, Nachvollziehbarkeit, regulatorische Compliance und hohe Performance.
Provisionierer: Nutzer können DUSK staken, um am Konsens teilzunehmen. Der Mindesteinsatz beträgt 1.000 DUSK. Einsätze müssen eine Sperr- bzw. Reifezeit durchlaufen, bevor sie als berechtigt gelten.
Epochs: Eine Epoche enthält derzeit 2.160 Blöcke. Neue Einsätze werden zu Beginn einer neuen Epoche als berechtigt, nachdem die erforderliche Reifezeit abgeschlossen wurde.
Belohnungen und Strafen: Provisionierer werden dafür belohnt, am Konsens teilzunehmen, und bei Fehlverhalten oder Ausbleiben der Teilnahme bestraft. So wird eine zuverlässige Blockproduktion unterstützt.
Zukunfts-Generator-Problem: Dusk nutzt drei Mechanismen, um Generatoren davon abzuhalten, absichtlich frühere Iterationen scheitern zu lassen:
Wählerbelohnungen für die Teilnahme an Validierung und Ratifizierung.
Zusatzbelohnungen für Generatoren, die bekannte Votes (Abstimmungen) einbeziehen.
Ausschluss des nächsten Generators von der Abstimmung, um Anreize zu reduzieren, der Abstimmung fernzubleiben.
Transaktionsanforderungen: Jede Transaktion muss Eigentum nachweisen, ausreichendes Guthaben und Gebühren belegen, Double-Spending verhindern und gegen Transaktions-Malleability (Manipulierbarkeit) geschützt sein.
Moonlight: Verwendet öffentliche Kontostände und digitale Signaturen, um Eigentum, Guthaben und die Integrität der Transaktionen zu verifizieren.
Phoenix: Verwendet Zero-Knowledge-(ZK)-Beweise, insbesondere im verschleierten Modus, um die gleichen Transaktionsgarantien bereitzustellen und gleichzeitig mehr Datenschutz zu bieten.
Kurz gesagt: Dusk kombiniert zustandsbasierten Konsens auf Staking-Basis, schnelle Transaktions-Finalität, Datenschutz durch ZK-Beweise und regulatorische Compliance, um eine Blockchain zu schaffen, die für traditionelle und regulierte Finanzmärkte geeignet ist.
Dusk: Phoenix-Transaktionsmodell. Version GitHub (2024), online verfügbar unter: https:
//github.com/dusk-network/phoenix/blob/master/docs/v2/protocol.pdf
Dusk: π-crust. GitHub (2024), online verfügbar unter: https://github.com/dusk-network/
piecrust
#dusk #Binance #Ethereum #solana
#dusk $DUSK ist eine datenschutzorientierte, compliance-fähige Blockchain, die dezentrale Technologie mit traditionellen Finanzmärkten verbindet. Sie kombiniert schnelle Finalität, vertrauliche Transaktionen, Nachvollziehbarkeit, regulatorische Compliance und hohe Performance.
Provisionierer: Nutzer können DUSK staken, um am Konsens teilzunehmen. Der Mindesteinsatz beträgt 1.000 DUSK. Einsätze müssen eine Sperr- bzw. Reifezeit durchlaufen, bevor sie als berechtigt gelten.
Epochs: Eine Epoche enthält derzeit 2.160 Blöcke. Neue Einsätze werden zu Beginn einer neuen Epoche als berechtigt, nachdem die erforderliche Reifezeit abgeschlossen wurde.
Belohnungen und Strafen: Provisionierer werden dafür belohnt, am Konsens teilzunehmen, und bei Fehlverhalten oder Ausbleiben der Teilnahme bestraft. So wird eine zuverlässige Blockproduktion unterstützt.
Zukunfts-Generator-Problem: Dusk nutzt drei Mechanismen, um Generatoren davon abzuhalten, absichtlich frühere Iterationen scheitern zu lassen:
Wählerbelohnungen für die Teilnahme an Validierung und Ratifizierung.
Zusatzbelohnungen für Generatoren, die bekannte Votes (Abstimmungen) einbeziehen.
Ausschluss des nächsten Generators von der Abstimmung, um Anreize zu reduzieren, der Abstimmung fernzubleiben.
Transaktionsanforderungen: Jede Transaktion muss Eigentum nachweisen, ausreichendes Guthaben und Gebühren belegen, Double-Spending verhindern und gegen Transaktions-Malleability (Manipulierbarkeit) geschützt sein.
Moonlight: Verwendet öffentliche Kontostände und digitale Signaturen, um Eigentum, Guthaben und die Integrität der Transaktionen zu verifizieren.
Phoenix: Verwendet Zero-Knowledge-(ZK)-Beweise, insbesondere im verschleierten Modus, um die gleichen Transaktionsgarantien bereitzustellen und gleichzeitig mehr Datenschutz zu bieten.
Kurz gesagt: Dusk kombiniert zustandsbasierten Konsens auf Staking-Basis, schnelle Transaktions-Finalität, Datenschutz durch ZK-Beweise und regulatorische Compliance, um eine Blockchain zu schaffen, die für traditionelle und regulierte Finanzmärkte geeignet ist.
Dusk: Phoenix-Transaktionsmodell. Version GitHub (2024), online verfügbar unter: https:
//github.com/dusk-network/phoenix/blob/master/docs/v2/protocol.pdf
Dusk: π-crust. GitHub (2024), online verfügbar unter: https://github.com/dusk-network/
piecrust
#dusk #Binance #Ethereum #solana
Provisionierer: Nutzer können DUSK staken, um am Konsens teilzunehmen. Der Mindesteinsatz beträgt 1.000 DUSK. Einsätze müssen eine Sperr- bzw. Reifezeit durchlaufen, bevor sie als berechtigt gelten.
Epochs: Eine Epoche enthält derzeit 2.160 Blöcke. Neue Einsätze werden zu Beginn einer neuen Epoche als berechtigt, nachdem die erforderliche Reifezeit abgeschlossen wurde.
Belohnungen und Strafen: Provisionierer werden dafür belohnt, am Konsens teilzunehmen, und bei Fehlverhalten oder Ausbleiben der Teilnahme bestraft. So wird eine zuverlässige Blockproduktion unterstützt.
Zukunfts-Generator-Problem: Dusk nutzt drei Mechanismen, um Generatoren davon abzuhalten, absichtlich frühere Iterationen scheitern zu lassen:
Wählerbelohnungen für die Teilnahme an Validierung und Ratifizierung.
Zusatzbelohnungen für Generatoren, die bekannte Votes (Abstimmungen) einbeziehen.
Ausschluss des nächsten Generators von der Abstimmung, um Anreize zu reduzieren, der Abstimmung fernzubleiben.
Transaktionsanforderungen: Jede Transaktion muss Eigentum nachweisen, ausreichendes Guthaben und Gebühren belegen, Double-Spending verhindern und gegen Transaktions-Malleability (Manipulierbarkeit) geschützt sein.
Moonlight: Verwendet öffentliche Kontostände und digitale Signaturen, um Eigentum, Guthaben und die Integrität der Transaktionen zu verifizieren.
Phoenix: Verwendet Zero-Knowledge-(ZK)-Beweise, insbesondere im verschleierten Modus, um die gleichen Transaktionsgarantien bereitzustellen und gleichzeitig mehr Datenschutz zu bieten.
Kurz gesagt: Dusk kombiniert zustandsbasierten Konsens auf Staking-Basis, schnelle Transaktions-Finalität, Datenschutz durch ZK-Beweise und regulatorische Compliance, um eine Blockchain zu schaffen, die für traditionelle und regulierte Finanzmärkte geeignet ist.
Dusk: Phoenix-Transaktionsmodell. Version GitHub (2024), online verfügbar unter: https:
//github.com/dusk-network/phoenix/blob/master/docs/v2/protocol.pdf
Dusk: π-crust. GitHub (2024), online verfügbar unter: https://github.com/dusk-network/
piecrust
#dusk #Binance #Ethereum #solana
66
·
--
Bullisch
#dusk $DUSK belohnt ehrliche Teilnahme und bestraft Fehler. Mondlicht ermöglicht transparente Transaktionen, während Phoenix Privatsphäre mit ZK-Beweisen bietet.
#Dusk/usdt✅
#dusk $DUSK belohnt ehrliche Teilnahme und bestraft Fehler. Mondlicht ermöglicht transparente Transaktionen, während Phoenix Privatsphäre mit ZK-Beweisen bietet.
#Dusk/usdt✅
#Dusk/usdt✅
2
65
·
--
Bullisch
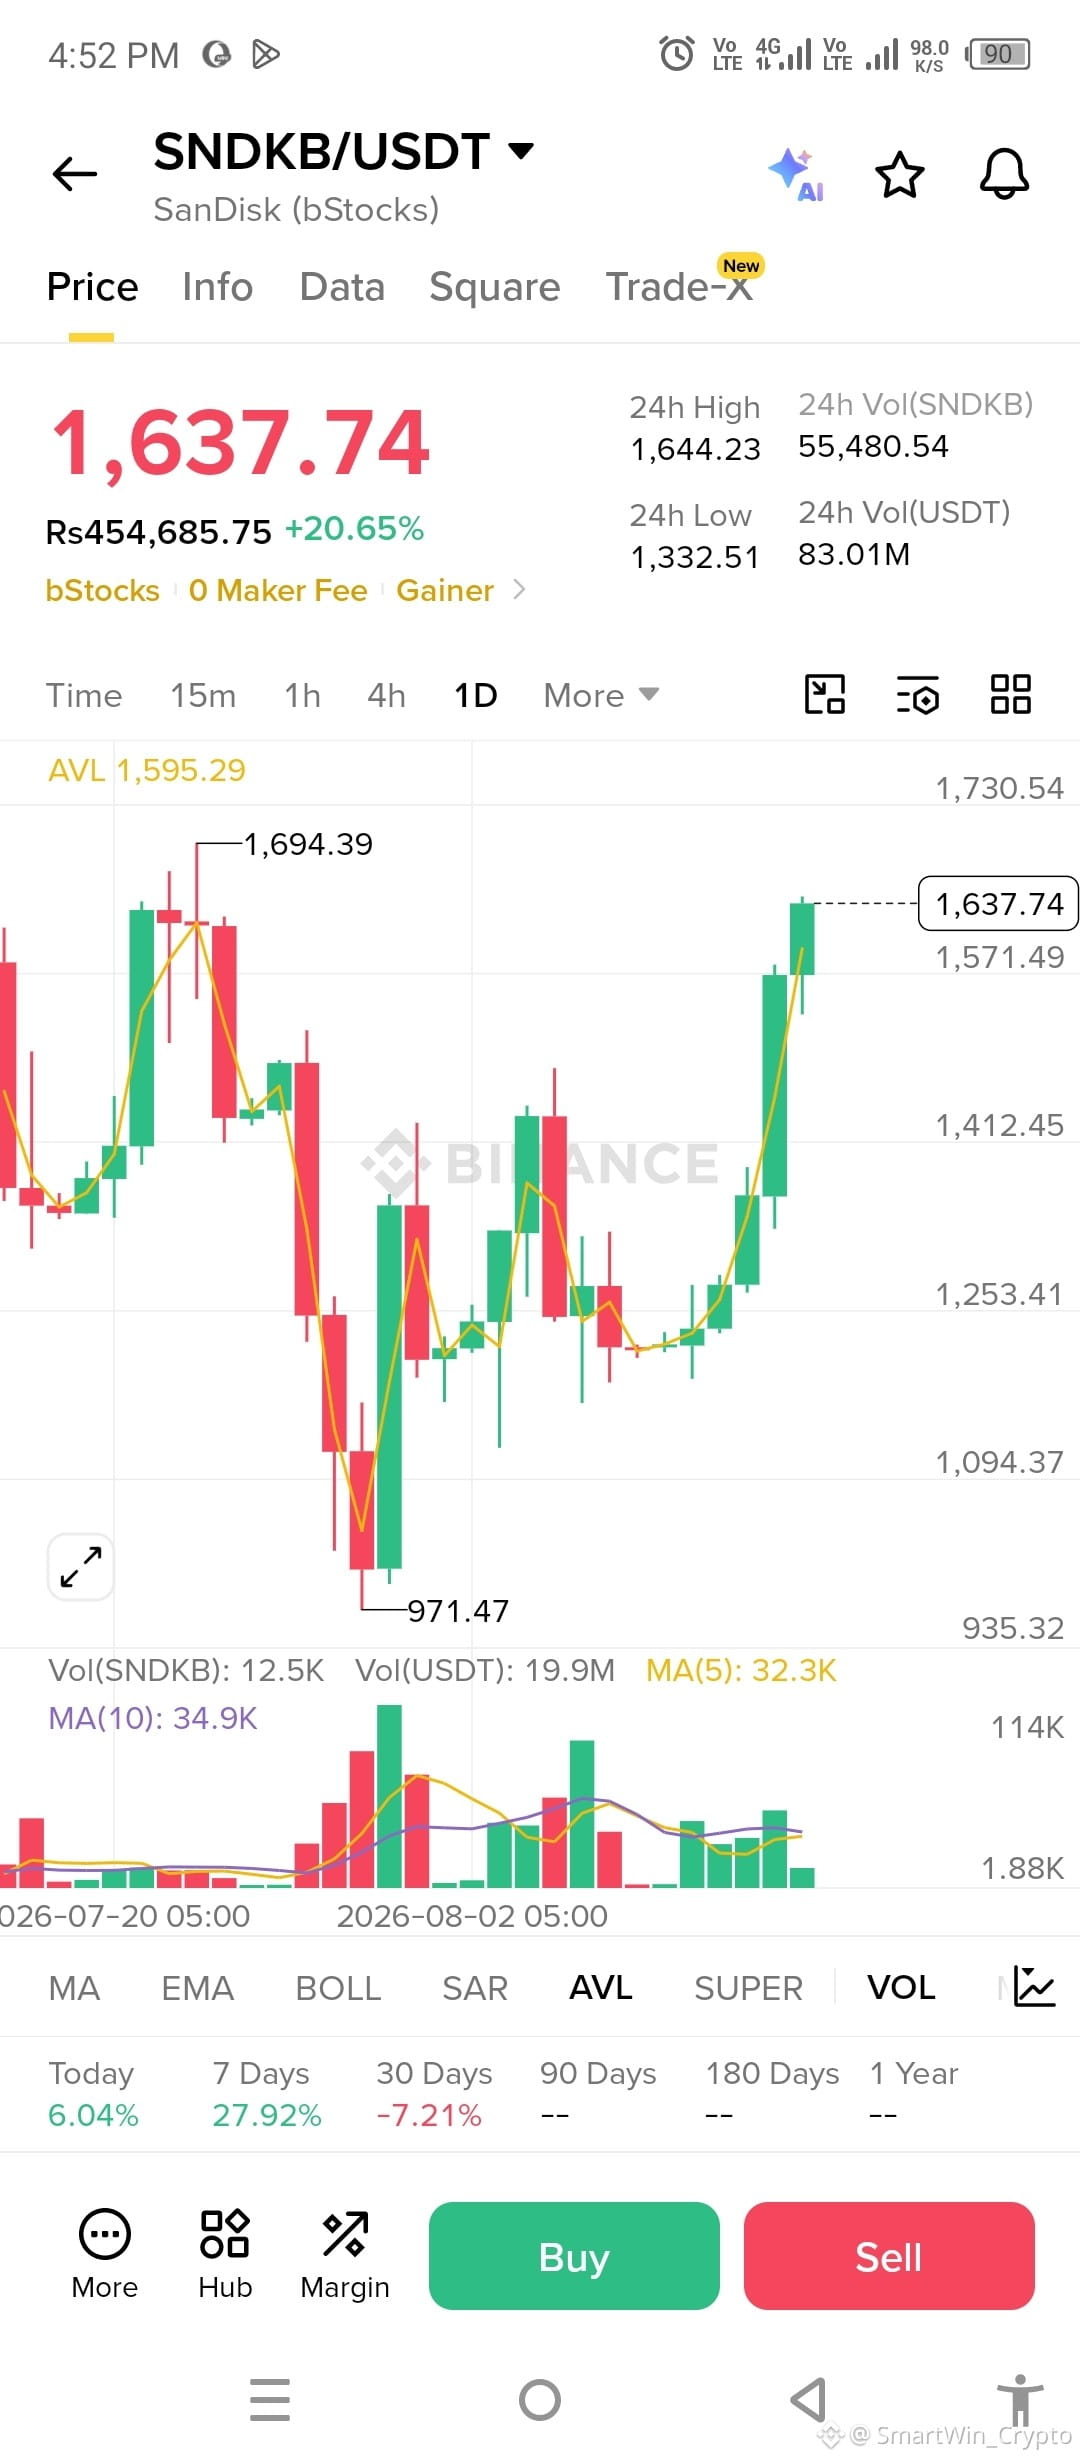
$SNDK /USDT Spot-Setup 📊 Preis: ~$1.638 nach einem starken +20% täglichen Anstieg.
🟢 Kaufszone: $1.570–$1.600
🎯 TP1: $1.690
🎯 TP2: $1.730–$1.750
🛑 SL: $1.520
HINWEIS : DYOR
Die obige Analyse ist meine eigene Arbeit. Das ist keine finanzielle Beratung. Bitte mach deine eigene Recherche, bevor du investierst.
#EthereumFoundationDropsPoseidonForL1
$SNDK /USDT Spot-Setup 📊 Preis: ~$1.638 nach einem starken +20% täglichen Anstieg.
🟢 Kaufszone: $1.570–$1.600
🎯 TP1: $1.690
🎯 TP2: $1.730–$1.750
🛑 SL: $1.520
HINWEIS : DYOR
Die obige Analyse ist meine eigene Arbeit. Das ist keine finanzielle Beratung. Bitte mach deine eigene Recherche, bevor du investierst.
#EthereumFoundationDropsPoseidonForL1
🟢 Kaufszone: $1.570–$1.600
🎯 TP1: $1.690
🎯 TP2: $1.730–$1.750
🛑 SL: $1.520
HINWEIS : DYOR
Die obige Analyse ist meine eigene Arbeit. Das ist keine finanzielle Beratung. Bitte mach deine eigene Recherche, bevor du investierst.
#EthereumFoundationDropsPoseidonForL1
1
235
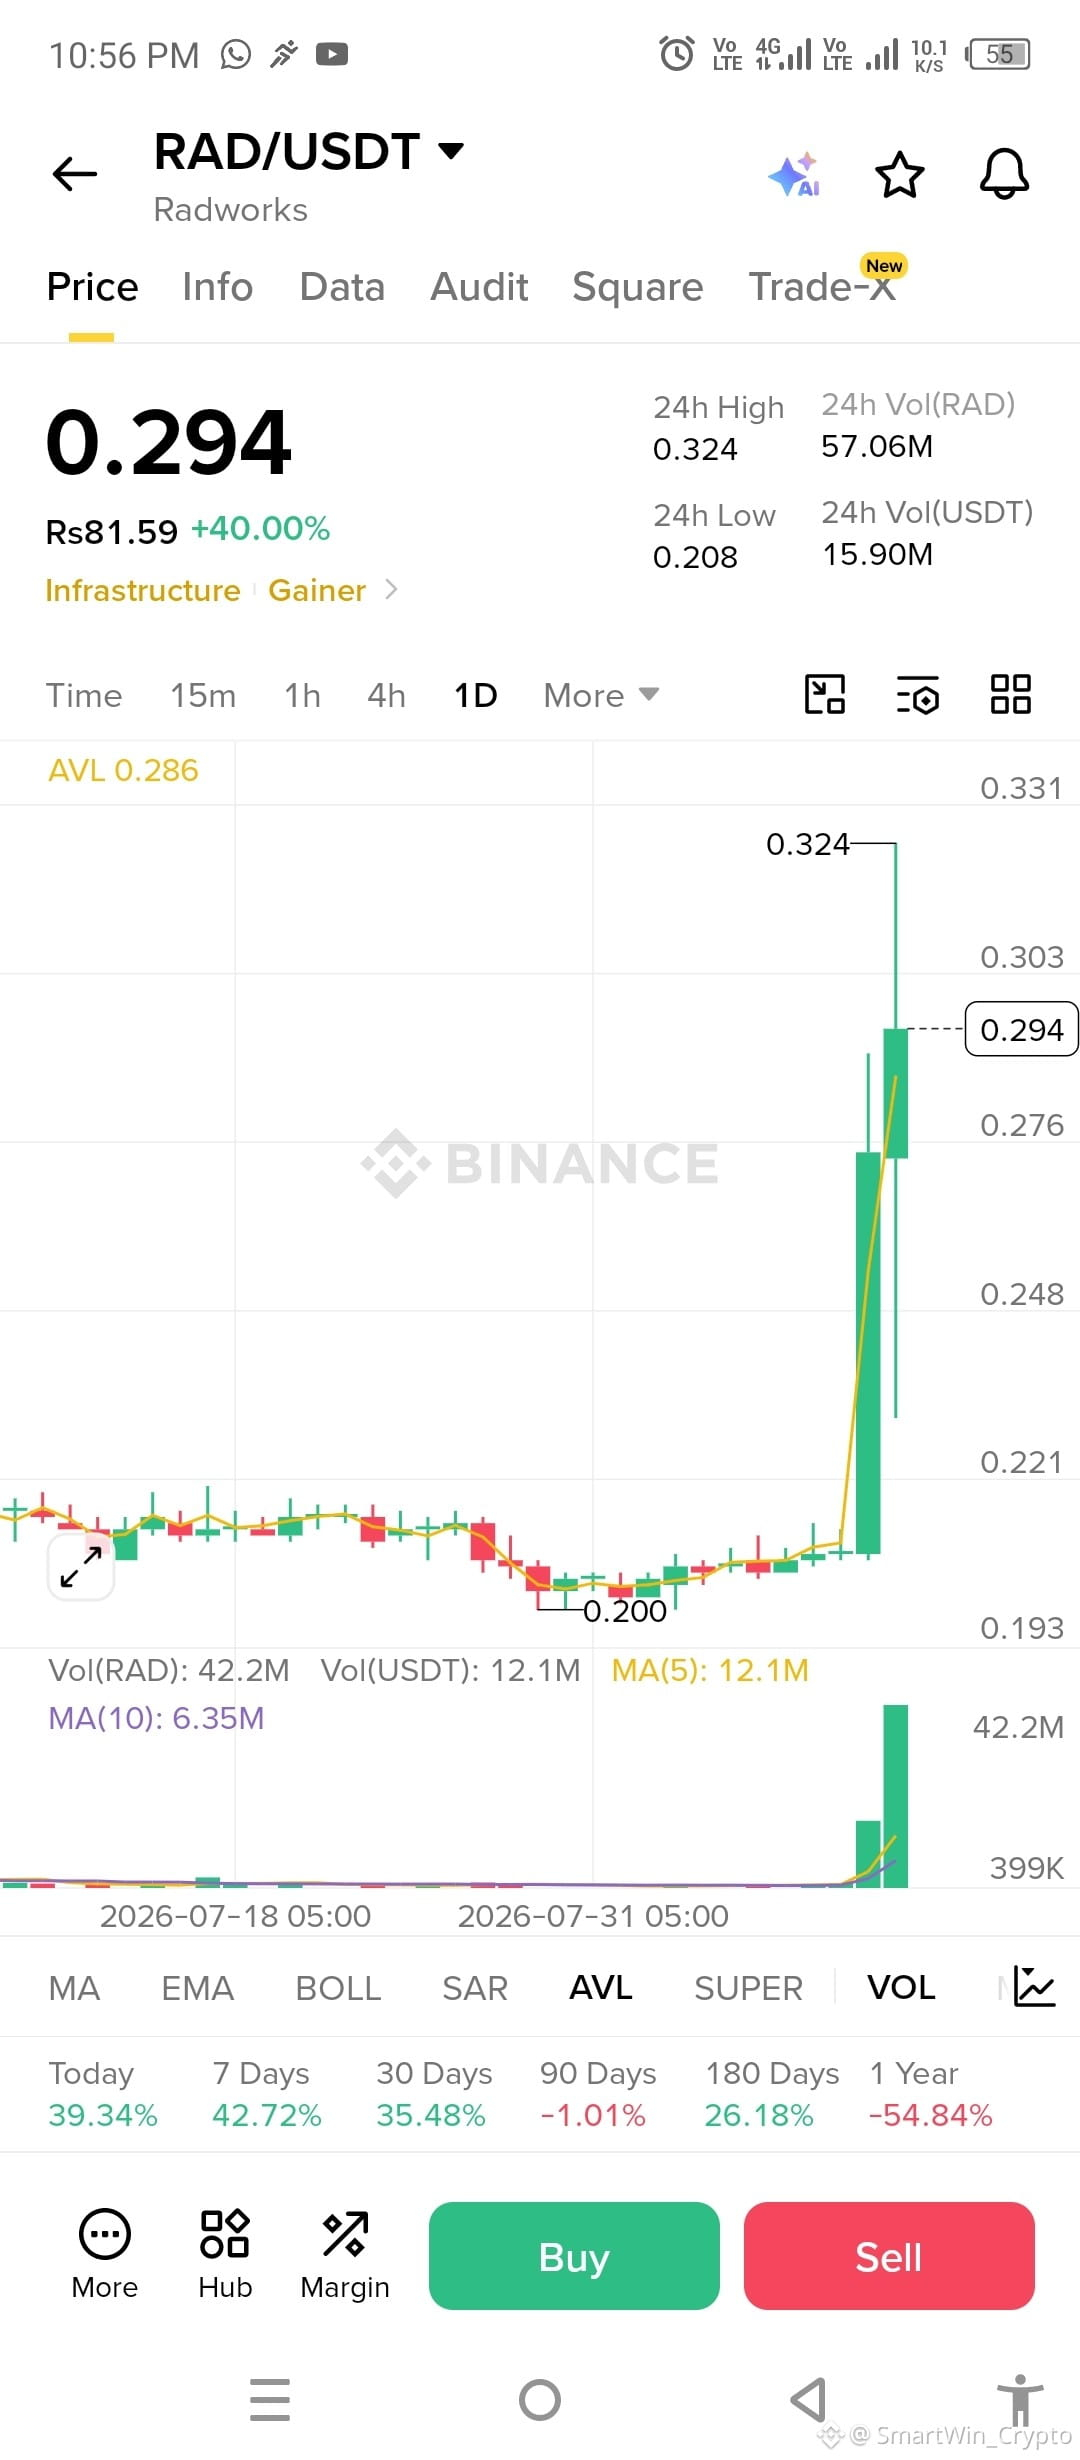
📊 $RAD /USDT Spot-Setup
$RAD zeigt starke Ausbruchsmomentum, aber +40% in 24h bedeutet: Verfolgung ist riskant.
🟢 Einstieg: 0.276–0.285 bei Retest
🛑 Stop-Loss: 0.260
🎯 TP1: 0.324
🎯 TP2: 0.350
🎯 TP3: 0.380
⚠️ Wenn der Kurs 0.276 mit starkem Volumen unterschreitet, meide das Setup.
Nur Spot — kein Leverage. Risiko managen.
HINWEIS: Recherchiere selbst (DYOR)
Die obige Analyse ist meine eigene Arbeit. Das ist keine Finanzberatung. Bitte mach deine eigene Recherche, bevor du investierst.
#RAD #Crypto #Binance #Altcoins
📊 $RAD /USDT Spot-Setup
$RAD zeigt starke Ausbruchsmomentum, aber +40% in 24h bedeutet: Verfolgung ist riskant.
🟢 Einstieg: 0.276–0.285 bei Retest
🛑 Stop-Loss: 0.260
🎯 TP1: 0.324
🎯 TP2: 0.350
🎯 TP3: 0.380
⚠️ Wenn der Kurs 0.276 mit starkem Volumen unterschreitet, meide das Setup.
Nur Spot — kein Leverage. Risiko managen.
HINWEIS: Recherchiere selbst (DYOR)
Die obige Analyse ist meine eigene Arbeit. Das ist keine Finanzberatung. Bitte mach deine eigene Recherche, bevor du investierst.
#RAD #Crypto #Binance #Altcoins
$RAD zeigt starke Ausbruchsmomentum, aber +40% in 24h bedeutet: Verfolgung ist riskant.
🟢 Einstieg: 0.276–0.285 bei Retest
🛑 Stop-Loss: 0.260
🎯 TP1: 0.324
🎯 TP2: 0.350
🎯 TP3: 0.380
⚠️ Wenn der Kurs 0.276 mit starkem Volumen unterschreitet, meide das Setup.
Nur Spot — kein Leverage. Risiko managen.
HINWEIS: Recherchiere selbst (DYOR)
Die obige Analyse ist meine eigene Arbeit. Das ist keine Finanzberatung. Bitte mach deine eigene Recherche, bevor du investierst.
#RAD #Crypto #Binance #Altcoins
128
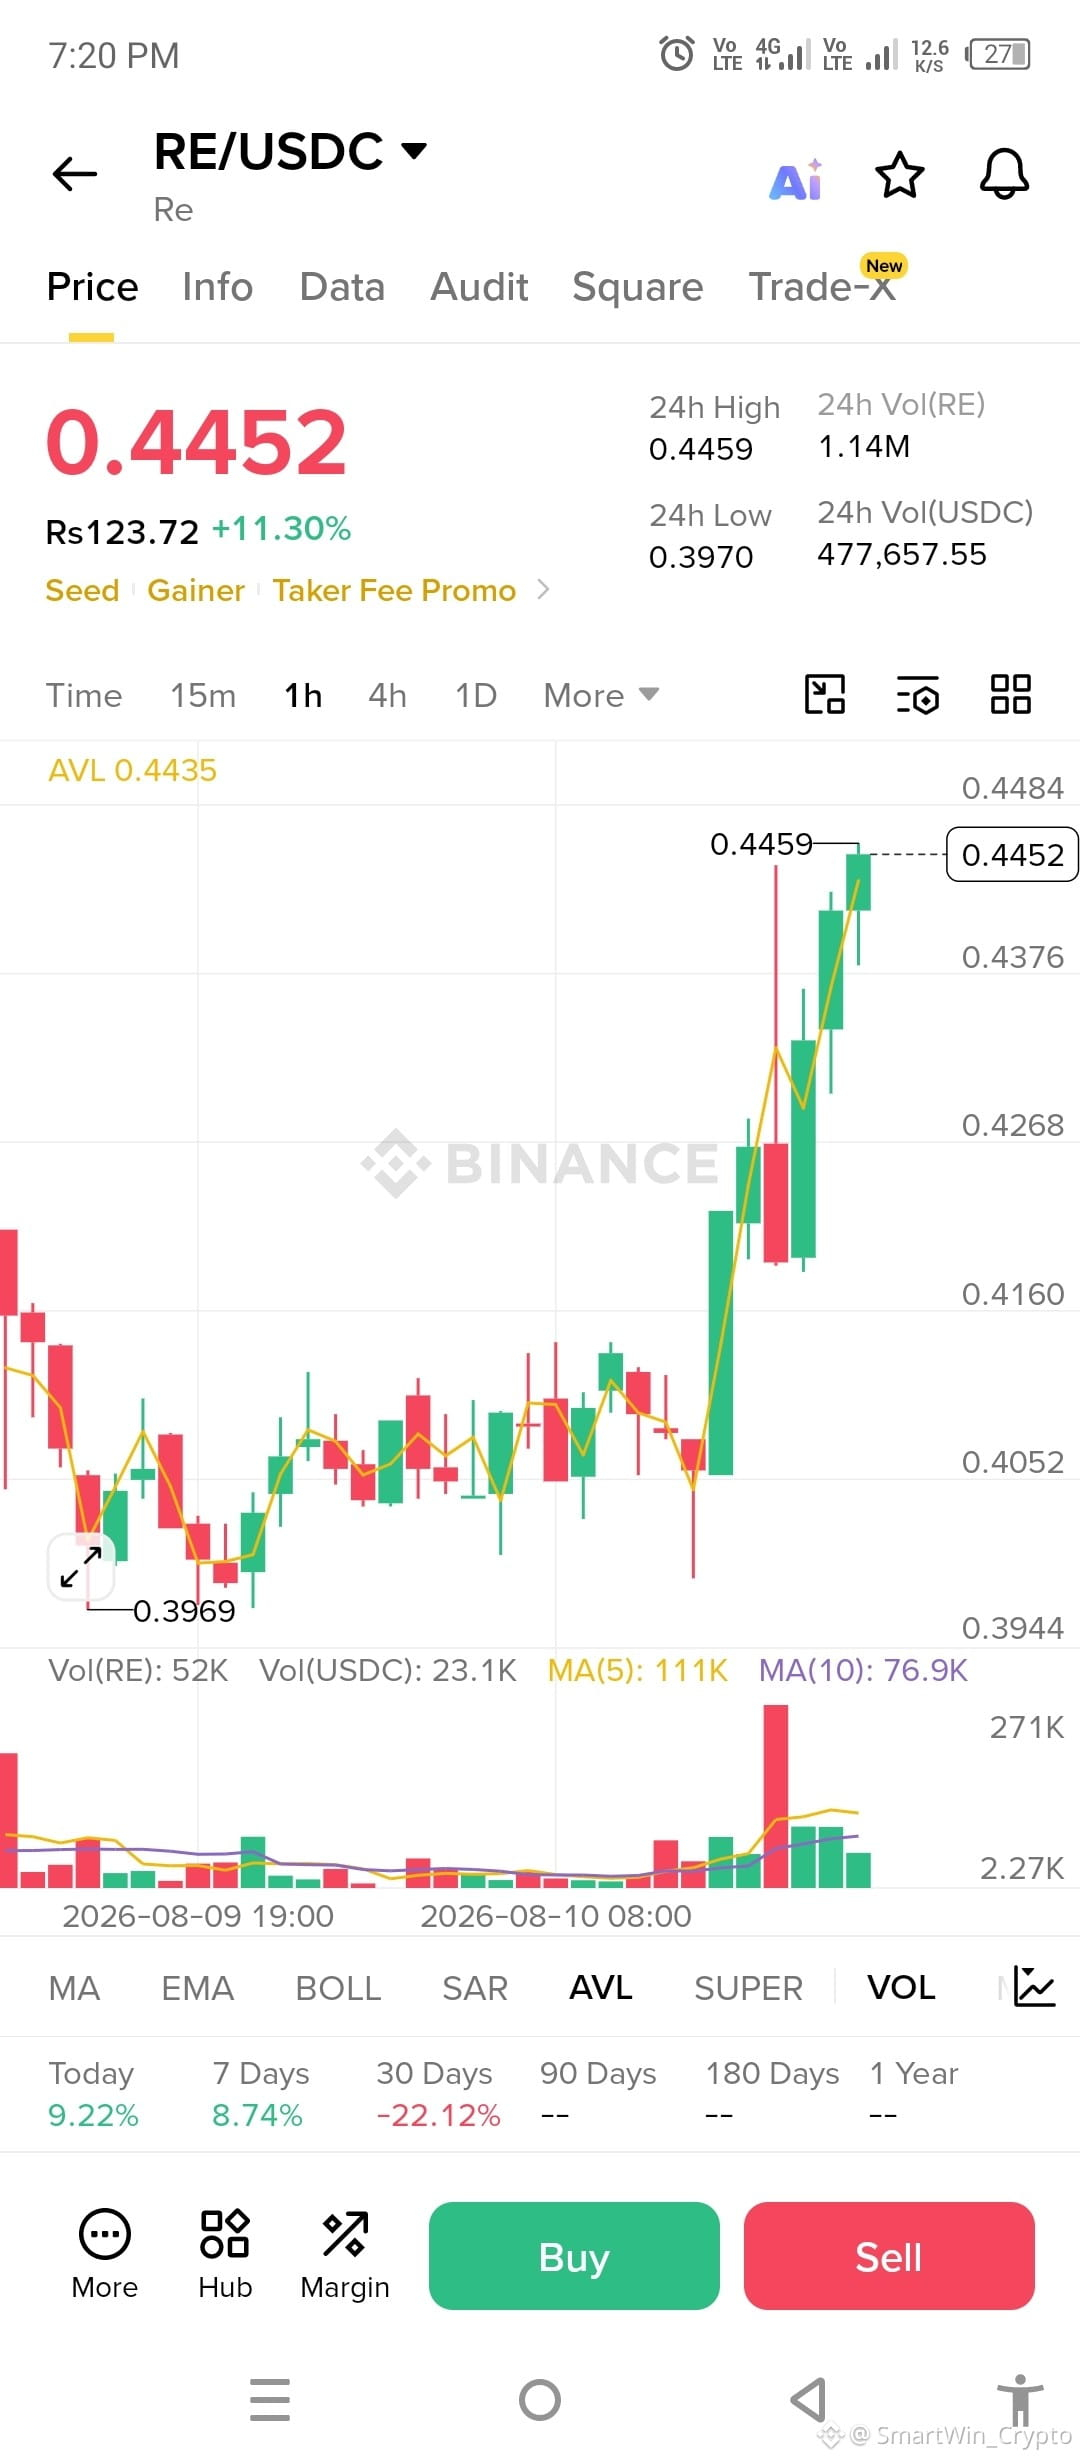
📊 **$RE /USDC Spot-Setup**
Preis: **0.4452** — starker Ausbruch + Volumen 🔥
🎯 **Take Profit:**
TP1: **0.4550**
TP2: **0.4650**
TP3: **0.4800**
🛑 **Stop Loss:** **0.4320**
⚠️ Wenn der Kurs **0.4376** verliert und der Verkauf stark ist, sei vorsichtig.
> $RE /USDC 🚀 Spot-Setup: Ausbruch mit starkem Volumen bestätigt.
Einstieg um 0.4452. 🎯
TP 0.455 / 0.465 / 0.480 🛑
SL 0.432. Risiko steuern—keine Kerzen hinterherjagen.#RE #Crpto #Binance
HINWEIS: BYOR
Die oben erklärte Analyse ist meine eigene Arbeit. Das ist keine Finanzberatung. Bitte mach deine eigene Recherche, bevor du investierst.
📊 **$RE /USDC Spot-Setup**
Preis: **0.4452** — starker Ausbruch + Volumen 🔥
🎯 **Take Profit:**
TP1: **0.4550**
TP2: **0.4650**
TP3: **0.4800**
🛑 **Stop Loss:** **0.4320**
⚠️ Wenn der Kurs **0.4376** verliert und der Verkauf stark ist, sei vorsichtig.
> $RE /USDC 🚀 Spot-Setup: Ausbruch mit starkem Volumen bestätigt.
Einstieg um 0.4452. 🎯
TP 0.455 / 0.465 / 0.480 🛑
SL 0.432. Risiko steuern—keine Kerzen hinterherjagen.#RE #Crpto #Binance
HINWEIS: BYOR
Die oben erklärte Analyse ist meine eigene Arbeit. Das ist keine Finanzberatung. Bitte mach deine eigene Recherche, bevor du investierst.
Preis: **0.4452** — starker Ausbruch + Volumen 🔥
🎯 **Take Profit:**
TP1: **0.4550**
TP2: **0.4650**
TP3: **0.4800**
🛑 **Stop Loss:** **0.4320**
⚠️ Wenn der Kurs **0.4376** verliert und der Verkauf stark ist, sei vorsichtig.
> $RE /USDC 🚀 Spot-Setup: Ausbruch mit starkem Volumen bestätigt.
Einstieg um 0.4452. 🎯
TP 0.455 / 0.465 / 0.480 🛑
SL 0.432. Risiko steuern—keine Kerzen hinterherjagen.#RE #Crpto #Binance
HINWEIS: BYOR
Die oben erklärte Analyse ist meine eigene Arbeit. Das ist keine Finanzberatung. Bitte mach deine eigene Recherche, bevor du investierst.
115
·
--
Bullisch
📊 Spot-Setup
$TUT /USDT Aktueller Preis: ~0.16334 USDT
Ich würde ungefähr verwenden:
Einstieg: 0.1632
SL: 0.1535
TP1: 0.1695
TP2: 0.1815
HINWEIS: MACH DEINE EIGENE RECHERCHE (DYOR)
Die obige Analyse ist meine eigene Arbeit. Das ist keine Finanzberatung. Bitte mach deine eigene Recherche, bevor du investierst. #SaylorHintsStrategyBitcoinBuy
📊 Spot-Setup
$TUT /USDT Aktueller Preis: ~0.16334 USDT
Ich würde ungefähr verwenden:
Einstieg: 0.1632
SL: 0.1535
TP1: 0.1695
TP2: 0.1815
HINWEIS: MACH DEINE EIGENE RECHERCHE (DYOR)
Die obige Analyse ist meine eigene Arbeit. Das ist keine Finanzberatung. Bitte mach deine eigene Recherche, bevor du investierst. #SaylorHintsStrategyBitcoinBuy
$TUT /USDT Aktueller Preis: ~0.16334 USDT
Ich würde ungefähr verwenden:
Einstieg: 0.1632
SL: 0.1535
TP1: 0.1695
TP2: 0.1815
HINWEIS: MACH DEINE EIGENE RECHERCHE (DYOR)
Die obige Analyse ist meine eigene Arbeit. Das ist keine Finanzberatung. Bitte mach deine eigene Recherche, bevor du investierst. #SaylorHintsStrategyBitcoinBuy
214
·
--
Bullisch
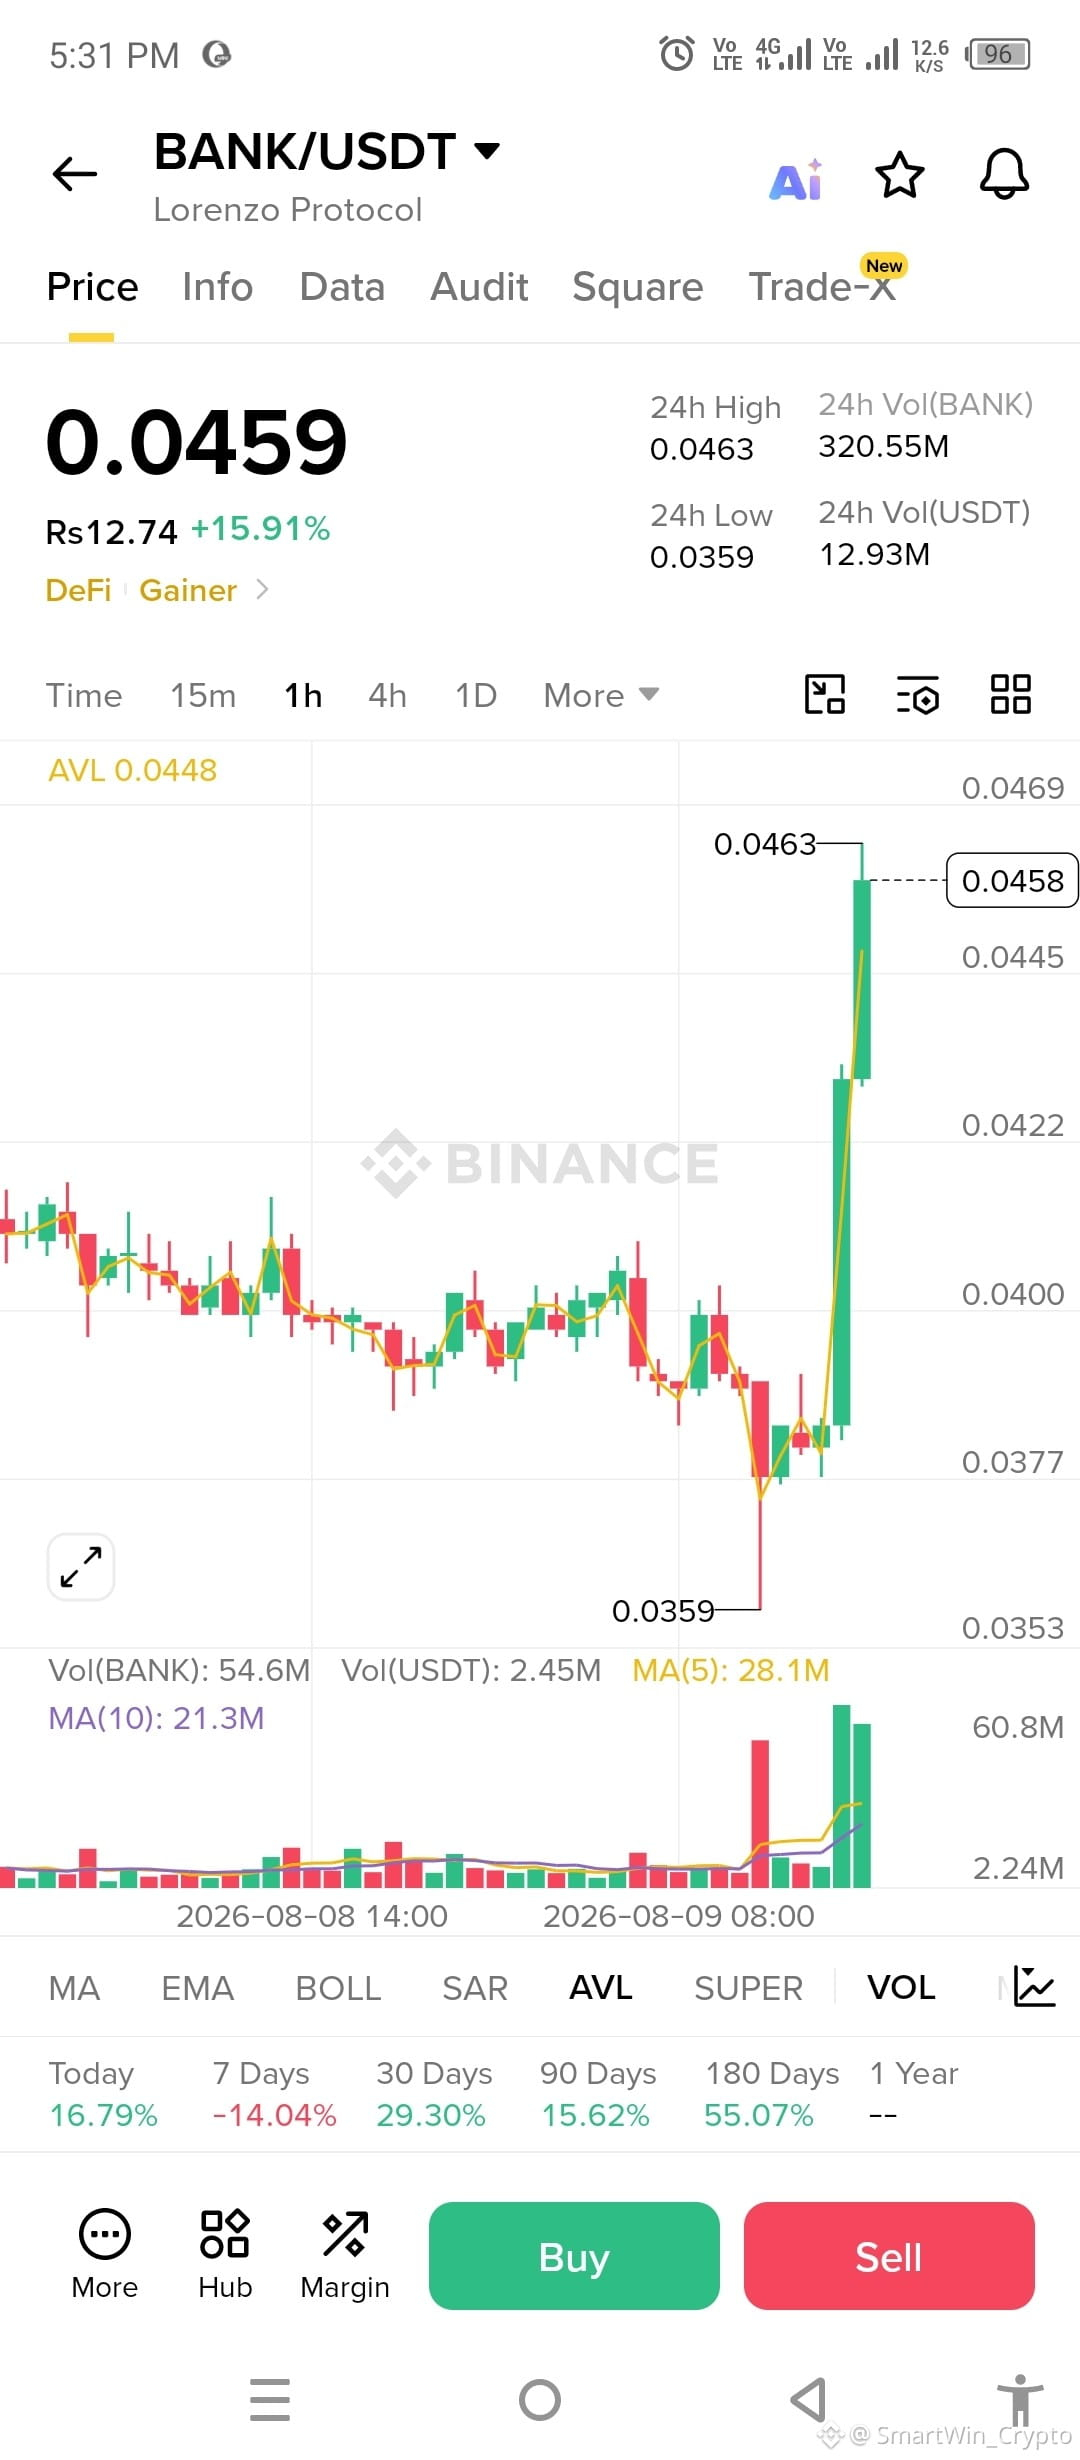
$BANK /USDT Analyse Spot
Wenn man jetzt bei 0,0459 kauft. Der Chart zeigt einen sehr scharfen Ausbruch von ca. 0,0377 auf 0,0463 mit sehr hohem Volumen, daher ist der Kurs „verlängert“ und könnte zurückkommen.
🟢 Widerstand: 0,0463–0,0470
🟡 Besserer Einstieg: ca. 0,0420–0,0430, falls es zurücksetzt und hält
🟡 Stärkerer Support: ca. 0,0400
🔴 Wenn es ca. 0,0377 verliert, schwächt sich die Ausbruchsstruktur deutlich.
Beste Spot-Strategie: auf einen Rücksetzer/Retest im Bereich 0,042–0,043 warten, statt die senkrechte grüne Kerze zu kaufen. Wenn es sich oberhalb von 0,043 konsolidiert und das Volumen gesund bleibt, wäre das eine sicherere Bestätigung.
Fazit: 🟡 Warten — kein idealer Einstieg bei 0,0459.$BANK
#BIP110SoftForkAttemptBegins
HINWEIS : Recherchiere selbst (DYOR)
Die obige erklärte Analyse ist meine eigene Arbeit. Das ist keine Finanzberatung. Bitte mach deine eigene Recherche, bevor du investierst.
$BANK /USDT Analyse Spot
Wenn man jetzt bei 0,0459 kauft. Der Chart zeigt einen sehr scharfen Ausbruch von ca. 0,0377 auf 0,0463 mit sehr hohem Volumen, daher ist der Kurs „verlängert“ und könnte zurückkommen.
🟢 Widerstand: 0,0463–0,0470
🟡 Besserer Einstieg: ca. 0,0420–0,0430, falls es zurücksetzt und hält
🟡 Stärkerer Support: ca. 0,0400
🔴 Wenn es ca. 0,0377 verliert, schwächt sich die Ausbruchsstruktur deutlich.
Beste Spot-Strategie: auf einen Rücksetzer/Retest im Bereich 0,042–0,043 warten, statt die senkrechte grüne Kerze zu kaufen. Wenn es sich oberhalb von 0,043 konsolidiert und das Volumen gesund bleibt, wäre das eine sicherere Bestätigung.
Fazit: 🟡 Warten — kein idealer Einstieg bei 0,0459.$BANK
#BIP110SoftForkAttemptBegins
HINWEIS : Recherchiere selbst (DYOR)
Die obige erklärte Analyse ist meine eigene Arbeit. Das ist keine Finanzberatung. Bitte mach deine eigene Recherche, bevor du investierst.
Wenn man jetzt bei 0,0459 kauft. Der Chart zeigt einen sehr scharfen Ausbruch von ca. 0,0377 auf 0,0463 mit sehr hohem Volumen, daher ist der Kurs „verlängert“ und könnte zurückkommen.
🟢 Widerstand: 0,0463–0,0470
🟡 Besserer Einstieg: ca. 0,0420–0,0430, falls es zurücksetzt und hält
🟡 Stärkerer Support: ca. 0,0400
🔴 Wenn es ca. 0,0377 verliert, schwächt sich die Ausbruchsstruktur deutlich.
Beste Spot-Strategie: auf einen Rücksetzer/Retest im Bereich 0,042–0,043 warten, statt die senkrechte grüne Kerze zu kaufen. Wenn es sich oberhalb von 0,043 konsolidiert und das Volumen gesund bleibt, wäre das eine sicherere Bestätigung.
Fazit: 🟡 Warten — kein idealer Einstieg bei 0,0459.$BANK
#BIP110SoftForkAttemptBegins
HINWEIS : Recherchiere selbst (DYOR)
Die obige erklärte Analyse ist meine eigene Arbeit. Das ist keine Finanzberatung. Bitte mach deine eigene Recherche, bevor du investierst.
175
·
--
Bullisch
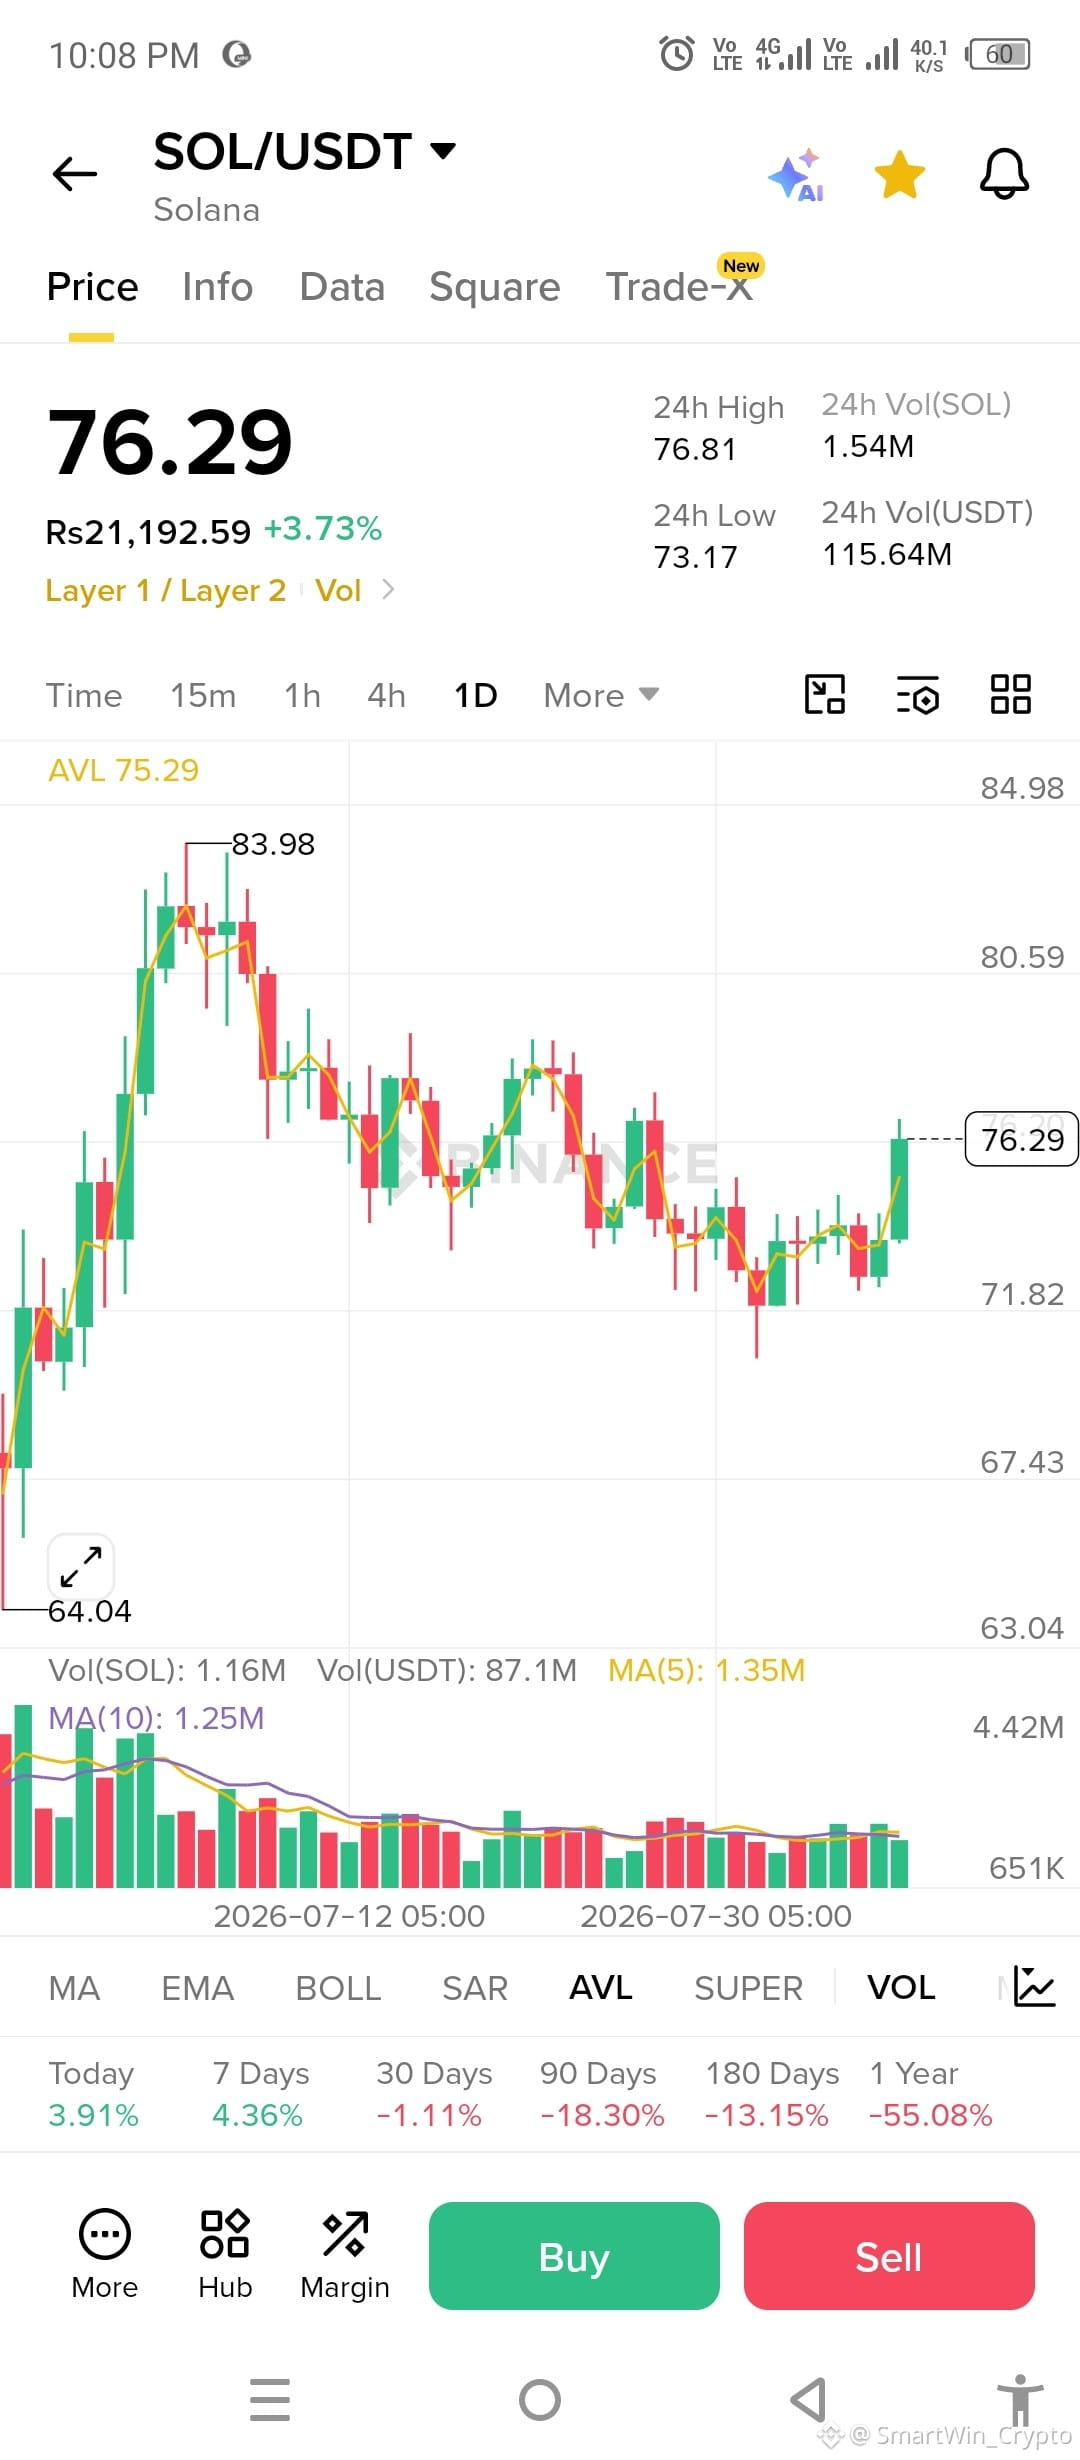
🟡$SOL Wenn du bei 76,29 $ kaufst.🟡
Bessere Einstiegslage: 73–74 $
Breakout-Kauf: über 77–78 $ mit starkem Volumen
Unterstützung: 71–72 $
Widerstand: 80–81 $, dann $84
👉 Meine Wahl: Abwarten auf einen Rücksetzer oder einen bestätigten Breakout statt jetzt hinterherzulaufen.
#SOL/USDT
HINWEIS: Informiere dich selbst (DYOR).
Die obige Analyse ist meine eigene Arbeit. Das ist keine Finanzberatung. Bitte mach deine eigene Recherche, bevor du investierst. 🤔
🟡$SOL Wenn du bei 76,29 $ kaufst.🟡
Bessere Einstiegslage: 73–74 $
Breakout-Kauf: über 77–78 $ mit starkem Volumen
Unterstützung: 71–72 $
Widerstand: 80–81 $, dann $84
👉 Meine Wahl: Abwarten auf einen Rücksetzer oder einen bestätigten Breakout statt jetzt hinterherzulaufen.
#SOL/USDT
HINWEIS: Informiere dich selbst (DYOR).
Die obige Analyse ist meine eigene Arbeit. Das ist keine Finanzberatung. Bitte mach deine eigene Recherche, bevor du investierst. 🤔
Bessere Einstiegslage: 73–74 $
Breakout-Kauf: über 77–78 $ mit starkem Volumen
Unterstützung: 71–72 $
Widerstand: 80–81 $, dann $84
👉 Meine Wahl: Abwarten auf einen Rücksetzer oder einen bestätigten Breakout statt jetzt hinterherzulaufen.
#SOL/USDT
HINWEIS: Informiere dich selbst (DYOR).
Die obige Analyse ist meine eigene Arbeit. Das ist keine Finanzberatung. Bitte mach deine eigene Recherche, bevor du investierst. 🤔
84
·
--
Bullisch
🟡 $ERA Aktuell: 0,0692$
Support: 0,060–0,066$
Ausbruchsniveau: 0,0763$
Beste Vorgehensweise: jetzt eine kleine Position eingehen oder auf den Ausbruch über 0,0763$ warten
Wenn 0,0602 stark bricht → vermeiden/Trade beenden
Targets nach dem Ausbruch: 0,085 → 0,097 → 0,11+
Insgesamt: Hochrisiko-Accumulationszone, noch kein starkes Kaufsignal.
HINWEIS: INFORMIERE DICH SELBST (DYOR)
Die oben erklärte Analyse ist meine eigene Arbeit. Das ist keine Finanzberatung. Bitte mach deine eigene Recherche, bevor du investierst. #ERA
🟡 $ERA Aktuell: 0,0692$
Support: 0,060–0,066$
Ausbruchsniveau: 0,0763$
Beste Vorgehensweise: jetzt eine kleine Position eingehen oder auf den Ausbruch über 0,0763$ warten
Wenn 0,0602 stark bricht → vermeiden/Trade beenden
Targets nach dem Ausbruch: 0,085 → 0,097 → 0,11+
Insgesamt: Hochrisiko-Accumulationszone, noch kein starkes Kaufsignal.
HINWEIS: INFORMIERE DICH SELBST (DYOR)
Die oben erklärte Analyse ist meine eigene Arbeit. Das ist keine Finanzberatung. Bitte mach deine eigene Recherche, bevor du investierst. #ERA
Support: 0,060–0,066$
Ausbruchsniveau: 0,0763$
Beste Vorgehensweise: jetzt eine kleine Position eingehen oder auf den Ausbruch über 0,0763$ warten
Wenn 0,0602 stark bricht → vermeiden/Trade beenden
Targets nach dem Ausbruch: 0,085 → 0,097 → 0,11+
Insgesamt: Hochrisiko-Accumulationszone, noch kein starkes Kaufsignal.
HINWEIS: INFORMIERE DICH SELBST (DYOR)
Die oben erklärte Analyse ist meine eigene Arbeit. Das ist keine Finanzberatung. Bitte mach deine eigene Recherche, bevor du investierst. #ERA
190
·
--
Bullisch
$XRP ist für Tempo gebaut. ⚡ Mit Transaktionen, die in nur 3–5 Sekunden abgewickelt werden, und niedrigen Gebühren unterstützt es grenzüberschreitende Zahlungen, Liquidität und einen nahtlosen Werttransfer auf dem XRP Ledger. Die Zukunft globaler Zahlungen ist schnell. 🌍💸 #XRP #XRPL #Crypto #Blockchain $XRP
$XRP ist für Tempo gebaut. ⚡ Mit Transaktionen, die in nur 3–5 Sekunden abgewickelt werden, und niedrigen Gebühren unterstützt es grenzüberschreitende Zahlungen, Liquidität und einen nahtlosen Werttransfer auf dem XRP Ledger. Die Zukunft globaler Zahlungen ist schnell. 🌍💸 #XRP #XRPL #Crypto #Blockchain $XRP
115
·
--
Bullisch
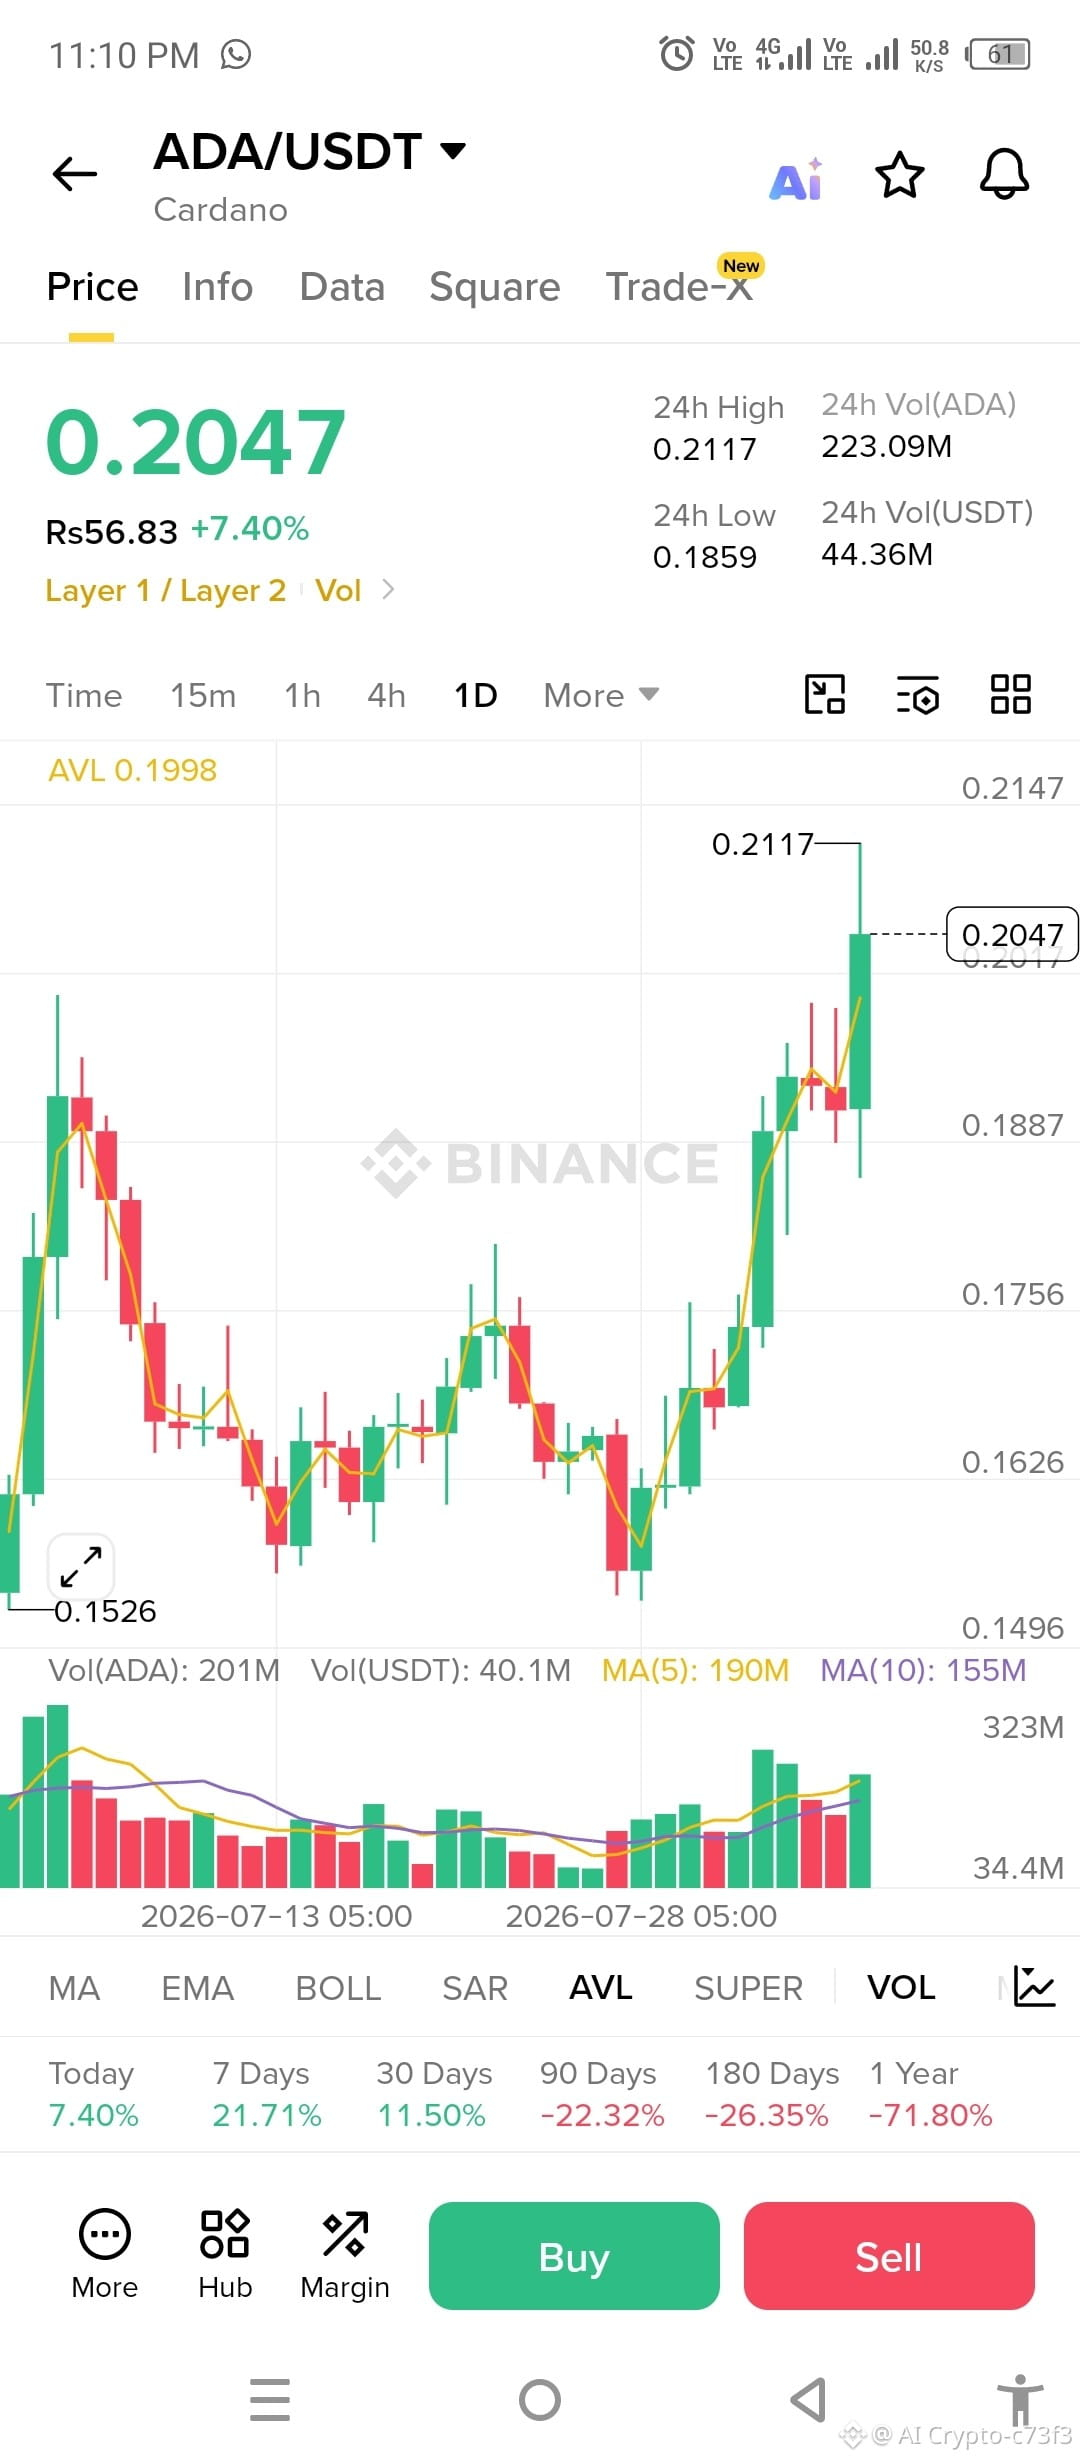
$ADA /USDT-Chartanalyse für einen Spot-Kauf.
Sieht bullisch aus
Starker Ausbruch: ADA ist von etwa 0,15 auf 0,20 gestiegen, mit mehreren starken grünen Kerzen.
Höhere Hochs und höhere Tiefs: Das ist ein klassischer kurzfristiger Aufwärtstrend.
Hohe Umsätze: Die neueste grüne Kerze hat relativ starkes Volumen, was darauf hindeutet, dass Käufer aktiv sind.
Kurs über gleitenden Durchschnitten: Das ist in der Regel ein positives Zeichen dafür, dass der Momentum weiterhin bullisch ist.
Was mich vorsichtig macht
Nahe am jüngsten Widerstand: Der Chart zeigt ein jüngstes Hoch bei etwa 0,2117. Der aktuelle Kurs liegt bei 0,2047, also in der Nähe des Widerstands.
Schon weit gelaufen: Nach einem kräftigen Anstieg von ungefähr 30%+ kann ein sofortiger Kauf nach einer großen grünen Kerze dazu führen, dass du in einen Rücksetzer hineingerätst.
Risiko von Gewinnmitnahmen: Trader, die tiefer eingestiegen sind, könnten nahe dem vorherigen Hoch verkaufen.
Kaufplan für Spot
Option 1 (geringeres Risiko):
Warte auf einen Rücksetzer in den Bereich 0,192–0,198.
Wenn der Kurs dort hält und Käufer wieder einsteigen, wäre das ein besserer Einstieg mit günstigem Chance/Risiko-Verhältnis.
Option 2 (Momentum-Kauf):
Wenn ADA im Tageschart über 0,212 schließt, bei starkem Volumen, würde das den Ausbruch bestätigen.
In dem Fall kann es sinnvoll sein, eine Teilposition zu kaufen.
Wenn du jetzt kaufen willst
Statt dein gesamtes Geld bei 0,2047 zu investieren, überlege:
Kaufe jetzt 25–40%.
Halte den Rest an Mitteln bereit, um bei einem Rückgang Richtung 0,195–0,190 zu kaufen.
Unterstützung und Widerstand
Widerstand: 0,212, dann 0,225–0,235.
Unterstützung: 0,198, dann 0,188, dann 0,175.
Gesamtbild
Ich würde das für den kurzfristigen Zeitraum als moderat bullisch bewerten (ca. 7,5/10). Der Trend ist positiv, aber weil der Kurs nach einer starken Rallye dem Widerstand entgegengeht, würde ich entweder:
jetzt nur eine kleine Position kaufen oder
auf einen Rücksetzer bzw. einen bestätigten Ausbruch warten, bevor du mehr Kapital einsetzt.
HINWEIS: MACH DEINE EIGENE RECHERCHE
Die oben erklärte Analyse ist meine eigene Arbeit. Das ist keine Finanzberatung. Bitte mach deine eigene Recherche, bevor du investierst.$ADA
$ADA /USDT-Chartanalyse für einen Spot-Kauf.
Sieht bullisch aus
Starker Ausbruch: ADA ist von etwa 0,15 auf 0,20 gestiegen, mit mehreren starken grünen Kerzen.
Höhere Hochs und höhere Tiefs: Das ist ein klassischer kurzfristiger Aufwärtstrend.
Hohe Umsätze: Die neueste grüne Kerze hat relativ starkes Volumen, was darauf hindeutet, dass Käufer aktiv sind.
Kurs über gleitenden Durchschnitten: Das ist in der Regel ein positives Zeichen dafür, dass der Momentum weiterhin bullisch ist.
Was mich vorsichtig macht
Nahe am jüngsten Widerstand: Der Chart zeigt ein jüngstes Hoch bei etwa 0,2117. Der aktuelle Kurs liegt bei 0,2047, also in der Nähe des Widerstands.
Schon weit gelaufen: Nach einem kräftigen Anstieg von ungefähr 30%+ kann ein sofortiger Kauf nach einer großen grünen Kerze dazu führen, dass du in einen Rücksetzer hineingerätst.
Risiko von Gewinnmitnahmen: Trader, die tiefer eingestiegen sind, könnten nahe dem vorherigen Hoch verkaufen.
Kaufplan für Spot
Option 1 (geringeres Risiko):
Warte auf einen Rücksetzer in den Bereich 0,192–0,198.
Wenn der Kurs dort hält und Käufer wieder einsteigen, wäre das ein besserer Einstieg mit günstigem Chance/Risiko-Verhältnis.
Option 2 (Momentum-Kauf):
Wenn ADA im Tageschart über 0,212 schließt, bei starkem Volumen, würde das den Ausbruch bestätigen.
In dem Fall kann es sinnvoll sein, eine Teilposition zu kaufen.
Wenn du jetzt kaufen willst
Statt dein gesamtes Geld bei 0,2047 zu investieren, überlege:
Kaufe jetzt 25–40%.
Halte den Rest an Mitteln bereit, um bei einem Rückgang Richtung 0,195–0,190 zu kaufen.
Unterstützung und Widerstand
Widerstand: 0,212, dann 0,225–0,235.
Unterstützung: 0,198, dann 0,188, dann 0,175.
Gesamtbild
Ich würde das für den kurzfristigen Zeitraum als moderat bullisch bewerten (ca. 7,5/10). Der Trend ist positiv, aber weil der Kurs nach einer starken Rallye dem Widerstand entgegengeht, würde ich entweder:
jetzt nur eine kleine Position kaufen oder
auf einen Rücksetzer bzw. einen bestätigten Ausbruch warten, bevor du mehr Kapital einsetzt.
HINWEIS: MACH DEINE EIGENE RECHERCHE
Die oben erklärte Analyse ist meine eigene Arbeit. Das ist keine Finanzberatung. Bitte mach deine eigene Recherche, bevor du investierst.$ADA
Sieht bullisch aus
Starker Ausbruch: ADA ist von etwa 0,15 auf 0,20 gestiegen, mit mehreren starken grünen Kerzen.
Höhere Hochs und höhere Tiefs: Das ist ein klassischer kurzfristiger Aufwärtstrend.
Hohe Umsätze: Die neueste grüne Kerze hat relativ starkes Volumen, was darauf hindeutet, dass Käufer aktiv sind.
Kurs über gleitenden Durchschnitten: Das ist in der Regel ein positives Zeichen dafür, dass der Momentum weiterhin bullisch ist.
Was mich vorsichtig macht
Nahe am jüngsten Widerstand: Der Chart zeigt ein jüngstes Hoch bei etwa 0,2117. Der aktuelle Kurs liegt bei 0,2047, also in der Nähe des Widerstands.
Schon weit gelaufen: Nach einem kräftigen Anstieg von ungefähr 30%+ kann ein sofortiger Kauf nach einer großen grünen Kerze dazu führen, dass du in einen Rücksetzer hineingerätst.
Risiko von Gewinnmitnahmen: Trader, die tiefer eingestiegen sind, könnten nahe dem vorherigen Hoch verkaufen.
Kaufplan für Spot
Option 1 (geringeres Risiko):
Warte auf einen Rücksetzer in den Bereich 0,192–0,198.
Wenn der Kurs dort hält und Käufer wieder einsteigen, wäre das ein besserer Einstieg mit günstigem Chance/Risiko-Verhältnis.
Option 2 (Momentum-Kauf):
Wenn ADA im Tageschart über 0,212 schließt, bei starkem Volumen, würde das den Ausbruch bestätigen.
In dem Fall kann es sinnvoll sein, eine Teilposition zu kaufen.
Wenn du jetzt kaufen willst
Statt dein gesamtes Geld bei 0,2047 zu investieren, überlege:
Kaufe jetzt 25–40%.
Halte den Rest an Mitteln bereit, um bei einem Rückgang Richtung 0,195–0,190 zu kaufen.
Unterstützung und Widerstand
Widerstand: 0,212, dann 0,225–0,235.
Unterstützung: 0,198, dann 0,188, dann 0,175.
Gesamtbild
Ich würde das für den kurzfristigen Zeitraum als moderat bullisch bewerten (ca. 7,5/10). Der Trend ist positiv, aber weil der Kurs nach einer starken Rallye dem Widerstand entgegengeht, würde ich entweder:
jetzt nur eine kleine Position kaufen oder
auf einen Rücksetzer bzw. einen bestätigten Ausbruch warten, bevor du mehr Kapital einsetzt.
HINWEIS: MACH DEINE EIGENE RECHERCHE
Die oben erklärte Analyse ist meine eigene Arbeit. Das ist keine Finanzberatung. Bitte mach deine eigene Recherche, bevor du investierst.$ADA
145
Anmelden und weiter Inhalte entdecken
Krypto-Nutzer weltweit auf Binance Square kennenlernen
⚡️ Bleib in Sachen Krypto stets am Puls.
💬 Die weltgrößte Kryptobörse vertraut darauf.
👍 Erhalte verlässliche Einblicke von verifizierten Creators.
E-Mail-Adresse/Telefonnummer
Trendthemen
CircleMints500MUSDCOnSolana
97,812 Aufrufe
2,096 Kommentare
#circlemints500musdconsolana
🚨 500 Mio. USDC AUF SOLANA GEMINTET! 💵🔥
Circle Treasury hat 500 Mio. USDC auf Solana geprägt und damit die gesamte globale Versorgung auf 75,2 Mrd. $ erhöht! 📈✨
💡 Kurzer Realitätscheck:
🔹 Minting = Frische Warenbestände (nicht sofortige Kaufkraft!🛒
🔹 Der echte Auslöser = Kapital, das in DeFi, Börsen & Pools fließt! 🌐🚀
🎯 Coins, die du im Blick behalten solltest:
⚡ $SOL — Die Netzwerkaktivität boomt, und frische Liquidität treibt weiterhin das Wachstum des Ökosystems an!
💎 $RARE — Ein Altcoin mit hoher Volatilität, der schnell auf frische Marktliquidität und Sentiment reagiert!🪐
💥 Akkumulierst du gerade oder wartest du auf eine vollständige Kapitalbereitstellung? Schreib deine Gedanken unten! 👇✨
#CircleMints500MUSDCOnSolana
#PolymarketBankFailureBetsDrawFDICConcern
#BlackRockBuildsTokenizedPortfoliosForOndo
#BitwiseFilesToListNEARETFOnNYSEArca
Hifza Rubab
·4 Likes
·4.5k Aufrufe
PolymarketBankFailureBetsDrawFDICConcern
97,114 Aufrufe
1,862 Kommentare
BlackRockBuildsTokenizedPortfoliosForOndo
90,731 Aufrufe
1,326 Kommentare