

ch khizar998
21 Beiträge

ch khizar998
Melden
Nutzer blockieren
4 Following
5 Follower
35 Like gegeben
Beiträge
·
--
$BTC
🚀 BTC/USDT-MARKTSIGNAL
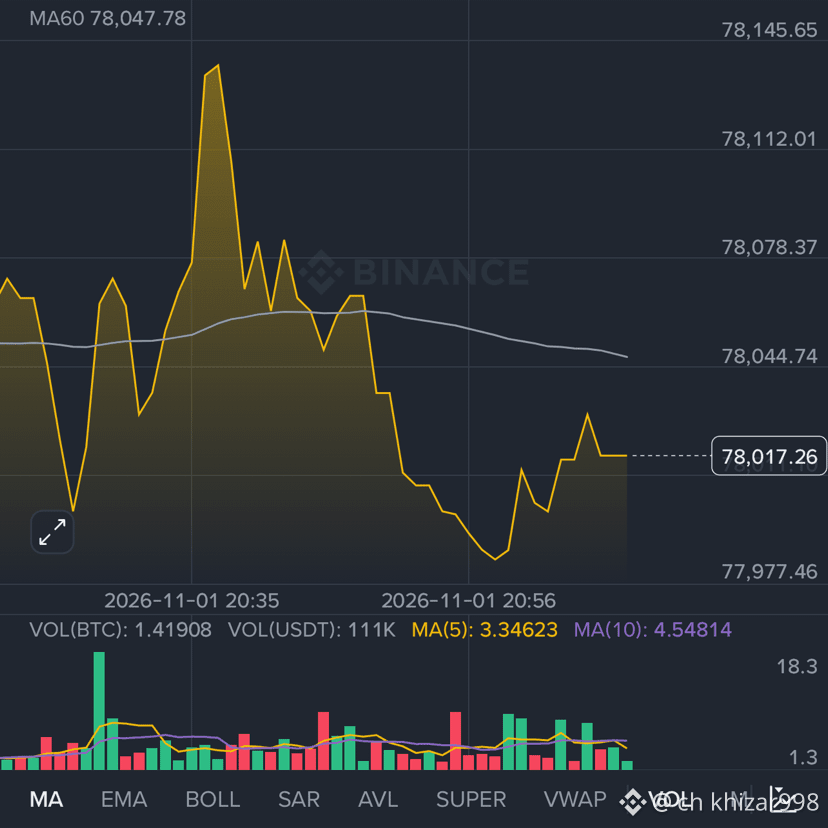
Bitcoin zeigt nach einem jüngsten Rückgang Anzeichen einer kurzfristigen Erholung. BTC wird derzeit bei etwa 78,017.25 USDT (+0.50 %) gehandelt.
📊 Marktüberblick
* Aktueller Preis: 78,017.25 USDT
* 24-Stunden-Hoch: 78,285 USDT
* 24-Stunden-Tief: 77,450 USDT
* Tagesveränderung: +0.50 %
📈 Technische Analyse
BTC versucht sich zu erholen, nachdem die Unterstützungszone bei 77,977 getestet wurde. Der Kurs liegt jedoch weiterhin unter dem MA60 bei etwa 78,047, was darauf hindeutet, dass die Aufwärtsdynamik noch bestätigt werden muss.
🟢 Bullishes Szenario
Ein Ausbruch über 78,045–78,080 könnte den Weg in Richtung 78,112 und 78,145 ebnen.
Hier handeln
#WithdrawalsBack: 15 networks live
1
80
·
--
Übersetzung ansehen
$BAT
🚨 BAT/USDT MARKET SIGNAL 🚨
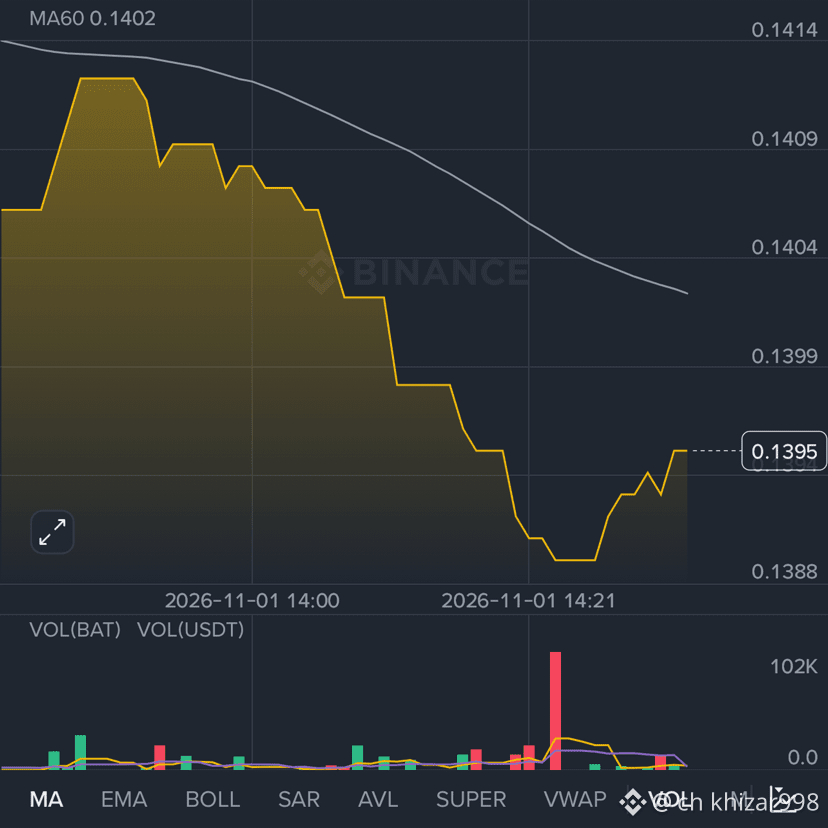
🟢 Current Price: 0.1395 USDT
📈 24H Change: +6.33%
📊 24H High: 0.1460
📉 24H Low: 0.1303
🔥 Market Analysis:
BAT is showing strong gains over the last 24 hours, but short-term price action indicates selling pressure. The price is currently attempting a recovery after a sharp decline.
📍 Key Levels:
* Resistance: 0.1402 – 0.1409
* Support: 0.1388 – 0.1390
* Breakout above 0.1409 may indicate bullish momentum.
* A breakdown below 0.1388 could bring further downside.
🎯 Trading Strategy:
Wait for confirmation before entering a trade. Monitor volume and price action around key levels.
Trade here
#BinanceHadAlreadyCovered$6BofHackLoss
150
·
--
Übersetzung ansehen
$BCH
🚀 BCH/USDT SIGNAL UPDATE 🚀
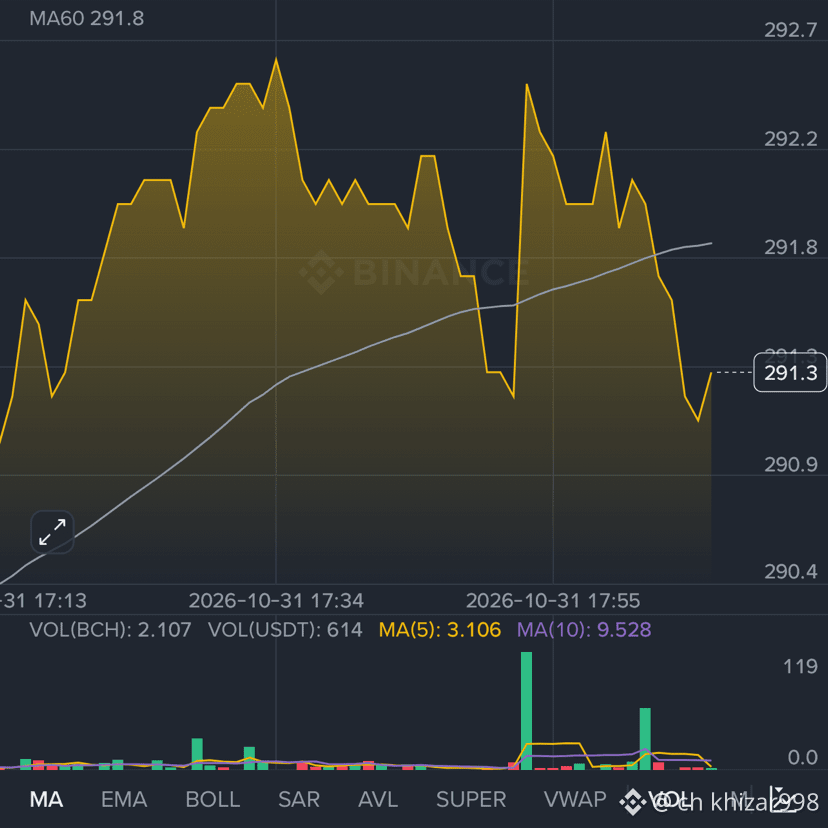
💰 Current Price: 291.3 USDT
📈 24H Change: +2.46%
🔝 24H High: 297.9
🔻 24H Low: 283.2
📊 Market Outlook:
BCH is holding above the 290.9 support zone after a recent pullback. Buyers are attempting to regain momentum, but confirmation is still needed.
🎯 Key Levels
🟢 Support: 290.9 – 290.4
🔴 Resistance: 291.8 – 292.2
🚀 Breakout Zone: Above 292.2
📈 Bullish Scenario:
A confirmed breakout above 292.2 could open the way toward 293.0 and 294.0.
Trade here
#CZSaysCompensationIsinPlaceUsersAreProtected
1
234
·
--
Übersetzung ansehen
$AAVE
AAVE/USDT — BULLISH MOMENTUM! 📈
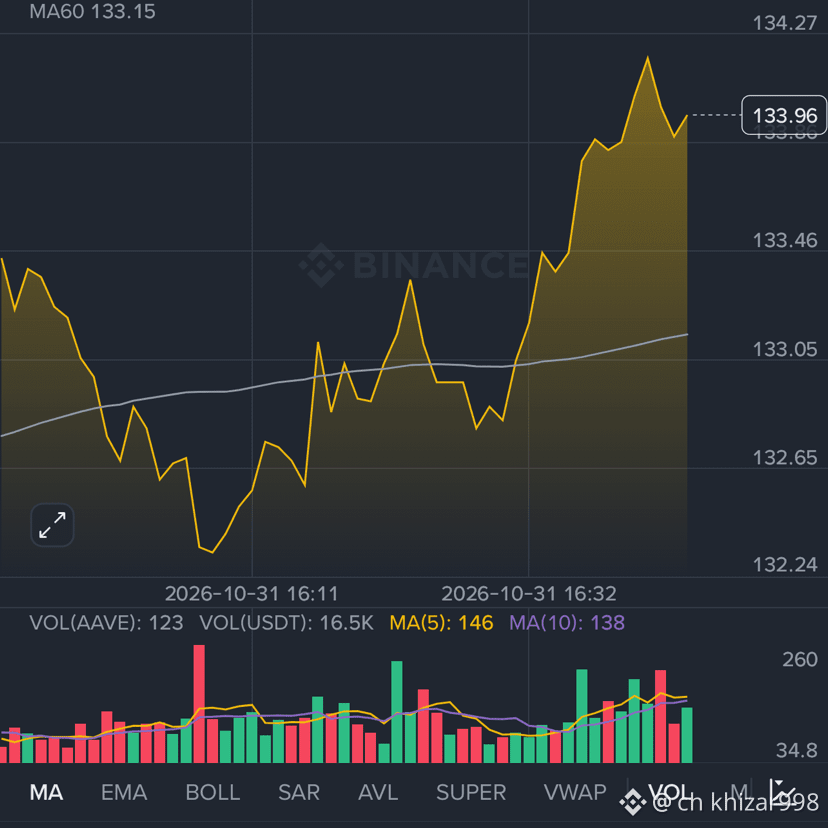
AAVE is showing strong upward momentum, currently trading at 133.96 USDT (+6.82%).
🔥 Market Update
💰 Current Price: 133.96 USDT
📈 24H High: 134.18 USDT
📉 24H Low: 123.06 USDT
🟢 Buyers are showing strength
⚡ Price is trading above MA60
🎯 Key Levels
Resistance: 134.18 – 134.50
Support: 133.05 – 132.65
📊 A breakout above 134.18 could bring further upside momentum, while a rejection may lead to a short-term pullback.
Trade here
#BinanceReports80%Recoveryof$6.3BillioninLossesfromHackIncident
1
110
·
--
$RENDER
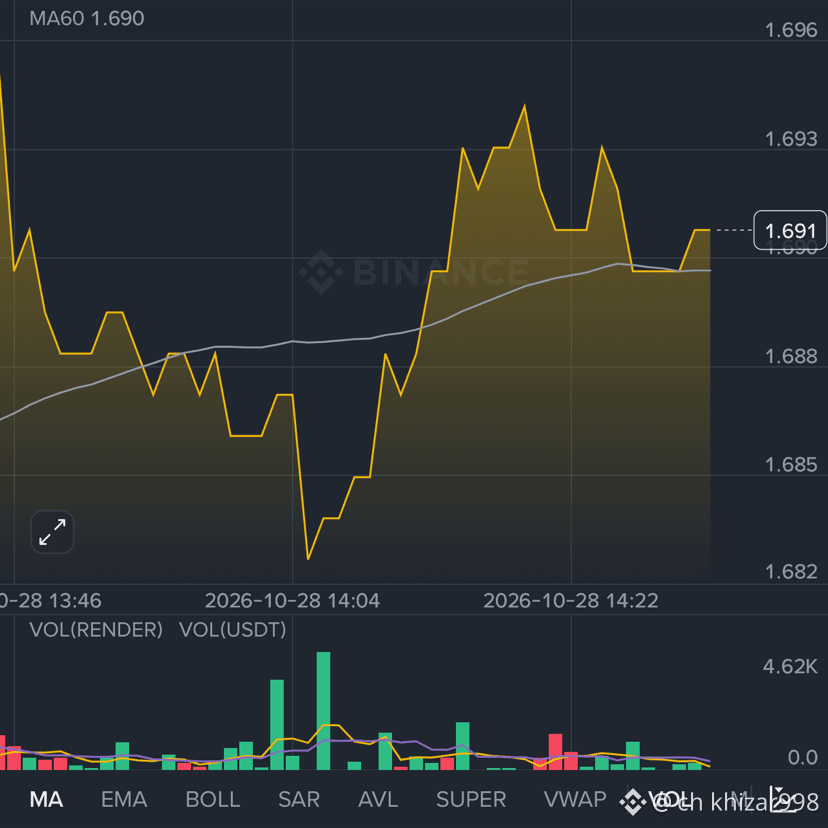
🚀 RENDER/USDT-MARKTUPDATE 📊
🟢 Aktueller Kurs: $1.691 (+1.14%)
🔥 BULLISCHES MOMENTUM BAUT SICH AUF!
📈 RENDER zeigt nach einer Erholung von der Unterstützungszone bei $1.682 Anzeichen einer Erholung. Käufer steigen ein, und der Kurs hält sich nahe $1.691.
🎯 Wichtige Niveaus im Blick
🟢 Unterstützung: $1.688 – $1.682
🔴 Widerstand: $1.693 – $1.696
Hier handeln
#EarningsSeason
2
238
·
--
Übersetzung ansehen
$IO
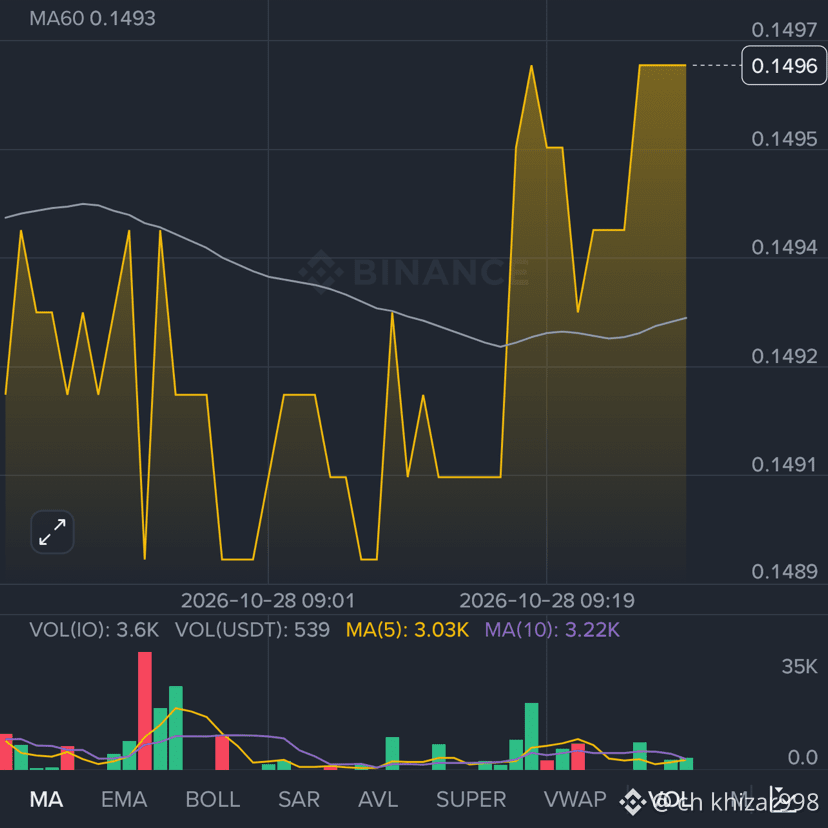
🚀 IO/USDT MARKET UPDATE 🚀
🟢 Current Price: $0.1496 (+4.32%)
📈 Bullish Momentum Building!
🔥 IO is showing strong short-term buying pressure, with price pushing toward the $0.1500 resistance zone. Trading Insight: A sustained move above $0.1500 could open the door toward $0.1527. Rejection near resistance may bring a pullback toward support.
Trade here
#FOMCWatch
4
450
·
--
$FIDA
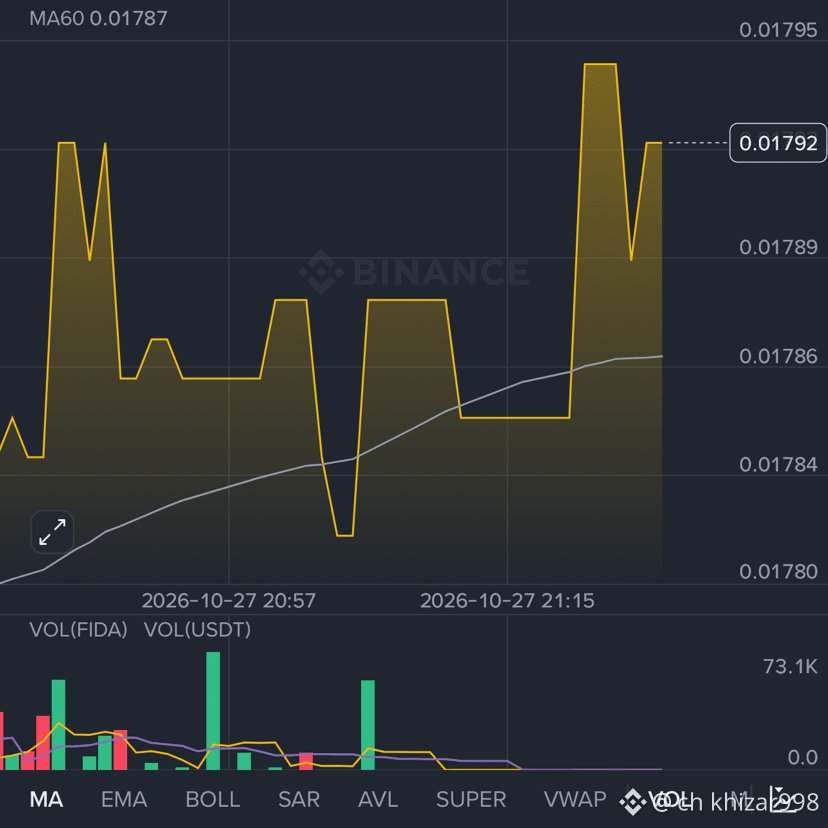
🚀 FIDA/USDT-SIGNALUPDATE 🚀
🟢 Aktueller Preis: 0.01792 USDT
📈 Veränderung in 24 Std.: +1.36%
📊 Höchststand in 24 Std.: 0.01794
📉 Tiefststand in 24 Std.: 0.01738
🔍 Marktanalyse:
FIDA zeigt kurzfristig bullisches Momentum und wird über seinem MA60 (0.01787) gehandelt. Derzeit haben die Käufer die Oberhand, doch für weitere Kursgewinne muss der Widerstand bei 0.01794–0.01795 durchbrochen werden.
🎯 Wichtige Kursmarken:
* 🟢 Widerstand: 0.01794–0.01795
* 🔵 Unterstützung: 0.01787
* 🟡 Untere Unterstützung: 0.01784–0.01780
Hier handeln
#FOMCWatch
2
411
·
--
Übersetzung ansehen
$W
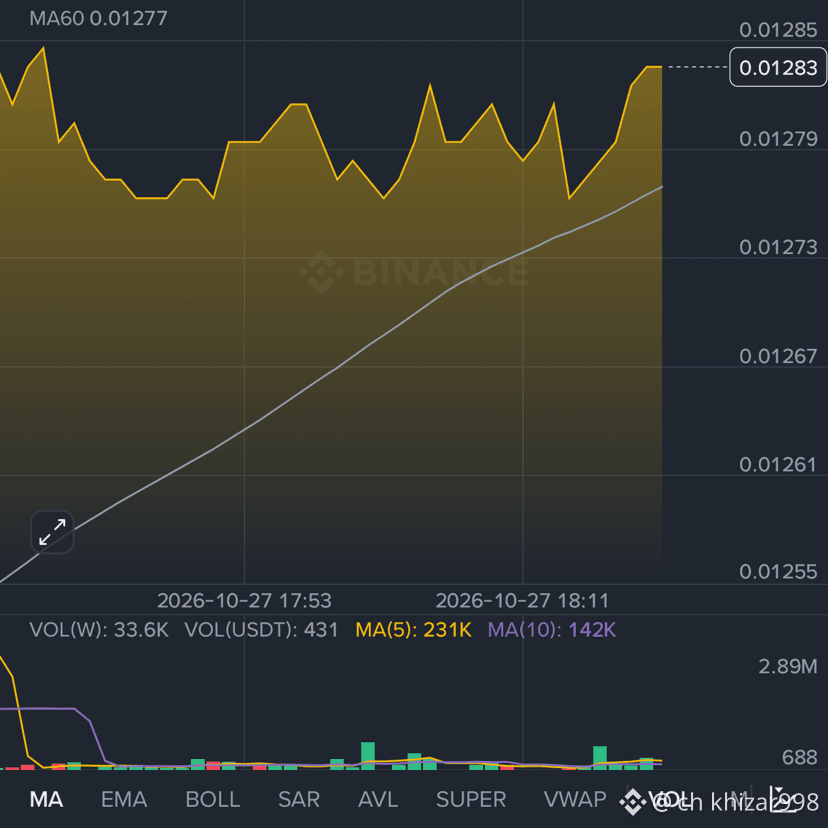
🚀 W/USDT (WORMHOLE) — MARKET SIGNAL 🔥
💰 Current Price: $0.01283
📈 24H Change: +7.36%
⬆️ 24H High: $0.01297
⬇️ 24H Low: $0.01186
📊 Technical Analysis
W/USDT is showing short-term bullish momentum and trading above the MA60 ($0.01277). Buyers currently have an advantage, but resistance near $0.01285–$0.01297 needs to be cleared for further upside.
🎯 Key Levels
🟢 Support: $0.01277 – $0.01273
🔴 Resistance: $0.01285 – $0.01297
Trade here
#FOMCWatch
2
408
·
--
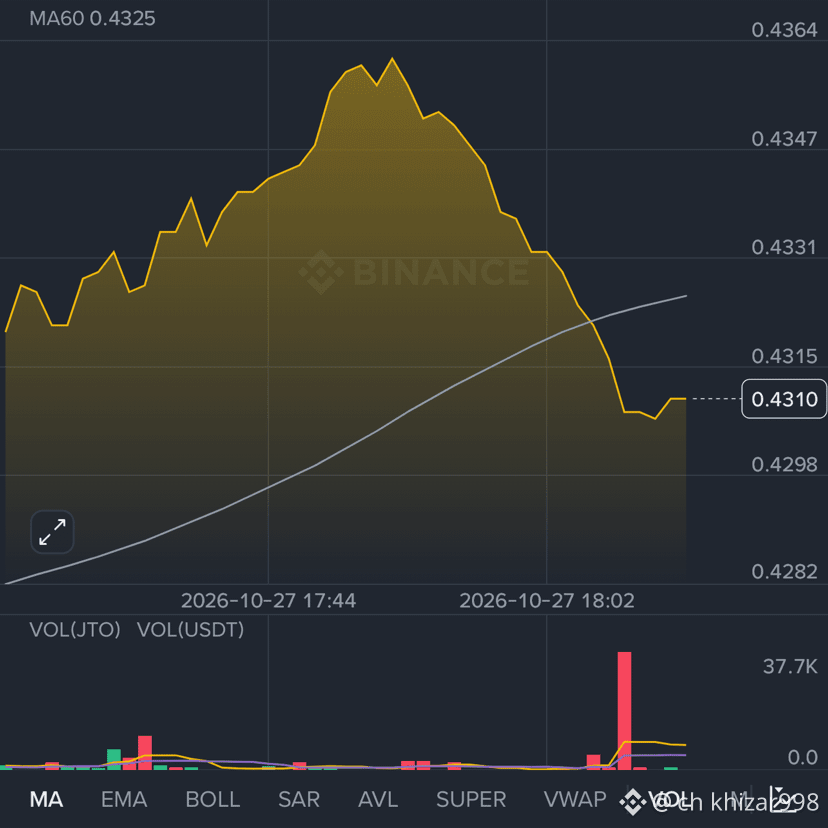
$JTO
📊 JTO/USDT-MARKTUPDATE 🔥
💰 Aktueller Preis: $0.4310
📈 24-Std.-Hoch: $0.4432
📉 24-Std.-Tief: $0.4231
🔍 Technische Analyse:
JTO steht unter kurzfristigem Verkaufsdruck, nachdem höhere Kursniveaus abgelehnt wurden. Der Kurs notiert unter dem MA60 ($0.4325), was auf einen vorsichtigen kurzfristigen Trend hindeutet.
🎯 Wichtige Kursniveaus
🟢 Unterstützung: $0.4298 – $0.4282
🔴 Widerstand: $0.4315 – $0.4347
🚀 Bedeutender Widerstand: $0.4364
Hier handeln
#FOMCWatch
2
324
·
--
Übersetzung ansehen
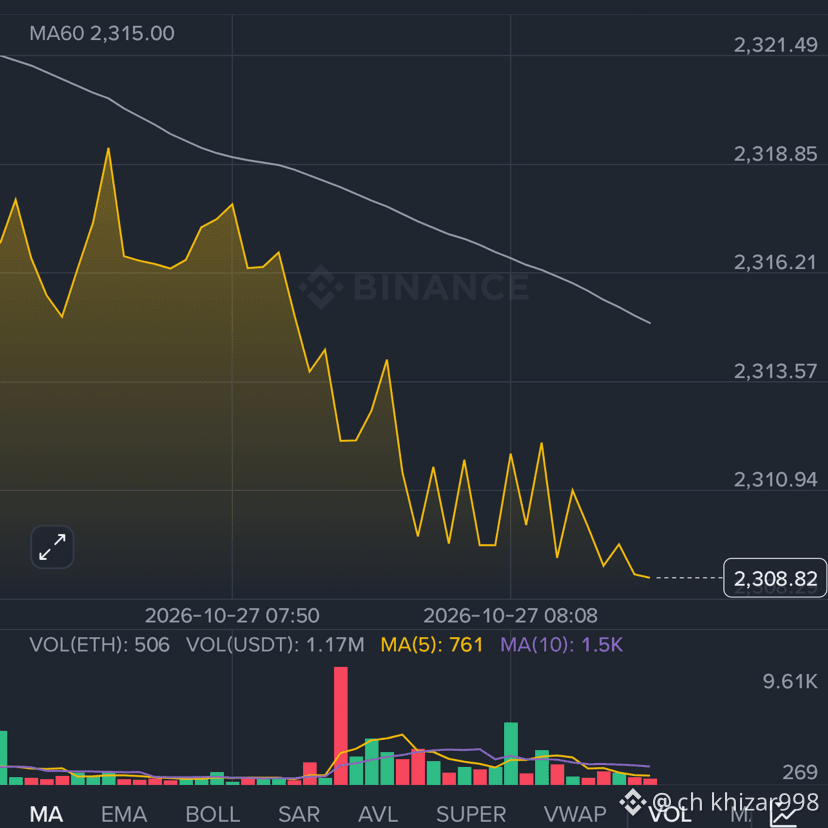
$ETH
📉 ETH/USDT MARKET UPDATE 🔥
🔴 Current Price: $2,308.82
📉 Market Trend: Bearish Pressure
📊 24H High: $2,343.79
📊 24H Low: $2,292.00
🔍 Technical Analysis:
• ETH is trading below the MA60, indicating short-term bearish momentum.
• Sellers are controlling the recent price movement.
• Order book shows 58.83% buy pressure vs. 41.17% sell pressure.
• Key support zone: $2,300–$2,292.
• Resistance zone: $2,315–$2,320.
Trade here
#EarningsSeason
2
92
·
--
Übersetzung ansehen
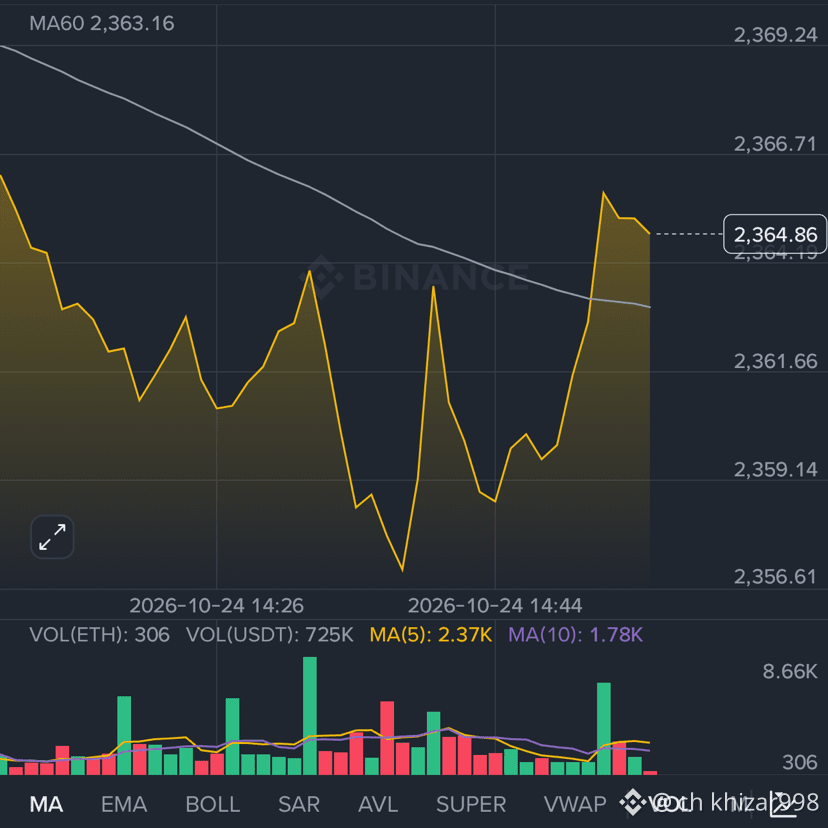
$ETH
🚨 ETHUSDT MARKET UPDATE 🚨
📊 Current Price: $2,364.86
🔴 24H Change: -1.42%
📉 Market Analysis:
ETH is showing a short-term recovery after dipping near $2,356. Buyers are stepping in, but resistance remains overhead.
🎯 Key Levels
🟢 Resistance: $2,366 – $2,370
🔴 Support: $2,359 – $2,356
📈 Trading Setup
🟢 LONG: Only after a confirmed breakout above $2,370
Trade here
#BinancePick
2
64
·
--
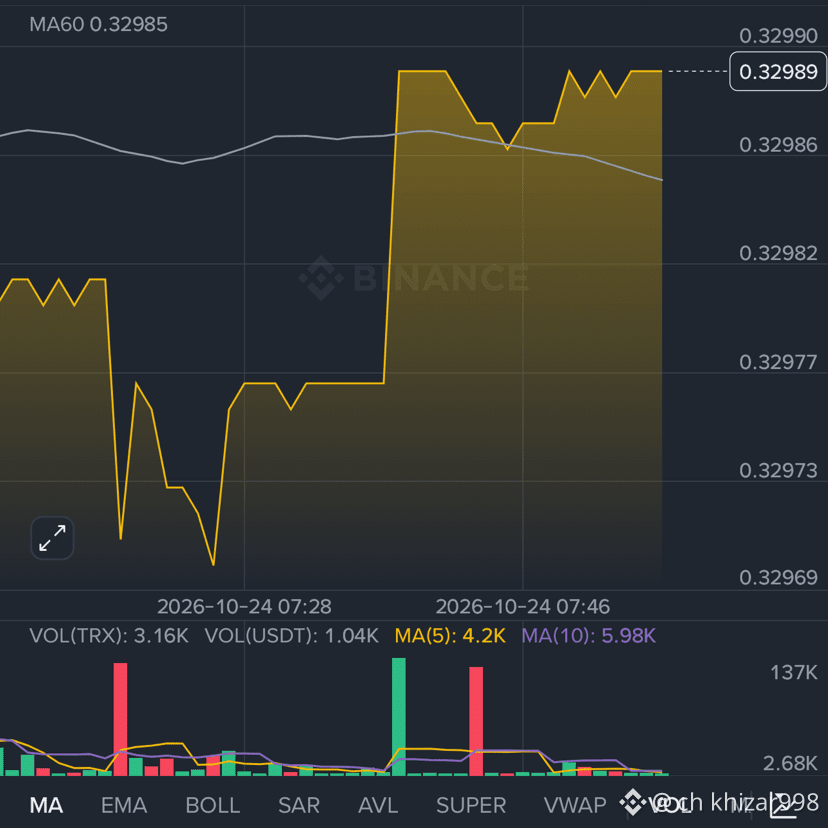
$TRX
🚀 TRX/USDT-FUTURES-SIGNAL 🚀
🟢 Marktupdate: AUFWÄRTSDYNAMIK
💰 Aktueller Preis: 0.32989 USDT
📊 Trade-Setup — LONG
* Einstiegszone: 0.32980 – 0.32995
* TP1: 0.33020
* TP2: 0.33060
* TP3: 0.33100
* Stop-Loss: 0.32950
📈 Technische Analyse:
✅ Der Preis notiert leicht über dem MA60 (0.32985).
Hier handeln
#EarningsSeason
2
111
·
--
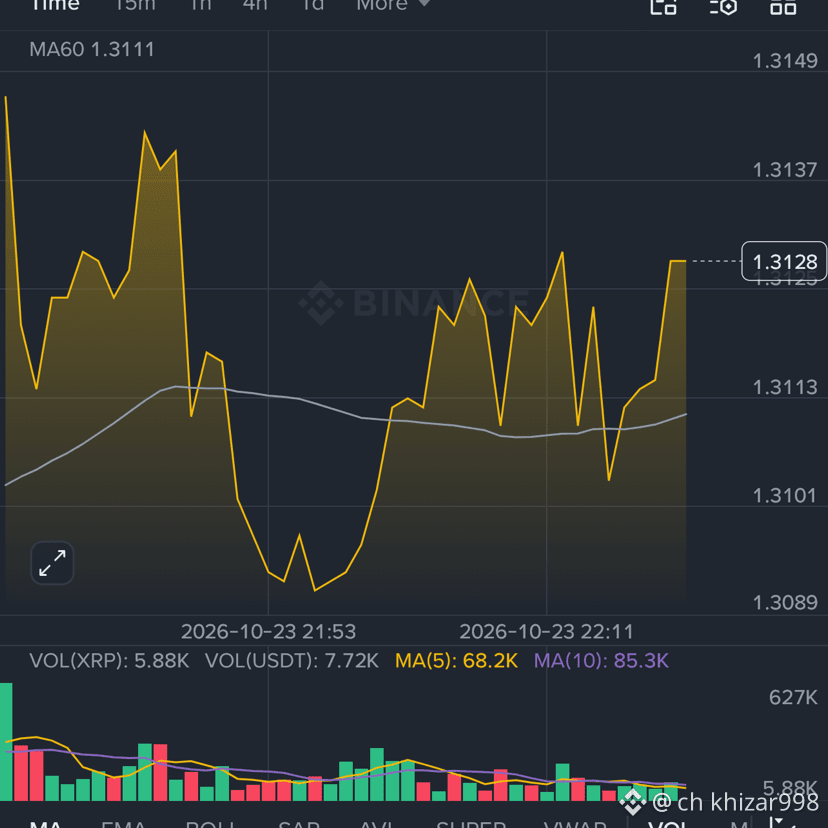
$XRP
🚨 XRP/USDT SIGNAL-UPDATE 🔥
📊 XRP-Perpetual-Futures
💰 Aktueller Preis: $1.3127
📉 Veränderung in 24 Std.: -0.27%
🔺 24-Std.-Hoch: $1.3301
🔻 24-Std.-Tief: $1.2942
📈 Technische Analyse
XRP erholt sich von den jüngsten Tiefständen und wird über dem MA60 bei etwa $1.3111 gehandelt. Der Kurs nähert sich einem kurzfristigen Widerstand, daher ist eine Bestätigung vor dem Einstieg wichtig.
🟢 LONG-SETUP
📍 Einstieg: Nach Bestätigung über $1.3135
🎯 TP1: $1.3150
🎯 TP2: $1.3170
🎯 TP3: $1.3200
🛑 Stop-Loss: $1.3105
Hier handeln
#EarningsSeason
2
131
·
--
Übersetzung ansehen
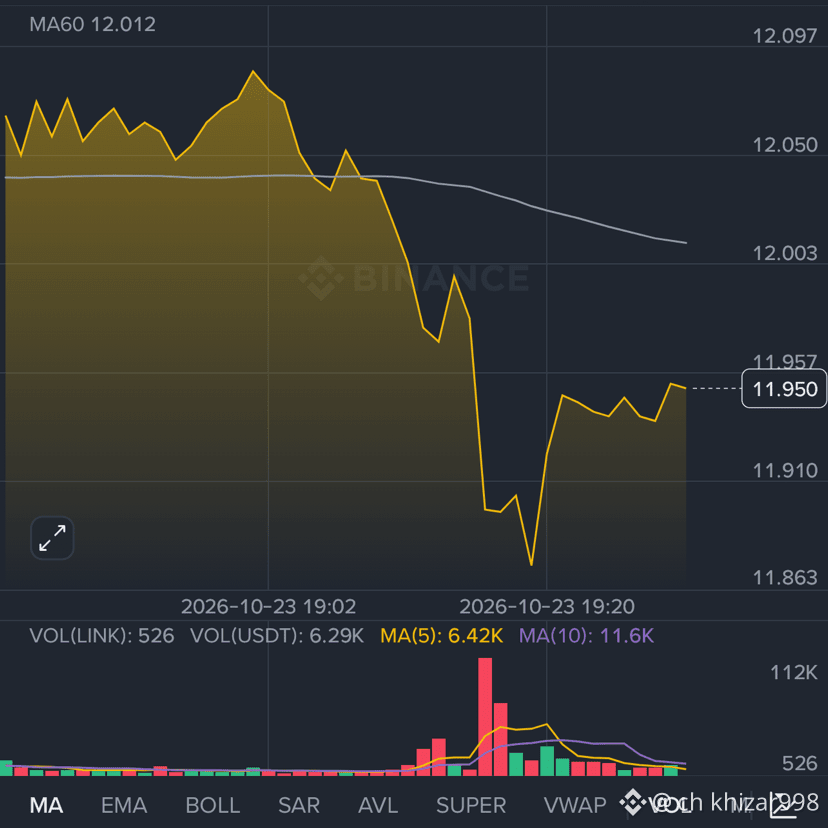
$LINK
🎯 Key Levels
🟢 Support: $11.86 – $11.90
🔴 Resistance: $11.96 – $12.02
🚀 Major Resistance: $
🚨 LINK/USDT PERP — MARKET UPDATE 📉
🔴 Current Price: $11.951
📉 24H Change: -0.77%
📊 24H High: $12.274
📊 24H Low: $11.765
Trade here
#EarningsSeason
$LINK
🎯 Key Levels
🟢 Support: $11.86 – $11.90
🔴 Resistance: $11.96 – $12.02
🚀 Major Resistance: $
🚨 LINK/USDT PERP — MARKET UPDATE 📉
🔴 Current Price: $11.951
📉 24H Change: -0.77%
📊 24H High: $12.274
📊 24H Low: $11.765
Trade here
#EarningsSeason
🎯 Key Levels
🟢 Support: $11.86 – $11.90
🔴 Resistance: $11.96 – $12.02
🚀 Major Resistance: $
🚨 LINK/USDT PERP — MARKET UPDATE 📉
🔴 Current Price: $11.951
📉 24H Change: -0.77%
📊 24H High: $12.274
📊 24H Low: $11.765
Trade here
#EarningsSeason
2
86
·
--
Übersetzung ansehen
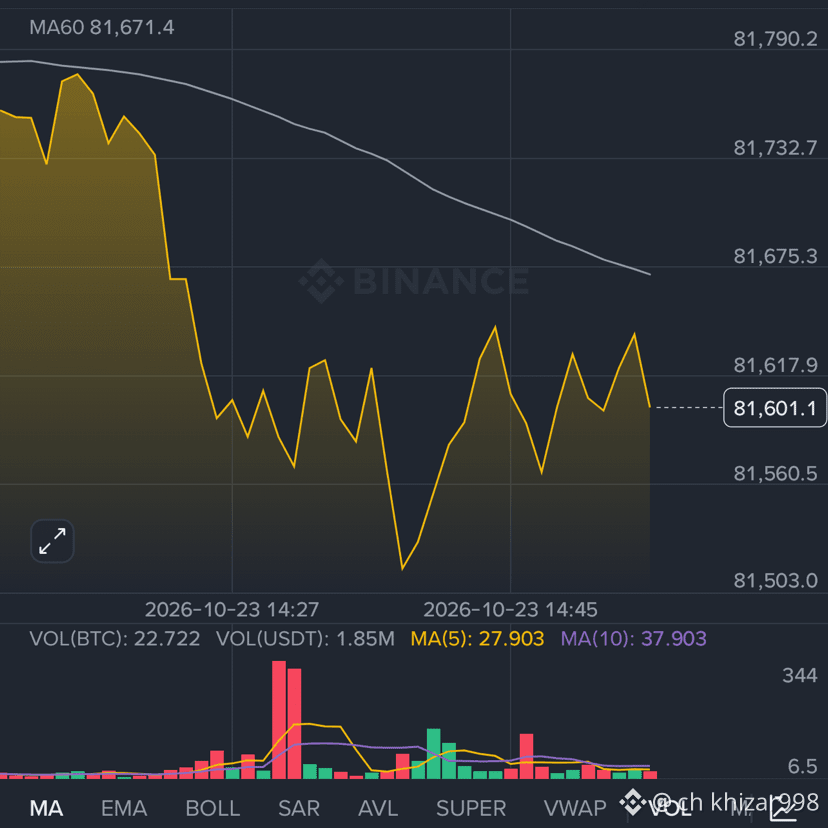
BTC
📉 BTC/USDT – SHORT BIAS
💰 Entry Zone: 81,600–81,650
🎯 TP1: 81,560
🎯 TP2: 81,503
🎯 TP3: 81,450
🛑 Stop Loss: 81,750
📊 Technical Analysis:
• Price is below MA60, indicating bearish momentum.
• Selling pressure is dominant in the order book.
• Resistance is near 81,675–81,730.
Trade here
#EarningsSeason
3
175
·
--
Übersetzung ansehen
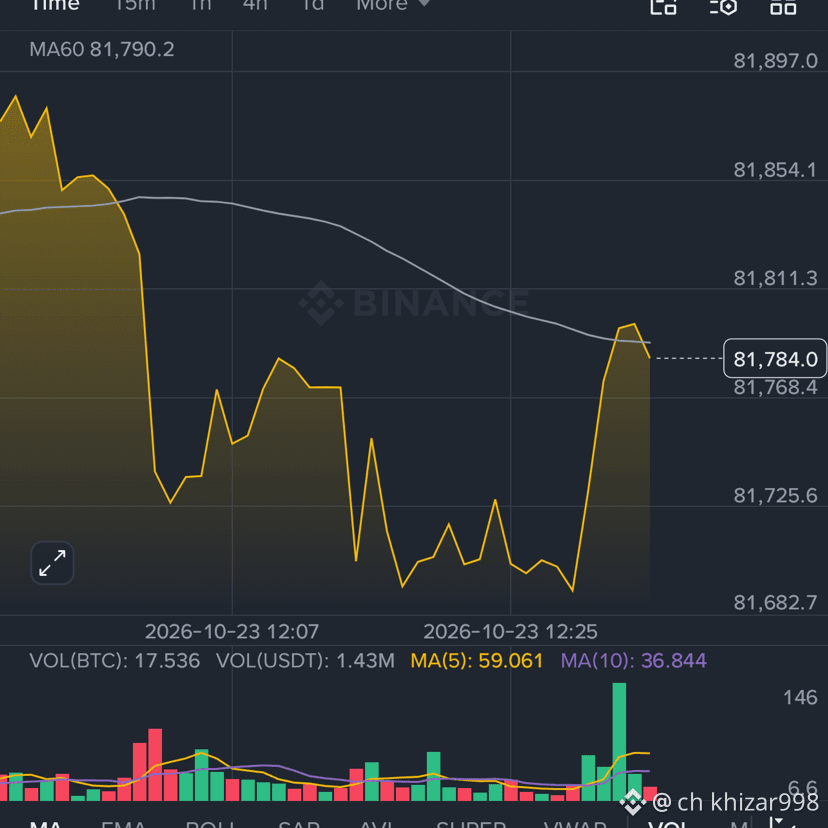
📉 BTCUSDT Market Update 📊
Bitcoin is trading around $81,784, down 0.59% on the session.
🔻 Strong bearish momentum followed by a sharp recovery.
📊 Selling pressure remains significant.
⚠️ Watch the $81,700–$81,800 zone for the next move.
Trade here
#EarningsSeason
📉 BTCUSDT Market Update 📊
Bitcoin is trading around $81,784, down 0.59% on the session.
🔻 Strong bearish momentum followed by a sharp recovery.
📊 Selling pressure remains significant.
⚠️ Watch the $81,700–$81,800 zone for the next move.
Trade here
#EarningsSeason
Bitcoin is trading around $81,784, down 0.59% on the session.
🔻 Strong bearish momentum followed by a sharp recovery.
📊 Selling pressure remains significant.
⚠️ Watch the $81,700–$81,800 zone for the next move.
Trade here
#EarningsSeason
2
54
·
--
$BTC
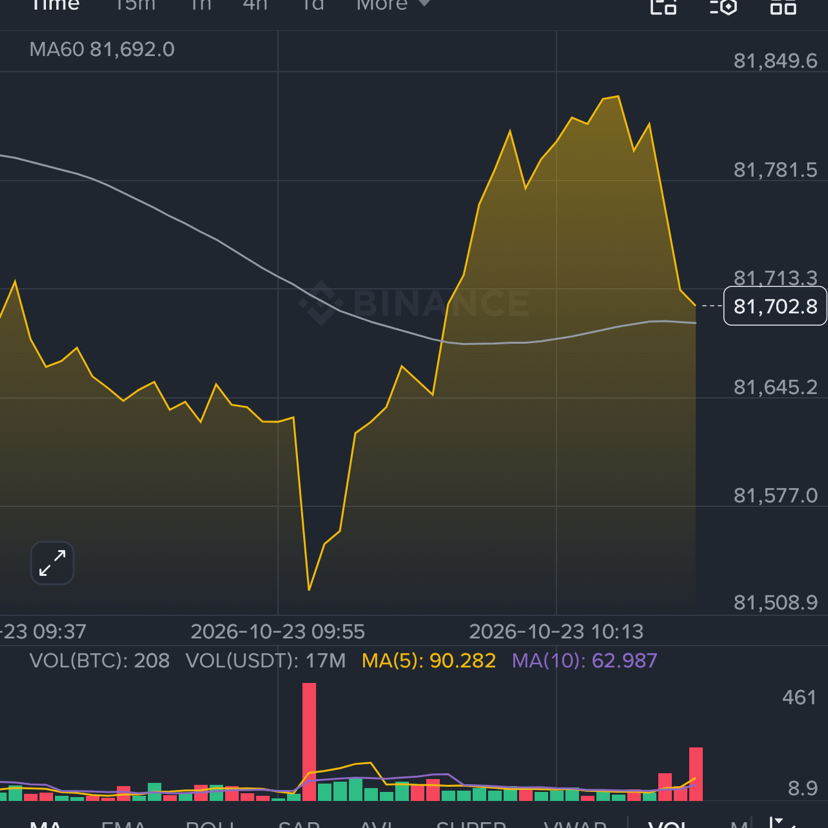
BTCUSDT — 15-Minuten-Chartanalyse 📊
Ich habe deinen Screenshot überprüft. BTC liegt im 15-Minuten-Chart bei etwa 81.702,7 USDT.
🔍 Technische Analyse
* Aktueller Preis: 81.702,7
* MA60: 81.692 — der Preis liegt leicht darüber.
* Widerstand: 81.780–81.850
* Unterstützung: 81.645 → 81.577
* Wichtiges lokales Tief: etwa 81.520
* 24-Stunden-Hoch: 82.955
* 24-Stunden-Tief: 80.888,9
Hier handeln
{future}(BTCUSDT)
#EarningsSeason
$BTC
BTCUSDT — 15-Minuten-Chartanalyse 📊
Ich habe deinen Screenshot überprüft. BTC liegt im 15-Minuten-Chart bei etwa 81.702,7 USDT.
🔍 Technische Analyse
* Aktueller Preis: 81.702,7
* MA60: 81.692 — der Preis liegt leicht darüber.
* Widerstand: 81.780–81.850
* Unterstützung: 81.645 → 81.577
* Wichtiges lokales Tief: etwa 81.520
* 24-Stunden-Hoch: 82.955
* 24-Stunden-Tief: 80.888,9
Hier handeln
#EarningsSeason
1
2
88
·
--
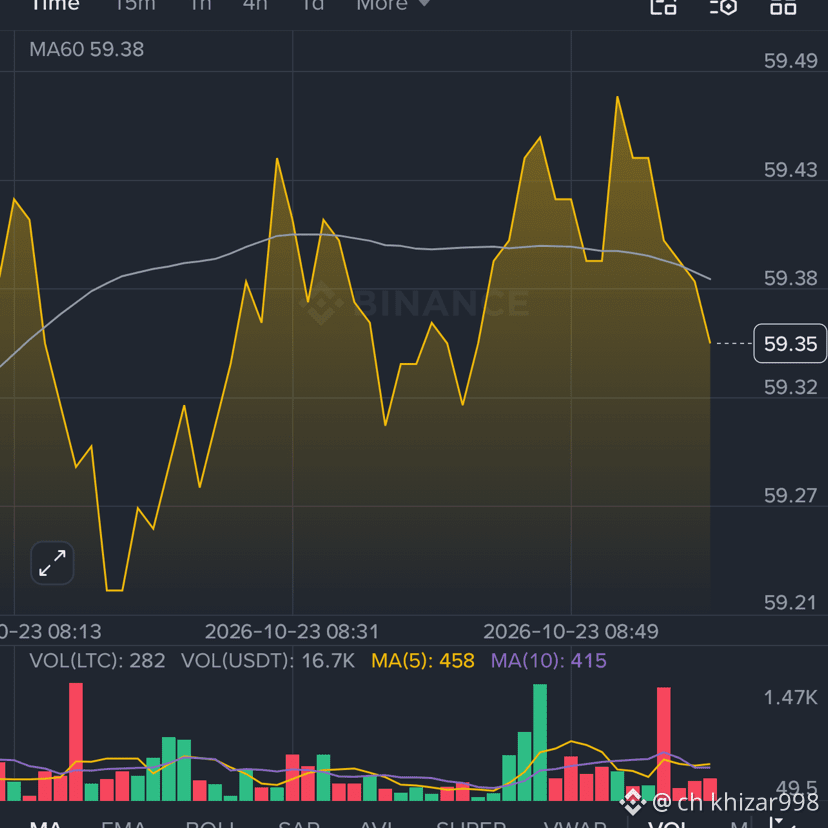
$LTC
📉 Widerstandszone: 59.38 – 59.43
🟢 Unterstützungszone: 59.32 – 59.27
📊 Orderbuch:
🟢 Kaufen: 51.99%
🔴 Verkaufen: 48.01%
{spot}(LTCUSDT)
#EarningsSeason
$LTC
📉 Widerstandszone: 59.38 – 59.43
🟢 Unterstützungszone: 59.32 – 59.27
📊 Orderbuch:
🟢 Kaufen: 51.99%
🔴 Verkaufen: 48.01%
#EarningsSeason
📉 Widerstandszone: 59.38 – 59.43
🟢 Unterstützungszone: 59.32 – 59.27
📊 Orderbuch:
🟢 Kaufen: 51.99%
🔴 Verkaufen: 48.01%
#EarningsSeason
1
2
248
Anmelden und weiter Inhalte entdecken
Krypto-Nutzer weltweit auf Binance Square kennenlernen
⚡️ Bleib in Sachen Krypto stets am Puls.
💬 Die weltgrößte Kryptobörse vertraut darauf.
👍 Erhalte verlässliche Einblicke von verifizierten Creators.
E-Mail-Adresse/Telefonnummer
Trendthemen
BinanceProcesses$4.65BWithdrawals
6,361 Aufrufe
68 Kommentare
Binance verarbeitet nach Wiederaufnahme Auszahlungen in Höhe von 4,65 Milliarden US-Dollar – Nettoabfluss von 3,64 Milliarden US-Dollar entspricht 2,1 % der Vermögenswerte im Wert von 171 Milliarden US-Dollar
Binance News
·31 Likes
·7.9k Aufrufe
WithdrawalsBack: 15 networks live
4,729 Aufrufe
106 Kommentare
BinanceUpdatesProofofReservesAddresses
89,439 Aufrufe
1,340 Kommentare