

Rakib Hero
172 Beiträge

Rakib Hero
Melden
Nutzer blockieren
Trade eröffnen
Gelegenheitstrader
2.1 Jahre
111 Following
478 Follower
84 Like gegeben
Beiträge
Portfolio

·
--
Übersetzung ansehen
1
86
·
--
Bullisch
🧧💸 USDT-Rotpacket ist da! 🎁🔥 Nutze deine Chance, sichere dir deine Belohnungen und lass die Krypto-Segen fließen! 🚀💰✨ #USDT $USDT #RedPacketMission #CryptoRewards 🤑🎉
🧧💸 USDT-Rotpacket ist da! 🎁🔥 Nutze deine Chance, sichere dir deine Belohnungen und lass die Krypto-Segen fließen! 🚀💰✨ #USDT $USDT #RedPacketMission #CryptoRewards 🤑🎉

293
10
318
·
--
Bullisch
Übersetzung ansehen
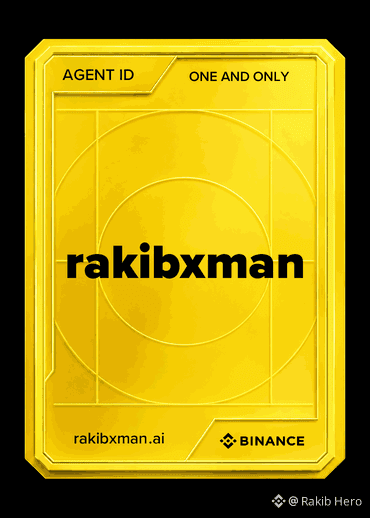
Agent ID — Your Agent's unique name
Claim your exclusive Agent ID in the Binance App
#Binanceagent #Claim all
Agent ID — Your Agent's unique name
Claim your exclusive Agent ID in the Binance App
#Binanceagent #Claim all
Claim your exclusive Agent ID in the Binance App
#Binanceagent #Claim all
1
159
·
--
Übersetzung ansehen
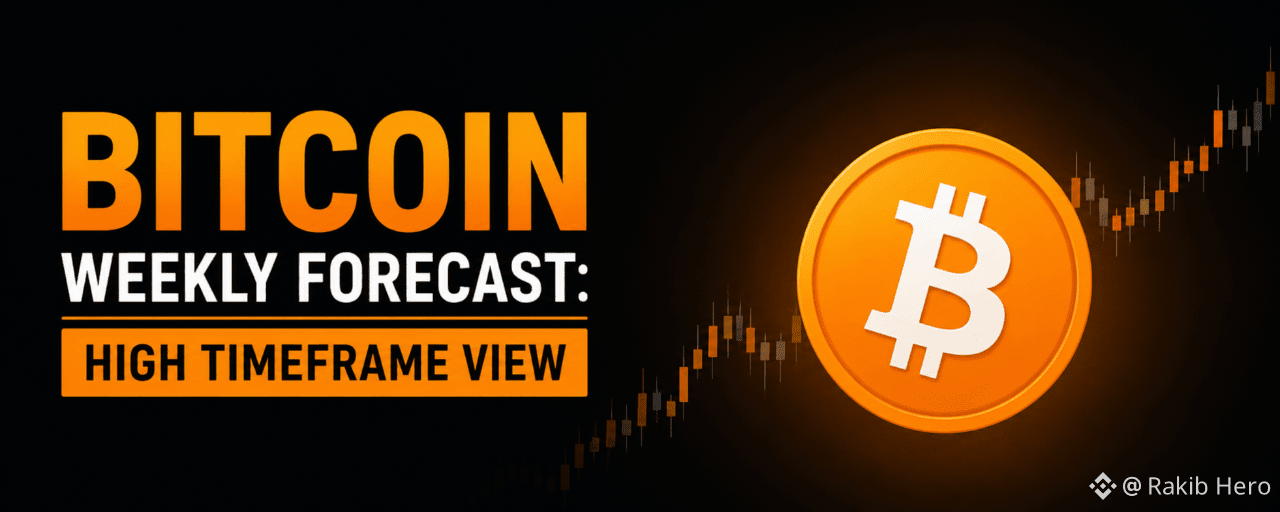
Another week, another round of war headlines. The Strait of Hormuz has been "closed" for the 10,000th time in the last few months. Somehow, the headlines are still working, and they will keep coming as long as they continue to move the market. And Trump will keep announcing peace deals as long as they keep pumping stocks.
Anyways, let's get straight into the Bitcoin chart and see what's going on. Has anything changed on the higher timeframes, or is the bigger picture still the same?
Bitcoin Bear Market cycle
Anyways, let's get straight into the Bitcoin chart and see what's going on. Has anything changed on the higher timeframes, or is the bigger picture still the same?
Bitcoin Bear Market cycle
2
82
·
--
Bullisch
2
98
·
--
Übersetzung ansehen
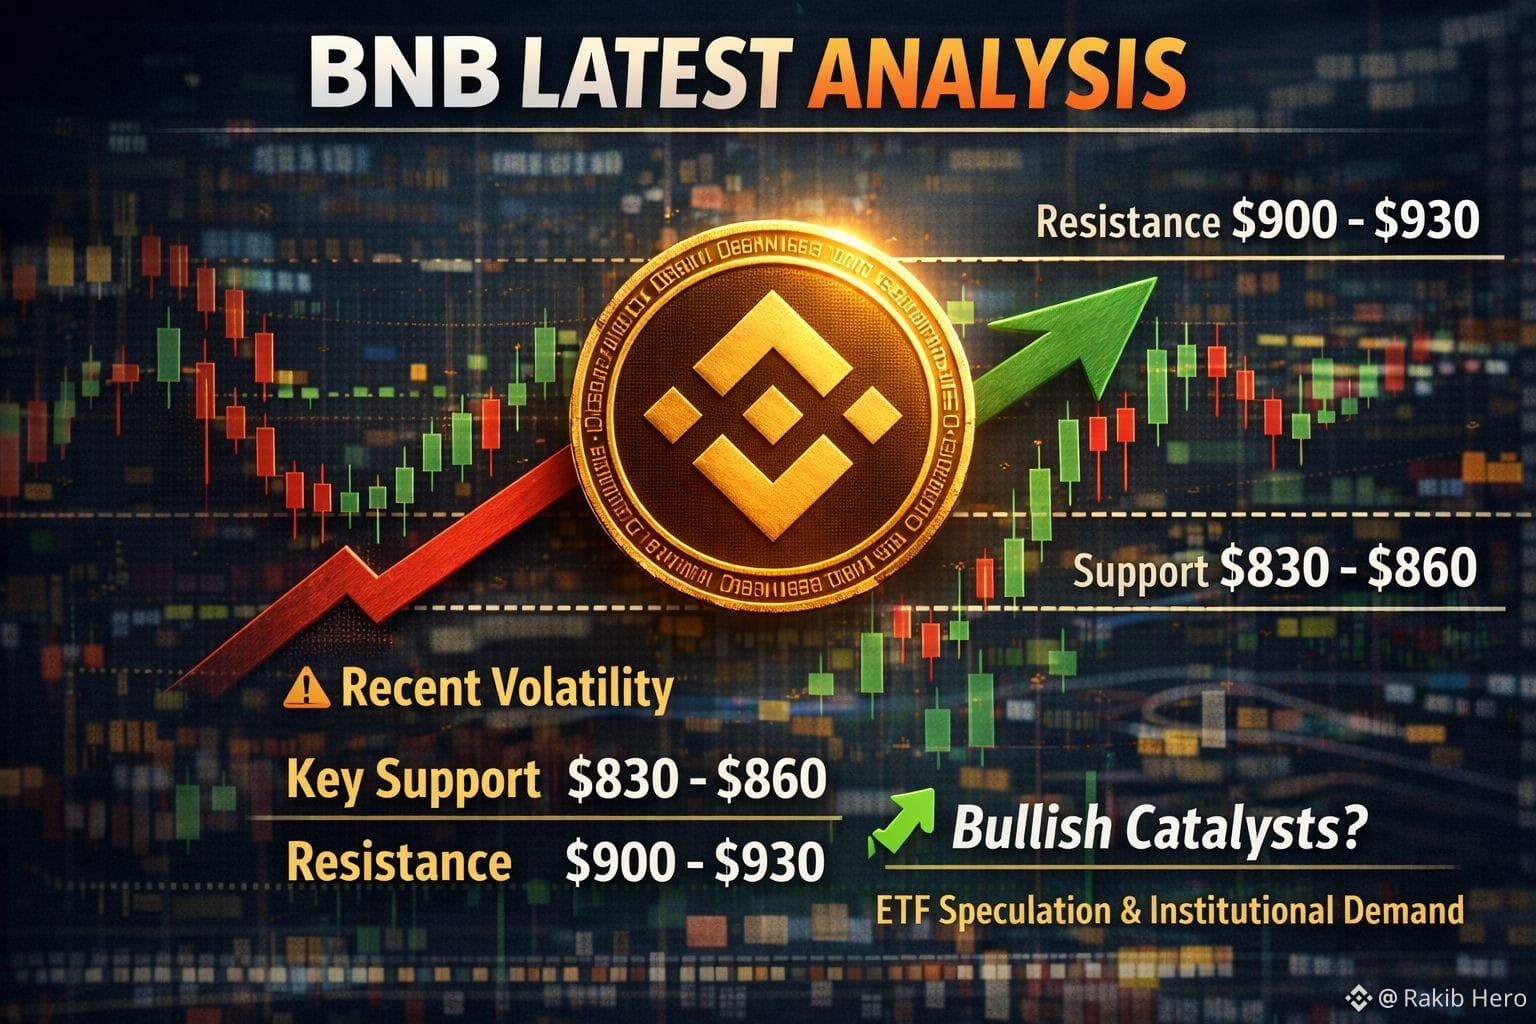
#BNB has been dancing with volatility lately. The token slipped amid a wider market sell-off triggered by Bitcoin’s downturn, pulling BNB prices lower as liquidations rippled through altcoins. Recent data shows
{spot}(BNBUSDT)
$BNB underperforming the broader crypto market, dropping roughly 8% in the last 24 hours and losing about 11% over the past week. This reflects bearish momentum and technical breakdowns below key supports.$BNB #TrumpProCrypto #GoldSilverRebound #VitalikSells #VitalikSells
#BNB has been dancing with volatility lately. The token slipped amid a wider market sell-off triggered by Bitcoin’s downturn, pulling BNB prices lower as liquidations rippled through altcoins. Recent data shows
$BNB underperforming the broader crypto market, dropping roughly 8% in the last 24 hours and losing about 11% over the past week. This reflects bearish momentum and technical breakdowns below key supports.$BNB #TrumpProCrypto #GoldSilverRebound #VitalikSells #VitalikSells
$BNB underperforming the broader crypto market, dropping roughly 8% in the last 24 hours and losing about 11% over the past week. This reflects bearish momentum and technical breakdowns below key supports.$BNB #TrumpProCrypto #GoldSilverRebound #VitalikSells #VitalikSells
2
10
·
--
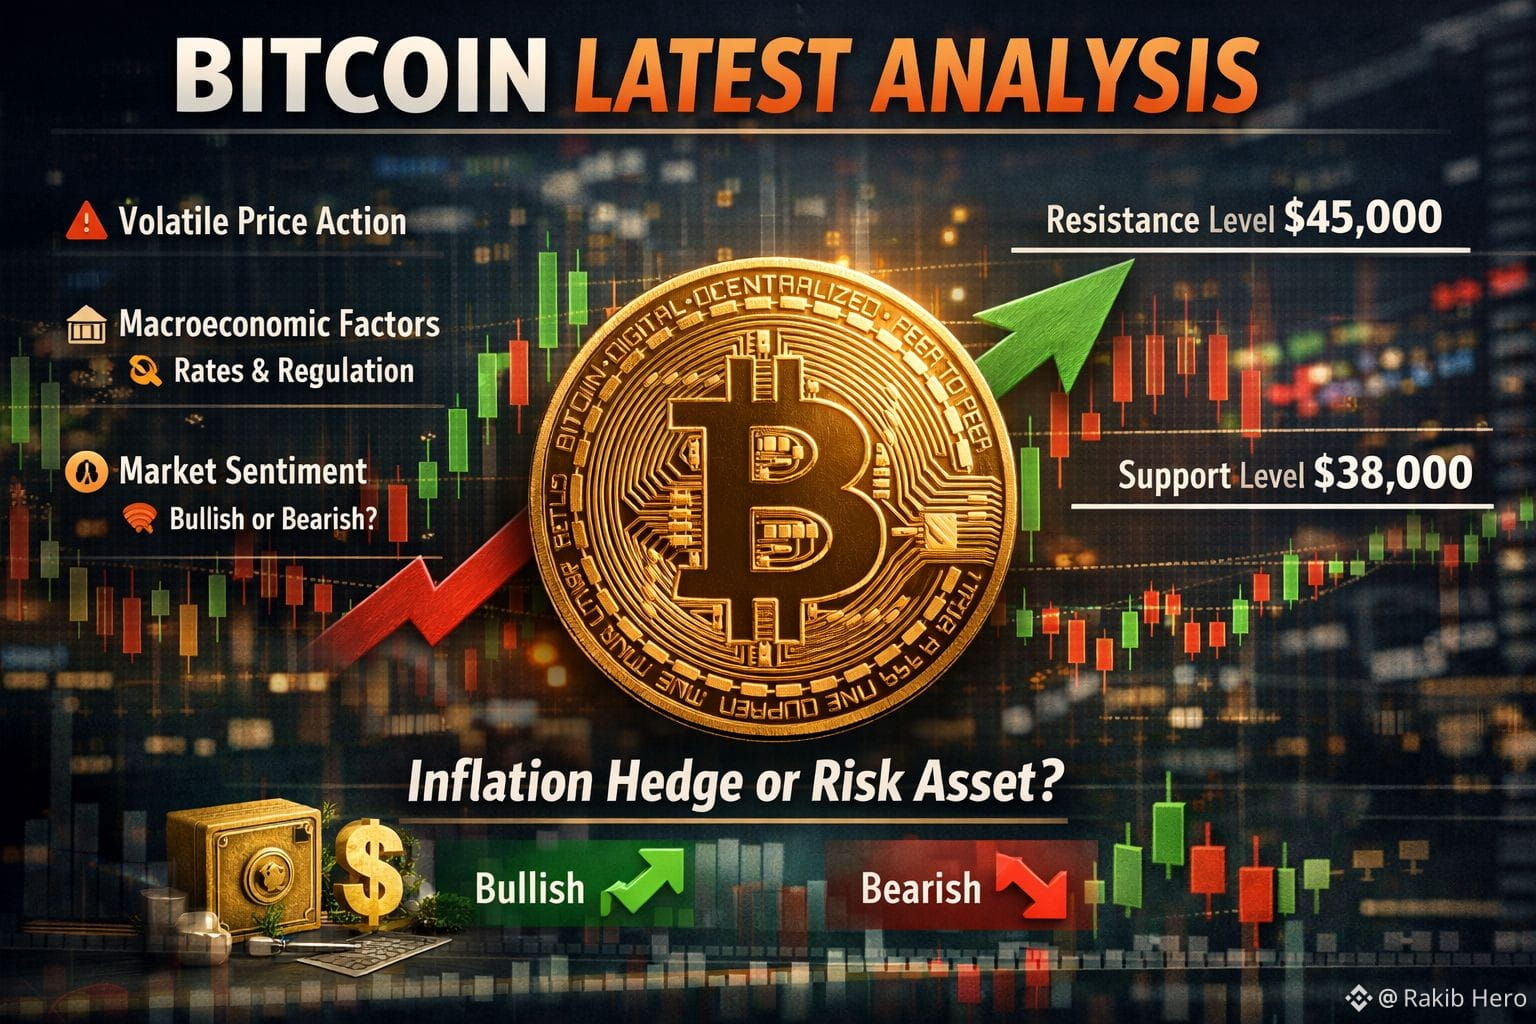
#BTC Ich habe derzeit keinen Live-Zugriff auf die neuesten Bitcoin-Daten, aber ich kann eine allgemeine Analyse basierend auf gängigen Trends anbieten.@BTCWires $BTC Bitcoin hat in den letzten Wochen erhebliche Volatilität erfahren, wobei die Preisbewegungen stark von makroökonomischen Faktoren wie Zinssätzen, regulatorischen Entwicklungen und der Marktsentiment beeinflusst werden. Bitcoin wird oft als Absicherung gegen Inflation betrachtet, aber seine Leistung kann dennoch an traditionelle Finanzmärkte gebunden sein, was manchmal zu korrelierten Bewegungen mit Aktien und anderen Anlagen führt.@Binance_Square_Official #PreciousMetalsTurbulence #MarketCorrection
#BTC Ich habe derzeit keinen Live-Zugriff auf die neuesten Bitcoin-Daten, aber ich kann eine allgemeine Analyse basierend auf gängigen Trends anbieten.@BTC Wires $BTC Bitcoin hat in den letzten Wochen erhebliche Volatilität erfahren, wobei die Preisbewegungen stark von makroökonomischen Faktoren wie Zinssätzen, regulatorischen Entwicklungen und der Marktsentiment beeinflusst werden. Bitcoin wird oft als Absicherung gegen Inflation betrachtet, aber seine Leistung kann dennoch an traditionelle Finanzmärkte gebunden sein, was manchmal zu korrelierten Bewegungen mit Aktien und anderen Anlagen führt.@Binance Square Official #PreciousMetalsTurbulence #MarketCorrection
12
173
·
--
Bullisch
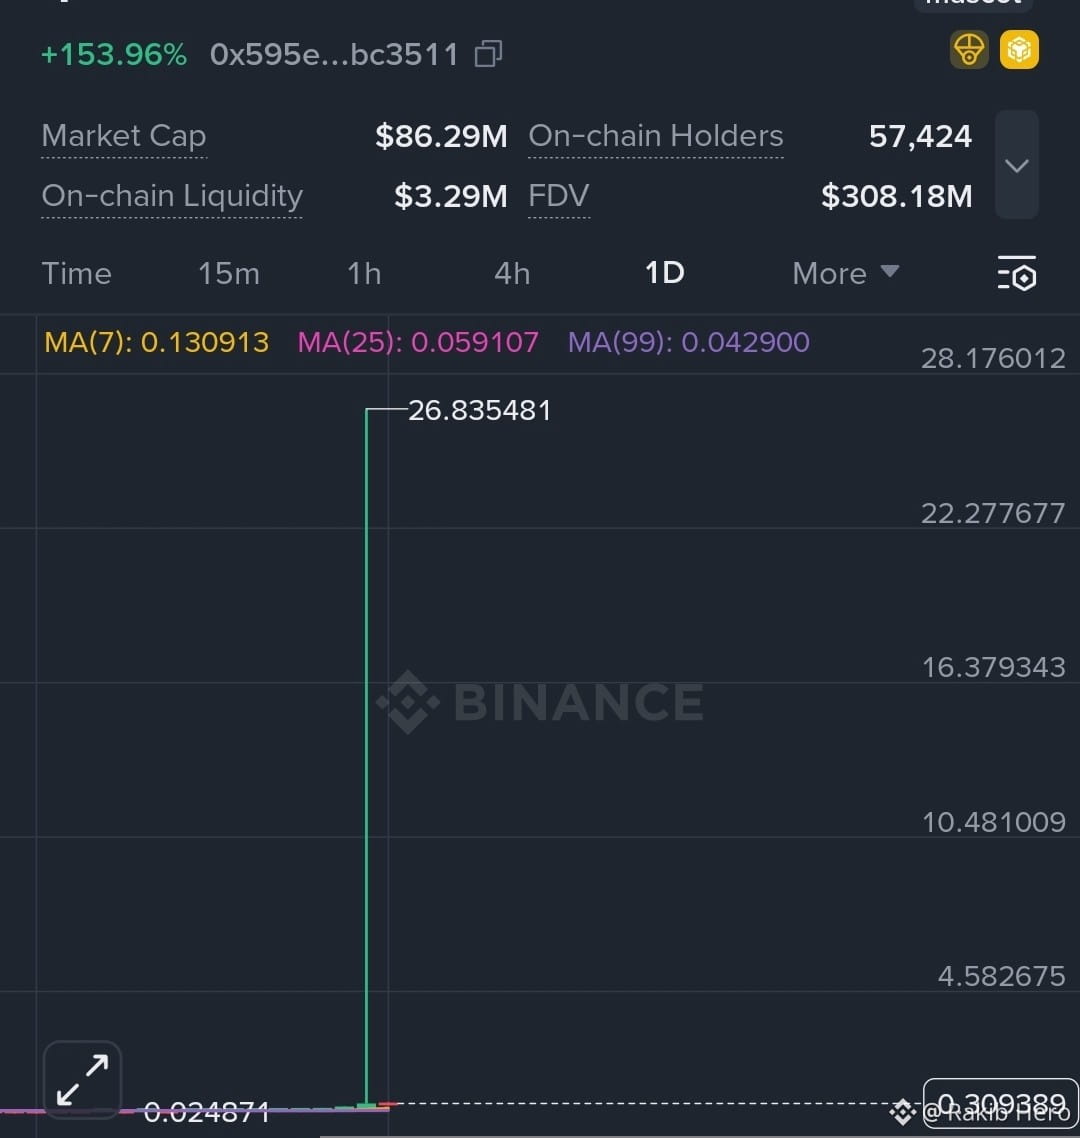
#BULLA just gedruckt eine massive vertikale Impulskerze, die auf starke spekulative Nachfrage und von FOMO getriebenen Schwung hinweist.
Der Preis handelt weit über MA(7), MA(25) und MA(99) → bestätigt starken bullischen Trend, aber auch überdehnt.
Solche markanten Bewegungen führen normalerweise zu:
Kurzfristigem Gewinnmitnahme / Rückzug
Oder Konsolidierung vor dem nächsten Bein
🧠 Schlüssel Niveaus (Visuelle Schätzung)
Widerstand: Rund um den jüngsten Höchststand (~26–28 Bereich auf dem Chart)
Unterstützung: Nahe Ausbruchsbasis / Liquiditätszone (rund um MA(7) & MA(25) Bereich)
Der Verlust von MA(7) im Tageschart könnte die erste Abkühlungsphase signalisieren.#CZAMAonBinanceSquare #USPPIJump #BitcoinETFWatch #USGovShutdown $BULLA
{future}(BULLAUSDT)
#BULLA just gedruckt eine massive vertikale Impulskerze, die auf starke spekulative Nachfrage und von FOMO getriebenen Schwung hinweist.
Der Preis handelt weit über MA(7), MA(25) und MA(99) → bestätigt starken bullischen Trend, aber auch überdehnt.
Solche markanten Bewegungen führen normalerweise zu:
Kurzfristigem Gewinnmitnahme / Rückzug
Oder Konsolidierung vor dem nächsten Bein
🧠 Schlüssel Niveaus (Visuelle Schätzung)
Widerstand: Rund um den jüngsten Höchststand (~26–28 Bereich auf dem Chart)
Unterstützung: Nahe Ausbruchsbasis / Liquiditätszone (rund um MA(7) & MA(25) Bereich)
Der Verlust von MA(7) im Tageschart könnte die erste Abkühlungsphase signalisieren.#CZAMAonBinanceSquare #USPPIJump #BitcoinETFWatch #USGovShutdown $BULLA
13
1k
Anmelden und weiter Inhalte entdecken
Krypto-Nutzer weltweit auf Binance Square kennenlernen
⚡️ Bleib in Sachen Krypto stets am Puls.
💬 Die weltgrößte Kryptobörse vertraut darauf.
👍 Erhalte verlässliche Einblicke von verifizierten Creators.
E-Mail-Adresse/Telefonnummer
Trendthemen
UniswapA16zSeekDeFiExemptionFromIllinoisCryptoTax
882 Aufrufe
132 Kommentare
#UniswapA16zSeekDeFiExemptionFromIllinoisCryptoTax
🏛️ Uniswap und a16z wehren sich gegen die Krypto-Steuer von 0,2 % in Illinois
📊 Das Gesetz zur Besteuerung digitaler Vermögenswerte in Illinois erhebt 0,2 % des Werts steuerpflichtiger Kryptohandelsgeschäfte, Übertragungen und Verwahrungen – unabhängig davon, ob Gewinne erzielt werden.
📅 Eine gerichtlich genehmigte Verschiebung verlegte den Starttermin vom 1. Januar auf den 1. Juli 2027. Klagen gegen das Gesetz sind noch anhängig.
📝 Uniswap, a16z und der DeFi Education Fund reichten Stellungnahmen ein, als die Kommentierungsfrist für den Regelungsentwurf am 30. Oktober endete.
⚠️ Der Entwurf nimmt DEX-Swaps aus, wenn Gebühren ausschließlich an Liquiditätsanbieter oder Validatoren gehen, behandelt Protokollgebühren jedoch als steuerpflichtig.
🔁 Die Gruppen wollen, dass Wallet-Abhebungen und kettenübergreifende Übertragungen von der wertbasierten Steuer ausgenommen werden und die Aufzeichnungspflicht für private Schlüssel entfällt.
Was das für Krypto bedeutet: Die Definition eines „Brokers“ in Illinois könnte als Vorlage für andere Bundesstaaten dienen, die DeFi besteuern.
Sollten DeFi-Protokolle, die Gebühren erheben, wie Börsen besteuert werden? 👇
$UNI $ETH
#CryptoNews #DeFi #CryptoTax #UniswapA16zSeekDeFiExemptionFromIllinoisCryptoTax
JOY_MADHU_
·0 Likes
·18 Aufrufe
HKDollarStablecoinHKDAPToLaunchOnSolana
0 Aufrufe
16 Kommentare
$1.5BInLeveragedCryptoBetsLiquidated
11,336 Aufrufe
153 Kommentare