

Waqas Mehmood 12
30 Beiträge
Waqas Mehmood 12
Melden
Nutzer blockieren
Trade eröffnen
Gelegenheitstrader
2.5 Jahre
2 Following
35 Follower
54 Like gegeben
Beiträge
Portfolio
Übersetzung ansehen
Michael Saylor hints at another Bitcoin purchase. 🟠
“More orange than ever.”
#Bitcoin #BTC #Strategy #Crypto
Michael Saylor hints at another Bitcoin purchase. 🟠
“More orange than ever.”
#Bitcoin #BTC #Strategy #Crypto
“More orange than ever.”
#Bitcoin #BTC #Strategy #Crypto
77
Übersetzung ansehen
🚨 BREAKING
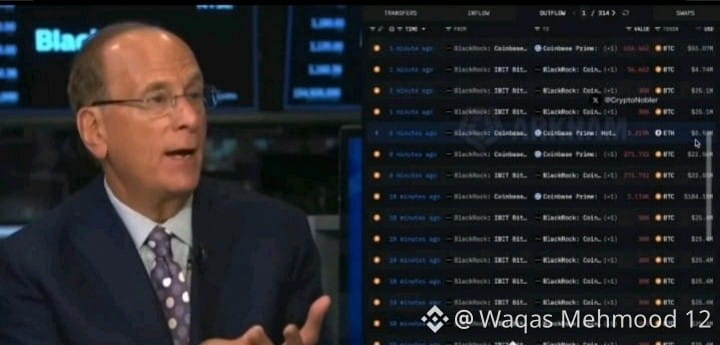
🇺🇸 BLACKROCK JUST STARTED LIQUIDATING ALL CRYPTO RIGHT AFTER THE U.S. MARKET OPENED!
THEY ARE AGGRESSIVELY DUMPING MILLIONS IN BITCOIN AND ETHEREUM RIGHT NOW, NONSTOP.
THEY DEFINITELY KNOW ANOTHER MASSIVE CRASH IS COMING...
🚨 BREAKING
🇺🇸 BLACKROCK JUST STARTED LIQUIDATING ALL CRYPTO RIGHT AFTER THE U.S. MARKET OPENED!
THEY ARE AGGRESSIVELY DUMPING MILLIONS IN BITCOIN AND ETHEREUM RIGHT NOW, NONSTOP.
THEY DEFINITELY KNOW ANOTHER MASSIVE CRASH IS COMING...
🇺🇸 BLACKROCK JUST STARTED LIQUIDATING ALL CRYPTO RIGHT AFTER THE U.S. MARKET OPENED!
THEY ARE AGGRESSIVELY DUMPING MILLIONS IN BITCOIN AND ETHEREUM RIGHT NOW, NONSTOP.
THEY DEFINITELY KNOW ANOTHER MASSIVE CRASH IS COMING...
2
🚨 DIE LETZTE BULLENFALLE IST OFFIZIELL VORBEI.
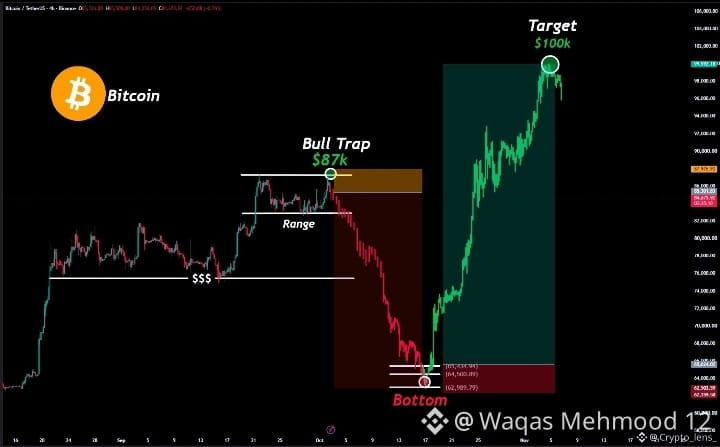
Bitcoin wurde erneut bei 87.000 $ abgewiesen, und der Ausbruch ist gescheitert.
Nächste Woche tritt $BTC in die Liquidationsphase ein und stürzt stark in Richtung 65.000 $ ab.
85.000 $ → 75.000 $ → 65.000 $ → (Tiefpunkt) 100.000 $
Kaufe $BTC Anfang November bei 65.000 $. Verkaufe Anfang Januar bei 100.000 $.
Aktiviere Benachrichtigungen. Folge mir, bevor es zu spät ist.
Ich werde hier zuerst alle wichtigen Updates posten.
🚨 DIE LETZTE BULLENFALLE IST OFFIZIELL VORBEI.
Bitcoin wurde erneut bei 87.000 $ abgewiesen, und der Ausbruch ist gescheitert.
Nächste Woche tritt $BTC in die Liquidationsphase ein und stürzt stark in Richtung 65.000 $ ab.
85.000 $ → 75.000 $ → 65.000 $ → (Tiefpunkt) 100.000 $
Kaufe $BTC Anfang November bei 65.000 $. Verkaufe Anfang Januar bei 100.000 $.
Aktiviere Benachrichtigungen. Folge mir, bevor es zu spät ist.
Ich werde hier zuerst alle wichtigen Updates posten.
Bitcoin wurde erneut bei 87.000 $ abgewiesen, und der Ausbruch ist gescheitert.
Nächste Woche tritt $BTC in die Liquidationsphase ein und stürzt stark in Richtung 65.000 $ ab.
85.000 $ → 75.000 $ → 65.000 $ → (Tiefpunkt) 100.000 $
Kaufe $BTC Anfang November bei 65.000 $. Verkaufe Anfang Januar bei 100.000 $.
Aktiviere Benachrichtigungen. Folge mir, bevor es zu spät ist.
Ich werde hier zuerst alle wichtigen Updates posten.
77
Übersetzung ansehen
#GOLD_UPDATE
Gold short analysis for next week with current picture
Gold (XAU/USD) Short Technical & Market Outlook
Gold closed the week under persistent bearish pressure, trading around $4,140 after failing to hold above key moving averages. The overall structure on intraday and daily timeframes remains tilted to the downside as dynamic resistance near $4,200 (EMA50) continues to cap upside attempts.
1. Price Action & Market Structure
Current Level: ~$4,140
Structure: A series of lower highs on lower timeframes (H4/D1) reflects steady institutional distribution.
Key Range/Consolidation: Price has been squeezing inside a symmetrical consolidation zone between $4,114 and $4,202.
Technical Indicators: Daily RSI sits around 43–45 (neutral-to-bearish tilt), while MACD remains in negative territory below zero, signaling ongoing downward momentum.
2. Key Technical Levels for Next Week
Level Type Price Level Description / Confluence
Major Resistance 2 $4,240 - $4,250 Previous breakdown origin & 0.618 Fib retracement region.
Immediate Resistance 1 $4,188 - $4,200 Major Pivot Zone, EMA50 dynamic resistance, & Triangle Top.
Immediate Support 1 $4,110 - $4,114 External range liquidity sweep zone & recent swing low.
Key Target / Support 2 $4,000 - $4,050
#GOLD_UPDATE
Gold short analysis for next week with current picture
Gold (XAU/USD) Short Technical & Market Outlook
Gold closed the week under persistent bearish pressure, trading around $4,140 after failing to hold above key moving averages. The overall structure on intraday and daily timeframes remains tilted to the downside as dynamic resistance near $4,200 (EMA50) continues to cap upside attempts.
1. Price Action & Market Structure
Current Level: ~$4,140
Structure: A series of lower highs on lower timeframes (H4/D1) reflects steady institutional distribution.
Key Range/Consolidation: Price has been squeezing inside a symmetrical consolidation zone between $4,114 and $4,202.
Technical Indicators: Daily RSI sits around 43–45 (neutral-to-bearish tilt), while MACD remains in negative territory below zero, signaling ongoing downward momentum.
2. Key Technical Levels for Next Week
Level Type Price Level Description / Confluence
Major Resistance 2 $4,240 - $4,250 Previous breakdown origin & 0.618 Fib retracement region.
Immediate Resistance 1 $4,188 - $4,200 Major Pivot Zone, EMA50 dynamic resistance, & Triangle Top.
Immediate Support 1 $4,110 - $4,114 External range liquidity sweep zone & recent swing low.
Key Target / Support 2 $4,000 - $4,050
Gold short analysis for next week with current picture
Gold (XAU/USD) Short Technical & Market Outlook
Gold closed the week under persistent bearish pressure, trading around $4,140 after failing to hold above key moving averages. The overall structure on intraday and daily timeframes remains tilted to the downside as dynamic resistance near $4,200 (EMA50) continues to cap upside attempts.
1. Price Action & Market Structure
Current Level: ~$4,140
Structure: A series of lower highs on lower timeframes (H4/D1) reflects steady institutional distribution.
Key Range/Consolidation: Price has been squeezing inside a symmetrical consolidation zone between $4,114 and $4,202.
Technical Indicators: Daily RSI sits around 43–45 (neutral-to-bearish tilt), while MACD remains in negative territory below zero, signaling ongoing downward momentum.
2. Key Technical Levels for Next Week
Level Type Price Level Description / Confluence
Major Resistance 2 $4,240 - $4,250 Previous breakdown origin & 0.618 Fib retracement region.
Immediate Resistance 1 $4,188 - $4,200 Major Pivot Zone, EMA50 dynamic resistance, & Triangle Top.
Immediate Support 1 $4,110 - $4,114 External range liquidity sweep zone & recent swing low.
Key Target / Support 2 $4,000 - $4,050
172
#BTC
Kurze Analyse von BTC für die nächste Woche
Bitcoin (BTC) wird bei etwa 84.500–85.000 $ gehandelt und hält eine solide kurzfristige Aufwärtsstruktur aufrecht, die durch institutionelle ETF-Zuflüsse und eine günstige Ausrichtung der gleitenden Durchschnitte gestützt wird.
Traders Union
Technischer Überblick
Aktuelle Spanne und Momentum: BTC konsolidiert im Bereich von 84.000–85.000 $. Die Kursentwicklung liegt weiterhin deutlich über dem 50-Tage-EMA (78.500 $) und dem 200-Tage-EMA (73.200 $), wodurch die Golden-Cross-Struktur im Tageschart erhalten bleibt.
Traders Union
Wichtige Widerstandsniveaus:
85.500–86.000 $: Die unmittelbare Obergrenze. Ein Tagesschlusskurs bei hohem Handelsvolumen oberhalb dieses Niveaus würde den Weg in Richtung des Zielbereichs von 88.000–90.000 $ freimachen.
Wichtige Unterstützungsniveaus:
83.000–83.500 $: Unmittelbare Unterstützung und lokale Nachfragezone.
81.000–81.200 $: Bedeutende strukturelle Unterstützung (1-Monats-VWAP-Niveau). Ein Rückgang unter dieses Niveau würde die kurzfristige bullische These entkräften und einen stärkeren Rücksetzer in Richtung 78.500 $ riskieren.
#BTC
Kurze Analyse von BTC für die nächste Woche
Bitcoin (BTC) wird bei etwa 84.500–85.000 $ gehandelt und hält eine solide kurzfristige Aufwärtsstruktur aufrecht, die durch institutionelle ETF-Zuflüsse und eine günstige Ausrichtung der gleitenden Durchschnitte gestützt wird.
Traders Union
Technischer Überblick
Aktuelle Spanne und Momentum: BTC konsolidiert im Bereich von 84.000–85.000 $. Die Kursentwicklung liegt weiterhin deutlich über dem 50-Tage-EMA (78.500 $) und dem 200-Tage-EMA (73.200 $), wodurch die Golden-Cross-Struktur im Tageschart erhalten bleibt.
Traders Union
Wichtige Widerstandsniveaus:
85.500–86.000 $: Die unmittelbare Obergrenze. Ein Tagesschlusskurs bei hohem Handelsvolumen oberhalb dieses Niveaus würde den Weg in Richtung des Zielbereichs von 88.000–90.000 $ freimachen.
Wichtige Unterstützungsniveaus:
83.000–83.500 $: Unmittelbare Unterstützung und lokale Nachfragezone.
81.000–81.200 $: Bedeutende strukturelle Unterstützung (1-Monats-VWAP-Niveau). Ein Rückgang unter dieses Niveau würde die kurzfristige bullische These entkräften und einen stärkeren Rücksetzer in Richtung 78.500 $ riskieren.
Kurze Analyse von BTC für die nächste Woche
Bitcoin (BTC) wird bei etwa 84.500–85.000 $ gehandelt und hält eine solide kurzfristige Aufwärtsstruktur aufrecht, die durch institutionelle ETF-Zuflüsse und eine günstige Ausrichtung der gleitenden Durchschnitte gestützt wird.
Traders Union
Technischer Überblick
Aktuelle Spanne und Momentum: BTC konsolidiert im Bereich von 84.000–85.000 $. Die Kursentwicklung liegt weiterhin deutlich über dem 50-Tage-EMA (78.500 $) und dem 200-Tage-EMA (73.200 $), wodurch die Golden-Cross-Struktur im Tageschart erhalten bleibt.
Traders Union
Wichtige Widerstandsniveaus:
85.500–86.000 $: Die unmittelbare Obergrenze. Ein Tagesschlusskurs bei hohem Handelsvolumen oberhalb dieses Niveaus würde den Weg in Richtung des Zielbereichs von 88.000–90.000 $ freimachen.
Wichtige Unterstützungsniveaus:
83.000–83.500 $: Unmittelbare Unterstützung und lokale Nachfragezone.
81.000–81.200 $: Bedeutende strukturelle Unterstützung (1-Monats-VWAP-Niveau). Ein Rückgang unter dieses Niveau würde die kurzfristige bullische These entkräften und einen stärkeren Rücksetzer in Richtung 78.500 $ riskieren.
63
Übersetzung ansehen
Gold just hit a fresh two‑month high around $4,380–$4,410/oz after a powerful rally. 📈
Weak US jobs data, steady Fed rates, and rising geopolitical tension are fueling safe‑haven demand.
Analysts see potential for more upside, but inflation data and the dollar will decide the next big move.
Gold just hit a fresh two‑month high around $4,380–$4,410/oz after a powerful rally. 📈
Weak US jobs data, steady Fed rates, and rising geopolitical tension are fueling safe‑haven demand.
Analysts see potential for more upside, but inflation data and the dollar will decide the next big move.
Weak US jobs data, steady Fed rates, and rising geopolitical tension are fueling safe‑haven demand.
Analysts see potential for more upside, but inflation data and the dollar will decide the next big move.
73
5
Übersetzung ansehen
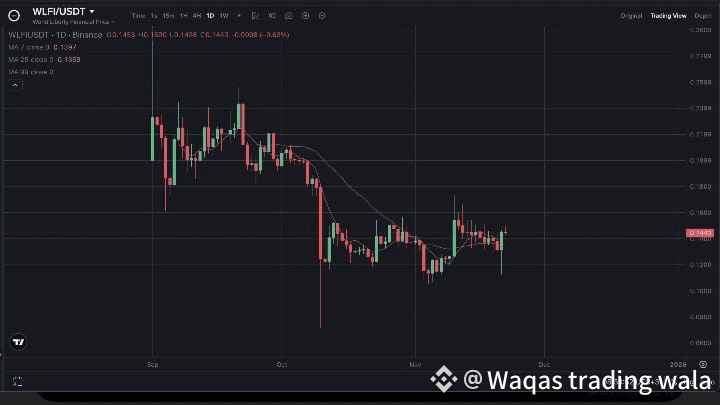
Price is trying to stabilize after a long downtrend, trading just above the 7-day MA but still under the 25-day MA — showing early recovery but not confirmed momentum yet.
🎯 Targets
Target 1: $0.155
Target 2: $0.170
Target 3: $0.185
🛡️ Support
Main Support: $0.135
Major Support Zone: $0.125
If price holds above $0.135, upside continuation is likely. A daily close above $0.155 unlocks stronger bullish momentum.
#WriteToEarnUpgrade #TrumpTariffs #USJobsData
Price is trying to stabilize after a long downtrend, trading just above the 7-day MA but still under the 25-day MA — showing early recovery but not confirmed momentum yet.
🎯 Targets
Target 1: $0.155
Target 2: $0.170
Target 3: $0.185
🛡️ Support
Main Support: $0.135
Major Support Zone: $0.125
If price holds above $0.135, upside continuation is likely. A daily close above $0.155 unlocks stronger bullish momentum.
#WriteToEarnUpgrade #TrumpTariffs #USJobsData
🎯 Targets
Target 1: $0.155
Target 2: $0.170
Target 3: $0.185
🛡️ Support
Main Support: $0.135
Major Support Zone: $0.125
If price holds above $0.135, upside continuation is likely. A daily close above $0.155 unlocks stronger bullish momentum.
#WriteToEarnUpgrade #TrumpTariffs #USJobsData
43
Hier ist eine kurze, aktuelle Analyse von Dogecoin ($DOGE ):
{future}(DOGEUSDT)
🧐 Was passiert gerade
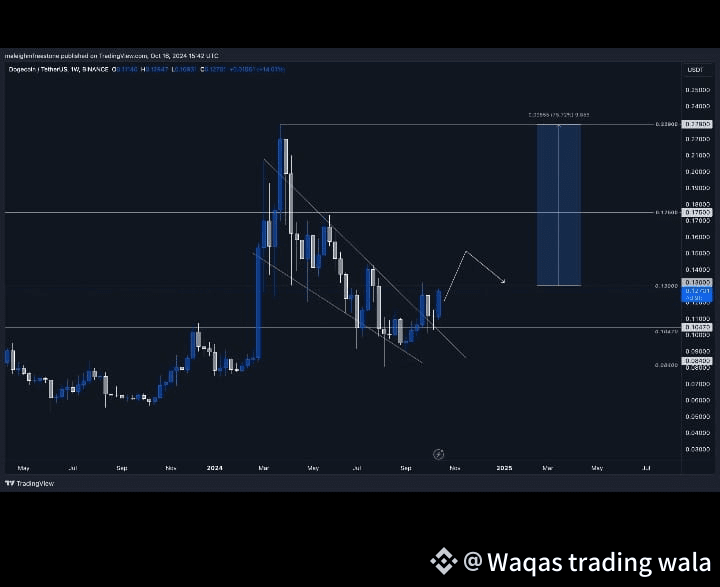
DOGE fiel unter eine wichtige Unterstützung bei etwa $0.18 und handelt momentan nahe ~$0.17–0.18. CoinDesk+2CoinDesk+2
On-Chain-Daten zeigen, dass Wallets, die 10 M–100 M DOGE halten, etwa 440 Millionen Token über ~72 Stunden dumpen — ein Indikator für starken institutionellen/Wal-Verkauf. CoinDesk+1
Technische Indikatoren sind bärisch: Das Volumen stieg während des Rückgangs, der Momentum bleibt nach unten gerichtet, und es wird ein drohendes „Todeskreuz“ (50-Tage-Durchschnitt kreuzt unter 200-Tage-Durchschnitt) gemeldet. CoinMarketCap+1
📊 Wichtige technische Niveaus & Szenarien
Widerstand: Rund $0.187–$0.19. DOGE hat versucht und ist gescheitert, diese Zone zurückzugewinnen. CoinDesk+1
Unterstützung: Sofortige Unterstützung liegt bei etwa $0.165. Wenn dies bricht, befindet sich der nächste große Cluster bei etwa $0.15 oder sogar $0.07 (wo zuvor eine signifikante Akkumulation stattfand). CoinDesk+1
Aufwärtsszenario: Wenn DOGE $0.18+ zurückerobern und halten kann, schlagen Analysten eine mögliche Erholung in Richtung ~$0.26–$0.33 vor. CoinDesk+1
Abwärtsrisiko: Wenn die Unterstützung versagt, wird ein Rückgang auf $0.07 als mögliches Ziel im schlimmsten strukturellen Rückgang angegeben.
#USGovShutdownEnd?
#StrategyBTCPurchase #ProjectCrypto
Hier ist eine kurze, aktuelle Analyse von Dogecoin ($DOGE ):
🧐 Was passiert gerade
DOGE fiel unter eine wichtige Unterstützung bei etwa $0.18 und handelt momentan nahe ~$0.17–0.18. CoinDesk+2CoinDesk+2
On-Chain-Daten zeigen, dass Wallets, die 10 M–100 M DOGE halten, etwa 440 Millionen Token über ~72 Stunden dumpen — ein Indikator für starken institutionellen/Wal-Verkauf. CoinDesk+1
Technische Indikatoren sind bärisch: Das Volumen stieg während des Rückgangs, der Momentum bleibt nach unten gerichtet, und es wird ein drohendes „Todeskreuz“ (50-Tage-Durchschnitt kreuzt unter 200-Tage-Durchschnitt) gemeldet. CoinMarketCap+1
📊 Wichtige technische Niveaus & Szenarien
Widerstand: Rund $0.187–$0.19. DOGE hat versucht und ist gescheitert, diese Zone zurückzugewinnen. CoinDesk+1
Unterstützung: Sofortige Unterstützung liegt bei etwa $0.165. Wenn dies bricht, befindet sich der nächste große Cluster bei etwa $0.15 oder sogar $0.07 (wo zuvor eine signifikante Akkumulation stattfand). CoinDesk+1
Aufwärtsszenario: Wenn DOGE $0.18+ zurückerobern und halten kann, schlagen Analysten eine mögliche Erholung in Richtung ~$0.26–$0.33 vor. CoinDesk+1
Abwärtsrisiko: Wenn die Unterstützung versagt, wird ein Rückgang auf $0.07 als mögliches Ziel im schlimmsten strukturellen Rückgang angegeben.
#USGovShutdownEnd?
#StrategyBTCPurchase #ProjectCrypto
🧐 Was passiert gerade
DOGE fiel unter eine wichtige Unterstützung bei etwa $0.18 und handelt momentan nahe ~$0.17–0.18. CoinDesk+2CoinDesk+2
On-Chain-Daten zeigen, dass Wallets, die 10 M–100 M DOGE halten, etwa 440 Millionen Token über ~72 Stunden dumpen — ein Indikator für starken institutionellen/Wal-Verkauf. CoinDesk+1
Technische Indikatoren sind bärisch: Das Volumen stieg während des Rückgangs, der Momentum bleibt nach unten gerichtet, und es wird ein drohendes „Todeskreuz“ (50-Tage-Durchschnitt kreuzt unter 200-Tage-Durchschnitt) gemeldet. CoinMarketCap+1
📊 Wichtige technische Niveaus & Szenarien
Widerstand: Rund $0.187–$0.19. DOGE hat versucht und ist gescheitert, diese Zone zurückzugewinnen. CoinDesk+1
Unterstützung: Sofortige Unterstützung liegt bei etwa $0.165. Wenn dies bricht, befindet sich der nächste große Cluster bei etwa $0.15 oder sogar $0.07 (wo zuvor eine signifikante Akkumulation stattfand). CoinDesk+1
Aufwärtsszenario: Wenn DOGE $0.18+ zurückerobern und halten kann, schlagen Analysten eine mögliche Erholung in Richtung ~$0.26–$0.33 vor. CoinDesk+1
Abwärtsrisiko: Wenn die Unterstützung versagt, wird ein Rückgang auf $0.07 als mögliches Ziel im schlimmsten strukturellen Rückgang angegeben.
#USGovShutdownEnd?
#StrategyBTCPurchase #ProjectCrypto
1
107
Übersetzung ansehen
Binance Coin ($BNB ) Latest Analysis
{spot}(BNBUSDT)
📊 Current Snapshot
BNB is trading around $999 according to recent data.
BNB (BNB)
$999.36
+$13.92(+1.41%)Today
1D5D1M6MYTD1Y5Ymax
The token has recently broken past key resistance levels and entered a phase of price discovery. Blockchain News+2CoinCentral+2
On-chain activity and ecosystem growth remain strong: increasing transaction volumes and DeFi usage on the BNB Chain support the token’s utility. Blockchain News+2thestandard.io+2
✅ Bullish Indicators
Technical analysis suggests that BNB has broken out of its prior resistance zone and can target $1,200+ in the near-to-medium term. Analytics Insight+1
The ecosystem fundamentals are supportive: BNB is used for fee discounts, staking, governance and powers a large smart-chain ecosystem. thestandard.io
Deflationary tokenomics: the supply is capped and tokens are burned periodically, which supports scarcity. thestandard.io+1
⚠️ Risks & Caution
Being in “price discovery” means there’s less historical support data — this can lead to higher volatility and risk of sharp reversals. Blockchain News
Macroeconomic pressures, regulatory scrutiny of the parent Binance Exchange or the ecosystem could impact sentiment negatively.
Even though projections are bullish, some analysis points to potential downside if support fails — so staying above key support levels matters. Brave New Coin+1
🔍 My View
Given the data:
If BNB holds above its recent breakout zone, we could see further upside toward $1,200–$1,500 in the coming months.
If support fails or market sentiment turns, a pull-back toward earlier supports (in the ~$800-$900 region) is a real risk.
For holders: this looks like a favorable setup if you’re comfortable with crypto volatility. For new entrants: consider waiting for a pull-back or confirmation of support.
#USGovShutdownEnd? #StrategyBTCPurchase #CryptoScamSurge
Binance Coin ($BNB ) Latest Analysis
📊 Current Snapshot
BNB is trading around $999 according to recent data.
BNB (BNB)
$999.36
+$13.92(+1.41%)Today
1D5D1M6MYTD1Y5Ymax
The token has recently broken past key resistance levels and entered a phase of price discovery. Blockchain News+2CoinCentral+2
On-chain activity and ecosystem growth remain strong: increasing transaction volumes and DeFi usage on the BNB Chain support the token’s utility. Blockchain News+2thestandard.io+2
✅ Bullish Indicators
Technical analysis suggests that BNB has broken out of its prior resistance zone and can target $1,200+ in the near-to-medium term. Analytics Insight+1
The ecosystem fundamentals are supportive: BNB is used for fee discounts, staking, governance and powers a large smart-chain ecosystem. thestandard.io
Deflationary tokenomics: the supply is capped and tokens are burned periodically, which supports scarcity. thestandard.io+1
⚠️ Risks & Caution
Being in “price discovery” means there’s less historical support data — this can lead to higher volatility and risk of sharp reversals. Blockchain News
Macroeconomic pressures, regulatory scrutiny of the parent Binance Exchange or the ecosystem could impact sentiment negatively.
Even though projections are bullish, some analysis points to potential downside if support fails — so staying above key support levels matters. Brave New Coin+1
🔍 My View
Given the data:
If BNB holds above its recent breakout zone, we could see further upside toward $1,200–$1,500 in the coming months.
If support fails or market sentiment turns, a pull-back toward earlier supports (in the ~$800-$900 region) is a real risk.
For holders: this looks like a favorable setup if you’re comfortable with crypto volatility. For new entrants: consider waiting for a pull-back or confirmation of support.
#USGovShutdownEnd? #StrategyBTCPurchase #CryptoScamSurge
Binance Coin ($BNB ) Latest Analysis
📊 Current Snapshot
BNB is trading around $999 according to recent data.
BNB (BNB)
$999.36
+$13.92(+1.41%)Today
1D5D1M6MYTD1Y5Ymax
The token has recently broken past key resistance levels and entered a phase of price discovery. Blockchain News+2CoinCentral+2
On-chain activity and ecosystem growth remain strong: increasing transaction volumes and DeFi usage on the BNB Chain support the token’s utility. Blockchain News+2thestandard.io+2
✅ Bullish Indicators
Technical analysis suggests that BNB has broken out of its prior resistance zone and can target $1,200+ in the near-to-medium term. Analytics Insight+1
The ecosystem fundamentals are supportive: BNB is used for fee discounts, staking, governance and powers a large smart-chain ecosystem. thestandard.io
Deflationary tokenomics: the supply is capped and tokens are burned periodically, which supports scarcity. thestandard.io+1
⚠️ Risks & Caution
Being in “price discovery” means there’s less historical support data — this can lead to higher volatility and risk of sharp reversals. Blockchain News
Macroeconomic pressures, regulatory scrutiny of the parent Binance Exchange or the ecosystem could impact sentiment negatively.
Even though projections are bullish, some analysis points to potential downside if support fails — so staying above key support levels matters. Brave New Coin+1
🔍 My View
Given the data:
If BNB holds above its recent breakout zone, we could see further upside toward $1,200–$1,500 in the coming months.
If support fails or market sentiment turns, a pull-back toward earlier supports (in the ~$800-$900 region) is a real risk.
For holders: this looks like a favorable setup if you’re comfortable with crypto volatility. For new entrants: consider waiting for a pull-back or confirmation of support.
#USGovShutdownEnd? #StrategyBTCPurchase #CryptoScamSurge
1
5
Übersetzung ansehen
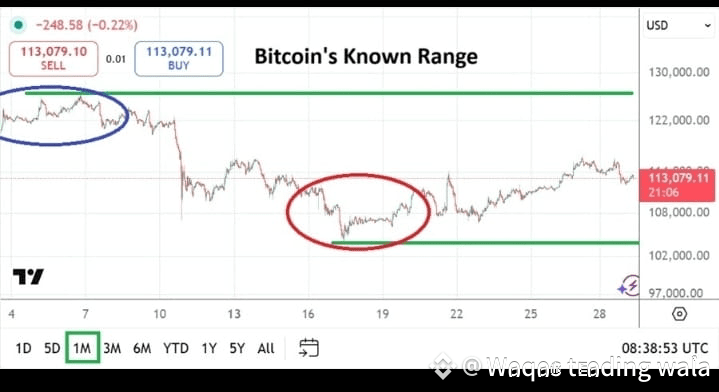
Here’s a brief but updated analysis of Bitcoin $BTC as of November 2025:
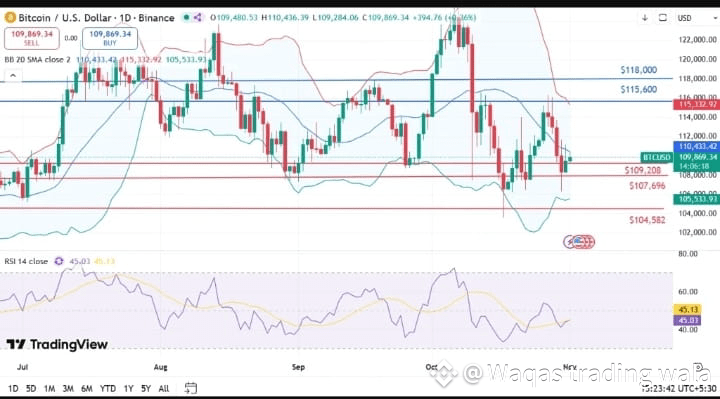
After a sharp correction in October (dropping more than 20% from its peak near ~$126,000), Bitcoin now appears to have undergone substantial deleveraging — especially in derivatives like perpetual futures. MarketWatch+1
According to JPMorgan, given Bitcoin’s current valuation versus gold (on a volatility-adjusted basis), the cryptocurrency looks undervalued and may have significant upside in the next 6-12 months. MarketWatch
On-chain metrics show signs of accumulation and undervaluation: for instance, Bitcoin’s MVRV ratio has hit a multi-month low, hinting that long-term holders may be buying in. CoinMarketCap
Macro tailwinds: With expectations of looser monetary policy (e.g., end of QT in the U.S.) and shifting institutional interest, Bitcoin is positioned to benefit if risk assets regain favour. CoinMarketCap+1
⚠️ Risks & headwinds
While the fundamentals look supportive, Bitcoin still faces important resistance levels (for example near ~$113,000-$120,000) which must be breached to validate a strong bullish run. Economi Journal+1
A breakdown of key support zones (e.g., ~$100,000 or below) would open the door for deeper corrections — possibly into the ~$90,000-$94,000 range, or worse, ~$74,000-$77,000 in a more serious downside scenario. The Economic Times
Short-term flows show some outflows (e.g., ETFs) and profit-taking by large holders (“whales”), which injects caution. CoinMarketCap
🎯 My view & what to watch
Short-term (next few weeks to 2-3 months): If Bitcoin holds above ~$100-110k and can break through ~$115k+ with volume, we could see a move toward ~$120k or higher. Else, consolidation or slight pull-back remains likely.
Medium-term (6-12 months): If the deleveraging is indeed done and institutional momentum returns, targets in the ~$150k+ zone are plausible given the undervaluation vs gold thesis.
Key levels to monitor:
Support zones: ~$100,000-101,000; ~$90,000-94,000 if things weaken.
Resistance zones: ~$113,000-120,000.
Here’s a brief but updated analysis of Bitcoin $BTC as of November 2025:
After a sharp correction in October (dropping more than 20% from its peak near ~$126,000), Bitcoin now appears to have undergone substantial deleveraging — especially in derivatives like perpetual futures. MarketWatch+1
According to JPMorgan, given Bitcoin’s current valuation versus gold (on a volatility-adjusted basis), the cryptocurrency looks undervalued and may have significant upside in the next 6-12 months. MarketWatch
On-chain metrics show signs of accumulation and undervaluation: for instance, Bitcoin’s MVRV ratio has hit a multi-month low, hinting that long-term holders may be buying in. CoinMarketCap
Macro tailwinds: With expectations of looser monetary policy (e.g., end of QT in the U.S.) and shifting institutional interest, Bitcoin is positioned to benefit if risk assets regain favour. CoinMarketCap+1
⚠️ Risks & headwinds
While the fundamentals look supportive, Bitcoin still faces important resistance levels (for example near ~$113,000-$120,000) which must be breached to validate a strong bullish run. Economi Journal+1
A breakdown of key support zones (e.g., ~$100,000 or below) would open the door for deeper corrections — possibly into the ~$90,000-$94,000 range, or worse, ~$74,000-$77,000 in a more serious downside scenario. The Economic Times
Short-term flows show some outflows (e.g., ETFs) and profit-taking by large holders (“whales”), which injects caution. CoinMarketCap
🎯 My view & what to watch
Short-term (next few weeks to 2-3 months): If Bitcoin holds above ~$100-110k and can break through ~$115k+ with volume, we could see a move toward ~$120k or higher. Else, consolidation or slight pull-back remains likely.
Medium-term (6-12 months): If the deleveraging is indeed done and institutional momentum returns, targets in the ~$150k+ zone are plausible given the undervaluation vs gold thesis.
Key levels to monitor:
Support zones: ~$100,000-101,000; ~$90,000-94,000 if things weaken.
Resistance zones: ~$113,000-120,000.
After a sharp correction in October (dropping more than 20% from its peak near ~$126,000), Bitcoin now appears to have undergone substantial deleveraging — especially in derivatives like perpetual futures. MarketWatch+1
According to JPMorgan, given Bitcoin’s current valuation versus gold (on a volatility-adjusted basis), the cryptocurrency looks undervalued and may have significant upside in the next 6-12 months. MarketWatch
On-chain metrics show signs of accumulation and undervaluation: for instance, Bitcoin’s MVRV ratio has hit a multi-month low, hinting that long-term holders may be buying in. CoinMarketCap
Macro tailwinds: With expectations of looser monetary policy (e.g., end of QT in the U.S.) and shifting institutional interest, Bitcoin is positioned to benefit if risk assets regain favour. CoinMarketCap+1
⚠️ Risks & headwinds
While the fundamentals look supportive, Bitcoin still faces important resistance levels (for example near ~$113,000-$120,000) which must be breached to validate a strong bullish run. Economi Journal+1
A breakdown of key support zones (e.g., ~$100,000 or below) would open the door for deeper corrections — possibly into the ~$90,000-$94,000 range, or worse, ~$74,000-$77,000 in a more serious downside scenario. The Economic Times
Short-term flows show some outflows (e.g., ETFs) and profit-taking by large holders (“whales”), which injects caution. CoinMarketCap
🎯 My view & what to watch
Short-term (next few weeks to 2-3 months): If Bitcoin holds above ~$100-110k and can break through ~$115k+ with volume, we could see a move toward ~$120k or higher. Else, consolidation or slight pull-back remains likely.
Medium-term (6-12 months): If the deleveraging is indeed done and institutional momentum returns, targets in the ~$150k+ zone are plausible given the undervaluation vs gold thesis.
Key levels to monitor:
Support zones: ~$100,000-101,000; ~$90,000-94,000 if things weaken.
Resistance zones: ~$113,000-120,000.
1
4
Übersetzung ansehen
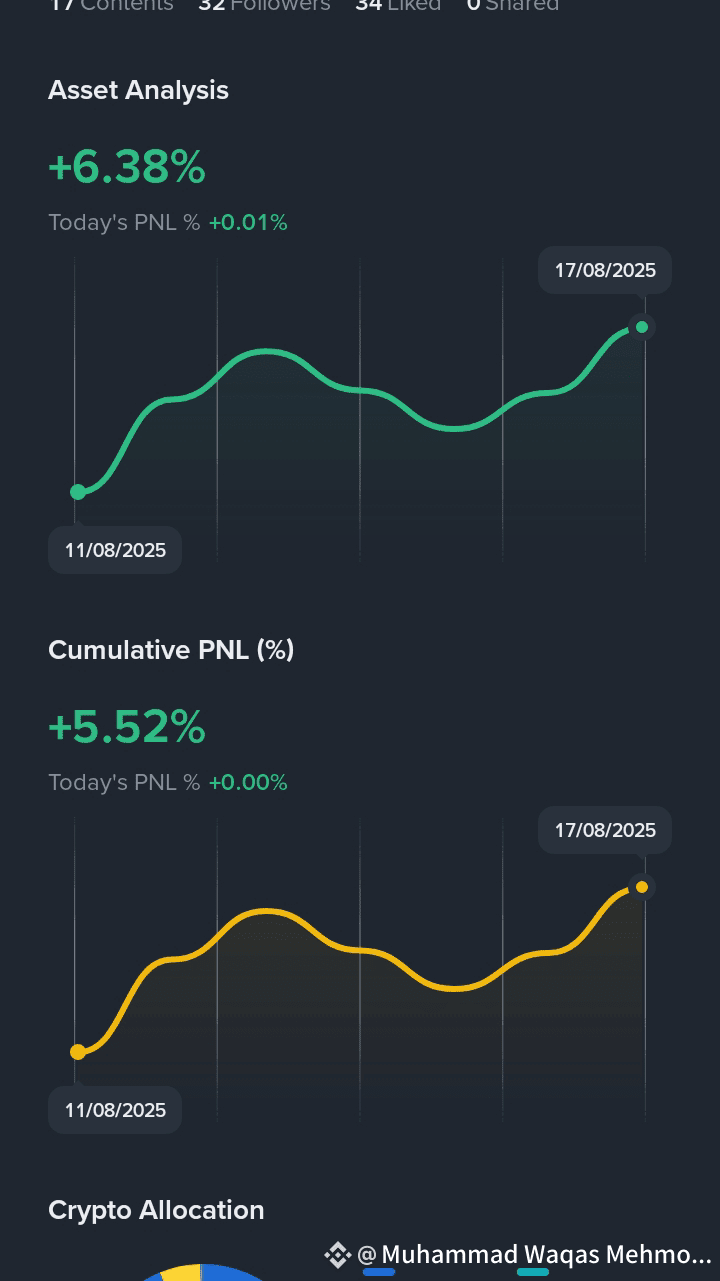
See my returns and portfolio breakdown. Follow for investment tips
See my returns and portfolio breakdown. Follow for investment tips
1
19
Übersetzung ansehen
Signal 1 & 2(Only Spot)
Buy SOL between
190 - 185
SUI
3.62 - 3.75
For reference of entry 178 is s.l for SOL and 3.58 is s.l for Sui you can take up to 3% risk maximum collectively in both SOL and SUI
Bullish move is ahead any dip in next 2,3 days is for buying in spot
Exact T.P and s.l will be shared once order fill
Note: Both trades are for spot not for future So do not take risk in future with these two trades
Signal 1 & 2(Only Spot)
Buy SOL between
190 - 185
SUI
3.62 - 3.75
For reference of entry 178 is s.l for SOL and 3.58 is s.l for Sui you can take up to 3% risk maximum collectively in both SOL and SUI
Bullish move is ahead any dip in next 2,3 days is for buying in spot
Exact T.P and s.l will be shared once order fill
Note: Both trades are for spot not for future So do not take risk in future with these two trades
Buy SOL between
190 - 185
SUI
3.62 - 3.75
For reference of entry 178 is s.l for SOL and 3.58 is s.l for Sui you can take up to 3% risk maximum collectively in both SOL and SUI
Bullish move is ahead any dip in next 2,3 days is for buying in spot
Exact T.P and s.l will be shared once order fill
Note: Both trades are for spot not for future So do not take risk in future with these two trades
1
214

Übersetzung ansehen
BTCUSD BUY 118300
TP 1 118400
TP 2 118500
TP 3 118600
TP 4 119900
SL @ 117000
BTCUSD BUY 118300
TP 1 118400
TP 2 118500
TP 3 118600
TP 4 119900
SL @ 117000
TP 1 118400
TP 2 118500
TP 3 118600
TP 4 119900
SL @ 117000
1
30
Der hochkarätige Gipfel am Freitag zwischen dem US-Präsidenten Donald Trump und Russlands Wladimir Putin brachte keinen Durchbruch, auch wenn Trump ihn als „produktiv“ beschrieb, während Putin ein weiteres Treffen in Moskau vorschlug.
Das Weiße Haus hatte die Gespräche – die ursprünglich als Versuch gesehen wurden, einen Waffenstillstand zwischen Russland und der Ukraine zu sichern – heruntergespielt, wobei die Sprecherin Karoline Leavitt den Gipfel als „eine Zuhörübung für den Präsidenten“ bezeichnete.
Nach dem Treffen am Freitag sagte Trump: „Es gibt keinen Deal, bis es einen Deal gibt.“
Die Ukraine war nicht Teil der Gespräche, was Bedenken aufwarf, dass ein potenzieller Deal die Souveränität des Landes gefährden könnte. „Die Ukraine ist bereit, so produktiv wie möglich zu arbeiten, um den Krieg zu beenden, und wir zählen auf eine starke Position aus Amerika … Ein Treffen der Führungskräfte ist notwendig – mindestens die Ukraine, Amerika und die russische Seite“, sagte Präsident Wolodymyr Selenskyj in einem Post auf X vor dem Gipfel.
Dies war Putins erster Besuch in den USA seit etwa einem Jahrzehnt, wobei der russische Präsident betonte, dass es eine „schwierige Zeit“ für die bilateralen Beziehungen sei. Das Treffen fand in Alaska statt, das einst russisches Territorium war.
„Es gab viele, viele Punkte, auf die wir uns geeinigt haben … Ich würde sagen, es gibt ein paar große Themen, bei denen wir noch nicht ganz durch sind, aber wir haben einige Fortschritte gemacht“, sagte Trump auf einer gemeinsamen Pressekonferenz mit Putin. Die Führer nahmen keine Fragen von der Presse entgegen.
Der hochkarätige Gipfel am Freitag zwischen dem US-Präsidenten Donald Trump und Russlands Wladimir Putin brachte keinen Durchbruch, auch wenn Trump ihn als „produktiv“ beschrieb, während Putin ein weiteres Treffen in Moskau vorschlug.
Das Weiße Haus hatte die Gespräche – die ursprünglich als Versuch gesehen wurden, einen Waffenstillstand zwischen Russland und der Ukraine zu sichern – heruntergespielt, wobei die Sprecherin Karoline Leavitt den Gipfel als „eine Zuhörübung für den Präsidenten“ bezeichnete.
Nach dem Treffen am Freitag sagte Trump: „Es gibt keinen Deal, bis es einen Deal gibt.“
Die Ukraine war nicht Teil der Gespräche, was Bedenken aufwarf, dass ein potenzieller Deal die Souveränität des Landes gefährden könnte. „Die Ukraine ist bereit, so produktiv wie möglich zu arbeiten, um den Krieg zu beenden, und wir zählen auf eine starke Position aus Amerika … Ein Treffen der Führungskräfte ist notwendig – mindestens die Ukraine, Amerika und die russische Seite“, sagte Präsident Wolodymyr Selenskyj in einem Post auf X vor dem Gipfel.
Dies war Putins erster Besuch in den USA seit etwa einem Jahrzehnt, wobei der russische Präsident betonte, dass es eine „schwierige Zeit“ für die bilateralen Beziehungen sei. Das Treffen fand in Alaska statt, das einst russisches Territorium war.
„Es gab viele, viele Punkte, auf die wir uns geeinigt haben … Ich würde sagen, es gibt ein paar große Themen, bei denen wir noch nicht ganz durch sind, aber wir haben einige Fortschritte gemacht“, sagte Trump auf einer gemeinsamen Pressekonferenz mit Putin. Die Führer nahmen keine Fragen von der Presse entgegen.
Das Weiße Haus hatte die Gespräche – die ursprünglich als Versuch gesehen wurden, einen Waffenstillstand zwischen Russland und der Ukraine zu sichern – heruntergespielt, wobei die Sprecherin Karoline Leavitt den Gipfel als „eine Zuhörübung für den Präsidenten“ bezeichnete.
Nach dem Treffen am Freitag sagte Trump: „Es gibt keinen Deal, bis es einen Deal gibt.“
Die Ukraine war nicht Teil der Gespräche, was Bedenken aufwarf, dass ein potenzieller Deal die Souveränität des Landes gefährden könnte. „Die Ukraine ist bereit, so produktiv wie möglich zu arbeiten, um den Krieg zu beenden, und wir zählen auf eine starke Position aus Amerika … Ein Treffen der Führungskräfte ist notwendig – mindestens die Ukraine, Amerika und die russische Seite“, sagte Präsident Wolodymyr Selenskyj in einem Post auf X vor dem Gipfel.
Dies war Putins erster Besuch in den USA seit etwa einem Jahrzehnt, wobei der russische Präsident betonte, dass es eine „schwierige Zeit“ für die bilateralen Beziehungen sei. Das Treffen fand in Alaska statt, das einst russisches Territorium war.
„Es gab viele, viele Punkte, auf die wir uns geeinigt haben … Ich würde sagen, es gibt ein paar große Themen, bei denen wir noch nicht ganz durch sind, aber wir haben einige Fortschritte gemacht“, sagte Trump auf einer gemeinsamen Pressekonferenz mit Putin. Die Führer nahmen keine Fragen von der Presse entgegen.

3
499
Übersetzung ansehen
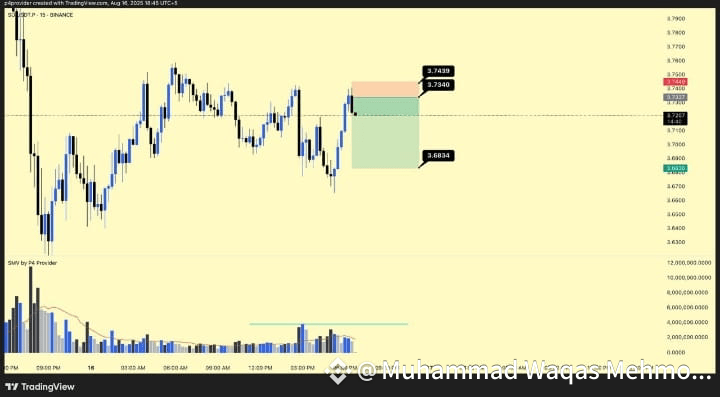
SUI Trade (Futures)
Sell Limit: 3.7340
SL: 3.7440
TP: 3.6835
Risk Reward Ratio (RRR) is 1:4.5 means if TP hit we will get 4.5% gain over capital
Use 1% risk of your capital in this trade.
Example: If you have $1000 balance then set Sl at -$10
SUI Trade (Futures)
Sell Limit: 3.7340
SL: 3.7440
TP: 3.6835
Risk Reward Ratio (RRR) is 1:4.5 means if TP hit we will get 4.5% gain over capital
Use 1% risk of your capital in this trade.
Example: If you have $1000 balance then set Sl at -$10
Sell Limit: 3.7340
SL: 3.7440
TP: 3.6835
Risk Reward Ratio (RRR) is 1:4.5 means if TP hit we will get 4.5% gain over capital
Use 1% risk of your capital in this trade.
Example: If you have $1000 balance then set Sl at -$10
1
5
Übersetzung ansehen
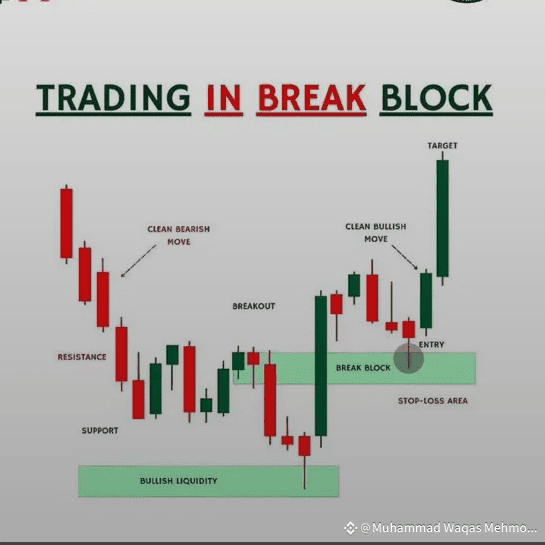
A breaker block is a specific candlestick pattern used in technical analysis to identify potential reversals in market trends. It's particularly useful for traders looking to spot shifts in market sentiment.
Key Characteristics of a Breaker Block:
1. *Structure*: A breaker block typically consists of a strong candle that breaks the structure of the previous candles. This can be a large bullish or bearish candle that indicates a potential shift in market direction.
2. *Market Structure Break*: The breaker block often occurs after a significant move in price, where the market structure is broken, indicating a potential reversal or change in trend.
3. *Confirmation*: Traders often look for confirmation of the breaker block through subsequent price action, such as a follow-through in the direction of the breaker block.
How to Identify a Breaker Block:
1. *Look for a Strong Candle*: Identify a strong candle that breaks the structure of previous candles. This candle should have a large body and minimal wicks, indicating strong buying or selling pressure.
2. *Check the Market Structure*: Ensure that the breaker block occurs at a significant market structure level, such as a support or resistance level.
3. *Confirm the Breaker Block*: Wait for confirmation of the breaker block through subsequent price action.
Using Breaker Blocks in Trading:
1. *Reversal Signals*: Breaker blocks can be used as reversal signals, indicating a potential change in market direction.
2. *Entry and Exit Points*: Traders can use breaker blocks to identify potential entry and exit points for trades.
3. *Risk Management*: Breaker blocks can also be used to manage risk by setting stop-loss levels or adjusting position sizes.
By understanding and identifying breaker blocks, traders can gain insights into potential market reversals and make more informed trading decisions.
A breaker block is a specific candlestick pattern used in technical analysis to identify potential reversals in market trends. It's particularly useful for traders looking to spot shifts in market sentiment.
Key Characteristics of a Breaker Block:
1. *Structure*: A breaker block typically consists of a strong candle that breaks the structure of the previous candles. This can be a large bullish or bearish candle that indicates a potential shift in market direction.
2. *Market Structure Break*: The breaker block often occurs after a significant move in price, where the market structure is broken, indicating a potential reversal or change in trend.
3. *Confirmation*: Traders often look for confirmation of the breaker block through subsequent price action, such as a follow-through in the direction of the breaker block.
How to Identify a Breaker Block:
1. *Look for a Strong Candle*: Identify a strong candle that breaks the structure of previous candles. This candle should have a large body and minimal wicks, indicating strong buying or selling pressure.
2. *Check the Market Structure*: Ensure that the breaker block occurs at a significant market structure level, such as a support or resistance level.
3. *Confirm the Breaker Block*: Wait for confirmation of the breaker block through subsequent price action.
Using Breaker Blocks in Trading:
1. *Reversal Signals*: Breaker blocks can be used as reversal signals, indicating a potential change in market direction.
2. *Entry and Exit Points*: Traders can use breaker blocks to identify potential entry and exit points for trades.
3. *Risk Management*: Breaker blocks can also be used to manage risk by setting stop-loss levels or adjusting position sizes.
By understanding and identifying breaker blocks, traders can gain insights into potential market reversals and make more informed trading decisions.
Key Characteristics of a Breaker Block:
1. *Structure*: A breaker block typically consists of a strong candle that breaks the structure of the previous candles. This can be a large bullish or bearish candle that indicates a potential shift in market direction.
2. *Market Structure Break*: The breaker block often occurs after a significant move in price, where the market structure is broken, indicating a potential reversal or change in trend.
3. *Confirmation*: Traders often look for confirmation of the breaker block through subsequent price action, such as a follow-through in the direction of the breaker block.
How to Identify a Breaker Block:
1. *Look for a Strong Candle*: Identify a strong candle that breaks the structure of previous candles. This candle should have a large body and minimal wicks, indicating strong buying or selling pressure.
2. *Check the Market Structure*: Ensure that the breaker block occurs at a significant market structure level, such as a support or resistance level.
3. *Confirm the Breaker Block*: Wait for confirmation of the breaker block through subsequent price action.
Using Breaker Blocks in Trading:
1. *Reversal Signals*: Breaker blocks can be used as reversal signals, indicating a potential change in market direction.
2. *Entry and Exit Points*: Traders can use breaker blocks to identify potential entry and exit points for trades.
3. *Risk Management*: Breaker blocks can also be used to manage risk by setting stop-loss levels or adjusting position sizes.
By understanding and identifying breaker blocks, traders can gain insights into potential market reversals and make more informed trading decisions.
1
11
Anmelden und weiter Inhalte entdecken
Krypto-Nutzer weltweit auf Binance Square kennenlernen
⚡️ Bleib in Sachen Krypto stets am Puls.
💬 Die weltgrößte Kryptobörse vertraut darauf.
👍 Erhalte verlässliche Einblicke von verifizierten Creators.
E-Mail-Adresse/Telefonnummer
Trendthemen
BinanceLaunchesBinanceIntelligence
645,504 Aufrufe
3,960 Kommentare
🧠 Traden wie ein erfahrener Investmentfonds? Jetzt übernimmt die KI das kostenlos für dich! 🤖📈
Wilsontrader97
·10 Likes
·11.1k Aufrufe
BTCFallsBelow$84K
9,417 Aufrufe
45 Kommentare
DubaiVARAIssuesReserveAssetAuditCircular
126 Aufrufe
36 Kommentare