
aventa trader
18 Beiträge
aventa trader
Melden
Nutzer blockieren
Trade eröffnen
Regelmäßiger Trader
2.8 Jahre
17 Following
7 Follower
15 Like gegeben
Beiträge
Portfolio
Übersetzung ansehen
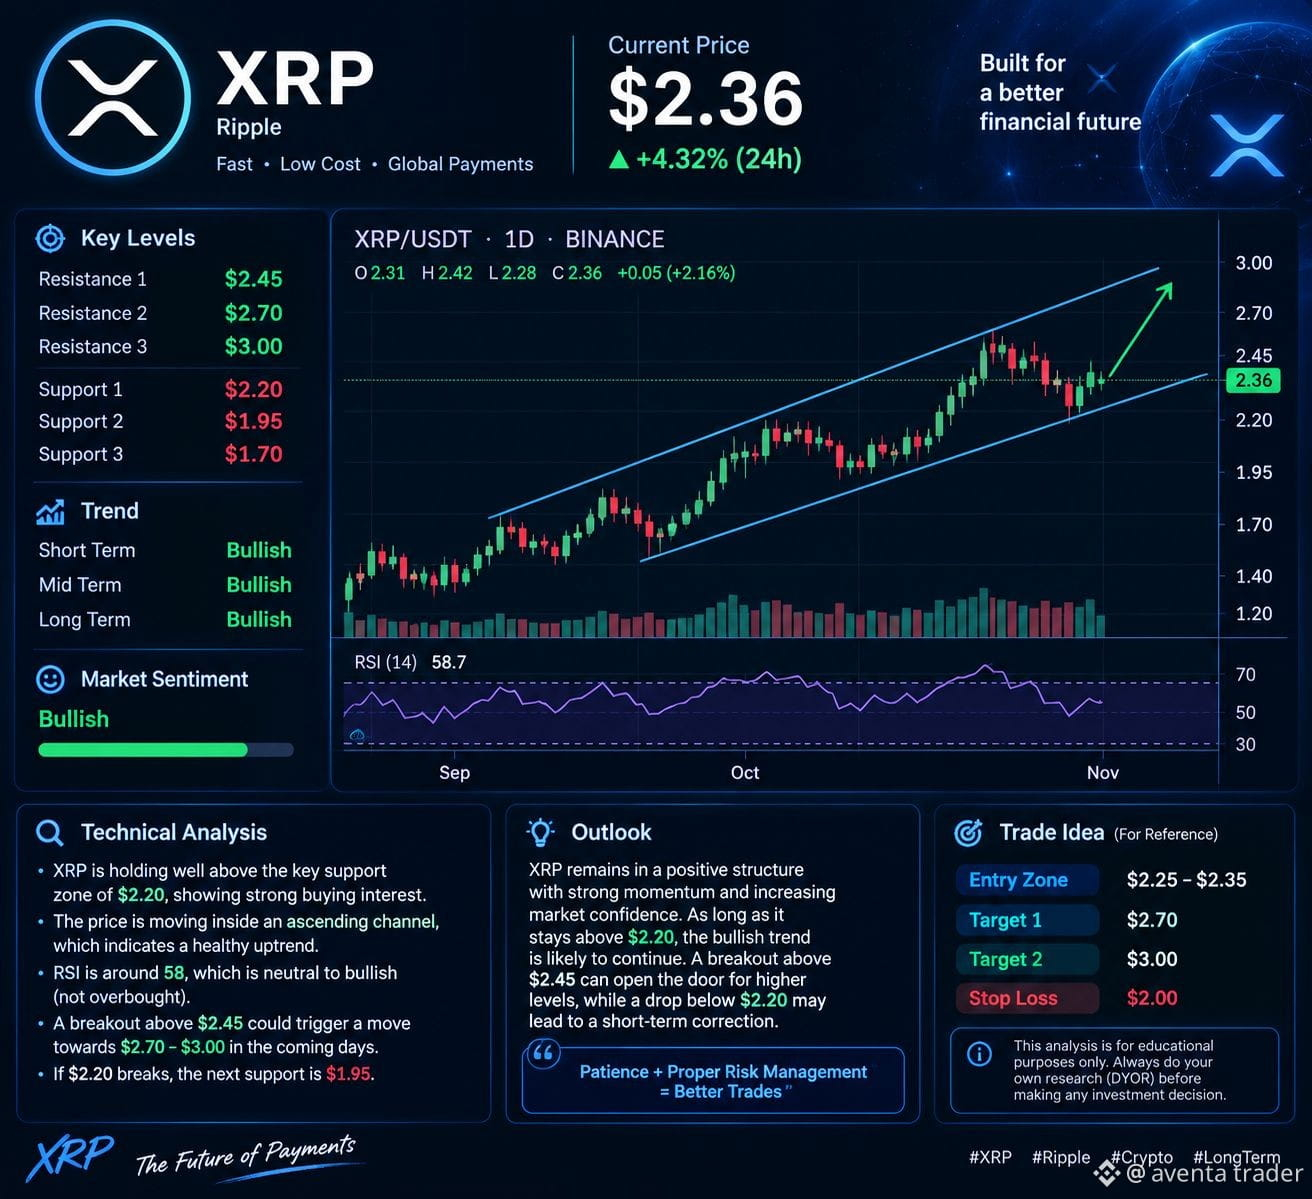
$XRP 📊 XRP (Ripple) Market Analysis
🔹 Trend: Bullish, pending breakout confirmation
🟢 Resistance: $2.45 | $2.70 | $3.00
🔵 Support: $2.20 | $1.95 | $1.70
🚀 Bullish Outlook: A strong breakout above $2.45 could open the way toward $2.70 and potentially $3.00.
⚠️ Risk Factor: A drop below $2.20 may increase selling pressure, with $1.95 as the next key support.
💡 Strategy: Watch for breakout confirmation, trading volume, and effective risk management before entering a position.
#XRP #Ripple #CryptoAnalysis 📈
{spot}(XRPUSDT)
#FedWatch #BitcoinCore32.1RaisesPeerConnectionLimit
$XRP 📊 XRP (Ripple) Market Analysis
🔹 Trend: Bullish, pending breakout confirmation
🟢 Resistance: $2.45 | $2.70 | $3.00
🔵 Support: $2.20 | $1.95 | $1.70
🚀 Bullish Outlook: A strong breakout above $2.45 could open the way toward $2.70 and potentially $3.00.
⚠️ Risk Factor: A drop below $2.20 may increase selling pressure, with $1.95 as the next key support.
💡 Strategy: Watch for breakout confirmation, trading volume, and effective risk management before entering a position.
#XRP #Ripple #CryptoAnalysis 📈
#FedWatch #BitcoinCore32.1RaisesPeerConnectionLimit
🔹 Trend: Bullish, pending breakout confirmation
🟢 Resistance: $2.45 | $2.70 | $3.00
🔵 Support: $2.20 | $1.95 | $1.70
🚀 Bullish Outlook: A strong breakout above $2.45 could open the way toward $2.70 and potentially $3.00.
⚠️ Risk Factor: A drop below $2.20 may increase selling pressure, with $1.95 as the next key support.
💡 Strategy: Watch for breakout confirmation, trading volume, and effective risk management before entering a position.
#XRP #Ripple #CryptoAnalysis 📈
#FedWatch #BitcoinCore32.1RaisesPeerConnectionLimit
104
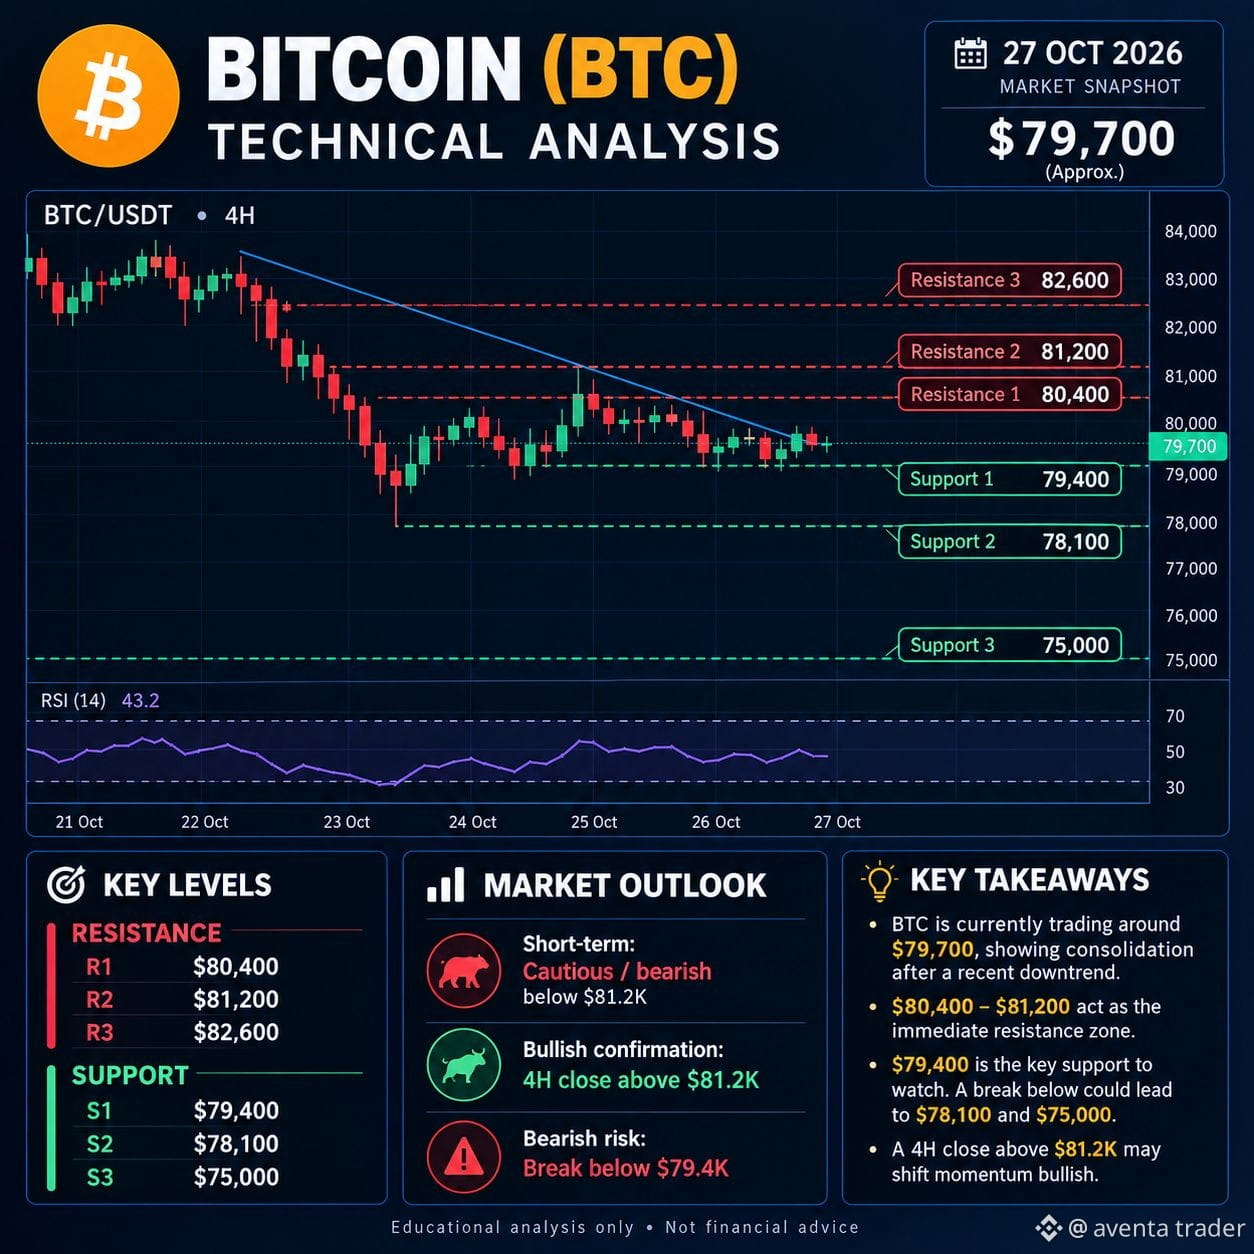
$BTC $79,700
Ungefährer Preis zum Zeitpunkt der Analyse
Bitcoin konsolidiert nach dem jüngsten Verkaufsdruck. Der kurzfristige Trend bleibt vorsichtig, und der Kurs muss den Widerstandsbereich bei 81.200 $ zurückerobern, um den bullischen Ausblick zu stärken.
📈 Wichtige technische Niveaus
Niveau Preis
🔴 Widerstand 3 82.600 $
🔴 Widerstand 2 81.200 $
🔴 Widerstand 1 80.400 $
🟢 Unterstützung 1 79.400 $
🟢 Unterstützung 2 78.100 $
🟢 Unterstützung 3 75.000 $
🔍 Marktausblick
Bärisches Szenario: Ein bestätigter Durchbruch unter 79.400 $ könnte den Weg zu 78.100 $ und möglicherweise 75.000 $ freimachen.
Bullisches Szenario: Ein starker 4-Stunden-Schlusskurs über 81.200 $ könnte den Weg in Richtung 82.600 $ ebnen.
Risikomanagement: Beobachten Sie die Kursbewegungen an Unterstützungs- und Widerstandsniveaus; vermeiden Sie bei volatilen Marktbedingungen einen hohen Hebel.
{spot}(BTCUSDT)
#BinancePick #EarningsSeason
$BTC $79,700
Ungefährer Preis zum Zeitpunkt der Analyse
Bitcoin konsolidiert nach dem jüngsten Verkaufsdruck. Der kurzfristige Trend bleibt vorsichtig, und der Kurs muss den Widerstandsbereich bei 81.200 $ zurückerobern, um den bullischen Ausblick zu stärken.
📈 Wichtige technische Niveaus
Niveau Preis
🔴 Widerstand 3 82.600 $
🔴 Widerstand 2 81.200 $
🔴 Widerstand 1 80.400 $
🟢 Unterstützung 1 79.400 $
🟢 Unterstützung 2 78.100 $
🟢 Unterstützung 3 75.000 $
🔍 Marktausblick
Bärisches Szenario: Ein bestätigter Durchbruch unter 79.400 $ könnte den Weg zu 78.100 $ und möglicherweise 75.000 $ freimachen.
Bullisches Szenario: Ein starker 4-Stunden-Schlusskurs über 81.200 $ könnte den Weg in Richtung 82.600 $ ebnen.
Risikomanagement: Beobachten Sie die Kursbewegungen an Unterstützungs- und Widerstandsniveaus; vermeiden Sie bei volatilen Marktbedingungen einen hohen Hebel.
#BinancePick #EarningsSeason
Ungefährer Preis zum Zeitpunkt der Analyse
Bitcoin konsolidiert nach dem jüngsten Verkaufsdruck. Der kurzfristige Trend bleibt vorsichtig, und der Kurs muss den Widerstandsbereich bei 81.200 $ zurückerobern, um den bullischen Ausblick zu stärken.
📈 Wichtige technische Niveaus
Niveau Preis
🔴 Widerstand 3 82.600 $
🔴 Widerstand 2 81.200 $
🔴 Widerstand 1 80.400 $
🟢 Unterstützung 1 79.400 $
🟢 Unterstützung 2 78.100 $
🟢 Unterstützung 3 75.000 $
🔍 Marktausblick
Bärisches Szenario: Ein bestätigter Durchbruch unter 79.400 $ könnte den Weg zu 78.100 $ und möglicherweise 75.000 $ freimachen.
Bullisches Szenario: Ein starker 4-Stunden-Schlusskurs über 81.200 $ könnte den Weg in Richtung 82.600 $ ebnen.
Risikomanagement: Beobachten Sie die Kursbewegungen an Unterstützungs- und Widerstandsniveaus; vermeiden Sie bei volatilen Marktbedingungen einen hohen Hebel.
#BinancePick #EarningsSeason
71
Übersetzung ansehen
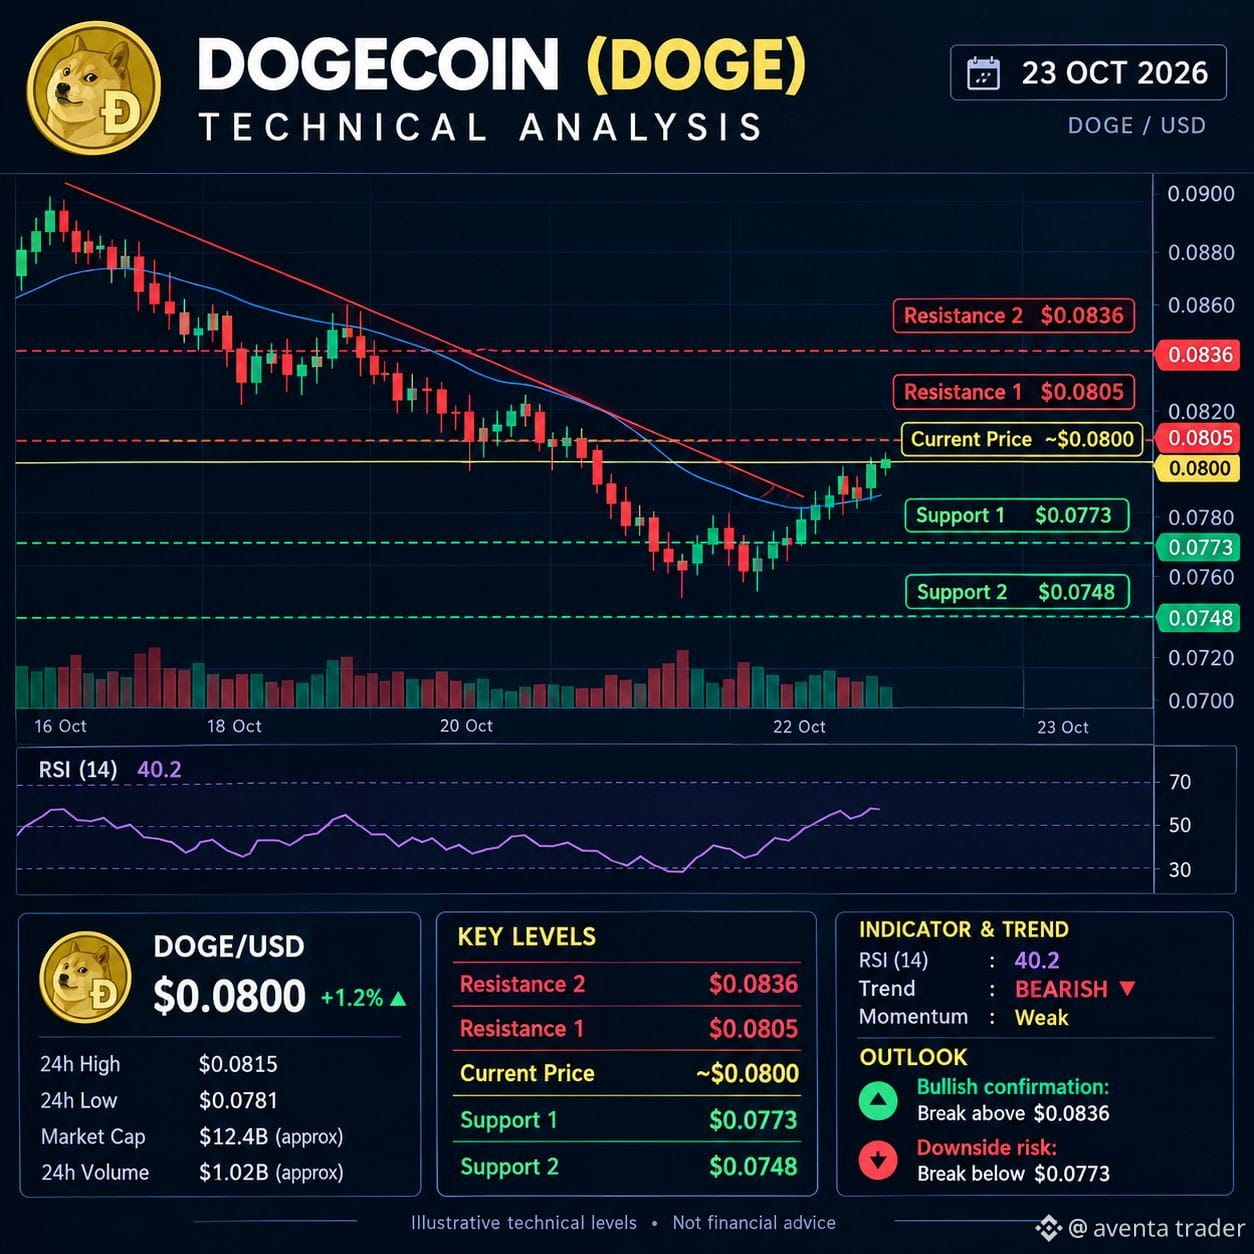
$DOGE Dogecoin is showing a bearish trend with a possible short-term recovery, but buyers need to break key resistance levels before a stronger bullish move can be confirmed. DOGE is trading around $0.079–$0.080 in the latest available market data.
📊 Key Market Levels
🟢 Support: $0.0773 / $0.0748
🔴 Resistance: $0.0805 / $0.0836
🚀 Bullish scenario: A confirmed breakout above $0.0836 could open the way toward $0.0862.
⚠️ Bearish scenario: A breakdown below $0.0773 could expose DOGE to further downside toward $0.0748.
🔍 Market Outlook
DOGE remains under selling pressure, with its daily RSI around 40, indicating weak momentum. A sustained move above resistance would improve the short-term outlook, while failure to hold support could lead to another decline.
{spot}(DOGEUSDT)
#EarningsSeason #BinancePick
$DOGE Dogecoin is showing a bearish trend with a possible short-term recovery, but buyers need to break key resistance levels before a stronger bullish move can be confirmed. DOGE is trading around $0.079–$0.080 in the latest available market data.
📊 Key Market Levels
🟢 Support: $0.0773 / $0.0748
🔴 Resistance: $0.0805 / $0.0836
🚀 Bullish scenario: A confirmed breakout above $0.0836 could open the way toward $0.0862.
⚠️ Bearish scenario: A breakdown below $0.0773 could expose DOGE to further downside toward $0.0748.
🔍 Market Outlook
DOGE remains under selling pressure, with its daily RSI around 40, indicating weak momentum. A sustained move above resistance would improve the short-term outlook, while failure to hold support could lead to another decline.
#EarningsSeason #BinancePick
📊 Key Market Levels
🟢 Support: $0.0773 / $0.0748
🔴 Resistance: $0.0805 / $0.0836
🚀 Bullish scenario: A confirmed breakout above $0.0836 could open the way toward $0.0862.
⚠️ Bearish scenario: A breakdown below $0.0773 could expose DOGE to further downside toward $0.0748.
🔍 Market Outlook
DOGE remains under selling pressure, with its daily RSI around 40, indicating weak momentum. A sustained move above resistance would improve the short-term outlook, while failure to hold support could lead to another decline.
#EarningsSeason #BinancePick
79
Übersetzung ansehen
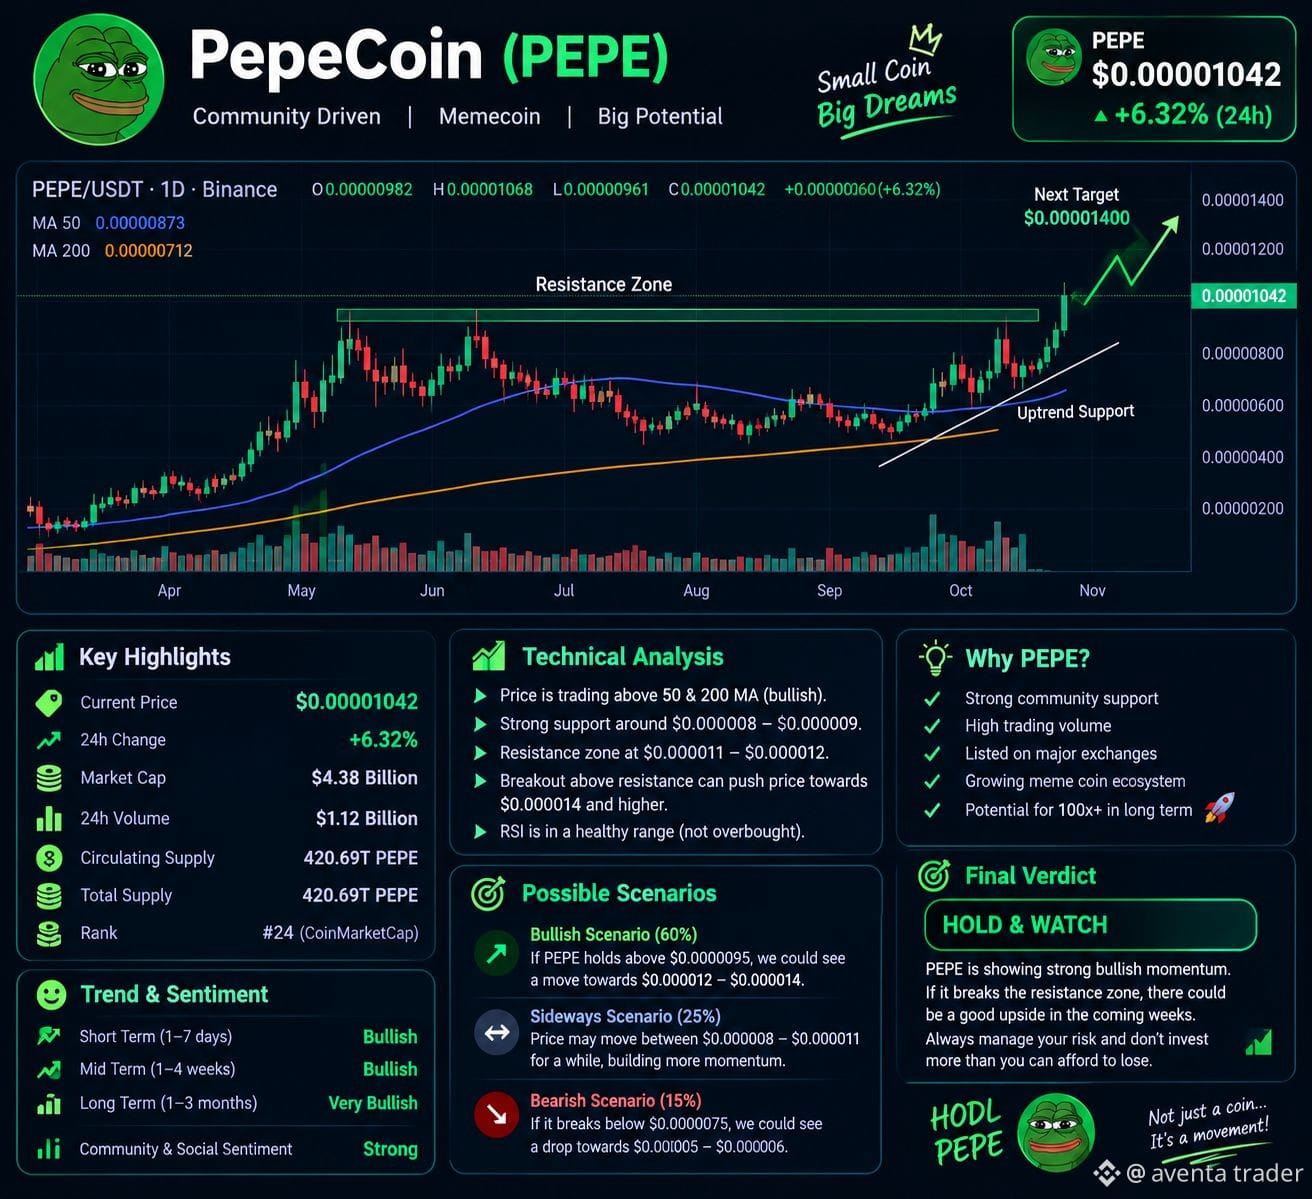
$PEPE 🐸 Pepe Coin (PEPE) — Professional Market Analysis
Market Trend: Bullish momentum with high volatility
Trading Pair: PEPE/USDT
📊 Technical Analysis
🟢 Bullish Outlook: A sustained move above resistance could support further upside.
📈 Resistance: A confirmed breakout above the recent resistance zone may open the way for another upward move.
🛡️ Support: Watch the recent swing low; a breakdown below support could trigger selling pressure.
⚠️ Risk Level: High — PEPE is a meme coin and can experience sharp price swings.
{spot}(PEPEUSDT)
#EarningsSeason #ChinaSeeksToSeize61800BTC
$PEPE 🐸 Pepe Coin (PEPE) — Professional Market Analysis
Market Trend: Bullish momentum with high volatility
Trading Pair: PEPE/USDT
📊 Technical Analysis
🟢 Bullish Outlook: A sustained move above resistance could support further upside.
📈 Resistance: A confirmed breakout above the recent resistance zone may open the way for another upward move.
🛡️ Support: Watch the recent swing low; a breakdown below support could trigger selling pressure.
⚠️ Risk Level: High — PEPE is a meme coin and can experience sharp price swings.
#EarningsSeason #ChinaSeeksToSeize61800BTC
Market Trend: Bullish momentum with high volatility
Trading Pair: PEPE/USDT
📊 Technical Analysis
🟢 Bullish Outlook: A sustained move above resistance could support further upside.
📈 Resistance: A confirmed breakout above the recent resistance zone may open the way for another upward move.
🛡️ Support: Watch the recent swing low; a breakdown below support could trigger selling pressure.
⚠️ Risk Level: High — PEPE is a meme coin and can experience sharp price swings.
#EarningsSeason #ChinaSeeksToSeize61800BTC
176
Übersetzung ansehen
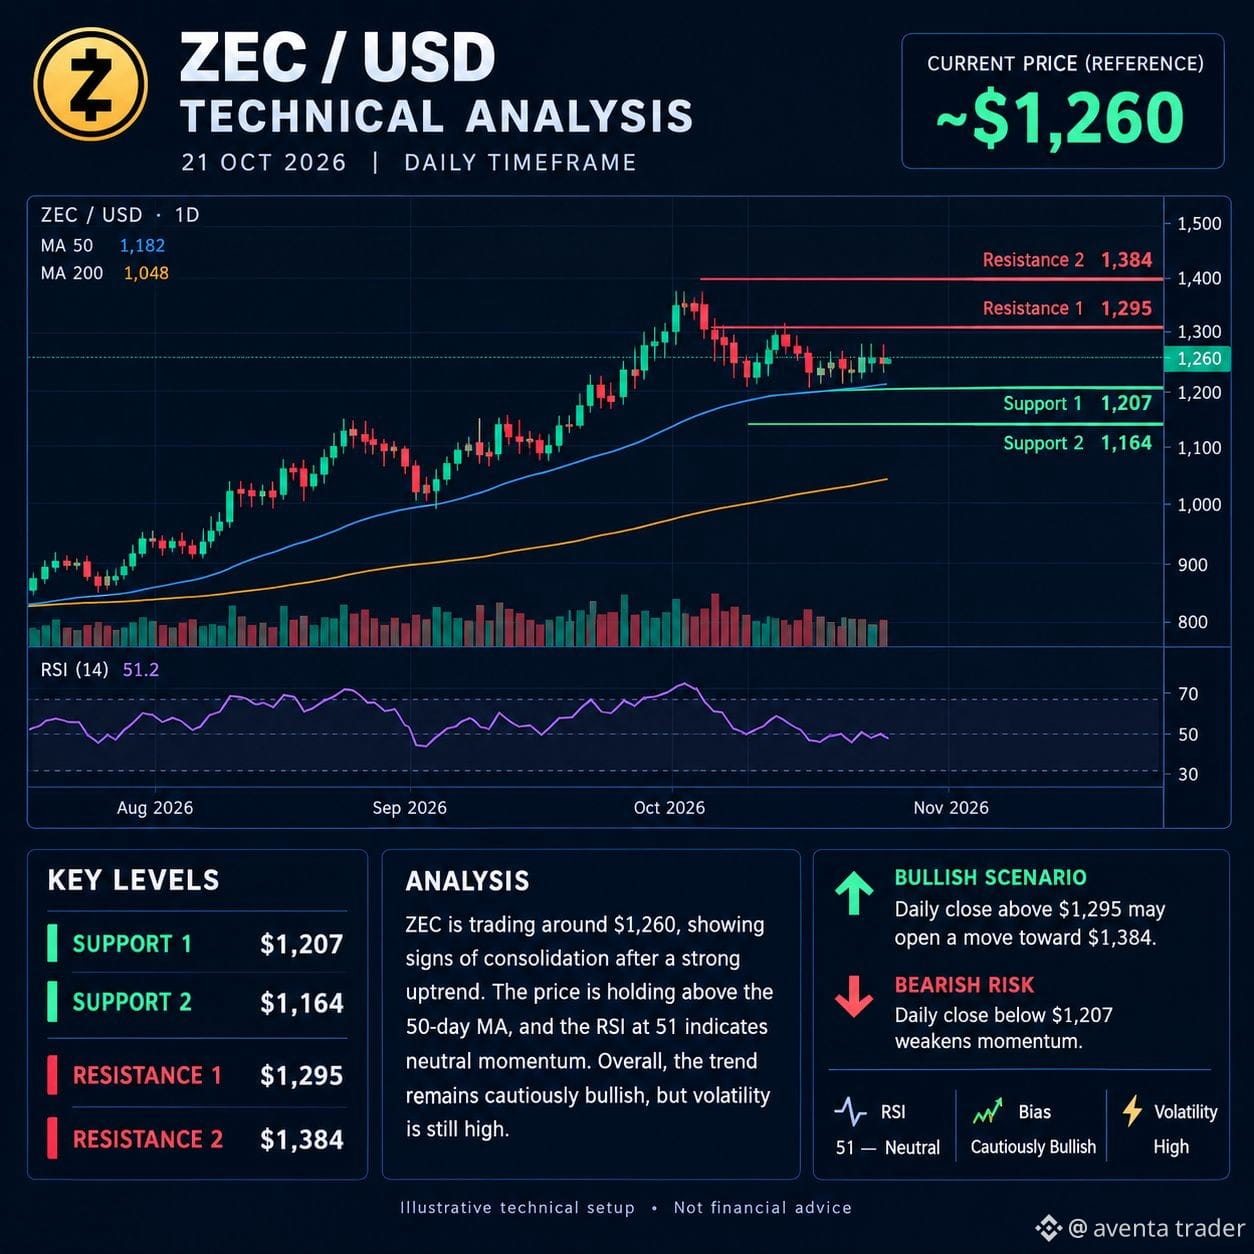
$ZEC 📊 ZEC (Zcash) — Professional Technical Analysis
🔹 Current Reference Price: ~$1,260
📈 Market Bias: Cautiously Bullish
⚡ Volatility: High
Technical Analysis: ZEC is showing signs of consolidation after a strong upward move. The RSI is around 51, indicating neutral momentum. A breakout above resistance could support further upside, while a breakdown below support may trigger additional selling pressure.
🟢 Support: $1,207 | $1,164
🔴 Resistance: $1,295 | $1,384
🚀 Bullish Scenario: A daily close above $1,295 could open the way toward $1,384.
⚠️ Bearish Risk: A daily close below $1,207 may weaken the bullish setup.
{spot}(ZECUSDT)
#EarningsSeason
$ZEC 📊 ZEC (Zcash) — Professional Technical Analysis
🔹 Current Reference Price: ~$1,260
📈 Market Bias: Cautiously Bullish
⚡ Volatility: High
Technical Analysis: ZEC is showing signs of consolidation after a strong upward move. The RSI is around 51, indicating neutral momentum. A breakout above resistance could support further upside, while a breakdown below support may trigger additional selling pressure.
🟢 Support: $1,207 | $1,164
🔴 Resistance: $1,295 | $1,384
🚀 Bullish Scenario: A daily close above $1,295 could open the way toward $1,384.
⚠️ Bearish Risk: A daily close below $1,207 may weaken the bullish setup.
#EarningsSeason
🔹 Current Reference Price: ~$1,260
📈 Market Bias: Cautiously Bullish
⚡ Volatility: High
Technical Analysis: ZEC is showing signs of consolidation after a strong upward move. The RSI is around 51, indicating neutral momentum. A breakout above resistance could support further upside, while a breakdown below support may trigger additional selling pressure.
🟢 Support: $1,207 | $1,164
🔴 Resistance: $1,295 | $1,384
🚀 Bullish Scenario: A daily close above $1,295 could open the way toward $1,384.
⚠️ Bearish Risk: A daily close below $1,207 may weaken the bullish setup.
#EarningsSeason
153
Übersetzung ansehen
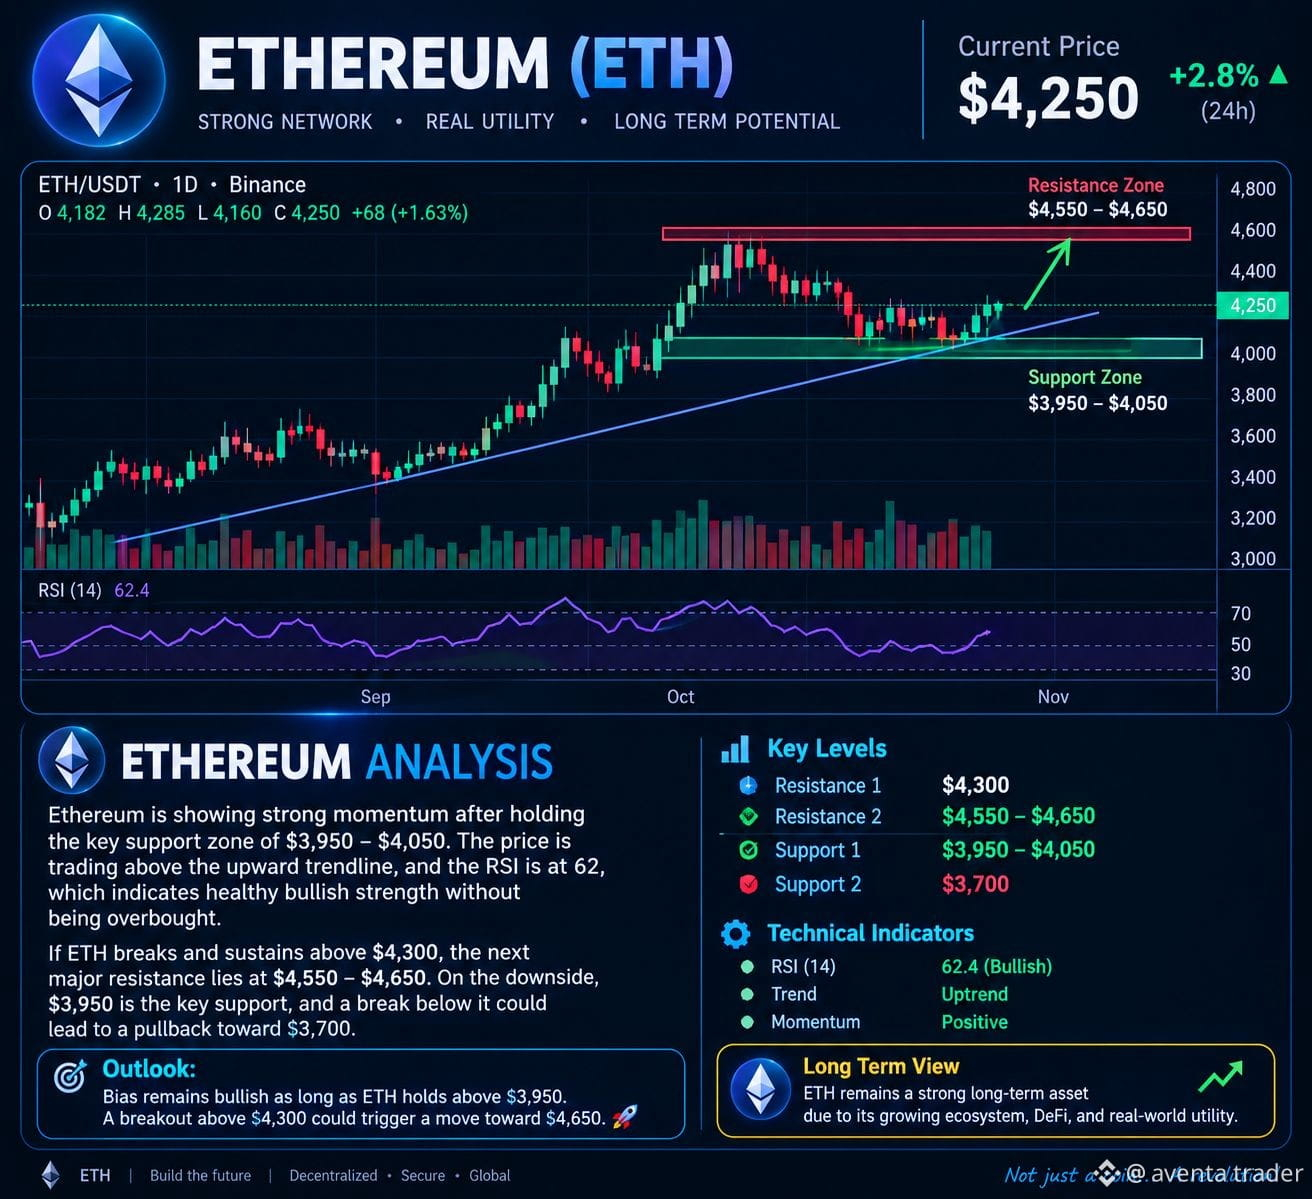
$ETH 📊 ETHEREUM (ETH) — RISK ANALYSIS
🔹 Market Trend: Bullish with potential volatility.
🟢 Support Zone: $3,950–$4,050
🔴 Resistance Zone: $4,300–$4,650
⚠️ Risk Factors:
A breakout above $4,300 may signal further upside momentum.
A rejection near resistance could trigger a short-term pullback.
A breakdown below $3,950 may increase selling pressure.
High market volatility can lead to sudden price swings.
🎯 Trading Outlook: ETH may remain bullish if it holds key support. Watch price action and trading volume before entering a position.
🛡️ Risk Management: Use stop-loss orders, manage position size, and avoid excessive leverage.
Note: Price levels are illustrative and should be verified against live market data. This analysis is not financial advice.
{spot}(ETHUSDT)
#JapanFSAPublishesOnChainFinanceForumMinutes #CFTCAdvancesVoluntaryRegCAMFramework
$ETH 📊 ETHEREUM (ETH) — RISK ANALYSIS
🔹 Market Trend: Bullish with potential volatility.
🟢 Support Zone: $3,950–$4,050
🔴 Resistance Zone: $4,300–$4,650
⚠️ Risk Factors:
A breakout above $4,300 may signal further upside momentum.
A rejection near resistance could trigger a short-term pullback.
A breakdown below $3,950 may increase selling pressure.
High market volatility can lead to sudden price swings.
🎯 Trading Outlook: ETH may remain bullish if it holds key support. Watch price action and trading volume before entering a position.
🛡️ Risk Management: Use stop-loss orders, manage position size, and avoid excessive leverage.
Note: Price levels are illustrative and should be verified against live market data. This analysis is not financial advice.
#JapanFSAPublishesOnChainFinanceForumMinutes #CFTCAdvancesVoluntaryRegCAMFramework
🔹 Market Trend: Bullish with potential volatility.
🟢 Support Zone: $3,950–$4,050
🔴 Resistance Zone: $4,300–$4,650
⚠️ Risk Factors:
A breakout above $4,300 may signal further upside momentum.
A rejection near resistance could trigger a short-term pullback.
A breakdown below $3,950 may increase selling pressure.
High market volatility can lead to sudden price swings.
🎯 Trading Outlook: ETH may remain bullish if it holds key support. Watch price action and trading volume before entering a position.
🛡️ Risk Management: Use stop-loss orders, manage position size, and avoid excessive leverage.
Note: Price levels are illustrative and should be verified against live market data. This analysis is not financial advice.
#JapanFSAPublishesOnChainFinanceForumMinutes #CFTCAdvancesVoluntaryRegCAMFramework
96
Übersetzung ansehen
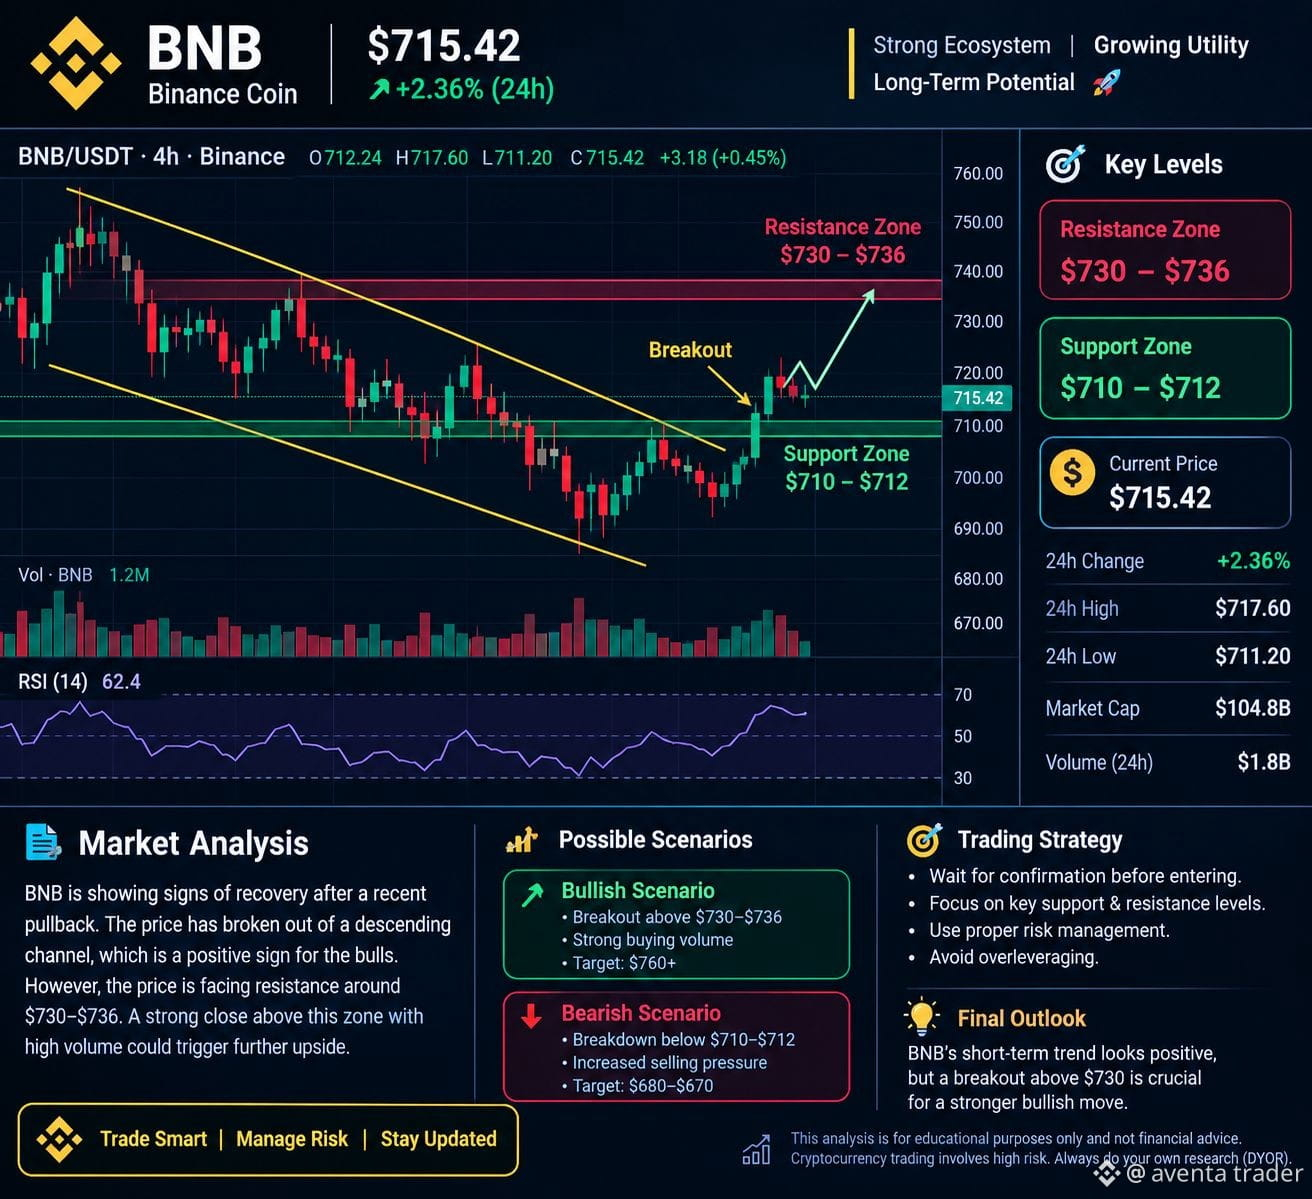
$BNB 📊 BNB Coin — Professional Market Analysis
🟡 BNB (Binance Coin) | Market Outlook
BNB remains a key cryptocurrency to watch. Its next move depends on market momentum, trading volume, and overall crypto sentiment.
📈 Bullish Scenario: A breakout above resistance with strong volume could signal further upside.
📉 Bearish Scenario: A breakdown below support may trigger additional selling pressure.
🎯 Trading Strategy: Wait for confirmation before entering a trade. Monitor support, resistance, and volume closely.
⚠️ Risk Management: Use a stop-loss and avoid overleveraging.
📍 Current Price: Around $715–$716
🟢 Support Zone: $710–$712
🔴 Resistance Zone: $730–$736
BNB has recently shown short-term selling pressure, so a recovery above resistance is needed to improve the bullish outlook. These levels are based on recent market data and can change quickly.
{spot}(BNBUSDT)
#CelestiaRises16%To2026High
$BNB 📊 BNB Coin — Professional Market Analysis
🟡 BNB (Binance Coin) | Market Outlook
BNB remains a key cryptocurrency to watch. Its next move depends on market momentum, trading volume, and overall crypto sentiment.
📈 Bullish Scenario: A breakout above resistance with strong volume could signal further upside.
📉 Bearish Scenario: A breakdown below support may trigger additional selling pressure.
🎯 Trading Strategy: Wait for confirmation before entering a trade. Monitor support, resistance, and volume closely.
⚠️ Risk Management: Use a stop-loss and avoid overleveraging.
📍 Current Price: Around $715–$716
🟢 Support Zone: $710–$712
🔴 Resistance Zone: $730–$736
BNB has recently shown short-term selling pressure, so a recovery above resistance is needed to improve the bullish outlook. These levels are based on recent market data and can change quickly.
#CelestiaRises16%To2026High
🟡 BNB (Binance Coin) | Market Outlook
BNB remains a key cryptocurrency to watch. Its next move depends on market momentum, trading volume, and overall crypto sentiment.
📈 Bullish Scenario: A breakout above resistance with strong volume could signal further upside.
📉 Bearish Scenario: A breakdown below support may trigger additional selling pressure.
🎯 Trading Strategy: Wait for confirmation before entering a trade. Monitor support, resistance, and volume closely.
⚠️ Risk Management: Use a stop-loss and avoid overleveraging.
📍 Current Price: Around $715–$716
🟢 Support Zone: $710–$712
🔴 Resistance Zone: $730–$736
BNB has recently shown short-term selling pressure, so a recovery above resistance is needed to improve the bullish outlook. These levels are based on recent market data and can change quickly.
#CelestiaRises16%To2026High
2
73
Übersetzung ansehen
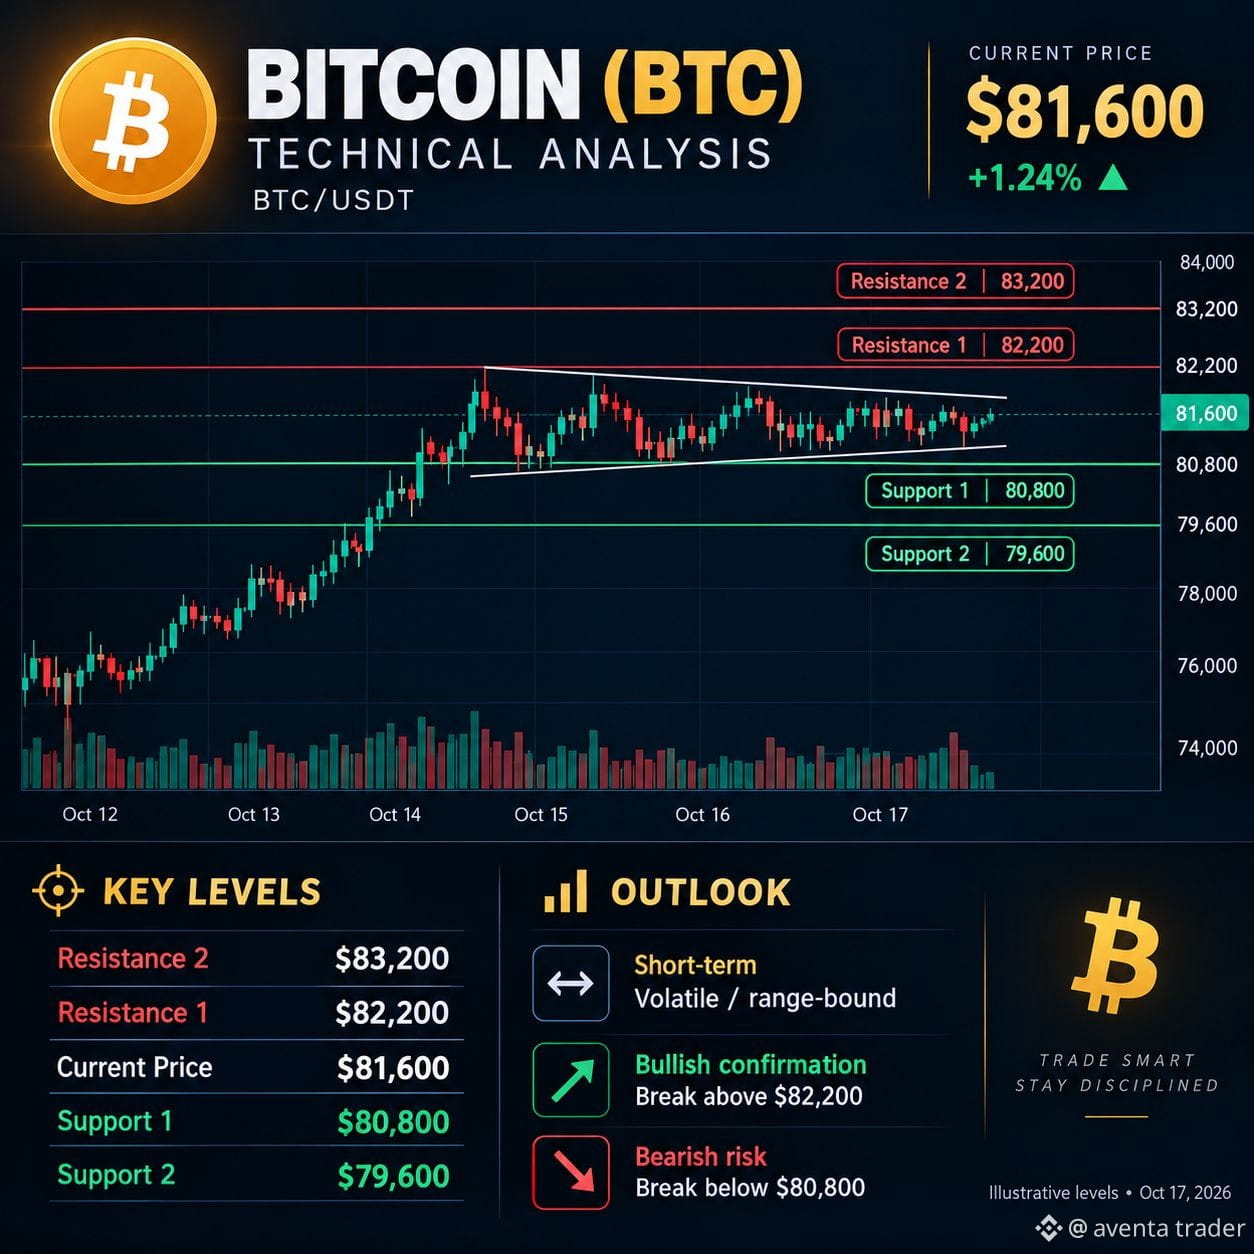
$BTC 📊 Bitcoin (BTC) Market Analysis 🚀
₿ Current Price: ~$81,600
🔹 Resistance: $82,200 – $83,200
🔹 Support: $80,800 – $79,600
📈 Bullish Scenario: A breakout above $82,200 could push BTC toward $83,200 and higher.
📉 Bearish Scenario: A breakdown below $80,800 could lead to further downside toward $79,600.
🎯 Market Outlook: Short-term momentum remains uncertain. Watch for a confirmed breakout before entering a trade.
{spot}(BTCUSDT)
#ETHDropsBelow2400USDT #CrossRiverBankAddsRLUSDToCoreBankingPlatform
$BTC 📊 Bitcoin (BTC) Market Analysis 🚀
₿ Current Price: ~$81,600
🔹 Resistance: $82,200 – $83,200
🔹 Support: $80,800 – $79,600
📈 Bullish Scenario: A breakout above $82,200 could push BTC toward $83,200 and higher.
📉 Bearish Scenario: A breakdown below $80,800 could lead to further downside toward $79,600.
🎯 Market Outlook: Short-term momentum remains uncertain. Watch for a confirmed breakout before entering a trade.
#ETHDropsBelow2400USDT #CrossRiverBankAddsRLUSDToCoreBankingPlatform
₿ Current Price: ~$81,600
🔹 Resistance: $82,200 – $83,200
🔹 Support: $80,800 – $79,600
📈 Bullish Scenario: A breakout above $82,200 could push BTC toward $83,200 and higher.
📉 Bearish Scenario: A breakdown below $80,800 could lead to further downside toward $79,600.
🎯 Market Outlook: Short-term momentum remains uncertain. Watch for a confirmed breakout before entering a trade.
#ETHDropsBelow2400USDT #CrossRiverBankAddsRLUSDToCoreBankingPlatform
1
146
Übersetzung ansehen
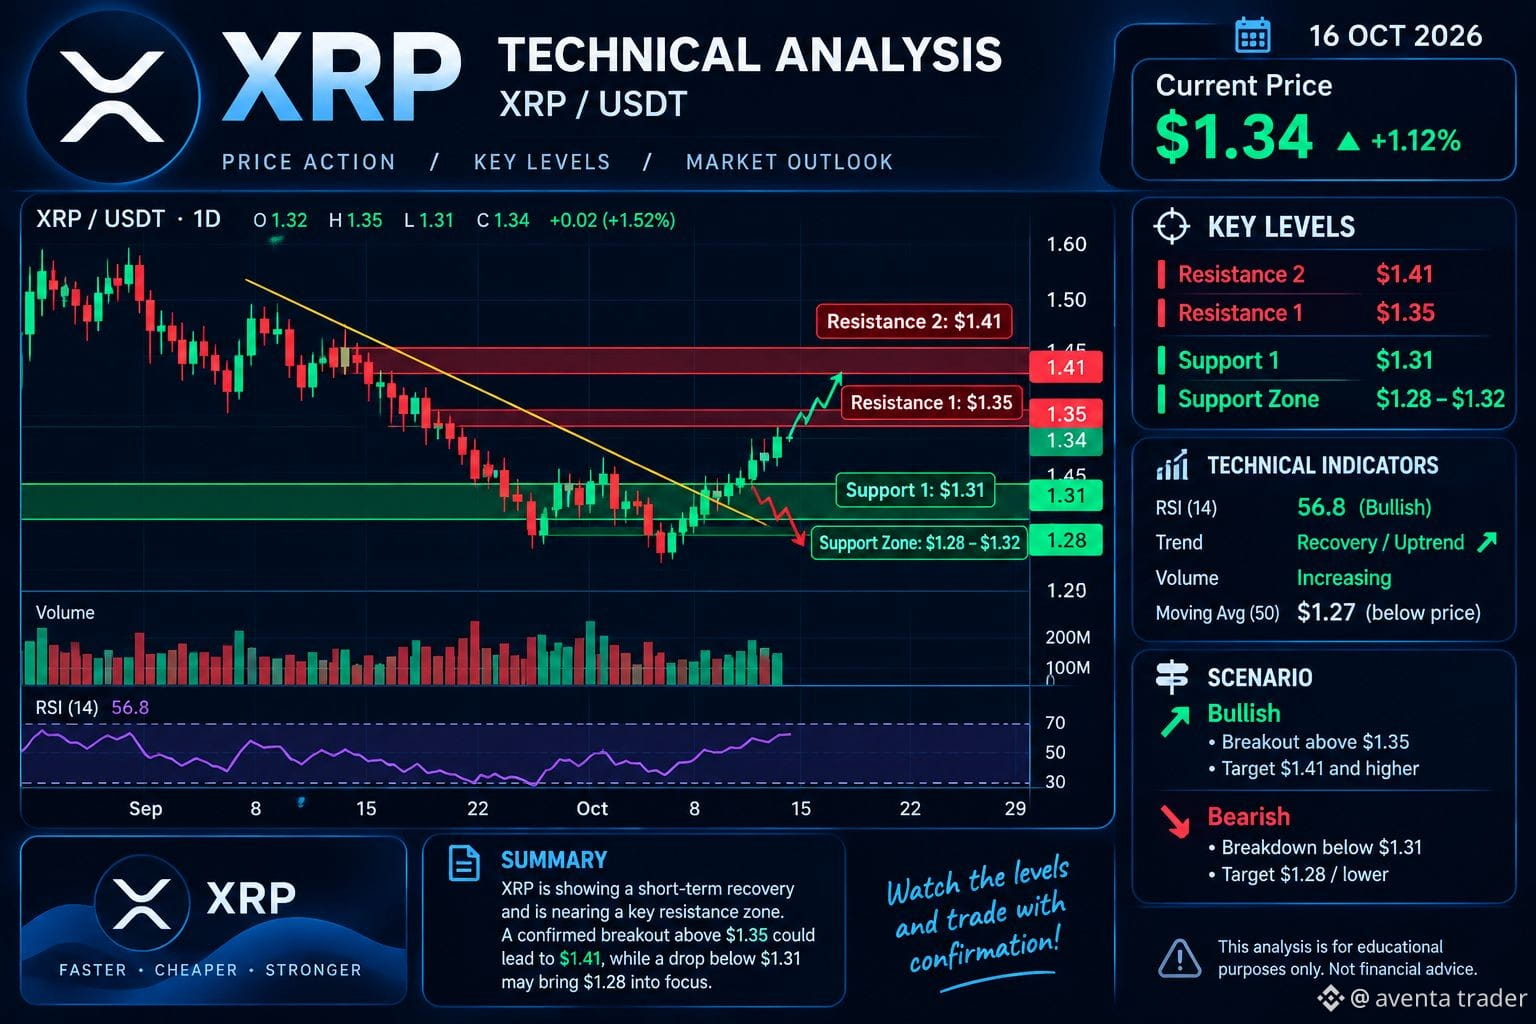
$XRP XRP is trading around $1.34, showing a short-term recovery after recent selling pressure. The market is approaching an important resistance zone, so confirmation is needed before expecting a stronger bullish move.
Technical Analysis
🟢 Support: $1.31 — strong support zone around $1.28–$1.32.
🔴 Resistance: $1.35, followed by $1.41.
📈 Bullish scenario: A confirmed breakout above $1.35 could open the way toward $1.41.
📉 Bearish scenario: A break below $1.31 could bring $1.28 or lower into focus.
XRP Chart
Overall view: Cautiously bullish for a short-term recovery, but the broader trend remains uncertain. Watch for a confirmed breakout above $1.35 or a breakdown below $1.31.
{spot}(XRPUSDT)
#MSCIFinalizesRulesThatCouldExcludeStrategy #NEARRisesNearly10%
$XRP XRP is trading around $1.34, showing a short-term recovery after recent selling pressure. The market is approaching an important resistance zone, so confirmation is needed before expecting a stronger bullish move.
Technical Analysis
🟢 Support: $1.31 — strong support zone around $1.28–$1.32.
🔴 Resistance: $1.35, followed by $1.41.
📈 Bullish scenario: A confirmed breakout above $1.35 could open the way toward $1.41.
📉 Bearish scenario: A break below $1.31 could bring $1.28 or lower into focus.
XRP Chart
Overall view: Cautiously bullish for a short-term recovery, but the broader trend remains uncertain. Watch for a confirmed breakout above $1.35 or a breakdown below $1.31.
#MSCIFinalizesRulesThatCouldExcludeStrategy #NEARRisesNearly10%
Technical Analysis
🟢 Support: $1.31 — strong support zone around $1.28–$1.32.
🔴 Resistance: $1.35, followed by $1.41.
📈 Bullish scenario: A confirmed breakout above $1.35 could open the way toward $1.41.
📉 Bearish scenario: A break below $1.31 could bring $1.28 or lower into focus.
XRP Chart
Overall view: Cautiously bullish for a short-term recovery, but the broader trend remains uncertain. Watch for a confirmed breakout above $1.35 or a breakdown below $1.31.
#MSCIFinalizesRulesThatCouldExcludeStrategy #NEARRisesNearly10%
1
85
Übersetzung ansehen
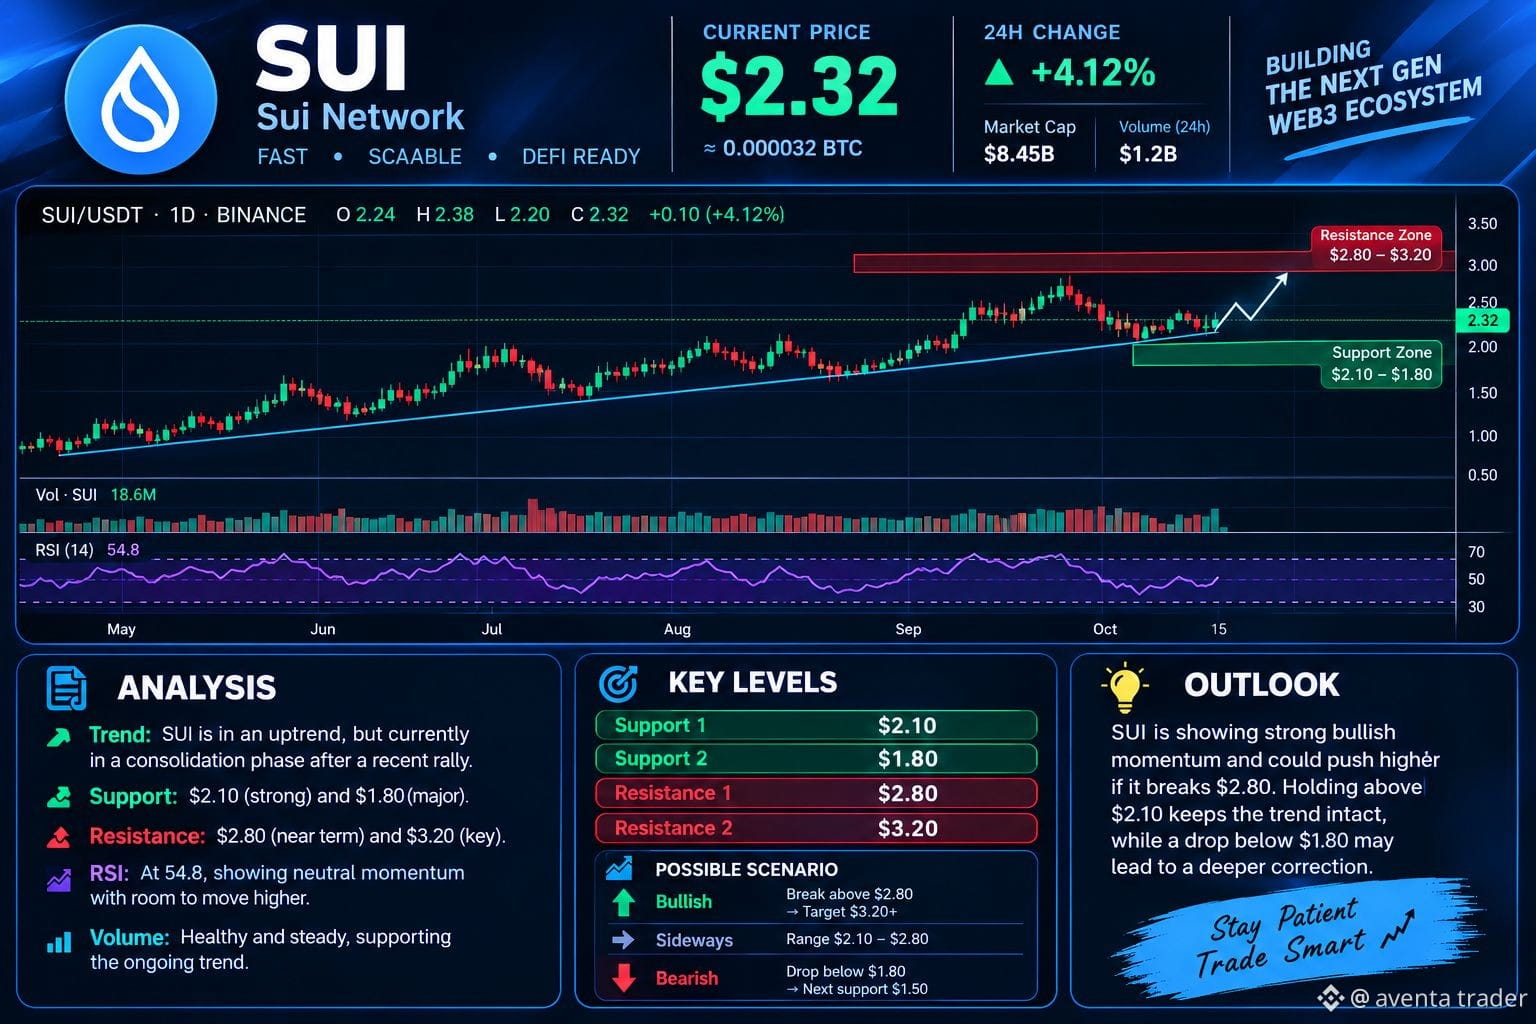
$SUI SUI Coin (Sui Network) – Market Analysis 📊
Trend: SUI is showing a potential bullish trend, with price consolidating after a recent rally.
Support Levels: $2.10 and $1.80
Resistance Levels: $2.80 and $3.20
Technical Outlook: If SUI breaks above $2.80 with strong volume, it could move toward $3.20. However, a drop below $2.10 may increase selling pressure and push the price toward lower support levels.
{spot}(SUIUSDT)
#CPIWatch #WarshPushesToScaleBackForwardGuidanceAndDotPlot #SouthKoreaPlansTighterCybersecurityRules
$SUI SUI Coin (Sui Network) – Market Analysis 📊
Trend: SUI is showing a potential bullish trend, with price consolidating after a recent rally.
Support Levels: $2.10 and $1.80
Resistance Levels: $2.80 and $3.20
Technical Outlook: If SUI breaks above $2.80 with strong volume, it could move toward $3.20. However, a drop below $2.10 may increase selling pressure and push the price toward lower support levels.
#CPIWatch #WarshPushesToScaleBackForwardGuidanceAndDotPlot #SouthKoreaPlansTighterCybersecurityRules
Trend: SUI is showing a potential bullish trend, with price consolidating after a recent rally.
Support Levels: $2.10 and $1.80
Resistance Levels: $2.80 and $3.20
Technical Outlook: If SUI breaks above $2.80 with strong volume, it could move toward $3.20. However, a drop below $2.10 may increase selling pressure and push the price toward lower support levels.
#CPIWatch #WarshPushesToScaleBackForwardGuidanceAndDotPlot #SouthKoreaPlansTighterCybersecurityRules
2
159
Übersetzung ansehen
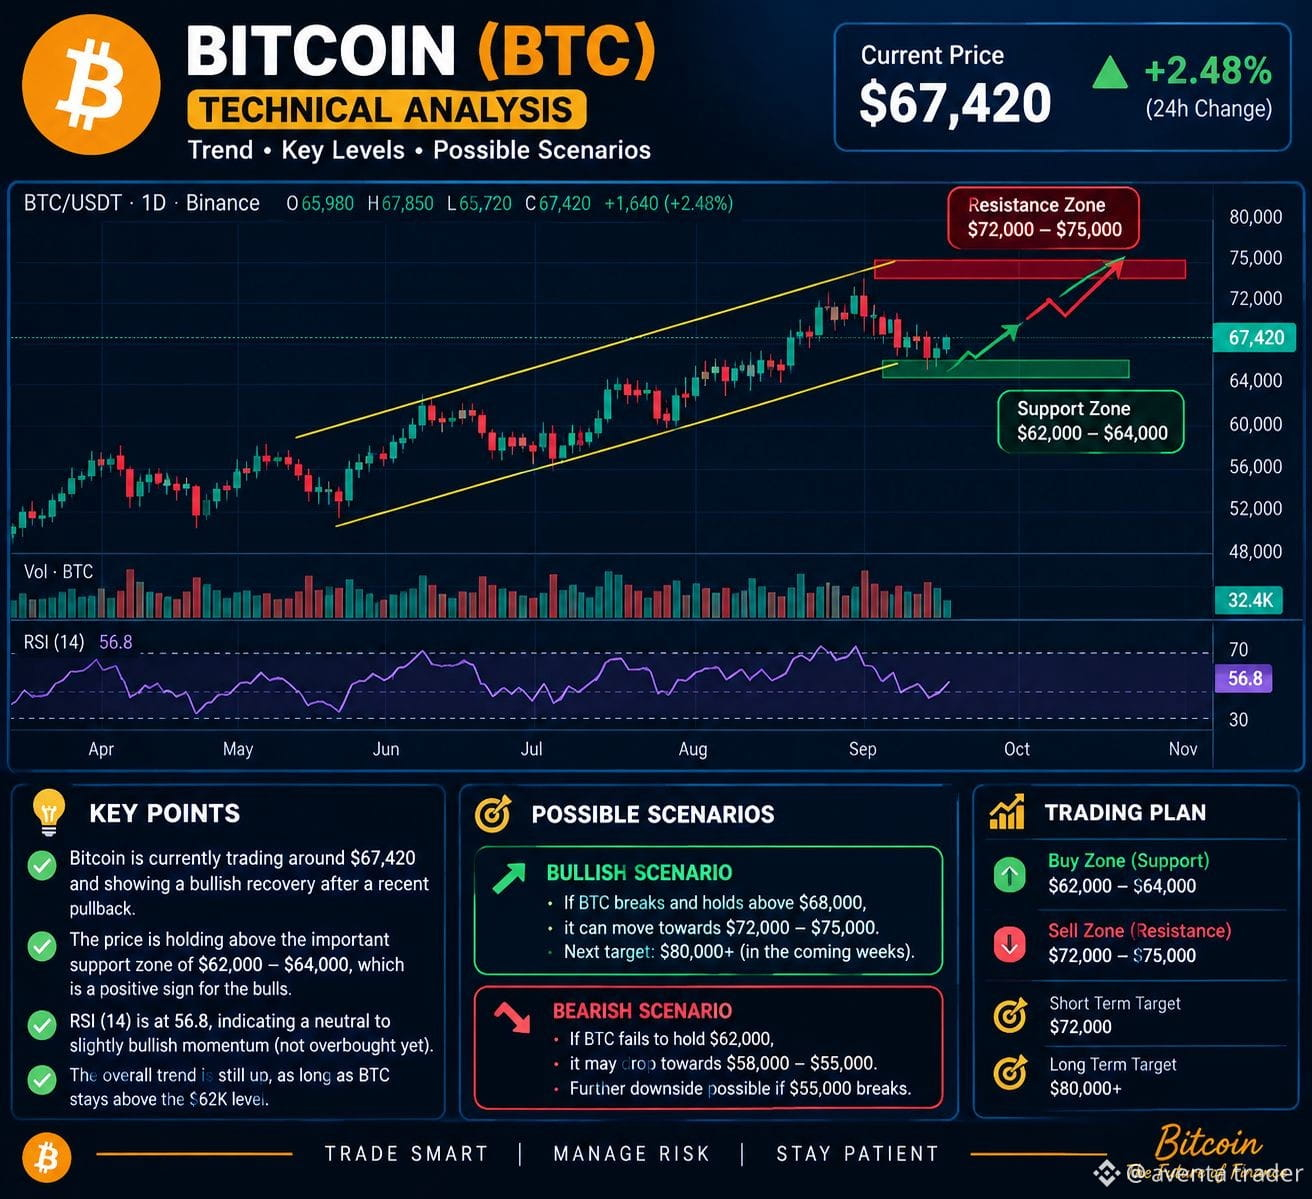
$BTC Bitcoin (BTC) Technical Analysis 📊
Market Overview: Bitcoin's market trend depends on price action, trading volume, and overall market sentiment. A confirmed breakout could signal further upside, while rejection at resistance may lead to a pullback.
Support Zone: $62,000–$64,000
Resistance Zone: $72,000–$75,000
Bullish Outlook: A strong breakout above resistance could open the way for further gains.
Bearish Outlook: A breakdown below support may increase selling pressure.
Conclusion: Bitcoin's next move depends on how the price reacts to key support and resistance levels. Traders should wait for confirmation and follow proper risk
{spot}(BTCUSDT)
#CPIWatch #EtherTook60%OfCryptoLiquidations
$BTC Bitcoin (BTC) Technical Analysis 📊
Market Overview: Bitcoin's market trend depends on price action, trading volume, and overall market sentiment. A confirmed breakout could signal further upside, while rejection at resistance may lead to a pullback.
Support Zone: $62,000–$64,000
Resistance Zone: $72,000–$75,000
Bullish Outlook: A strong breakout above resistance could open the way for further gains.
Bearish Outlook: A breakdown below support may increase selling pressure.
Conclusion: Bitcoin's next move depends on how the price reacts to key support and resistance levels. Traders should wait for confirmation and follow proper risk
#CPIWatch #EtherTook60%OfCryptoLiquidations
Market Overview: Bitcoin's market trend depends on price action, trading volume, and overall market sentiment. A confirmed breakout could signal further upside, while rejection at resistance may lead to a pullback.
Support Zone: $62,000–$64,000
Resistance Zone: $72,000–$75,000
Bullish Outlook: A strong breakout above resistance could open the way for further gains.
Bearish Outlook: A breakdown below support may increase selling pressure.
Conclusion: Bitcoin's next move depends on how the price reacts to key support and resistance levels. Traders should wait for confirmation and follow proper risk
#CPIWatch #EtherTook60%OfCryptoLiquidations
1
61
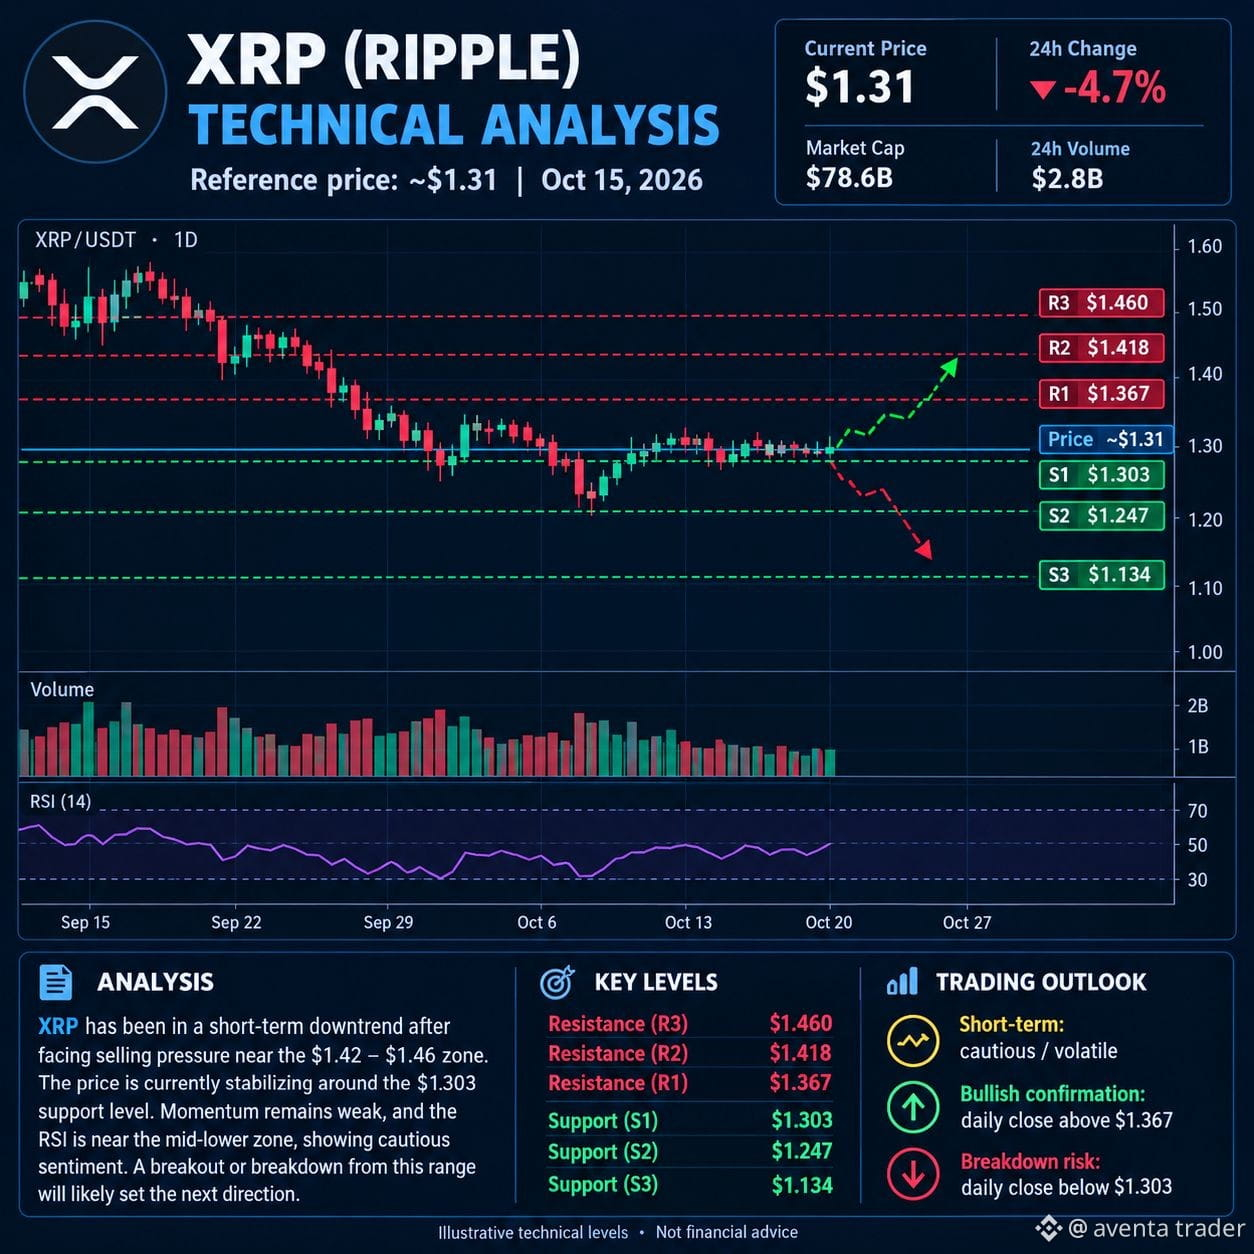
$XRP XRP (RIPPLE) TECHNISCHE ANALYSE 📊
Datum: 15. Oktober,
📉 Markttrend und Momentum
Im Tages-Zeitrahmen,
🟢 Wichtige Unterstützungsniveaus
$1.303: Unmittelbare Unterstützung und ein kritisches Niveau für Käufer.
$1.247: Sekundäre Unterstützung, falls der Verkaufsdruck zunimmt.
$1.134: Wichtige Unterstützung nach unten bei einer stärkeren Korrektur.
Hält XRP die Unterstützung bei etwa $1.303 und nimmt der Kaufdruck zu, könnte sich der Kurs stabilisieren und eine Erholung versuchen. Ein bestätigter Tagesschlusskurs unter diesem Niveau könnte den Weg zu den tiefer liegenden Unterstützungszonen freimachen.
🔴 Wichtige Widerstandsniveaus
$1.367: Erster wichtiger Widerstand und ein bedeutendes Niveau zur Bestätigung eines Aufwärtstrends.
$1.418: Sekundärer Widerstand, an dem der Verkaufsdruck wieder zunehmen könnte.
$1.460: Stärkerer Widerstand und mögliches Erholungsziel.
Ein anhaltender Tagesschlusskurs über $1.367, gestützt durch ein höheres Handelsvolumen, würde den kurzfristigen Ausblick verbessern. Ein anschließender Anstieg über $1.418 könnte das bullische Momentum verstärken und $1.460 in den Fokus rücken.
🚀 Bullisches Szenario
Verteidigen die Käufer erfolgreich die Unterstützungszone bei $1.303, könnte XRP eine Erholung in Richtung $1.367 versuchen. Ein Ausbruch über diesen Widerstand könnte den Weg zu $1.418 und möglicherweise $1.460 ebnen. Dennoch sind Bestätigungen durch Kursbewegung und Handelsvolumen wichtig, bevor man von einer vollständigen Trendwende ausgeht.
⚠️ Bärisches Szenario
Sollte XRP die Marke von $1.303 nicht halten und der Verkaufsdruck anhalten, sind die nächsten zu beobachtenden Niveaus $1.247 und $1.134. Ein Einbruch bei hohem Verkaufsvolumen würde darauf hindeuten, dass das bärische Momentum weiterhin dominiert und zu weiterer Abwärtsvolatilität führen könnte.
🎯 Abschließender Marktausblick
Derzeit befindet sich XRP an einem technisch wichtigen Punkt. Die Unterstützungszone bei $1.303 ist für Käufer entscheidend, während $1.367 der erste bedeutende Widerstand ist, der zurückerobert werden muss, um die kurzfristige Struktur zu verbessern. Bis eines dieser Niveaus eindeutig durchbrochen wird, könnte XRP weiterhin mit erheblicher Volatilität gehandelt werden.
{future}(XRPUSDT)
$XRP XRP (RIPPLE) TECHNISCHE ANALYSE 📊
Datum: 15. Oktober,
📉 Markttrend und Momentum
Im Tages-Zeitrahmen,
🟢 Wichtige Unterstützungsniveaus
$1.303: Unmittelbare Unterstützung und ein kritisches Niveau für Käufer.
$1.247: Sekundäre Unterstützung, falls der Verkaufsdruck zunimmt.
$1.134: Wichtige Unterstützung nach unten bei einer stärkeren Korrektur.
Hält XRP die Unterstützung bei etwa $1.303 und nimmt der Kaufdruck zu, könnte sich der Kurs stabilisieren und eine Erholung versuchen. Ein bestätigter Tagesschlusskurs unter diesem Niveau könnte den Weg zu den tiefer liegenden Unterstützungszonen freimachen.
🔴 Wichtige Widerstandsniveaus
$1.367: Erster wichtiger Widerstand und ein bedeutendes Niveau zur Bestätigung eines Aufwärtstrends.
$1.418: Sekundärer Widerstand, an dem der Verkaufsdruck wieder zunehmen könnte.
$1.460: Stärkerer Widerstand und mögliches Erholungsziel.
Ein anhaltender Tagesschlusskurs über $1.367, gestützt durch ein höheres Handelsvolumen, würde den kurzfristigen Ausblick verbessern. Ein anschließender Anstieg über $1.418 könnte das bullische Momentum verstärken und $1.460 in den Fokus rücken.
🚀 Bullisches Szenario
Verteidigen die Käufer erfolgreich die Unterstützungszone bei $1.303, könnte XRP eine Erholung in Richtung $1.367 versuchen. Ein Ausbruch über diesen Widerstand könnte den Weg zu $1.418 und möglicherweise $1.460 ebnen. Dennoch sind Bestätigungen durch Kursbewegung und Handelsvolumen wichtig, bevor man von einer vollständigen Trendwende ausgeht.
⚠️ Bärisches Szenario
Sollte XRP die Marke von $1.303 nicht halten und der Verkaufsdruck anhalten, sind die nächsten zu beobachtenden Niveaus $1.247 und $1.134. Ein Einbruch bei hohem Verkaufsvolumen würde darauf hindeuten, dass das bärische Momentum weiterhin dominiert und zu weiterer Abwärtsvolatilität führen könnte.
🎯 Abschließender Marktausblick
Derzeit befindet sich XRP an einem technisch wichtigen Punkt. Die Unterstützungszone bei $1.303 ist für Käufer entscheidend, während $1.367 der erste bedeutende Widerstand ist, der zurückerobert werden muss, um die kurzfristige Struktur zu verbessern. Bis eines dieser Niveaus eindeutig durchbrochen wird, könnte XRP weiterhin mit erheblicher Volatilität gehandelt werden.
Datum: 15. Oktober,
📉 Markttrend und Momentum
Im Tages-Zeitrahmen,
🟢 Wichtige Unterstützungsniveaus
$1.303: Unmittelbare Unterstützung und ein kritisches Niveau für Käufer.
$1.247: Sekundäre Unterstützung, falls der Verkaufsdruck zunimmt.
$1.134: Wichtige Unterstützung nach unten bei einer stärkeren Korrektur.
Hält XRP die Unterstützung bei etwa $1.303 und nimmt der Kaufdruck zu, könnte sich der Kurs stabilisieren und eine Erholung versuchen. Ein bestätigter Tagesschlusskurs unter diesem Niveau könnte den Weg zu den tiefer liegenden Unterstützungszonen freimachen.
🔴 Wichtige Widerstandsniveaus
$1.367: Erster wichtiger Widerstand und ein bedeutendes Niveau zur Bestätigung eines Aufwärtstrends.
$1.418: Sekundärer Widerstand, an dem der Verkaufsdruck wieder zunehmen könnte.
$1.460: Stärkerer Widerstand und mögliches Erholungsziel.
Ein anhaltender Tagesschlusskurs über $1.367, gestützt durch ein höheres Handelsvolumen, würde den kurzfristigen Ausblick verbessern. Ein anschließender Anstieg über $1.418 könnte das bullische Momentum verstärken und $1.460 in den Fokus rücken.
🚀 Bullisches Szenario
Verteidigen die Käufer erfolgreich die Unterstützungszone bei $1.303, könnte XRP eine Erholung in Richtung $1.367 versuchen. Ein Ausbruch über diesen Widerstand könnte den Weg zu $1.418 und möglicherweise $1.460 ebnen. Dennoch sind Bestätigungen durch Kursbewegung und Handelsvolumen wichtig, bevor man von einer vollständigen Trendwende ausgeht.
⚠️ Bärisches Szenario
Sollte XRP die Marke von $1.303 nicht halten und der Verkaufsdruck anhalten, sind die nächsten zu beobachtenden Niveaus $1.247 und $1.134. Ein Einbruch bei hohem Verkaufsvolumen würde darauf hindeuten, dass das bärische Momentum weiterhin dominiert und zu weiterer Abwärtsvolatilität führen könnte.
🎯 Abschließender Marktausblick
Derzeit befindet sich XRP an einem technisch wichtigen Punkt. Die Unterstützungszone bei $1.303 ist für Käufer entscheidend, während $1.367 der erste bedeutende Widerstand ist, der zurückerobert werden muss, um die kurzfristige Struktur zu verbessern. Bis eines dieser Niveaus eindeutig durchbrochen wird, könnte XRP weiterhin mit erheblicher Volatilität gehandelt werden.
1
2
1.5k
Übersetzung ansehen
$BTC 🔍 BTC Market Analysis
1. Current Market Trend
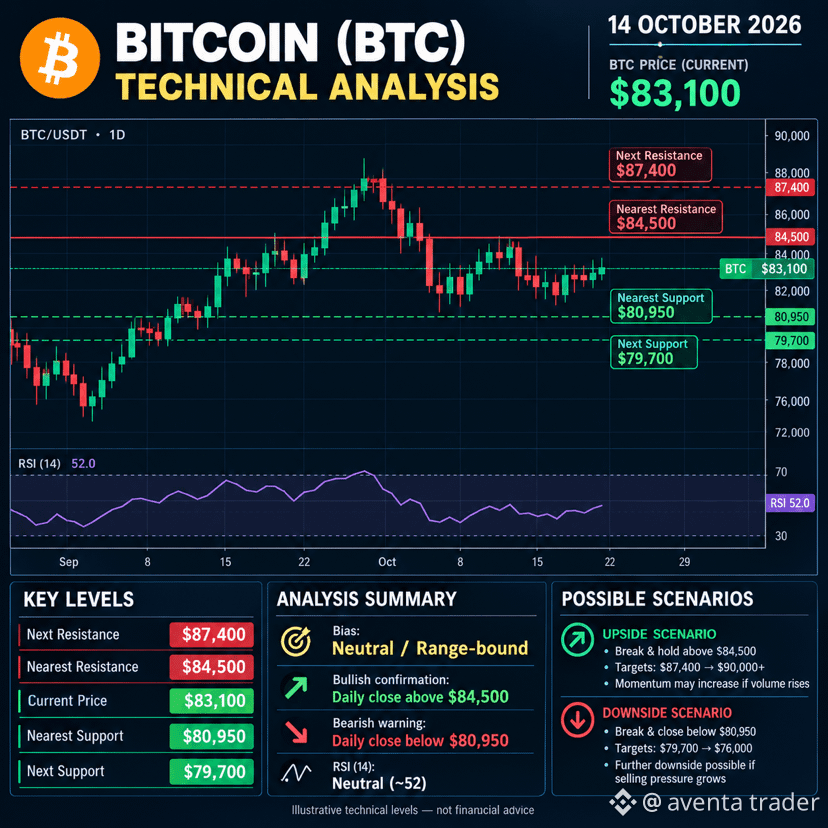
* Trend: Neutral / Range-bound
* Market sentiment: Cautious
* RSI: Around 52, indicating neutral momentum.
* Key observation: BTC needs a confirmed breakout to establish a clearer short-term direction.
2. Important Support Levels 🟢
* $80,950 — Immediate support.
* $79,700 — Secondary support.
* $76,000 — Potential downside target if selling pressure increases.
3. Important Resistance Levels 🔴
* $84,500 — Immediate resistance.
* $87,400 — Major resistance.
* $90,000 — Potential upside target if bullish momentum strengthens.
📈 Possible Market Scenarios
🟢 Bullish Scenario
If BTC breaks above $84,500 and holds that level with strong trading volume, the price could move toward $87,400, followed by a possible test of $90,000.
🔴 Bearish Scenario
If BTC breaks below $80,950 and closes below this level on the daily chart, the price could decline toward $79,700 or potentially $76,000.
{spot}(BTCUSDT)
$BTC 🔍 BTC Market Analysis
1. Current Market Trend
* Trend: Neutral / Range-bound
* Market sentiment: Cautious
* RSI: Around 52, indicating neutral momentum.
* Key observation: BTC needs a confirmed breakout to establish a clearer short-term direction.
2. Important Support Levels 🟢
* $80,950 — Immediate support.
* $79,700 — Secondary support.
* $76,000 — Potential downside target if selling pressure increases.
3. Important Resistance Levels 🔴
* $84,500 — Immediate resistance.
* $87,400 — Major resistance.
* $90,000 — Potential upside target if bullish momentum strengthens.
📈 Possible Market Scenarios
🟢 Bullish Scenario
If BTC breaks above $84,500 and holds that level with strong trading volume, the price could move toward $87,400, followed by a possible test of $90,000.
🔴 Bearish Scenario
If BTC breaks below $80,950 and closes below this level on the daily chart, the price could decline toward $79,700 or potentially $76,000.
1. Current Market Trend
* Trend: Neutral / Range-bound
* Market sentiment: Cautious
* RSI: Around 52, indicating neutral momentum.
* Key observation: BTC needs a confirmed breakout to establish a clearer short-term direction.
2. Important Support Levels 🟢
* $80,950 — Immediate support.
* $79,700 — Secondary support.
* $76,000 — Potential downside target if selling pressure increases.
3. Important Resistance Levels 🔴
* $84,500 — Immediate resistance.
* $87,400 — Major resistance.
* $90,000 — Potential upside target if bullish momentum strengthens.
📈 Possible Market Scenarios
🟢 Bullish Scenario
If BTC breaks above $84,500 and holds that level with strong trading volume, the price could move toward $87,400, followed by a possible test of $90,000.
🔴 Bearish Scenario
If BTC breaks below $80,950 and closes below this level on the daily chart, the price could decline toward $79,700 or potentially $76,000.
1
77
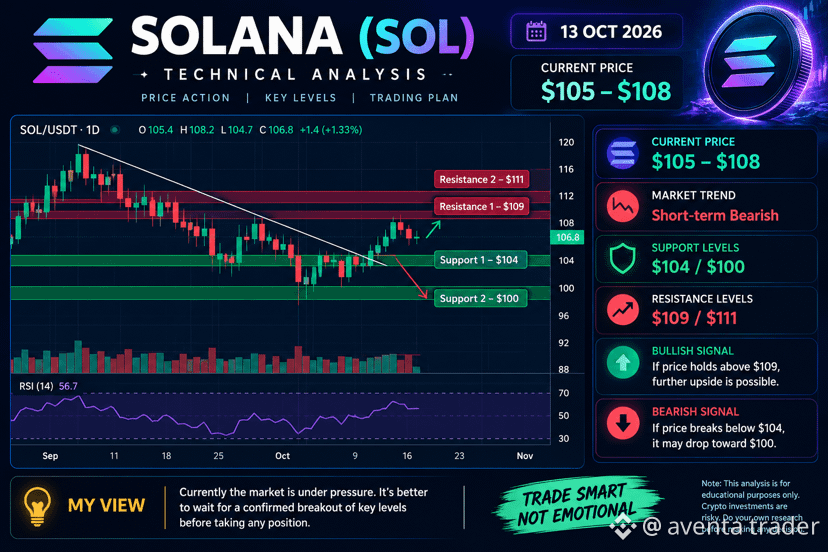
$SOL 📊 SOLANA (SOL) — TECHNISCHE ANALYSE
📅 13. Oktober 2026
🔹 Aktueller Preis: $105–$108
🔹 Markttrend: Kurzfristig bärisch
🟢 Unterstützungsniveaus: $104 und $100
🔴 Widerstandsniveaus: $109 und $111
📈 Marktüberblick:
Solana wird derzeit in einer kritischen Preiszone gehandelt, und der Markt zeigt Anzeichen kurzfristigen Abwärtsdrucks. Käufer versuchen, den Preis nach oben zu treiben, doch ein starker Widerstand im Bereich von $109–$111 könnte weitere Kursgewinne begrenzen. Händler sollten die Kursentwicklung an diesen wichtigen Niveaus genau beobachten, bevor sie Handelsentscheidungen treffen.
🟢 Bullishes Szenario:
Wenn SOL die Marke von $109 durchbricht und eine starke Kaufdynamik beibehält, könnte der Preis in Richtung $111 steigen. Ein bestätigter Ausbruch über $111 könnte den Weg für weitere Kursanstiege ebnen.
🔴 Bärisches Szenario:
Wenn SOL den Widerstandsbereich nicht durchbricht und unter $104 fällt, könnte der Verkaufsdruck zunehmen. In diesem Fall ist das nächste wichtige Unterstützungsniveau, das es zu beobachten gilt, $100.
{spot}(SOLUSDT)
#sol #AaveV4DepositsOnArcTop$300M
$SOL 📊 SOLANA (SOL) — TECHNISCHE ANALYSE
📅 13. Oktober 2026
🔹 Aktueller Preis: $105–$108
🔹 Markttrend: Kurzfristig bärisch
🟢 Unterstützungsniveaus: $104 und $100
🔴 Widerstandsniveaus: $109 und $111
📈 Marktüberblick:
Solana wird derzeit in einer kritischen Preiszone gehandelt, und der Markt zeigt Anzeichen kurzfristigen Abwärtsdrucks. Käufer versuchen, den Preis nach oben zu treiben, doch ein starker Widerstand im Bereich von $109–$111 könnte weitere Kursgewinne begrenzen. Händler sollten die Kursentwicklung an diesen wichtigen Niveaus genau beobachten, bevor sie Handelsentscheidungen treffen.
🟢 Bullishes Szenario:
Wenn SOL die Marke von $109 durchbricht und eine starke Kaufdynamik beibehält, könnte der Preis in Richtung $111 steigen. Ein bestätigter Ausbruch über $111 könnte den Weg für weitere Kursanstiege ebnen.
🔴 Bärisches Szenario:
Wenn SOL den Widerstandsbereich nicht durchbricht und unter $104 fällt, könnte der Verkaufsdruck zunehmen. In diesem Fall ist das nächste wichtige Unterstützungsniveau, das es zu beobachten gilt, $100.
#sol #AaveV4DepositsOnArcTop$300M
📅 13. Oktober 2026
🔹 Aktueller Preis: $105–$108
🔹 Markttrend: Kurzfristig bärisch
🟢 Unterstützungsniveaus: $104 und $100
🔴 Widerstandsniveaus: $109 und $111
📈 Marktüberblick:
Solana wird derzeit in einer kritischen Preiszone gehandelt, und der Markt zeigt Anzeichen kurzfristigen Abwärtsdrucks. Käufer versuchen, den Preis nach oben zu treiben, doch ein starker Widerstand im Bereich von $109–$111 könnte weitere Kursgewinne begrenzen. Händler sollten die Kursentwicklung an diesen wichtigen Niveaus genau beobachten, bevor sie Handelsentscheidungen treffen.
🟢 Bullishes Szenario:
Wenn SOL die Marke von $109 durchbricht und eine starke Kaufdynamik beibehält, könnte der Preis in Richtung $111 steigen. Ein bestätigter Ausbruch über $111 könnte den Weg für weitere Kursanstiege ebnen.
🔴 Bärisches Szenario:
Wenn SOL den Widerstandsbereich nicht durchbricht und unter $104 fällt, könnte der Verkaufsdruck zunehmen. In diesem Fall ist das nächste wichtige Unterstützungsniveau, das es zu beobachten gilt, $100.
#sol #AaveV4DepositsOnArcTop$300M
1
125
Übersetzung ansehen
$ETH 📊 Ethereum (ETH) Price Analysis 🚀
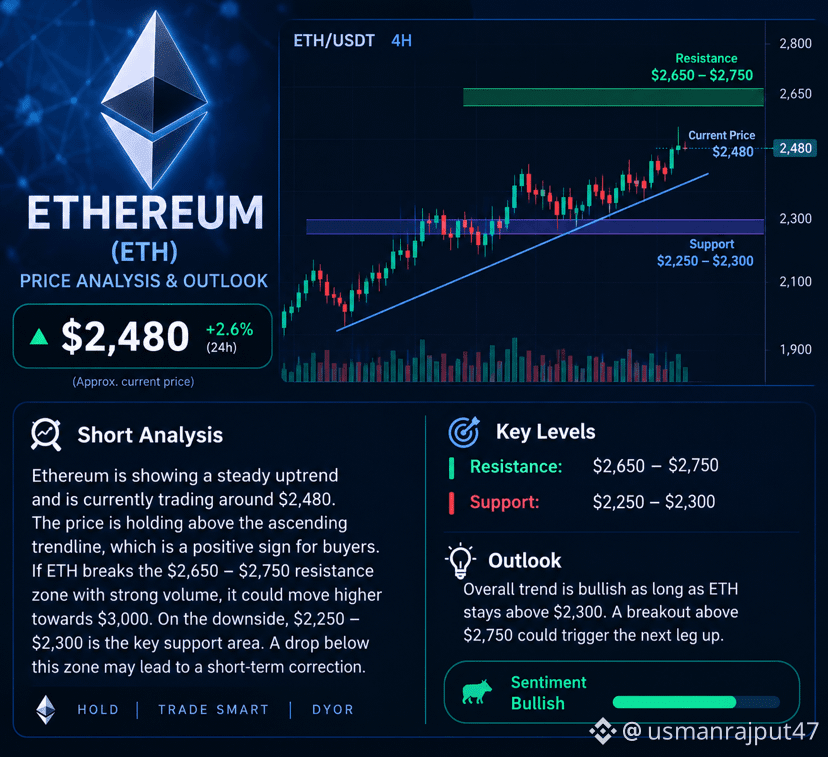
🔹 Current Price: $2,480 (+2.6% in 24H)
📈 Market Overview:
Ethereum is showing a steady bullish trend and is currently trading around $2,480. The price is holding above an ascending trendline, indicating positive momentum for buyers.
🎯 Key Resistance: $2,650 – $2,750
🛡️ Key Support: $2,250 – $2,300
🚀 Bullish Scenario:
If ETH breaks above the $2,750 resistance with strong trading volume, the price could move toward the $3,000 level.
⚠️ Bearish Scenario:
If ETH drops below the $2,250–$2,300 support zone, a short-term correction may follow.
💡 Market Outlook:
The overall outlook remains bullish as long as ETH holds above the key support zone. Traders should watch resistance levels and volume confirmation before entering a trade.
✅ Strategy: Trade Smart | Manage Risk | DYOR
#Ethereum #ETH #CryptoAnalysis #Trading
{spot}(ETHUSDT)
$ETH 📊 Ethereum (ETH) Price Analysis 🚀
🔹 Current Price: $2,480 (+2.6% in 24H)
📈 Market Overview:
Ethereum is showing a steady bullish trend and is currently trading around $2,480. The price is holding above an ascending trendline, indicating positive momentum for buyers.
🎯 Key Resistance: $2,650 – $2,750
🛡️ Key Support: $2,250 – $2,300
🚀 Bullish Scenario:
If ETH breaks above the $2,750 resistance with strong trading volume, the price could move toward the $3,000 level.
⚠️ Bearish Scenario:
If ETH drops below the $2,250–$2,300 support zone, a short-term correction may follow.
💡 Market Outlook:
The overall outlook remains bullish as long as ETH holds above the key support zone. Traders should watch resistance levels and volume confirmation before entering a trade.
✅ Strategy: Trade Smart | Manage Risk | DYOR
#Ethereum #ETH #CryptoAnalysis #Trading
🔹 Current Price: $2,480 (+2.6% in 24H)
📈 Market Overview:
Ethereum is showing a steady bullish trend and is currently trading around $2,480. The price is holding above an ascending trendline, indicating positive momentum for buyers.
🎯 Key Resistance: $2,650 – $2,750
🛡️ Key Support: $2,250 – $2,300
🚀 Bullish Scenario:
If ETH breaks above the $2,750 resistance with strong trading volume, the price could move toward the $3,000 level.
⚠️ Bearish Scenario:
If ETH drops below the $2,250–$2,300 support zone, a short-term correction may follow.
💡 Market Outlook:
The overall outlook remains bullish as long as ETH holds above the key support zone. Traders should watch resistance levels and volume confirmation before entering a trade.
✅ Strategy: Trade Smart | Manage Risk | DYOR
#Ethereum #ETH #CryptoAnalysis #Trading
1
68
Übersetzung ansehen
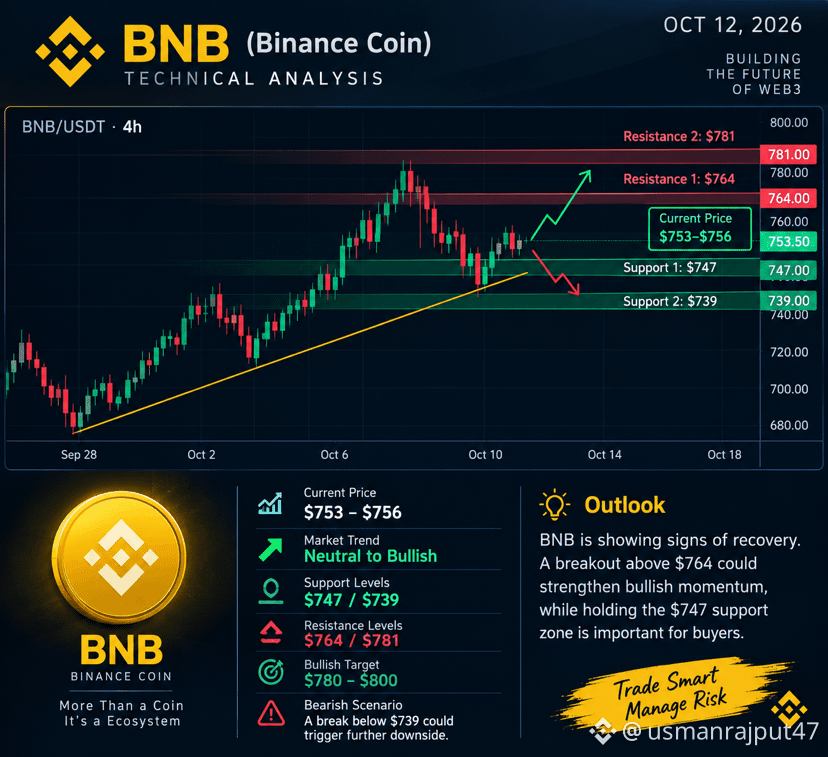
$BNB (Binance Coin) — Market Analysis
* Current Price: Around $753–$756
* Market Trend: Neutral to Bullish 📈
* Support: $747 / $739
* Resistance: $764 / $781
* Bullish Target: $780–$800
* Bearish Scenario: A break below $739 could trigger further downside.
📈 Outlook: BNB is showing signs of recovery. A breakout above $764 could strengthen bullish momentum, while holding the $747 support zone is important for buyers.
{spot}(BNBUSDT)
$BNB (Binance Coin) — Market Analysis
* Current Price: Around $753–$756
* Market Trend: Neutral to Bullish 📈
* Support: $747 / $739
* Resistance: $764 / $781
* Bullish Target: $780–$800
* Bearish Scenario: A break below $739 could trigger further downside.
📈 Outlook: BNB is showing signs of recovery. A breakout above $764 could strengthen bullish momentum, while holding the $747 support zone is important for buyers.
* Current Price: Around $753–$756
* Market Trend: Neutral to Bullish 📈
* Support: $747 / $739
* Resistance: $764 / $781
* Bullish Target: $780–$800
* Bearish Scenario: A break below $739 could trigger further downside.
📈 Outlook: BNB is showing signs of recovery. A breakout above $764 could strengthen bullish momentum, while holding the $747 support zone is important for buyers.
1
58
Übersetzung ansehen
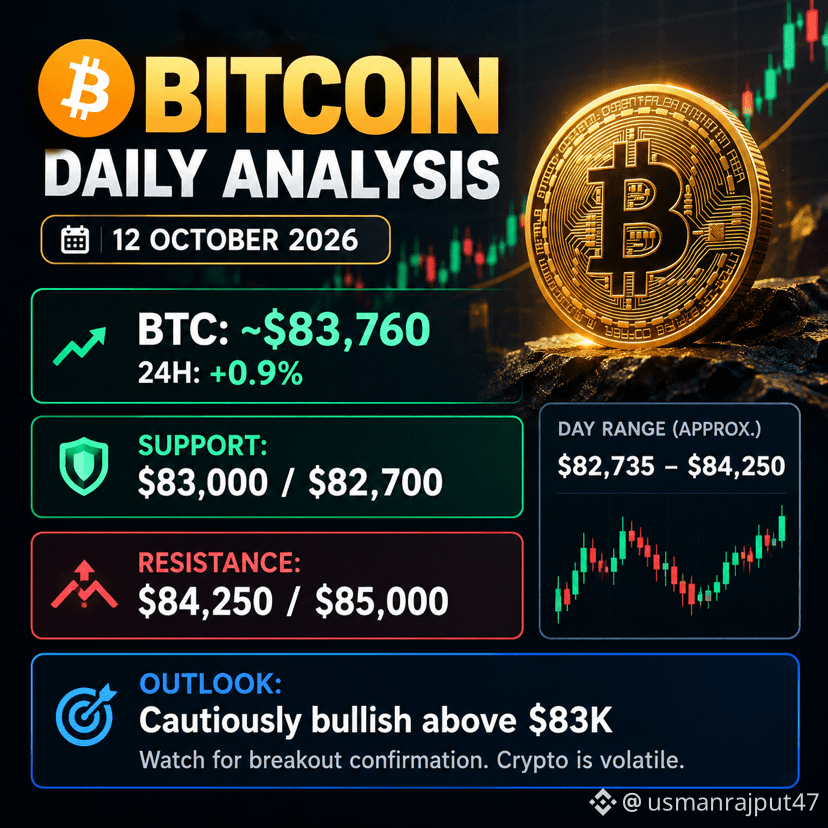
$BTC 📊 Market Overview: Bitcoin is trading around $83,760, up approximately 0.9% over the last 24 hours.
* 🟢 Support: $83,000–$82,700
* 🔴 Resistance: $84,250–$85,000
* 📈 Bullish Scenario: A breakout above $84,250 could open the way toward $85,000.
* 📉 Bearish Scenario: A drop below $82,700 could signal further weakness.
Outlook: Cautiously bullish while BTC holds above $83,000. Wait for breakout confirmation before entering a trade. Cryptocurrency markets are volatile, so manage risk carefully.
{spot}(BTCUSDT)
#BitcoinReclaims$84K #BitcoinReclaims$84K
$BTC 📊 Market Overview: Bitcoin is trading around $83,760, up approximately 0.9% over the last 24 hours.
* 🟢 Support: $83,000–$82,700
* 🔴 Resistance: $84,250–$85,000
* 📈 Bullish Scenario: A breakout above $84,250 could open the way toward $85,000.
* 📉 Bearish Scenario: A drop below $82,700 could signal further weakness.
Outlook: Cautiously bullish while BTC holds above $83,000. Wait for breakout confirmation before entering a trade. Cryptocurrency markets are volatile, so manage risk carefully.
#BitcoinReclaims$84K #BitcoinReclaims$84K
* 🟢 Support: $83,000–$82,700
* 🔴 Resistance: $84,250–$85,000
* 📈 Bullish Scenario: A breakout above $84,250 could open the way toward $85,000.
* 📉 Bearish Scenario: A drop below $82,700 could signal further weakness.
Outlook: Cautiously bullish while BTC holds above $83,000. Wait for breakout confirmation before entering a trade. Cryptocurrency markets are volatile, so manage risk carefully.
#BitcoinReclaims$84K #BitcoinReclaims$84K
2
71
Anmelden und weiter Inhalte entdecken
Krypto-Nutzer weltweit auf Binance Square kennenlernen
⚡️ Bleib in Sachen Krypto stets am Puls.
💬 Die weltgrößte Kryptobörse vertraut darauf.
👍 Erhalte verlässliche Einblicke von verifizierten Creators.
E-Mail-Adresse/Telefonnummer
Trendthemen
NvidiaEarningsTonight:AIStocks’NextMove?
7,950 Aufrufe
173 Kommentare
Nvidias Bilanzvorlage: Erster Auftritt der Interims-CEO – Hält die KI-Story stand?
Binance News
·5 Likes
·3.2k Aufrufe
A Packed Week of Earnings and Data Tests Markets
95,260 Aufrufe
524 Kommentare
AnthropicIPOTestsInvestorAppetiteForAI
194,861 Aufrufe
2,008 Kommentare