
Alamgir al
31 Beiträge

Alamgir al
Melden
Nutzer blockieren
12 Following
4 Follower
33 Like gegeben
Beiträge
·
--
Artikel
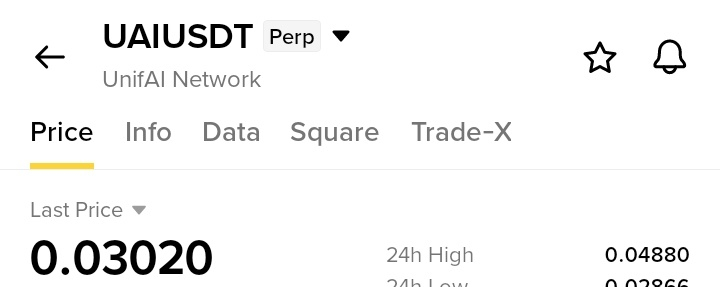
UAIUSDT$UAI / USDT
1. Aktueller Preis
- Preis: 0.03020 USDT
- In Rupien: 8,35 Rupien
- Heute: -36.46% ABWÄRTS – Das ist ein sehr starker Einbruch an einem einzigen Tag.
- Markpreis: 0.03025
$UAI = Nur 8 Rupien und 35 Paise.
2. Letzte 24 Stunden
- 24-Stunden-Hoch: 0.04880
- 24-Stunden-Tief: 0.02866
- 24-Stunden-Volumen UAI: 1.39B
- 24-Stunden-Volumen USDT: 49.46M
Das Handelsvolumen ist enorm: 49 Millionen Dollar. Das bedeutet, dass viele Leute in Panik verkaufen.
Vom Hoch zum Tief: Der Kurs fiel von 0.04880 auf 0.02866. Das ist ein Rückgang von fast -41% an einem Tag. Das ist ein Crash.
3. Was zeigt der Chart?
UAIUSDT
$UAI / USDT
1. Aktueller Preis
- Preis: 0.03020 USDT
- In Rupien: 8,35 Rupien
- Heute: -36.46% ABWÄRTS – Das ist ein sehr starker Einbruch an einem einzigen Tag.
- Markpreis: 0.03025
$UAI = Nur 8 Rupien und 35 Paise.
2. Letzte 24 Stunden
- 24-Stunden-Hoch: 0.04880
- 24-Stunden-Tief: 0.02866
- 24-Stunden-Volumen UAI: 1.39B
- 24-Stunden-Volumen USDT: 49.46M
Das Handelsvolumen ist enorm: 49 Millionen Dollar. Das bedeutet, dass viele Leute in Panik verkaufen.
Vom Hoch zum Tief: Der Kurs fiel von 0.04880 auf 0.02866. Das ist ein Rückgang von fast -41% an einem Tag. Das ist ein Crash.
3. Was zeigt der Chart?
1. Aktueller Preis
- Preis: 0.03020 USDT
- In Rupien: 8,35 Rupien
- Heute: -36.46% ABWÄRTS – Das ist ein sehr starker Einbruch an einem einzigen Tag.
- Markpreis: 0.03025
$UAI = Nur 8 Rupien und 35 Paise.
2. Letzte 24 Stunden
- 24-Stunden-Hoch: 0.04880
- 24-Stunden-Tief: 0.02866
- 24-Stunden-Volumen UAI: 1.39B
- 24-Stunden-Volumen USDT: 49.46M
Das Handelsvolumen ist enorm: 49 Millionen Dollar. Das bedeutet, dass viele Leute in Panik verkaufen.
Vom Hoch zum Tief: Der Kurs fiel von 0.04880 auf 0.02866. Das ist ein Rückgang von fast -41% an einem Tag. Das ist ein Crash.
3. Was zeigt der Chart?
1.1k
·
--
Bullisch
Übersetzung ansehen
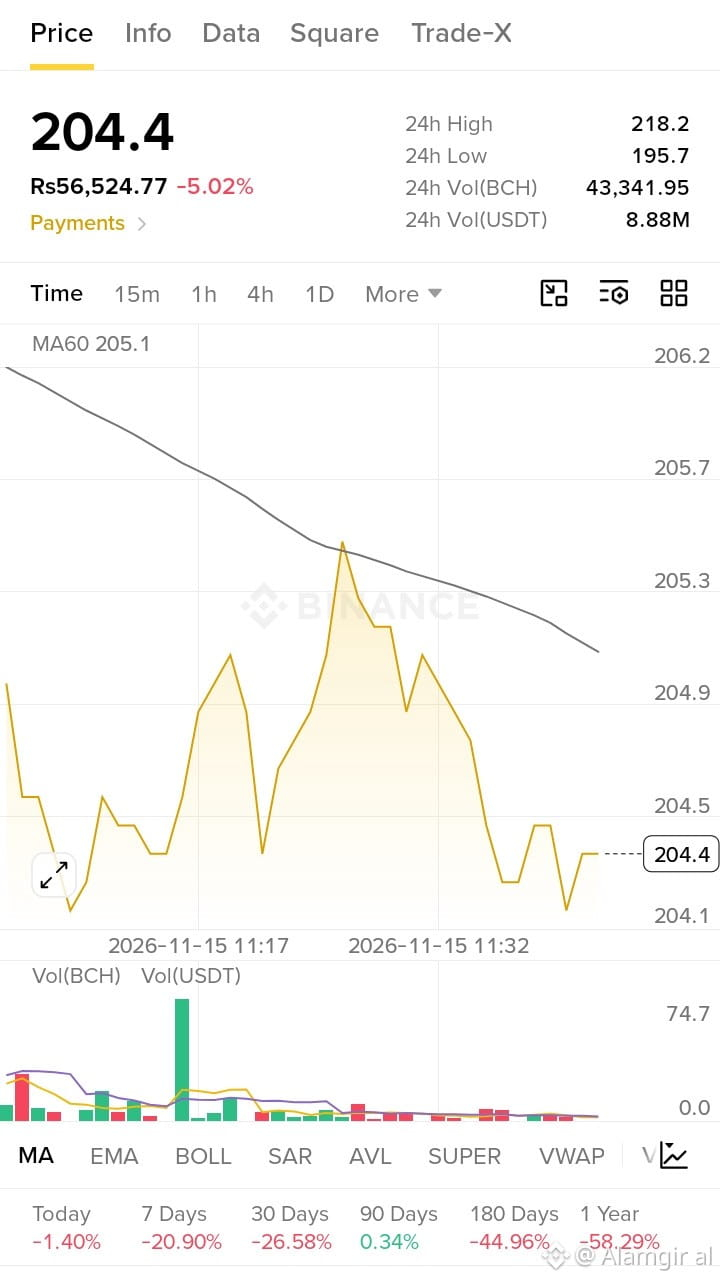
$BCH / USDT
1. Current Price
Price: 204.4 USDT
In Rupees: Rs 56,524.77
Today: -5.02% DOWN
1 BCH = 56 Thousand 524 Rupees.
2. Last 24 Hours
24h High: 218.2
24h Low: 195.7
24h Volume BCH: 43,341.95
24h Volume USDT: 8.88M
Volume is good. 8.88 Million dollars trading. This is a big, old coin, not a new small coin.
3. What Does The Chart Show
Look at the chart carefully. Price is falling.
Price was near 205.3, then it tried to go up 2-3 times to 205.0 and 205.2, but every time sellers pushed it down. At the end, it fell down to 204.1, then made a small bounce to 204.4.
The black line MA60 = 205.1. Price 204.4 is BELOW that line. That means sellers are winning now. Price is under the line. This is a weak sign.
At the bottom, you see one big green bar. That was one big buy. After that, volume is very low. No big buying, no big selling. Market is slow.
This is called a Downtrend. Lower high, lower low. Price is making a staircase going down.
4. Past Performance
Today: -1.40%
7 Days: -20.90%
30 Days: -26.58%
90 Days: +0.34%
180 Days: -44.96%
1 Year: -58.29%
Simple meaning: BCH is red in almost all. In 7 Days it fell -20.90%. In 1 Year it fell -58.29%.
If someone bought 1 year ago for 100 Rupees, now it is only 41 Rupees left. Very big loss.
BCH is the old brother of Bitcoin, but right now it is very weak.
$BCH is not a pump coin. It is a slow, old coin. Right now it is falling.
Buying now at 204.4 is risky because it is below MA60 and it is near its low.
Support.
195.7 This is the 24h Low. If it breaks this, it will go more down to 190 or 185.
Resistance: 205.1 This is MA60. If price goes above this and stays there, then it will be safe to buy again. Next target will be 218.2.
Don't catch a falling knife. Wait for it to come above 205.1.
#WhatWillDriveCryptoandStocks’NextRebound?
$BCH / USDT
1. Current Price
Price: 204.4 USDT
In Rupees: Rs 56,524.77
Today: -5.02% DOWN
1 BCH = 56 Thousand 524 Rupees.
2. Last 24 Hours
24h High: 218.2
24h Low: 195.7
24h Volume BCH: 43,341.95
24h Volume USDT: 8.88M
Volume is good. 8.88 Million dollars trading. This is a big, old coin, not a new small coin.
3. What Does The Chart Show
Look at the chart carefully. Price is falling.
Price was near 205.3, then it tried to go up 2-3 times to 205.0 and 205.2, but every time sellers pushed it down. At the end, it fell down to 204.1, then made a small bounce to 204.4.
The black line MA60 = 205.1. Price 204.4 is BELOW that line. That means sellers are winning now. Price is under the line. This is a weak sign.
At the bottom, you see one big green bar. That was one big buy. After that, volume is very low. No big buying, no big selling. Market is slow.
This is called a Downtrend. Lower high, lower low. Price is making a staircase going down.
4. Past Performance
Today: -1.40%
7 Days: -20.90%
30 Days: -26.58%
90 Days: +0.34%
180 Days: -44.96%
1 Year: -58.29%
Simple meaning: BCH is red in almost all. In 7 Days it fell -20.90%. In 1 Year it fell -58.29%.
If someone bought 1 year ago for 100 Rupees, now it is only 41 Rupees left. Very big loss.
BCH is the old brother of Bitcoin, but right now it is very weak.
$BCH is not a pump coin. It is a slow, old coin. Right now it is falling.
Buying now at 204.4 is risky because it is below MA60 and it is near its low.
Support.
195.7 This is the 24h Low. If it breaks this, it will go more down to 190 or 185.
Resistance: 205.1 This is MA60. If price goes above this and stays there, then it will be safe to buy again. Next target will be 218.2.
Don't catch a falling knife. Wait for it to come above 205.1.
#WhatWillDriveCryptoandStocks’NextRebound?
1. Current Price
Price: 204.4 USDT
In Rupees: Rs 56,524.77
Today: -5.02% DOWN
1 BCH = 56 Thousand 524 Rupees.
2. Last 24 Hours
24h High: 218.2
24h Low: 195.7
24h Volume BCH: 43,341.95
24h Volume USDT: 8.88M
Volume is good. 8.88 Million dollars trading. This is a big, old coin, not a new small coin.
3. What Does The Chart Show
Look at the chart carefully. Price is falling.
Price was near 205.3, then it tried to go up 2-3 times to 205.0 and 205.2, but every time sellers pushed it down. At the end, it fell down to 204.1, then made a small bounce to 204.4.
The black line MA60 = 205.1. Price 204.4 is BELOW that line. That means sellers are winning now. Price is under the line. This is a weak sign.
At the bottom, you see one big green bar. That was one big buy. After that, volume is very low. No big buying, no big selling. Market is slow.
This is called a Downtrend. Lower high, lower low. Price is making a staircase going down.
4. Past Performance
Today: -1.40%
7 Days: -20.90%
30 Days: -26.58%
90 Days: +0.34%
180 Days: -44.96%
1 Year: -58.29%
Simple meaning: BCH is red in almost all. In 7 Days it fell -20.90%. In 1 Year it fell -58.29%.
If someone bought 1 year ago for 100 Rupees, now it is only 41 Rupees left. Very big loss.
BCH is the old brother of Bitcoin, but right now it is very weak.
$BCH is not a pump coin. It is a slow, old coin. Right now it is falling.
Buying now at 204.4 is risky because it is below MA60 and it is near its low.
Support.
195.7 This is the 24h Low. If it breaks this, it will go more down to 190 or 185.
Resistance: 205.1 This is MA60. If price goes above this and stays there, then it will be safe to buy again. Next target will be 218.2.
Don't catch a falling knife. Wait for it to come above 205.1.
#WhatWillDriveCryptoandStocks’NextRebound?
1
126
·
--
Übersetzung ansehen
1
89
·
--
Artikel
Übersetzung ansehen
SKDDB/USDT$SKDDB / USDT
This is NOT a normal coin. This is a bStocks Leveraged Short Stock Token. Read this carefully, it is very important.
1. What Is This Token
Full Name: GraniteShares 2x Short SK Hynix
SK Hynix is a big Korean company that makes chips / memory.
2x Short means:
If SK Hynix stock falls by 1%, this token goes UP by 2%.
If SK Hynix stock goes UP by 1%, this token goes DOWN by 2%.
So this token makes profit when the real company falls down. It is opposite.
2. Current Price
Price: 10.73 USDTIn Rupees: Rs 2,967.48
Today on Binance: +3.57% UP
Real Stock: SKDD $10.28 +8.78%
1 SKDDB = 2,967 Rupees.
3. Last 24 Hours
24h High: 10.93
24h Low: 10.19
24h Volume SKDDB: 3,974.83
24h Volume USDT: 41,921.32
Volume is very low. Only 41k dollars. This is a new, small token. Not many people trade it.
4. What Does The Chart Show
Look at the chart carefully. This is a very strange chart.
Price was flat near 10.86, then it went up to 10.88, then suddenly it fell down in one straight line like a cliff to 10.73, and then it became completely flat. No up, no down. Just a straight line.
Why? Because:
1. The US / Korea stock market closed, so price stopped moving.
2. There is no buyer / seller, so price is stuck.
The black line MA60 = 10.82. Price 10.73 is BELOW that line. That means it is slightly weak right now.
At the bottom, you see one big green bar, then one red bar, then nothing. That was the last trade. After that, volume is zero.
5. Past Performance
Today: +2.78%
7 Days: -8.45%
30 Days:
90 Days:
180 Days:
1 Year:
Because this token is New on Binance. It has no old history.
Today it is +2.78% UP, but 7 Days it is -8.45% DOWN. That means last week it was falling, today it made a small recovery.
This is a very risky token. Do NOT hold it for long time. Leveraged 2x Short tokens lose value every day because of fees and rebalancing. It is only for 1-day short-term trading.
If you think SK Hynix will fall tomorrow, then this token will go up. If you think SK Hynix will go up, then sell this token now.
Support:10.19 This was the 24h Low. If it breaks this, it will fall more.
Resistance:10.82 This is MA60. If price goes above this and stays there, then it is safe.
#WhoWillSucceedJensenHuangatNvidia?
SKDDB/USDT
$SKDDB / USDT
This is NOT a normal coin. This is a bStocks Leveraged Short Stock Token. Read this carefully, it is very important.
1. What Is This Token
Full Name: GraniteShares 2x Short SK Hynix
SK Hynix is a big Korean company that makes chips / memory.
2x Short means:
If SK Hynix stock falls by 1%, this token goes UP by 2%.
If SK Hynix stock goes UP by 1%, this token goes DOWN by 2%.
So this token makes profit when the real company falls down. It is opposite.
2. Current Price
Price: 10.73 USDTIn Rupees: Rs 2,967.48
Today on Binance: +3.57% UP
Real Stock: SKDD $10.28 +8.78%
1 SKDDB = 2,967 Rupees.
3. Last 24 Hours
24h High: 10.93
24h Low: 10.19
24h Volume SKDDB: 3,974.83
24h Volume USDT: 41,921.32
Volume is very low. Only 41k dollars. This is a new, small token. Not many people trade it.
4. What Does The Chart Show
Look at the chart carefully. This is a very strange chart.
Price was flat near 10.86, then it went up to 10.88, then suddenly it fell down in one straight line like a cliff to 10.73, and then it became completely flat. No up, no down. Just a straight line.
Why? Because:
1. The US / Korea stock market closed, so price stopped moving.
2. There is no buyer / seller, so price is stuck.
The black line MA60 = 10.82. Price 10.73 is BELOW that line. That means it is slightly weak right now.
At the bottom, you see one big green bar, then one red bar, then nothing. That was the last trade. After that, volume is zero.
5. Past Performance
Today: +2.78%
7 Days: -8.45%
30 Days:
90 Days:
180 Days:
1 Year:
Because this token is New on Binance. It has no old history.
Today it is +2.78% UP, but 7 Days it is -8.45% DOWN. That means last week it was falling, today it made a small recovery.
This is a very risky token. Do NOT hold it for long time. Leveraged 2x Short tokens lose value every day because of fees and rebalancing. It is only for 1-day short-term trading.
If you think SK Hynix will fall tomorrow, then this token will go up. If you think SK Hynix will go up, then sell this token now.
Support:10.19 This was the 24h Low. If it breaks this, it will fall more.
Resistance:10.82 This is MA60. If price goes above this and stays there, then it is safe.
#WhoWillSucceedJensenHuangatNvidia?
This is NOT a normal coin. This is a bStocks Leveraged Short Stock Token. Read this carefully, it is very important.
1. What Is This Token
Full Name: GraniteShares 2x Short SK Hynix
SK Hynix is a big Korean company that makes chips / memory.
2x Short means:
If SK Hynix stock falls by 1%, this token goes UP by 2%.
If SK Hynix stock goes UP by 1%, this token goes DOWN by 2%.
So this token makes profit when the real company falls down. It is opposite.
2. Current Price
Price: 10.73 USDTIn Rupees: Rs 2,967.48
Today on Binance: +3.57% UP
Real Stock: SKDD $10.28 +8.78%
1 SKDDB = 2,967 Rupees.
3. Last 24 Hours
24h High: 10.93
24h Low: 10.19
24h Volume SKDDB: 3,974.83
24h Volume USDT: 41,921.32
Volume is very low. Only 41k dollars. This is a new, small token. Not many people trade it.
4. What Does The Chart Show
Look at the chart carefully. This is a very strange chart.
Price was flat near 10.86, then it went up to 10.88, then suddenly it fell down in one straight line like a cliff to 10.73, and then it became completely flat. No up, no down. Just a straight line.
Why? Because:
1. The US / Korea stock market closed, so price stopped moving.
2. There is no buyer / seller, so price is stuck.
The black line MA60 = 10.82. Price 10.73 is BELOW that line. That means it is slightly weak right now.
At the bottom, you see one big green bar, then one red bar, then nothing. That was the last trade. After that, volume is zero.
5. Past Performance
Today: +2.78%
7 Days: -8.45%
30 Days:
90 Days:
180 Days:
1 Year:
Because this token is New on Binance. It has no old history.
Today it is +2.78% UP, but 7 Days it is -8.45% DOWN. That means last week it was falling, today it made a small recovery.
This is a very risky token. Do NOT hold it for long time. Leveraged 2x Short tokens lose value every day because of fees and rebalancing. It is only for 1-day short-term trading.
If you think SK Hynix will fall tomorrow, then this token will go up. If you think SK Hynix will go up, then sell this token now.
Support:10.19 This was the 24h Low. If it breaks this, it will fall more.
Resistance:10.82 This is MA60. If price goes above this and stays there, then it is safe.
#WhoWillSucceedJensenHuangatNvidia?
1
140
·
--
Übersetzung ansehen
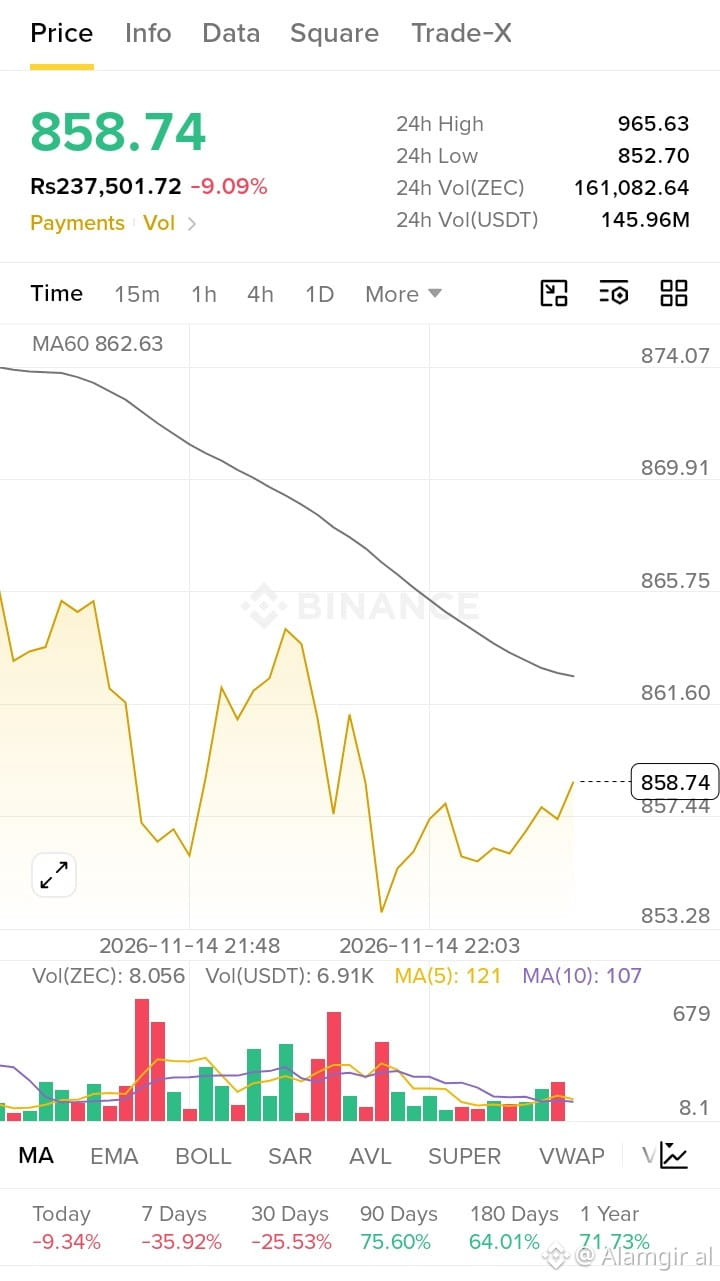
ZEC / USDT
1. Current Price
Price: 858.74 USDT
In Rupees: Rs 237,501.72
Today: -9.09% DOWN
1 ZEC = 2 Lakh 37 Thousand Rupees.
2. Last 24 Hours
24h High: 965.63
24h Low: 852.70
24h Volume ZEC: 161,082.64
24h Volume USDT: 145.96M
Volume is huge. 145 Million dollars. This means a lot of people are buying and selling $ZEC right now. This is a very active coin.
3. What Does The Chart Show
Look at the chart carefully. Price is falling like stairs.
It was near 874, then it fell to 865, then to 861, then to 853. Every time it tried to go up, sellers pushed it back down.
The black line MA60 = 862.63. Price 858.74 is BELOW that line. That means sellers are winning.
But at the right side, price is making a small bounce from 853 to 858.74. That is a small green recovery. Buyers are trying to come back.
At the bottom, you see red bars and green bars. Red = selling, Green = buying. Right now both are fighting.
This is called a Correction. $ZEC went up too fast before, now it is taking a rest and coming down.
4. Past Performance
Today: -9.34%
7 Days: -35.92%
30 Days: -25.53%
90 Days: +75.60%
180 Days: +64.01%
1 Year: +71.73%
Simple meaning: Short-term it is DOWN badly. In 7 Days it fell -35%. That is a big loss.
But long-term it is still UP. In 1 Year it is +71%. So if someone bought 1 year ago for 100 Rupees, now it is 171 Rupees. Still profit.
$ZEC is a fast, volatile coin. It moves very fast up and down. Not for beginners.
Right now it is in a downtrend.
Support (If it falls):852.70 This is the 24h Low. If it breaks this, it will go to 820 or 800.
Resistance (If it goes up):862.63 This is MA60. If price goes above this and stays there, then it is safe to buy. Next target will be 965.63.
Don't catch a falling knife. Wait for price to come above 862.63.
#WhoWillSucceedJensenHuangatNvidia?
ZEC / USDT
1. Current Price
Price: 858.74 USDT
In Rupees: Rs 237,501.72
Today: -9.09% DOWN
1 ZEC = 2 Lakh 37 Thousand Rupees.
2. Last 24 Hours
24h High: 965.63
24h Low: 852.70
24h Volume ZEC: 161,082.64
24h Volume USDT: 145.96M
Volume is huge. 145 Million dollars. This means a lot of people are buying and selling $ZEC right now. This is a very active coin.
3. What Does The Chart Show
Look at the chart carefully. Price is falling like stairs.
It was near 874, then it fell to 865, then to 861, then to 853. Every time it tried to go up, sellers pushed it back down.
The black line MA60 = 862.63. Price 858.74 is BELOW that line. That means sellers are winning.
But at the right side, price is making a small bounce from 853 to 858.74. That is a small green recovery. Buyers are trying to come back.
At the bottom, you see red bars and green bars. Red = selling, Green = buying. Right now both are fighting.
This is called a Correction. $ZEC went up too fast before, now it is taking a rest and coming down.
4. Past Performance
Today: -9.34%
7 Days: -35.92%
30 Days: -25.53%
90 Days: +75.60%
180 Days: +64.01%
1 Year: +71.73%
Simple meaning: Short-term it is DOWN badly. In 7 Days it fell -35%. That is a big loss.
But long-term it is still UP. In 1 Year it is +71%. So if someone bought 1 year ago for 100 Rupees, now it is 171 Rupees. Still profit.
$ZEC is a fast, volatile coin. It moves very fast up and down. Not for beginners.
Right now it is in a downtrend.
Support (If it falls):852.70 This is the 24h Low. If it breaks this, it will go to 820 or 800.
Resistance (If it goes up):862.63 This is MA60. If price goes above this and stays there, then it is safe to buy. Next target will be 965.63.
Don't catch a falling knife. Wait for price to come above 862.63.
#WhoWillSucceedJensenHuangatNvidia?
1. Current Price
Price: 858.74 USDT
In Rupees: Rs 237,501.72
Today: -9.09% DOWN
1 ZEC = 2 Lakh 37 Thousand Rupees.
2. Last 24 Hours
24h High: 965.63
24h Low: 852.70
24h Volume ZEC: 161,082.64
24h Volume USDT: 145.96M
Volume is huge. 145 Million dollars. This means a lot of people are buying and selling $ZEC right now. This is a very active coin.
3. What Does The Chart Show
Look at the chart carefully. Price is falling like stairs.
It was near 874, then it fell to 865, then to 861, then to 853. Every time it tried to go up, sellers pushed it back down.
The black line MA60 = 862.63. Price 858.74 is BELOW that line. That means sellers are winning.
But at the right side, price is making a small bounce from 853 to 858.74. That is a small green recovery. Buyers are trying to come back.
At the bottom, you see red bars and green bars. Red = selling, Green = buying. Right now both are fighting.
This is called a Correction. $ZEC went up too fast before, now it is taking a rest and coming down.
4. Past Performance
Today: -9.34%
7 Days: -35.92%
30 Days: -25.53%
90 Days: +75.60%
180 Days: +64.01%
1 Year: +71.73%
Simple meaning: Short-term it is DOWN badly. In 7 Days it fell -35%. That is a big loss.
But long-term it is still UP. In 1 Year it is +71%. So if someone bought 1 year ago for 100 Rupees, now it is 171 Rupees. Still profit.
$ZEC is a fast, volatile coin. It moves very fast up and down. Not for beginners.
Right now it is in a downtrend.
Support (If it falls):852.70 This is the 24h Low. If it breaks this, it will go to 820 or 800.
Resistance (If it goes up):862.63 This is MA60. If price goes above this and stays there, then it is safe to buy. Next target will be 965.63.
Don't catch a falling knife. Wait for price to come above 862.63.
#WhoWillSucceedJensenHuangatNvidia?
1
531
·
--
Übersetzung ansehen
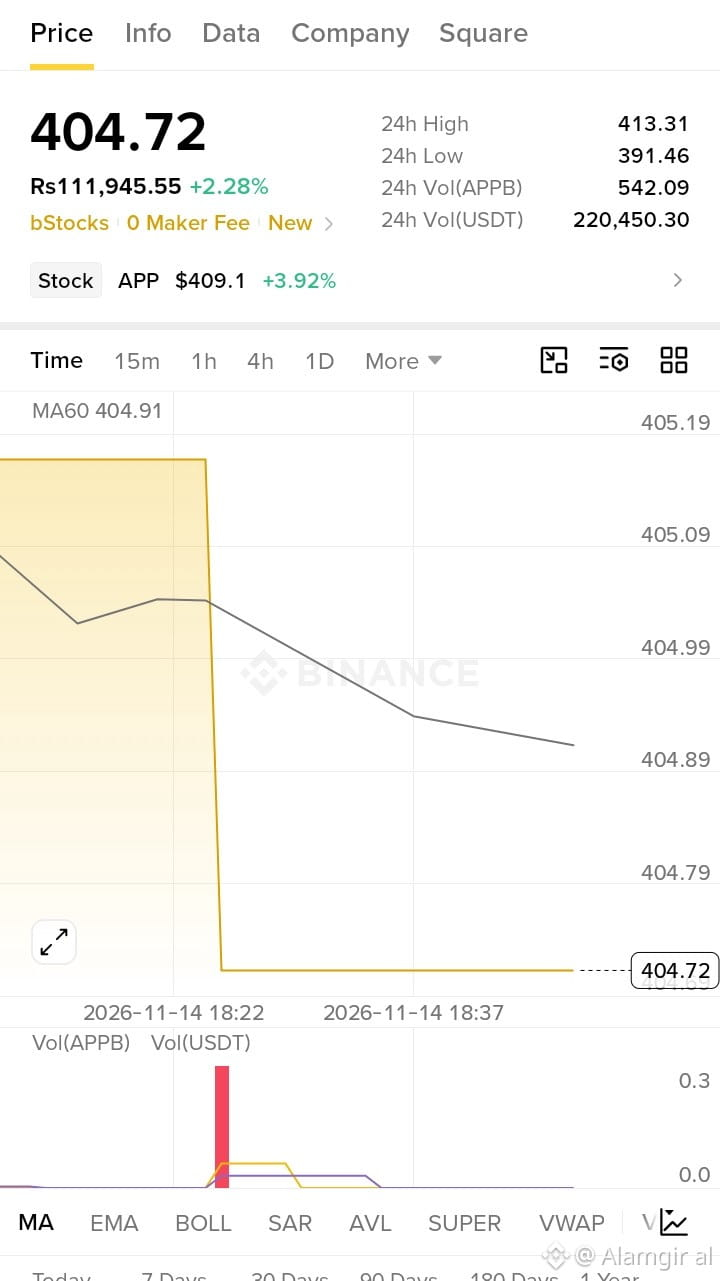
APPB / USDT
This is not a crypto coin. This is a Stock Token. It follows the real US stock APP - AppLovin.
1. Current Price
Price: 404.72 USDT
In Rupees: Rs 111,945.55
Today on Binance: +2.28% UP
Real Stock Price: APP $409.1 +3.92%
1 APPB = 1 Lakh 11 Thousand Rupees. Very expensive token.
2. Last 24 Hours
24h High: 413.31
24h Low: 391.46
24h Volume APPB: 542.09
24h Volume USDT: 220,450.30
Volume is low. Only 220k dollars. Because this is a new bStocks token, not many people trade it on Binance.
3. What Does The Chart Show
Look at the chart carefully. This is the most important part.
Price was flat near 405.19, then suddenly it fell down in one straight line like a cliff to 404.72, and then it became completely flat. No up, no down. Just a straight line.
This is not a normal crypto chart. This happened because:
1. The US stock market closed, so the price stopped moving.
2. Or there is no buyer / seller at this time, so price is stuck.
The black line MA60 = 404.91. Price 404.72 is just BELOW that line. Only a little below. That means it is slightly weak, but not a big dump.
At the bottom, you see one big red bar. That was the one big sell. After that, volume is zero. No trading.
4. Past Performance
Today: -1.25%
7 Days: +3.10%
30 Days:
90 Days:
180 Days:
1 Year:
Why -- ? Because this bStocks token is New on Binance. It has no old history. The 7 Days data is only +3.10%, that means the real stock is stable and slowly going up.
APPB is a safe, slow stock token. It is not like ADA or SXT that pump and dump.
It is good for long-term holding, not for short-term trading, because volume is very low and price does not move much when US market is closed.
If you want to buy, wait for the US market to open. Then price will move with the real APP stock.
Safe Entry: Above 404.91 (MA60)
Support:391.46 This was the 24h Low. If it breaks this, it will fall more.
APPB / USDT
This is not a crypto coin. This is a Stock Token. It follows the real US stock APP - AppLovin.
1. Current Price
Price: 404.72 USDT
In Rupees: Rs 111,945.55
Today on Binance: +2.28% UP
Real Stock Price: APP $409.1 +3.92%
1 APPB = 1 Lakh 11 Thousand Rupees. Very expensive token.
2. Last 24 Hours
24h High: 413.31
24h Low: 391.46
24h Volume APPB: 542.09
24h Volume USDT: 220,450.30
Volume is low. Only 220k dollars. Because this is a new bStocks token, not many people trade it on Binance.
3. What Does The Chart Show
Look at the chart carefully. This is the most important part.
Price was flat near 405.19, then suddenly it fell down in one straight line like a cliff to 404.72, and then it became completely flat. No up, no down. Just a straight line.
This is not a normal crypto chart. This happened because:
1. The US stock market closed, so the price stopped moving.
2. Or there is no buyer / seller at this time, so price is stuck.
The black line MA60 = 404.91. Price 404.72 is just BELOW that line. Only a little below. That means it is slightly weak, but not a big dump.
At the bottom, you see one big red bar. That was the one big sell. After that, volume is zero. No trading.
4. Past Performance
Today: -1.25%
7 Days: +3.10%
30 Days:
90 Days:
180 Days:
1 Year:
Why -- ? Because this bStocks token is New on Binance. It has no old history. The 7 Days data is only +3.10%, that means the real stock is stable and slowly going up.
APPB is a safe, slow stock token. It is not like ADA or SXT that pump and dump.
It is good for long-term holding, not for short-term trading, because volume is very low and price does not move much when US market is closed.
If you want to buy, wait for the US market to open. Then price will move with the real APP stock.
Safe Entry: Above 404.91 (MA60)
Support:391.46 This was the 24h Low. If it breaks this, it will fall more.
This is not a crypto coin. This is a Stock Token. It follows the real US stock APP - AppLovin.
1. Current Price
Price: 404.72 USDT
In Rupees: Rs 111,945.55
Today on Binance: +2.28% UP
Real Stock Price: APP $409.1 +3.92%
1 APPB = 1 Lakh 11 Thousand Rupees. Very expensive token.
2. Last 24 Hours
24h High: 413.31
24h Low: 391.46
24h Volume APPB: 542.09
24h Volume USDT: 220,450.30
Volume is low. Only 220k dollars. Because this is a new bStocks token, not many people trade it on Binance.
3. What Does The Chart Show
Look at the chart carefully. This is the most important part.
Price was flat near 405.19, then suddenly it fell down in one straight line like a cliff to 404.72, and then it became completely flat. No up, no down. Just a straight line.
This is not a normal crypto chart. This happened because:
1. The US stock market closed, so the price stopped moving.
2. Or there is no buyer / seller at this time, so price is stuck.
The black line MA60 = 404.91. Price 404.72 is just BELOW that line. Only a little below. That means it is slightly weak, but not a big dump.
At the bottom, you see one big red bar. That was the one big sell. After that, volume is zero. No trading.
4. Past Performance
Today: -1.25%
7 Days: +3.10%
30 Days:
90 Days:
180 Days:
1 Year:
Why -- ? Because this bStocks token is New on Binance. It has no old history. The 7 Days data is only +3.10%, that means the real stock is stable and slowly going up.
APPB is a safe, slow stock token. It is not like ADA or SXT that pump and dump.
It is good for long-term holding, not for short-term trading, because volume is very low and price does not move much when US market is closed.
If you want to buy, wait for the US market to open. Then price will move with the real APP stock.
Safe Entry: Above 404.91 (MA60)
Support:391.46 This was the 24h Low. If it breaks this, it will fall more.
1
1
208
·
--
Übersetzung ansehen
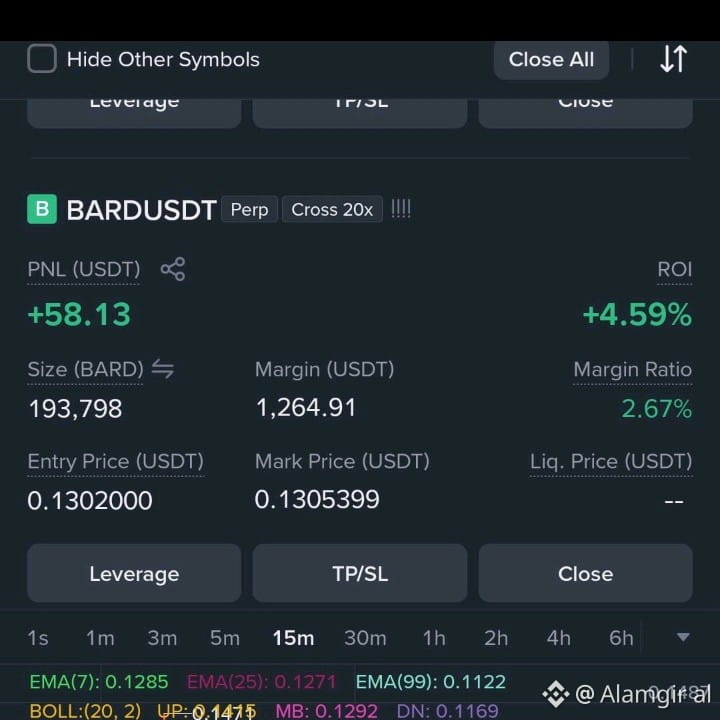
BARD / USDT - Futures Trade
1. Your Position
Coin: BARDUSDT Perp
Leverage: Cross 20x
Position: LONG Because your Entry is lower than Mark Price and your PNL is Green, it means you bought for UP.
2. Your Profit Right Now
PNL: +58.13 USDT
ROI: +4.59%
That means you are in PROFIT. Good trade.
3. Entry and Current Price
Entry Price: 0.1302000
Mark Price (Current): 0.1305399
Difference: Only +0.00034 up. Very small move up, but because you used 20x leverage and a big size, your profit became 58 USDT.
Size: 193,798 BARD
Margin Used: 1,264.91 USDT
Margin Ratio: 2.67% This is very low and safe. No liquidation danger right now.
Liq. Price: Because you are on Cross margin, it is not showing. Your liquidation is far away.
4. What Do The Indicators Show
EMA(7): 0.1285
EMA(25): 0.1271
EMA(99): 0.1122
Price 0.1305 is ABOVE all 3 EMAs. This is a BULLISH sign. Price is above all averages, buyers are strong.
BOLL: UP 0.1475, MB 0.1292, DN 0.1169
Price 0.1305 is just above Middle Line 0.1292. That means it just broke up from the middle. If it stays above 0.1292, it can go to 0.1475.
If it falls below 0.1292 again, it will go down to 0.1169.
SUPERTREND: 0.1382
Price is still BELOW Supertrend 0.1382. That means the big trend is still not fully bullish. Supertrend is still showing resistance at 0.1382.
Your trade is in profit, but it is a very small profit. Price is stuck between 0.1292 support and 0.1382 resistance.
What to do now
1. If you want safe profit, put your Stop Loss at 0.1292 your entry. Then you will not lose.
2. Your first Target is 0.1382 Supertrend. If price breaks that, it will go fast to 0.1475.
3. Don't close now for 58 USDT. The setup is still good, price is above all EMAs. Just protect your trade.
Do you want me to tell you where to put TP/SL for this BARD trade?
BARD / USDT - Futures Trade
1. Your Position
Coin: BARDUSDT Perp
Leverage: Cross 20x
Position: LONG Because your Entry is lower than Mark Price and your PNL is Green, it means you bought for UP.
2. Your Profit Right Now
PNL: +58.13 USDT
ROI: +4.59%
That means you are in PROFIT. Good trade.
3. Entry and Current Price
Entry Price: 0.1302000
Mark Price (Current): 0.1305399
Difference: Only +0.00034 up. Very small move up, but because you used 20x leverage and a big size, your profit became 58 USDT.
Size: 193,798 BARD
Margin Used: 1,264.91 USDT
Margin Ratio: 2.67% This is very low and safe. No liquidation danger right now.
Liq. Price: Because you are on Cross margin, it is not showing. Your liquidation is far away.
4. What Do The Indicators Show
EMA(7): 0.1285
EMA(25): 0.1271
EMA(99): 0.1122
Price 0.1305 is ABOVE all 3 EMAs. This is a BULLISH sign. Price is above all averages, buyers are strong.
BOLL: UP 0.1475, MB 0.1292, DN 0.1169
Price 0.1305 is just above Middle Line 0.1292. That means it just broke up from the middle. If it stays above 0.1292, it can go to 0.1475.
If it falls below 0.1292 again, it will go down to 0.1169.
SUPERTREND: 0.1382
Price is still BELOW Supertrend 0.1382. That means the big trend is still not fully bullish. Supertrend is still showing resistance at 0.1382.
Your trade is in profit, but it is a very small profit. Price is stuck between 0.1292 support and 0.1382 resistance.
What to do now
1. If you want safe profit, put your Stop Loss at 0.1292 your entry. Then you will not lose.
2. Your first Target is 0.1382 Supertrend. If price breaks that, it will go fast to 0.1475.
3. Don't close now for 58 USDT. The setup is still good, price is above all EMAs. Just protect your trade.
Do you want me to tell you where to put TP/SL for this BARD trade?
1. Your Position
Coin: BARDUSDT Perp
Leverage: Cross 20x
Position: LONG Because your Entry is lower than Mark Price and your PNL is Green, it means you bought for UP.
2. Your Profit Right Now
PNL: +58.13 USDT
ROI: +4.59%
That means you are in PROFIT. Good trade.
3. Entry and Current Price
Entry Price: 0.1302000
Mark Price (Current): 0.1305399
Difference: Only +0.00034 up. Very small move up, but because you used 20x leverage and a big size, your profit became 58 USDT.
Size: 193,798 BARD
Margin Used: 1,264.91 USDT
Margin Ratio: 2.67% This is very low and safe. No liquidation danger right now.
Liq. Price: Because you are on Cross margin, it is not showing. Your liquidation is far away.
4. What Do The Indicators Show
EMA(7): 0.1285
EMA(25): 0.1271
EMA(99): 0.1122
Price 0.1305 is ABOVE all 3 EMAs. This is a BULLISH sign. Price is above all averages, buyers are strong.
BOLL: UP 0.1475, MB 0.1292, DN 0.1169
Price 0.1305 is just above Middle Line 0.1292. That means it just broke up from the middle. If it stays above 0.1292, it can go to 0.1475.
If it falls below 0.1292 again, it will go down to 0.1169.
SUPERTREND: 0.1382
Price is still BELOW Supertrend 0.1382. That means the big trend is still not fully bullish. Supertrend is still showing resistance at 0.1382.
Your trade is in profit, but it is a very small profit. Price is stuck between 0.1292 support and 0.1382 resistance.
What to do now
1. If you want safe profit, put your Stop Loss at 0.1292 your entry. Then you will not lose.
2. Your first Target is 0.1382 Supertrend. If price breaks that, it will go fast to 0.1475.
3. Don't close now for 58 USDT. The setup is still good, price is above all EMAs. Just protect your trade.
Do you want me to tell you where to put TP/SL for this BARD trade?
1
64
·
--
Übersetzung ansehen
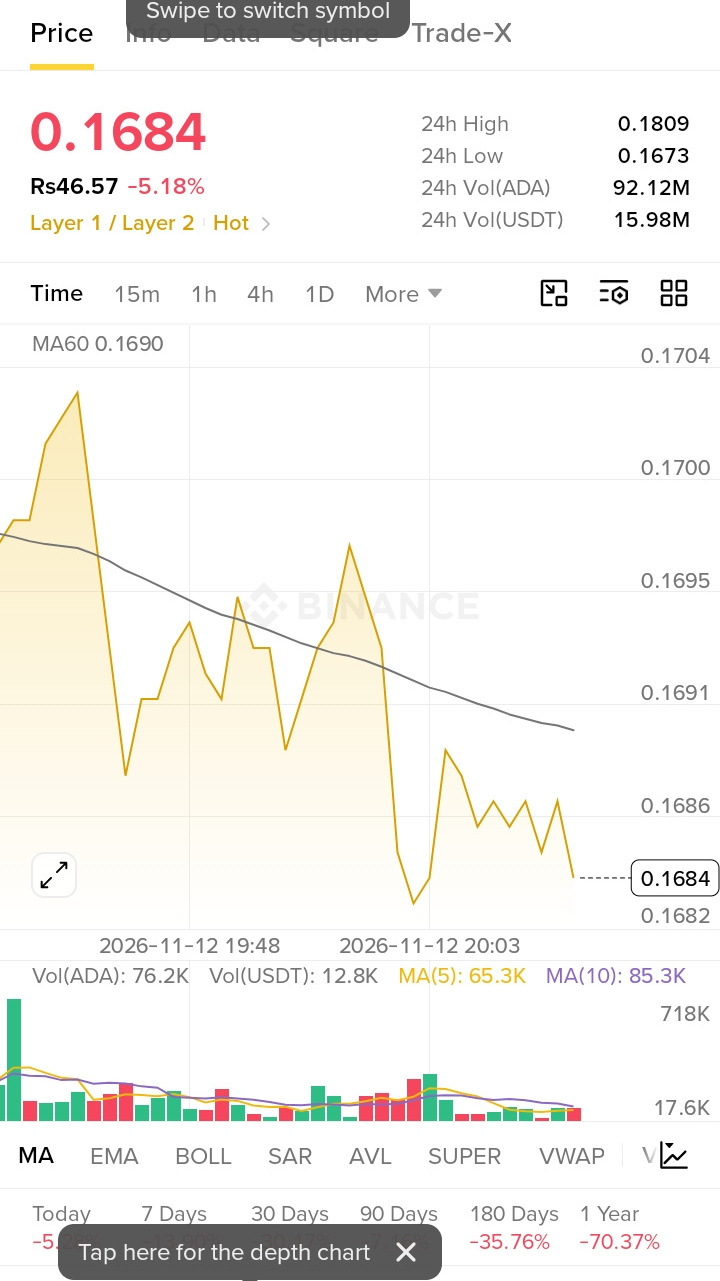
ADA / USDT
1. Current Price
Price: 0.1684 USDT
In Rupees: Rs 46.57
Today: -5.18% DOWN
1 ADA = 46 Rupees 57 Paisa.
2. Last 24 Hours
24h High: 0.1809
24h Low: 0.1673
24h Volume ADA: 92.12M
24h Volume USDT: 15.98M
Volume is good. 15.98 Million dollars trading. This is a big coin, not a small pump coin like SXT.
3. What Does The Chart Show?l
Look at the chart carefully. This is a DOWN chart, opposite of ERA.
Price was high near 0.1704, then it fell down very fast, then it tried to go up 2-3 times, but every time it went up, sellers pushed it down again. Now it is at the bottom near 0.1684.
The black line MA60 = *0.1690*. Price 0.1684 is *BELOW* that line. That means sellers are winning now. Price is under the line. This is a weak sign.
At the bottom, you see red bars. Red means selling is more than buying.
This is called a Downtrend. Lower high, lower low. Price is making a staircase going down.
4. Past Performance
Today: -5.18% 180 Days: -35.76%
1 Year: -70.37%
Simple meaning: ADA is red in long-term. In 1 Year it is -70.37% DOWN. If someone bought 1 year ago for 100 Rupees, now it is only 29 Rupees left. Very big loss.
Cardano is a very famous coin, Layer 1, but right now the whole market is down, so ADA is also down.
ADA is not a pump coin. It is a slow, big coin. Right now it is falling. Buying now at 0.1684 is risky because it is below MA60 and it is near its 24h Low 0.1673.
If it breaks 0.1673, it will go more down to 0.1650 or 0.1600.
If you want to buy, wait for it to come back above 0.1690 and stay there. That will be a safe entry. Don't catch a falling knife.
Did you buy ADA already? Tell me your buying price, I will tell you if you should hold or sell and wait.
ADA / USDT
1. Current Price
Price: 0.1684 USDT
In Rupees: Rs 46.57
Today: -5.18% DOWN
1 ADA = 46 Rupees 57 Paisa.
2. Last 24 Hours
24h High: 0.1809
24h Low: 0.1673
24h Volume ADA: 92.12M
24h Volume USDT: 15.98M
Volume is good. 15.98 Million dollars trading. This is a big coin, not a small pump coin like SXT.
3. What Does The Chart Show?l
Look at the chart carefully. This is a DOWN chart, opposite of ERA.
Price was high near 0.1704, then it fell down very fast, then it tried to go up 2-3 times, but every time it went up, sellers pushed it down again. Now it is at the bottom near 0.1684.
The black line MA60 = *0.1690*. Price 0.1684 is *BELOW* that line. That means sellers are winning now. Price is under the line. This is a weak sign.
At the bottom, you see red bars. Red means selling is more than buying.
This is called a Downtrend. Lower high, lower low. Price is making a staircase going down.
4. Past Performance
Today: -5.18% 180 Days: -35.76%
1 Year: -70.37%
Simple meaning: ADA is red in long-term. In 1 Year it is -70.37% DOWN. If someone bought 1 year ago for 100 Rupees, now it is only 29 Rupees left. Very big loss.
Cardano is a very famous coin, Layer 1, but right now the whole market is down, so ADA is also down.
ADA is not a pump coin. It is a slow, big coin. Right now it is falling. Buying now at 0.1684 is risky because it is below MA60 and it is near its 24h Low 0.1673.
If it breaks 0.1673, it will go more down to 0.1650 or 0.1600.
If you want to buy, wait for it to come back above 0.1690 and stay there. That will be a safe entry. Don't catch a falling knife.
Did you buy ADA already? Tell me your buying price, I will tell you if you should hold or sell and wait.
1. Current Price
Price: 0.1684 USDT
In Rupees: Rs 46.57
Today: -5.18% DOWN
1 ADA = 46 Rupees 57 Paisa.
2. Last 24 Hours
24h High: 0.1809
24h Low: 0.1673
24h Volume ADA: 92.12M
24h Volume USDT: 15.98M
Volume is good. 15.98 Million dollars trading. This is a big coin, not a small pump coin like SXT.
3. What Does The Chart Show?l
Look at the chart carefully. This is a DOWN chart, opposite of ERA.
Price was high near 0.1704, then it fell down very fast, then it tried to go up 2-3 times, but every time it went up, sellers pushed it down again. Now it is at the bottom near 0.1684.
The black line MA60 = *0.1690*. Price 0.1684 is *BELOW* that line. That means sellers are winning now. Price is under the line. This is a weak sign.
At the bottom, you see red bars. Red means selling is more than buying.
This is called a Downtrend. Lower high, lower low. Price is making a staircase going down.
4. Past Performance
Today: -5.18% 180 Days: -35.76%
1 Year: -70.37%
Simple meaning: ADA is red in long-term. In 1 Year it is -70.37% DOWN. If someone bought 1 year ago for 100 Rupees, now it is only 29 Rupees left. Very big loss.
Cardano is a very famous coin, Layer 1, but right now the whole market is down, so ADA is also down.
ADA is not a pump coin. It is a slow, big coin. Right now it is falling. Buying now at 0.1684 is risky because it is below MA60 and it is near its 24h Low 0.1673.
If it breaks 0.1673, it will go more down to 0.1650 or 0.1600.
If you want to buy, wait for it to come back above 0.1690 and stay there. That will be a safe entry. Don't catch a falling knife.
Did you buy ADA already? Tell me your buying price, I will tell you if you should hold or sell and wait.
1
70
·
--
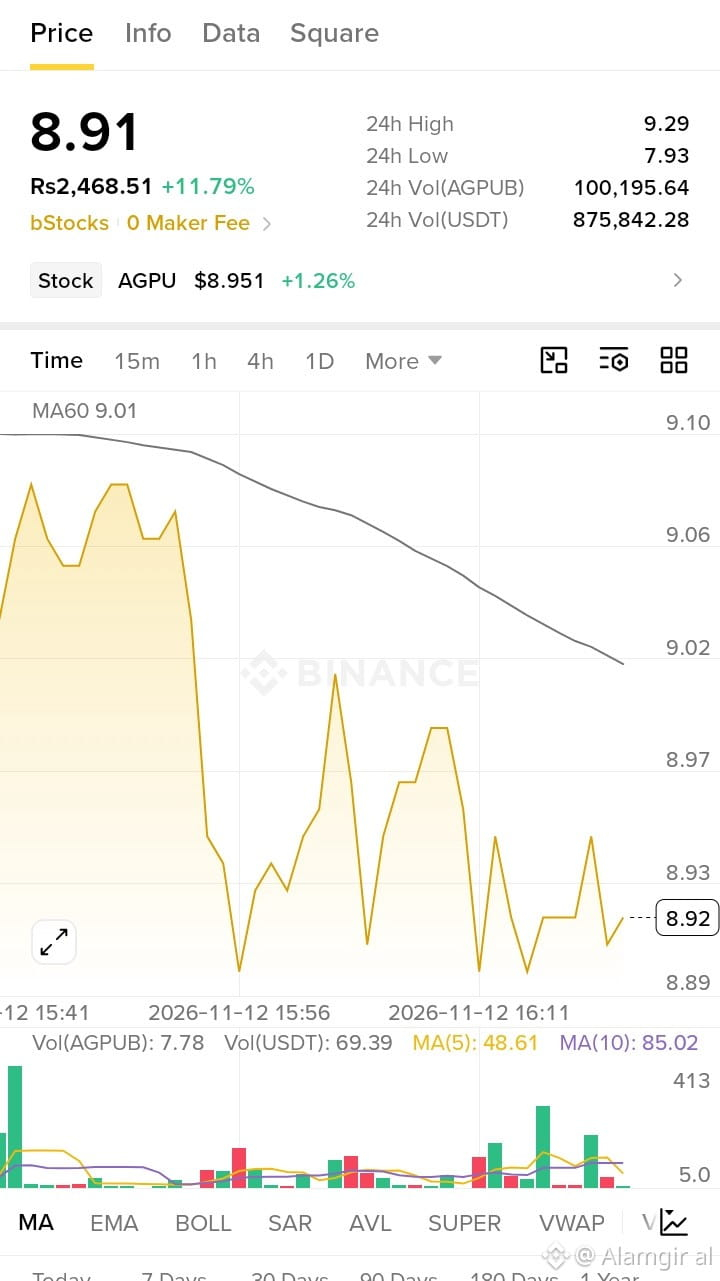
Unterstützung 1 $8.90
Unterstützung 2 $8.89
Niedrigere Unterstützung $8.80
3. Mögliche Szenarien
Wenn AGPUB die Marke von $9.02 durchbricht und sich darüber hält, sind die nächsten möglichen Ziele $9.10 und $9.29.
Fällt der Kurs unter $8.89, könnte er sich in Richtung $8.80 bewegen.
4. Meine Einschätzung
AGPUB verzeichnet einen starken Tagesgewinn, aber der kurzfristige Chart zeigt Schwäche. Ich würde auf eine Bestätigung oberhalb von $9.02 warten, anstatt dem Kurs hinterherzujagen.
Eine Frage: Hast du AGPUB bereits gekauft oder planst du, einzusteigen?
Ich kann dir dabei helfen, Einstiegskurs sowie Stop-Loss- und Take-Profit-Niveaus zu berechnen.
Unterstützung 1 $8.90
Unterstützung 2 $8.89
Niedrigere Unterstützung $8.80
3. Mögliche Szenarien
Wenn AGPUB die Marke von $9.02 durchbricht und sich darüber hält, sind die nächsten möglichen Ziele $9.10 und $9.29.
Fällt der Kurs unter $8.89, könnte er sich in Richtung $8.80 bewegen.
4. Meine Einschätzung
AGPUB verzeichnet einen starken Tagesgewinn, aber der kurzfristige Chart zeigt Schwäche. Ich würde auf eine Bestätigung oberhalb von $9.02 warten, anstatt dem Kurs hinterherzujagen.
Eine Frage: Hast du AGPUB bereits gekauft oder planst du, einzusteigen?
Ich kann dir dabei helfen, Einstiegskurs sowie Stop-Loss- und Take-Profit-Niveaus zu berechnen.
Unterstützung 2 $8.89
Niedrigere Unterstützung $8.80
3. Mögliche Szenarien
Wenn AGPUB die Marke von $9.02 durchbricht und sich darüber hält, sind die nächsten möglichen Ziele $9.10 und $9.29.
Fällt der Kurs unter $8.89, könnte er sich in Richtung $8.80 bewegen.
4. Meine Einschätzung
AGPUB verzeichnet einen starken Tagesgewinn, aber der kurzfristige Chart zeigt Schwäche. Ich würde auf eine Bestätigung oberhalb von $9.02 warten, anstatt dem Kurs hinterherzujagen.
Eine Frage: Hast du AGPUB bereits gekauft oder planst du, einzusteigen?
Ich kann dir dabei helfen, Einstiegskurs sowie Stop-Loss- und Take-Profit-Niveaus zu berechnen.
1
56
·
--
Artikel
Übersetzung ansehen
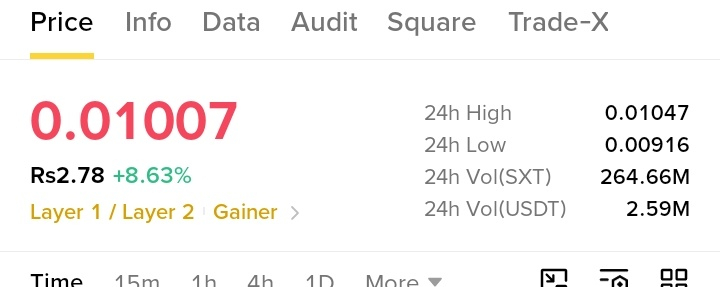
sxt SXT / USDT
1. Current Price
- Price: 0.01007 USDT
- In Rupees: Rs 2.78
- Today: +8.63% UP
1 SXT = 2 Rupees 78 Paisa. Very cheap coin.
2. Last 24 Hours
- 24h High: 0.01047
- 24h Low: 0.00916
- 24h Volume: 2.59M USDT
Volume is low. Only 2.59 Million dollars. That means not many big traders are here.
3. What Does The Chart Show?
Look at the chart carefully. This is the most important part.
Price was flat near 0.0100, then suddenly it pumped up very fast like a mountain to 0.01046, and then it fell down just as fast back to 0.01007.
This is called a Pump and Dump. Someone bought a lot, price went up, then they sold and price came down.
The black line MA60 = 0.01002. Price 0.01007 is just above that line. Only a little above. That means it is still holding, but it is very weak. If it goes below 0.01002, it will fall more.
At the bottom, you see big green and red bars together. That was the pump time. Now the bars are getting small. That means the pump is over, no energy left.
4. Past Performance
- Today: +3.70%
- 7 Days: +14.68%
- 30 Days: +7.58%
- 90 Days: +41.97%
- 180 Days: -22.04%
- 1 Year: -78.73%
Simple meaning: SXT is green in short-term, but in 1 Year it is -78.73% DOWN. That is a huge loss. If someone bought 1 year ago for 100 Rupees, now it is only 21 Rupees left.
So this coin is not strong in long-term. It only pumps for a short time, then dumps.
SXT is a Layer 1 / Layer 2 coin, but right now it is just a short pump. It already pumped and dumped. Buying now at 0.01007 is risky because the pump is already finished.
If you want to buy, wait for it to come down near 0.00986 - 0.00990, that was the old low. Don't chase the pump.
sxt
SXT / USDT
1. Current Price
- Price: 0.01007 USDT
- In Rupees: Rs 2.78
- Today: +8.63% UP
1 SXT = 2 Rupees 78 Paisa. Very cheap coin.
2. Last 24 Hours
- 24h High: 0.01047
- 24h Low: 0.00916
- 24h Volume: 2.59M USDT
Volume is low. Only 2.59 Million dollars. That means not many big traders are here.
3. What Does The Chart Show?
Look at the chart carefully. This is the most important part.
Price was flat near 0.0100, then suddenly it pumped up very fast like a mountain to 0.01046, and then it fell down just as fast back to 0.01007.
This is called a Pump and Dump. Someone bought a lot, price went up, then they sold and price came down.
The black line MA60 = 0.01002. Price 0.01007 is just above that line. Only a little above. That means it is still holding, but it is very weak. If it goes below 0.01002, it will fall more.
At the bottom, you see big green and red bars together. That was the pump time. Now the bars are getting small. That means the pump is over, no energy left.
4. Past Performance
- Today: +3.70%
- 7 Days: +14.68%
- 30 Days: +7.58%
- 90 Days: +41.97%
- 180 Days: -22.04%
- 1 Year: -78.73%
Simple meaning: SXT is green in short-term, but in 1 Year it is -78.73% DOWN. That is a huge loss. If someone bought 1 year ago for 100 Rupees, now it is only 21 Rupees left.
So this coin is not strong in long-term. It only pumps for a short time, then dumps.
SXT is a Layer 1 / Layer 2 coin, but right now it is just a short pump. It already pumped and dumped. Buying now at 0.01007 is risky because the pump is already finished.
If you want to buy, wait for it to come down near 0.00986 - 0.00990, that was the old low. Don't chase the pump.
1. Current Price
- Price: 0.01007 USDT
- In Rupees: Rs 2.78
- Today: +8.63% UP
1 SXT = 2 Rupees 78 Paisa. Very cheap coin.
2. Last 24 Hours
- 24h High: 0.01047
- 24h Low: 0.00916
- 24h Volume: 2.59M USDT
Volume is low. Only 2.59 Million dollars. That means not many big traders are here.
3. What Does The Chart Show?
Look at the chart carefully. This is the most important part.
Price was flat near 0.0100, then suddenly it pumped up very fast like a mountain to 0.01046, and then it fell down just as fast back to 0.01007.
This is called a Pump and Dump. Someone bought a lot, price went up, then they sold and price came down.
The black line MA60 = 0.01002. Price 0.01007 is just above that line. Only a little above. That means it is still holding, but it is very weak. If it goes below 0.01002, it will fall more.
At the bottom, you see big green and red bars together. That was the pump time. Now the bars are getting small. That means the pump is over, no energy left.
4. Past Performance
- Today: +3.70%
- 7 Days: +14.68%
- 30 Days: +7.58%
- 90 Days: +41.97%
- 180 Days: -22.04%
- 1 Year: -78.73%
Simple meaning: SXT is green in short-term, but in 1 Year it is -78.73% DOWN. That is a huge loss. If someone bought 1 year ago for 100 Rupees, now it is only 21 Rupees left.
So this coin is not strong in long-term. It only pumps for a short time, then dumps.
SXT is a Layer 1 / Layer 2 coin, but right now it is just a short pump. It already pumped and dumped. Buying now at 0.01007 is risky because the pump is already finished.
If you want to buy, wait for it to come down near 0.00986 - 0.00990, that was the old low. Don't chase the pump.
1
105
·
--
Übersetzung ansehen
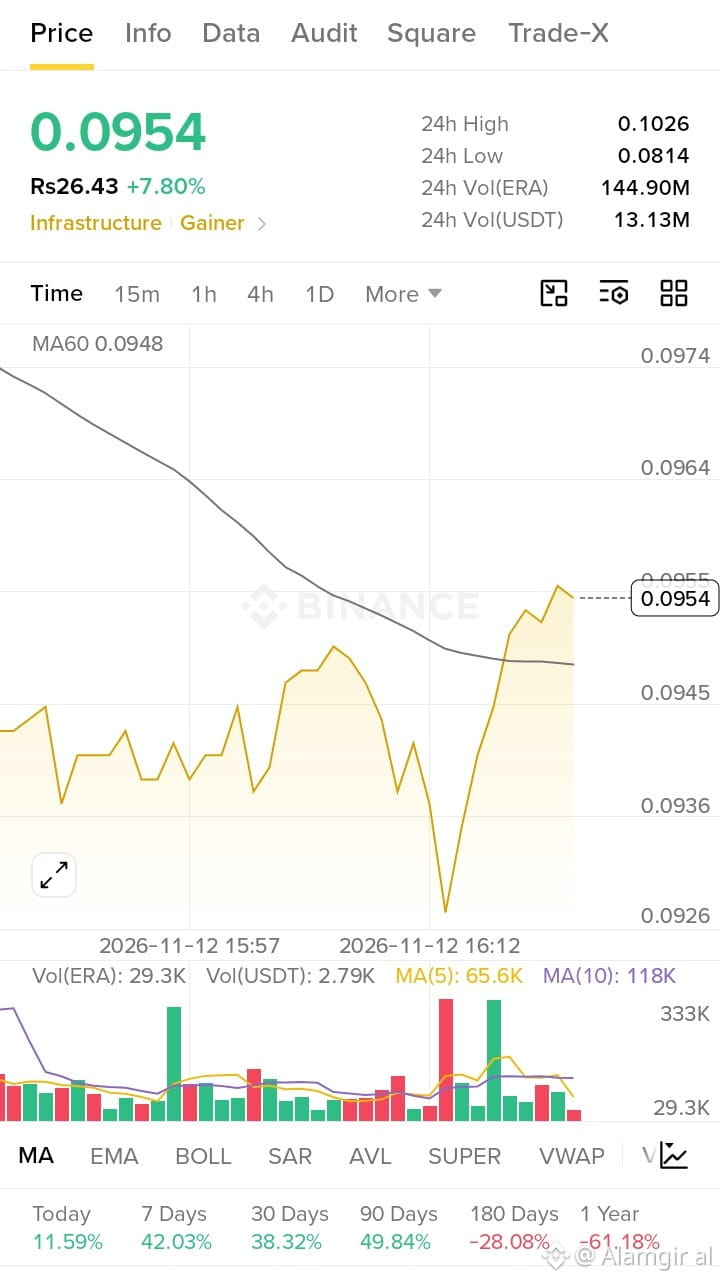
ERA / USDT
1. Current Price
Price: 0.0954 USDT
In Rupees: Rs 26.43
Today: +7.80% UP
1 ERA = 26 Rupees and 43 paisa.
2. Last 24 Hours
24h High: 0.1026
24h Low: 0.0814
24h Volume: 13.13M USDT
Volume is good. 13 Million dollars trading. Not too low like QNTB.
3. What Does The Chart Show
Look at the chart. This is a GOOD chart, different from ZEC and UNI.
First price was going up and down, then it fell down fast to 0.0926, then it pumped up very fast straight to 0.0954.
The black line MA60 = 0.0948. Price 0.0954 is ABOVE that line now. That means buyers are winning now. Price broke above the line. This is a good sign for short-term.
4. Past Performance
Today: +11.59%
7 Days: +42.03%
30 Days: +38.32%
90 Days: +49.84%
180 Days: -28.08
1 Year: -61.18%
Simple meaning: ERA is green in short-term, Today, 7 Days, 30 Days, 90 Days - all green. But in long-term 1 Year it is still -61% down. So people who bought 1 year ago are still in loss, but people who bought recently are in profit.
ERA is in a pump right now. It is strong today. But remember, it already went up 42% in 7 days. That is a lot. When a coin goes up too fast, it can also fall fast.
If you want to buy, don't buy at the top here at 0.0954. If it comes back down near 0.0948 or 0.0936, that is a better entry.
Did you buy ERA already? Or you are thinking to buy now because it is pumping?
ERA / USDT
1. Current Price
Price: 0.0954 USDT
In Rupees: Rs 26.43
Today: +7.80% UP
1 ERA = 26 Rupees and 43 paisa.
2. Last 24 Hours
24h High: 0.1026
24h Low: 0.0814
24h Volume: 13.13M USDT
Volume is good. 13 Million dollars trading. Not too low like QNTB.
3. What Does The Chart Show
Look at the chart. This is a GOOD chart, different from ZEC and UNI.
First price was going up and down, then it fell down fast to 0.0926, then it pumped up very fast straight to 0.0954.
The black line MA60 = 0.0948. Price 0.0954 is ABOVE that line now. That means buyers are winning now. Price broke above the line. This is a good sign for short-term.
4. Past Performance
Today: +11.59%
7 Days: +42.03%
30 Days: +38.32%
90 Days: +49.84%
180 Days: -28.08
1 Year: -61.18%
Simple meaning: ERA is green in short-term, Today, 7 Days, 30 Days, 90 Days - all green. But in long-term 1 Year it is still -61% down. So people who bought 1 year ago are still in loss, but people who bought recently are in profit.
ERA is in a pump right now. It is strong today. But remember, it already went up 42% in 7 days. That is a lot. When a coin goes up too fast, it can also fall fast.
If you want to buy, don't buy at the top here at 0.0954. If it comes back down near 0.0948 or 0.0936, that is a better entry.
Did you buy ERA already? Or you are thinking to buy now because it is pumping?
1. Current Price
Price: 0.0954 USDT
In Rupees: Rs 26.43
Today: +7.80% UP
1 ERA = 26 Rupees and 43 paisa.
2. Last 24 Hours
24h High: 0.1026
24h Low: 0.0814
24h Volume: 13.13M USDT
Volume is good. 13 Million dollars trading. Not too low like QNTB.
3. What Does The Chart Show
Look at the chart. This is a GOOD chart, different from ZEC and UNI.
First price was going up and down, then it fell down fast to 0.0926, then it pumped up very fast straight to 0.0954.
The black line MA60 = 0.0948. Price 0.0954 is ABOVE that line now. That means buyers are winning now. Price broke above the line. This is a good sign for short-term.
4. Past Performance
Today: +11.59%
7 Days: +42.03%
30 Days: +38.32%
90 Days: +49.84%
180 Days: -28.08
1 Year: -61.18%
Simple meaning: ERA is green in short-term, Today, 7 Days, 30 Days, 90 Days - all green. But in long-term 1 Year it is still -61% down. So people who bought 1 year ago are still in loss, but people who bought recently are in profit.
ERA is in a pump right now. It is strong today. But remember, it already went up 42% in 7 days. That is a lot. When a coin goes up too fast, it can also fall fast.
If you want to buy, don't buy at the top here at 0.0954. If it comes back down near 0.0948 or 0.0936, that is a better entry.
Did you buy ERA already? Or you are thinking to buy now because it is pumping?
1
114
·
--
Bärisch
Übersetzung ansehen
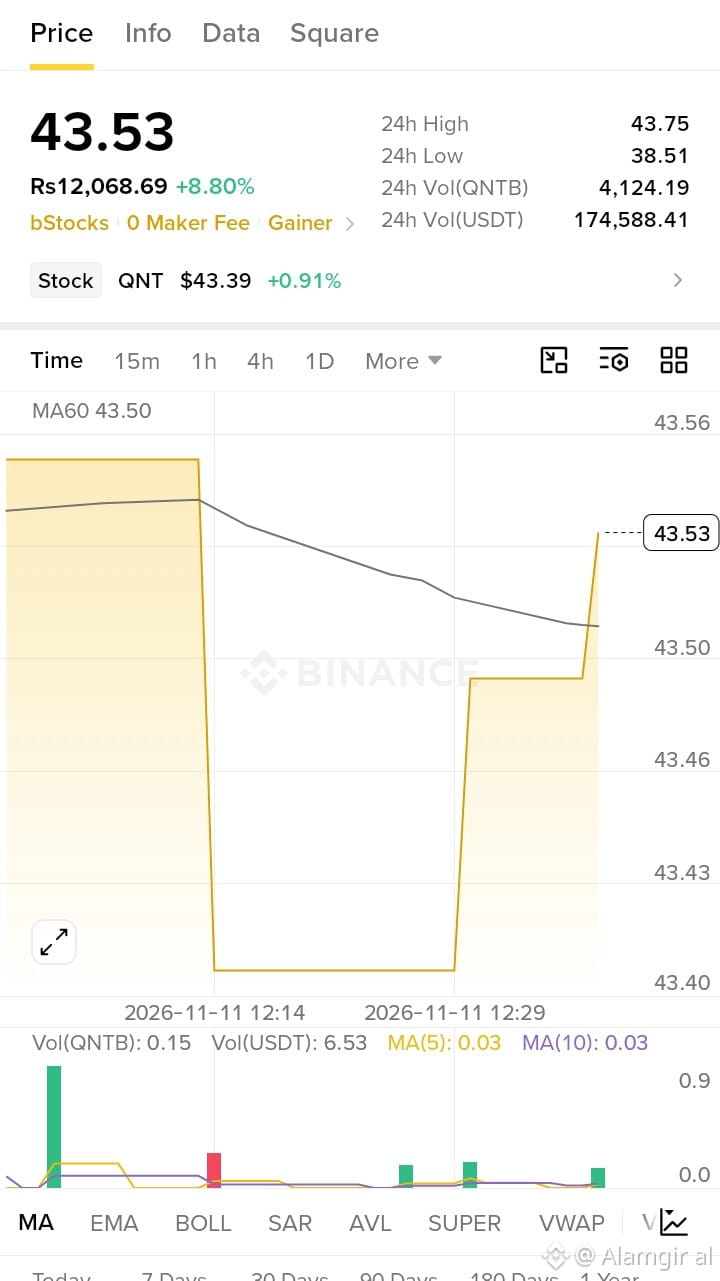
QNTB / USDT
This is different. This is NOT a normal crypto coin. This is a tokenized STOCK.
1. Current Price
Price: 43.53 USDT
In Rupees: Rs 12,068.69
Today: +8.80% UP
Real Stock price below: QNT $43.39 +0.91%
So the real stock is only up 0.91%, but this token is up 8.80%. That is strange.
2. Last 24 Hours
24h High: 43.75
24h Low: 38.51
24h Volume: 174,588 USDT ONLY
Volume is VERY small. Only 174K dollars. That means almost nobody is trading this.
3. What Does The Chart Show
Look at the chart, it is not a normal chart. It is like steps.
First it was flat at 43.55, then it fell straight down to 43.40, stayed flat there for a long time, then it jumped straight up to 43.53.
This happens when there is no buyer and no seller. Price just jumps. This is not a healthy chart.
The black line MA60 = 43.50 Price 43.53 is just *above* that line, but it means nothing here because volume is so low.
4. Past Performance
Today: +0.95%
7 Days: +34.77%30 Days: +5.32%
90 Days: -36.28%
180 Days:
1 Year:
This is a new token, so there is no old history.
Simple Meaning in English:
Don't trade this like BTC or UNI. This is a bStocks token. It follows a US stock, but on Binance very few people trade it, so price can jump up and down suddenly and you can get stuck.
If you buy here at 43.53, and tomorrow nobody wants to buy, you cannot sell it easily.
QNTB / USDT
This is different. This is NOT a normal crypto coin. This is a tokenized STOCK.
1. Current Price
Price: 43.53 USDT
In Rupees: Rs 12,068.69
Today: +8.80% UP
Real Stock price below: QNT $43.39 +0.91%
So the real stock is only up 0.91%, but this token is up 8.80%. That is strange.
2. Last 24 Hours
24h High: 43.75
24h Low: 38.51
24h Volume: 174,588 USDT ONLY
Volume is VERY small. Only 174K dollars. That means almost nobody is trading this.
3. What Does The Chart Show
Look at the chart, it is not a normal chart. It is like steps.
First it was flat at 43.55, then it fell straight down to 43.40, stayed flat there for a long time, then it jumped straight up to 43.53.
This happens when there is no buyer and no seller. Price just jumps. This is not a healthy chart.
The black line MA60 = 43.50 Price 43.53 is just *above* that line, but it means nothing here because volume is so low.
4. Past Performance
Today: +0.95%
7 Days: +34.77%30 Days: +5.32%
90 Days: -36.28%
180 Days:
1 Year:
This is a new token, so there is no old history.
Simple Meaning in English:
Don't trade this like BTC or UNI. This is a bStocks token. It follows a US stock, but on Binance very few people trade it, so price can jump up and down suddenly and you can get stuck.
If you buy here at 43.53, and tomorrow nobody wants to buy, you cannot sell it easily.
This is different. This is NOT a normal crypto coin. This is a tokenized STOCK.
1. Current Price
Price: 43.53 USDT
In Rupees: Rs 12,068.69
Today: +8.80% UP
Real Stock price below: QNT $43.39 +0.91%
So the real stock is only up 0.91%, but this token is up 8.80%. That is strange.
2. Last 24 Hours
24h High: 43.75
24h Low: 38.51
24h Volume: 174,588 USDT ONLY
Volume is VERY small. Only 174K dollars. That means almost nobody is trading this.
3. What Does The Chart Show
Look at the chart, it is not a normal chart. It is like steps.
First it was flat at 43.55, then it fell straight down to 43.40, stayed flat there for a long time, then it jumped straight up to 43.53.
This happens when there is no buyer and no seller. Price just jumps. This is not a healthy chart.
The black line MA60 = 43.50 Price 43.53 is just *above* that line, but it means nothing here because volume is so low.
4. Past Performance
Today: +0.95%
7 Days: +34.77%30 Days: +5.32%
90 Days: -36.28%
180 Days:
1 Year:
This is a new token, so there is no old history.
Simple Meaning in English:
Don't trade this like BTC or UNI. This is a bStocks token. It follows a US stock, but on Binance very few people trade it, so price can jump up and down suddenly and you can get stuck.
If you buy here at 43.53, and tomorrow nobody wants to buy, you cannot sell it easily.
2
90
·
--
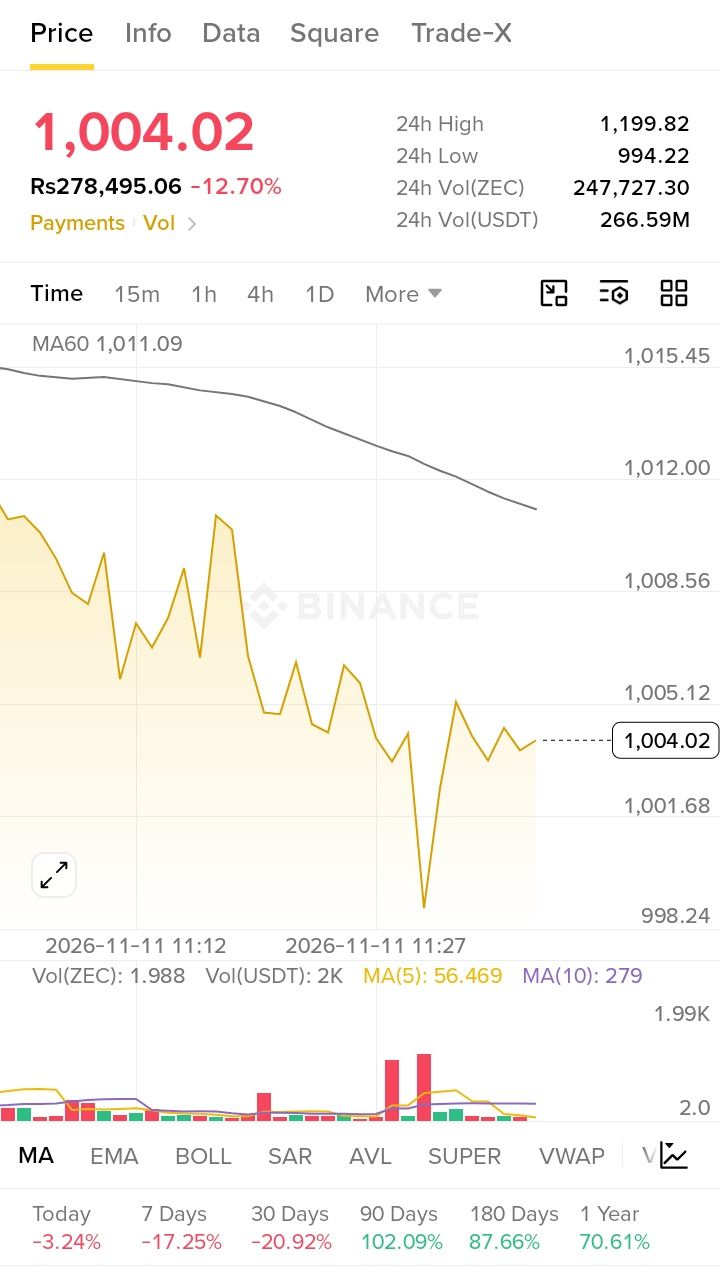
ZEC / USDT
1. Aktueller Preis
Preis: 1,004.02 USDT
In Rupien: RS 278,495.06
Heute: -12.70% ABWÄRTS
Heute ein starker Einbruch. 1 ZEC = fast 278.000 Rupien.
2. Letzte 24 Stunden
24-h-Hoch: 1,199.82
24-h-Tief: 994.22
24-h-Volumen: 266.59M USDT
Das ist ein sehr hohes Volumen. Das bedeutet, dass viele Menschen in Panik verkaufen.
Der Kurs lag bei 1,199 und liegt jetzt bei 1,004. Innerhalb eines Tages hat er fast 200 Dollar verloren.
3. Was zeigt der Chart?
Schau dir den Chart an. Von Anfang an ging der Kurs immer weiter nach unten.
Dann fiel er am Ende sehr schnell wie von einer Klippe auf 998 und erholte sich anschließend leicht auf 1,004.
Die schwarze Linie MA60 = 1,011.09. Der Kurs von 1,004 liegt unter dieser Linie. Das bedeutet, dass der kurzfristige Trend ABWÄRTS zeigt.
4. Vergangene Kursentwicklung
Heute: -3.24%
7 Tage: -17.25%
30 Tage: -20.92%
90 Tage: +102.09%
180 Tage: +87.66%
1 Jahr: +70.61%
Einfach gesagt: Kurzfristig fällt ZEC, aber langfristig liegt der Kurs immer noch deutlich im Plus. In 90 Tagen ist er um 102% gestiegen – das Geld hat sich also verdoppelt. Wer vor 3 Monaten gekauft hat, macht daher immer noch Gewinn, aber wer gestern gekauft hat, hat einen großen Verlust.
Einfach erklärt:
ZEC ist zuvor stark gestiegen und stürzt jetzt ab. Das nennt man eine Korrektur.
Versuche nicht, in ein fallendes Messer zu greifen. Wenn du kaufen möchtest, warte erst einmal ab. Lass den Kurs zuerst aufhören zu fallen.
ZEC / USDT
1. Aktueller Preis
Preis: 1,004.02 USDT
In Rupien: RS 278,495.06
Heute: -12.70% ABWÄRTS
Heute ein starker Einbruch. 1 ZEC = fast 278.000 Rupien.
2. Letzte 24 Stunden
24-h-Hoch: 1,199.82
24-h-Tief: 994.22
24-h-Volumen: 266.59M USDT
Das ist ein sehr hohes Volumen. Das bedeutet, dass viele Menschen in Panik verkaufen.
Der Kurs lag bei 1,199 und liegt jetzt bei 1,004. Innerhalb eines Tages hat er fast 200 Dollar verloren.
3. Was zeigt der Chart?
Schau dir den Chart an. Von Anfang an ging der Kurs immer weiter nach unten.
Dann fiel er am Ende sehr schnell wie von einer Klippe auf 998 und erholte sich anschließend leicht auf 1,004.
Die schwarze Linie MA60 = 1,011.09. Der Kurs von 1,004 liegt unter dieser Linie. Das bedeutet, dass der kurzfristige Trend ABWÄRTS zeigt.
4. Vergangene Kursentwicklung
Heute: -3.24%
7 Tage: -17.25%
30 Tage: -20.92%
90 Tage: +102.09%
180 Tage: +87.66%
1 Jahr: +70.61%
Einfach gesagt: Kurzfristig fällt ZEC, aber langfristig liegt der Kurs immer noch deutlich im Plus. In 90 Tagen ist er um 102% gestiegen – das Geld hat sich also verdoppelt. Wer vor 3 Monaten gekauft hat, macht daher immer noch Gewinn, aber wer gestern gekauft hat, hat einen großen Verlust.
Einfach erklärt:
ZEC ist zuvor stark gestiegen und stürzt jetzt ab. Das nennt man eine Korrektur.
Versuche nicht, in ein fallendes Messer zu greifen. Wenn du kaufen möchtest, warte erst einmal ab. Lass den Kurs zuerst aufhören zu fallen.
1. Aktueller Preis
Preis: 1,004.02 USDT
In Rupien: RS 278,495.06
Heute: -12.70% ABWÄRTS
Heute ein starker Einbruch. 1 ZEC = fast 278.000 Rupien.
2. Letzte 24 Stunden
24-h-Hoch: 1,199.82
24-h-Tief: 994.22
24-h-Volumen: 266.59M USDT
Das ist ein sehr hohes Volumen. Das bedeutet, dass viele Menschen in Panik verkaufen.
Der Kurs lag bei 1,199 und liegt jetzt bei 1,004. Innerhalb eines Tages hat er fast 200 Dollar verloren.
3. Was zeigt der Chart?
Schau dir den Chart an. Von Anfang an ging der Kurs immer weiter nach unten.
Dann fiel er am Ende sehr schnell wie von einer Klippe auf 998 und erholte sich anschließend leicht auf 1,004.
Die schwarze Linie MA60 = 1,011.09. Der Kurs von 1,004 liegt unter dieser Linie. Das bedeutet, dass der kurzfristige Trend ABWÄRTS zeigt.
4. Vergangene Kursentwicklung
Heute: -3.24%
7 Tage: -17.25%
30 Tage: -20.92%
90 Tage: +102.09%
180 Tage: +87.66%
1 Jahr: +70.61%
Einfach gesagt: Kurzfristig fällt ZEC, aber langfristig liegt der Kurs immer noch deutlich im Plus. In 90 Tagen ist er um 102% gestiegen – das Geld hat sich also verdoppelt. Wer vor 3 Monaten gekauft hat, macht daher immer noch Gewinn, aber wer gestern gekauft hat, hat einen großen Verlust.
Einfach erklärt:
ZEC ist zuvor stark gestiegen und stürzt jetzt ab. Das nennt man eine Korrektur.
Versuche nicht, in ein fallendes Messer zu greifen. Wenn du kaufen möchtest, warte erst einmal ab. Lass den Kurs zuerst aufhören zu fallen.
1
749
·
--
Übersetzung ansehen
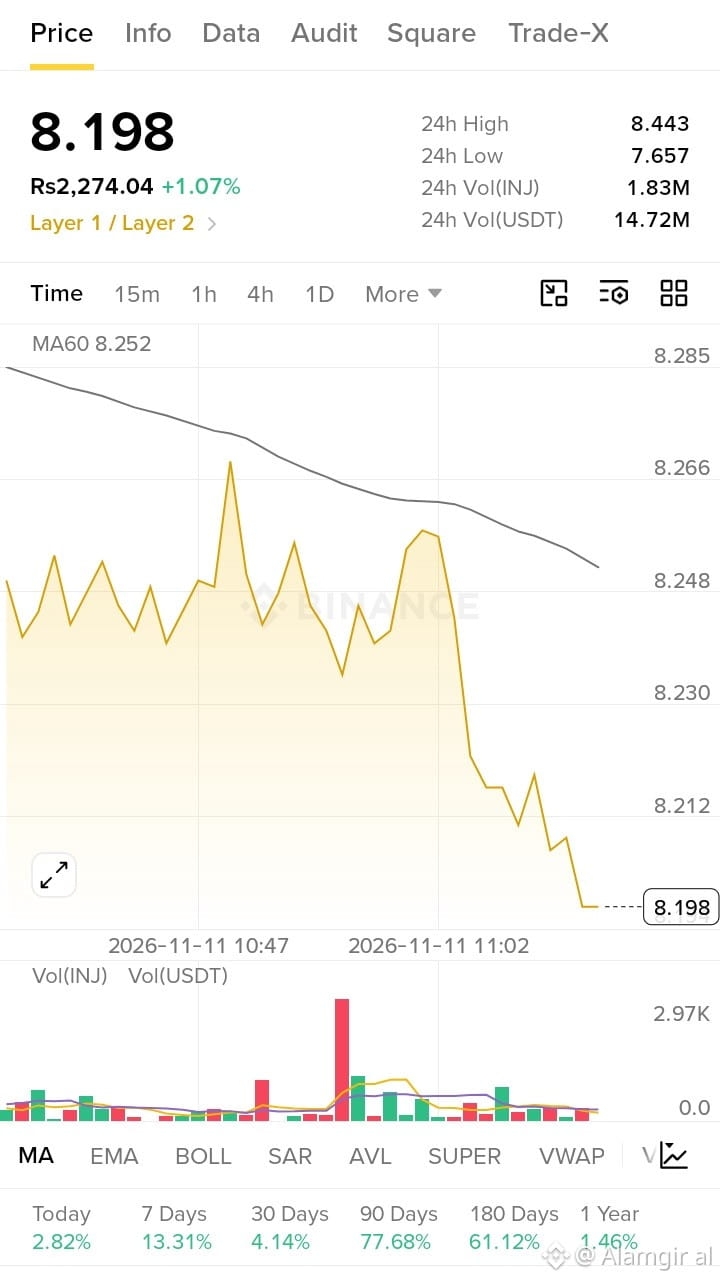
JCT / USDT
And now I understand your last message. Rs 0.00186408 is this coin's price in Rupees.
1. Current Price
Price: 0.00000654 USDT
In Rupees: Rs 0.00186408
Today: +20.70% UP
This is a very, very cheap coin. 1 JCT is less than 1 paisa.
2. Last 24 Hours
24h High: 0.00000737
24h Low: 0.00000490
24h Volume: 187.70K USDT
Volume is very small. Only 187K dollars. That means very few people are trading this coin. It is easy to pump and dump.
*3. What Does The Chart Show
In the chart, price pumped up high, then at the end it fell down fast.
The black line MA60 = 0.00000676. Price 0.00000654 is below that line now. That means the pump is over, sellers are back.
4. Past Performance
Today: *+15.81%
7 Days: *+62.16%
30 Days: -27.64%
90 Days: -34.36%
180 Days: -34.36%
1 Year: -34.36%
Simple meaning: It is up this week, but in 30 days, 90 days, 1 year it is DOWN -34%. So this is just a short pump.
5. Order Book
Green Buyers: 48.36%
Red Sellers: 51.64%
Now sellers are a little more than buyers. Not good.
Simple Meaning in English:
This is same like ONE coin. It pumped +20% today, now it is dumping. And it is a MEME coin with very low volume.
JCT / USDT
And now I understand your last message. Rs 0.00186408 is this coin's price in Rupees.
1. Current Price
Price: 0.00000654 USDT
In Rupees: Rs 0.00186408
Today: +20.70% UP
This is a very, very cheap coin. 1 JCT is less than 1 paisa.
2. Last 24 Hours
24h High: 0.00000737
24h Low: 0.00000490
24h Volume: 187.70K USDT
Volume is very small. Only 187K dollars. That means very few people are trading this coin. It is easy to pump and dump.
*3. What Does The Chart Show
In the chart, price pumped up high, then at the end it fell down fast.
The black line MA60 = 0.00000676. Price 0.00000654 is below that line now. That means the pump is over, sellers are back.
4. Past Performance
Today: *+15.81%
7 Days: *+62.16%
30 Days: -27.64%
90 Days: -34.36%
180 Days: -34.36%
1 Year: -34.36%
Simple meaning: It is up this week, but in 30 days, 90 days, 1 year it is DOWN -34%. So this is just a short pump.
5. Order Book
Green Buyers: 48.36%
Red Sellers: 51.64%
Now sellers are a little more than buyers. Not good.
Simple Meaning in English:
This is same like ONE coin. It pumped +20% today, now it is dumping. And it is a MEME coin with very low volume.
And now I understand your last message. Rs 0.00186408 is this coin's price in Rupees.
1. Current Price
Price: 0.00000654 USDT
In Rupees: Rs 0.00186408
Today: +20.70% UP
This is a very, very cheap coin. 1 JCT is less than 1 paisa.
2. Last 24 Hours
24h High: 0.00000737
24h Low: 0.00000490
24h Volume: 187.70K USDT
Volume is very small. Only 187K dollars. That means very few people are trading this coin. It is easy to pump and dump.
*3. What Does The Chart Show
In the chart, price pumped up high, then at the end it fell down fast.
The black line MA60 = 0.00000676. Price 0.00000654 is below that line now. That means the pump is over, sellers are back.
4. Past Performance
Today: *+15.81%
7 Days: *+62.16%
30 Days: -27.64%
90 Days: -34.36%
180 Days: -34.36%
1 Year: -34.36%
Simple meaning: It is up this week, but in 30 days, 90 days, 1 year it is DOWN -34%. So this is just a short pump.
5. Order Book
Green Buyers: 48.36%
Red Sellers: 51.64%
Now sellers are a little more than buyers. Not good.
Simple Meaning in English:
This is same like ONE coin. It pumped +20% today, now it is dumping. And it is a MEME coin with very low volume.
1
686
·
--
Übersetzung ansehen
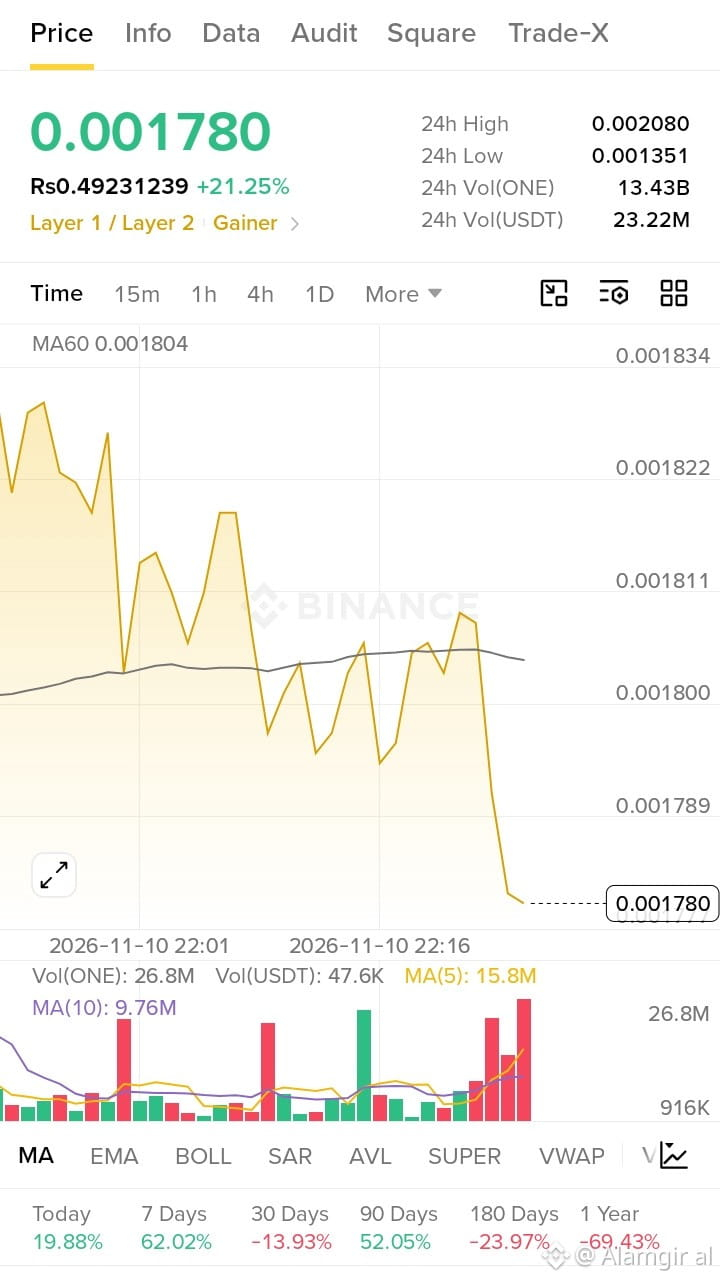
ONE / USDT
1. Current Price
Price: 0.001780 USDT
In Rupees: Rs 0.49
Today: +21.25% UP
It looks green, but look at the chart carefully.
2. Last 24 Hours
24h High: 0.002080
24h Low: 0.001351
24h Volume: 23.22M USDT
It means ONE was at 0.001351, it pumped up to 0.002080, and now it has fallen back to 0.001780.
3. What Does The Chart Show
In the chart, price was going up and down, then at the very end it fell down fast like a cliff.
The black line MA60 = 0.001804. Price 0.001780 is below that line now. That means the pump is finished for now, sellers are coming.
At the bottom, you see big RED bars. That means big selling volume at the end.
4. Past Performance
Today: +19.88%
7 Days: $AMZNB +62.02%
30 Days: 13.93%
90 Days: +52.05%
180 Days: -23.97%
1 Year: -69.43%
Simple meaning: ONE is up this week, but in 1 year it is still down -69%. Same like ADA. Old coin, big pump, big dump.
ONE is same story like INIT and JCT. It pumped today, now it is dumping. If you buy now, you are buying late.
If you already have ONE from low price, this is a good time to take profit. If you don't have it, don't chase it now.
Do you have ONE? Or you are thinking to buy because it is +21%
ONE / USDT
1. Current Price
Price: 0.001780 USDT
In Rupees: Rs 0.49
Today: +21.25% UP
It looks green, but look at the chart carefully.
2. Last 24 Hours
24h High: 0.002080
24h Low: 0.001351
24h Volume: 23.22M USDT
It means ONE was at 0.001351, it pumped up to 0.002080, and now it has fallen back to 0.001780.
3. What Does The Chart Show
In the chart, price was going up and down, then at the very end it fell down fast like a cliff.
The black line MA60 = 0.001804. Price 0.001780 is below that line now. That means the pump is finished for now, sellers are coming.
At the bottom, you see big RED bars. That means big selling volume at the end.
4. Past Performance
Today: +19.88%
7 Days: $AMZNB +62.02%
30 Days: 13.93%
90 Days: +52.05%
180 Days: -23.97%
1 Year: -69.43%
Simple meaning: ONE is up this week, but in 1 year it is still down -69%. Same like ADA. Old coin, big pump, big dump.
ONE is same story like INIT and JCT. It pumped today, now it is dumping. If you buy now, you are buying late.
If you already have ONE from low price, this is a good time to take profit. If you don't have it, don't chase it now.
Do you have ONE? Or you are thinking to buy because it is +21%
1. Current Price
Price: 0.001780 USDT
In Rupees: Rs 0.49
Today: +21.25% UP
It looks green, but look at the chart carefully.
2. Last 24 Hours
24h High: 0.002080
24h Low: 0.001351
24h Volume: 23.22M USDT
It means ONE was at 0.001351, it pumped up to 0.002080, and now it has fallen back to 0.001780.
3. What Does The Chart Show
In the chart, price was going up and down, then at the very end it fell down fast like a cliff.
The black line MA60 = 0.001804. Price 0.001780 is below that line now. That means the pump is finished for now, sellers are coming.
At the bottom, you see big RED bars. That means big selling volume at the end.
4. Past Performance
Today: +19.88%
7 Days: $AMZNB +62.02%
30 Days: 13.93%
90 Days: +52.05%
180 Days: -23.97%
1 Year: -69.43%
Simple meaning: ONE is up this week, but in 1 year it is still down -69%. Same like ADA. Old coin, big pump, big dump.
ONE is same story like INIT and JCT. It pumped today, now it is dumping. If you buy now, you are buying late.
If you already have ONE from low price, this is a good time to take profit. If you don't have it, don't chase it now.
Do you have ONE? Or you are thinking to buy because it is +21%
1
4
·
--
Übersetzung ansehen
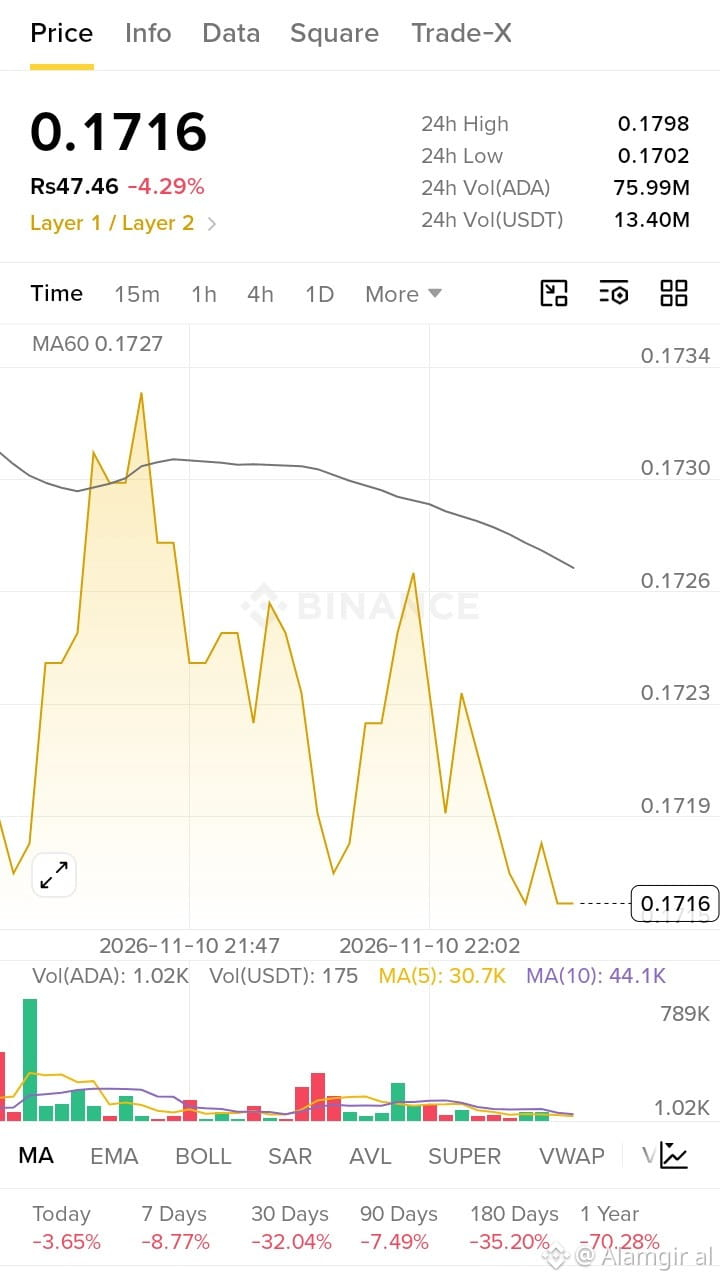
ADA / USDT
1. Current Price
Price: 0.1716 USDT
In Rupees: Rs 47.46
Today: 4.29% DOWN
ADA is falling today, more than BTC and PEPE.
2. Last 24 Hours
24h High: 0.1798
24h Low: 0.1702
24h Volume: 13.40M USDT
It means ADA was at 0.1798, now it is at 0.1716. It is very close to its low of the day. Buyers are weak.
3. What Does The Chart Show
Look at the chart. It went up and down many times, but now it is going down and down at the end.
The black line MA60 = 0.1727. Price 0.1716 is below that line. That means short-term trend is DOWN.
4. Past Performance All RED
Today: 3.65%
7 Days: 8.77%
30 Days: 32.04%
90 Days: 7.49%
180 Days: 35.20%
1 Year: 70.28%
This is very bad. In 1 year, ADA lost 70% of its value. If you bought ADA 1 year ago for 100 dollars, now it is only 30 dollars.
Out of all coins you sent today:
BNB = Strongest, almost flat
PEPE = Trying to go up
BTC = Down a little
XRP = Down fast
ADA = Down in every time frame, worst long-term
ADA is a good old project, Layer 1 coin, but right now it is in a long downtrend.
Do you have ADA in loss Or you want to buy ADA because it is cheap now at 0.1716.
ADA / USDT
1. Current Price
Price: 0.1716 USDT
In Rupees: Rs 47.46
Today: 4.29% DOWN
ADA is falling today, more than BTC and PEPE.
2. Last 24 Hours
24h High: 0.1798
24h Low: 0.1702
24h Volume: 13.40M USDT
It means ADA was at 0.1798, now it is at 0.1716. It is very close to its low of the day. Buyers are weak.
3. What Does The Chart Show
Look at the chart. It went up and down many times, but now it is going down and down at the end.
The black line MA60 = 0.1727. Price 0.1716 is below that line. That means short-term trend is DOWN.
4. Past Performance All RED
Today: 3.65%
7 Days: 8.77%
30 Days: 32.04%
90 Days: 7.49%
180 Days: 35.20%
1 Year: 70.28%
This is very bad. In 1 year, ADA lost 70% of its value. If you bought ADA 1 year ago for 100 dollars, now it is only 30 dollars.
Out of all coins you sent today:
BNB = Strongest, almost flat
PEPE = Trying to go up
BTC = Down a little
XRP = Down fast
ADA = Down in every time frame, worst long-term
ADA is a good old project, Layer 1 coin, but right now it is in a long downtrend.
Do you have ADA in loss Or you want to buy ADA because it is cheap now at 0.1716.
1. Current Price
Price: 0.1716 USDT
In Rupees: Rs 47.46
Today: 4.29% DOWN
ADA is falling today, more than BTC and PEPE.
2. Last 24 Hours
24h High: 0.1798
24h Low: 0.1702
24h Volume: 13.40M USDT
It means ADA was at 0.1798, now it is at 0.1716. It is very close to its low of the day. Buyers are weak.
3. What Does The Chart Show
Look at the chart. It went up and down many times, but now it is going down and down at the end.
The black line MA60 = 0.1727. Price 0.1716 is below that line. That means short-term trend is DOWN.
4. Past Performance All RED
Today: 3.65%
7 Days: 8.77%
30 Days: 32.04%
90 Days: 7.49%
180 Days: 35.20%
1 Year: 70.28%
This is very bad. In 1 year, ADA lost 70% of its value. If you bought ADA 1 year ago for 100 dollars, now it is only 30 dollars.
Out of all coins you sent today:
BNB = Strongest, almost flat
PEPE = Trying to go up
BTC = Down a little
XRP = Down fast
ADA = Down in every time frame, worst long-term
ADA is a good old project, Layer 1 coin, but right now it is in a long downtrend.
Do you have ADA in loss Or you want to buy ADA because it is cheap now at 0.1716.
1
88
·
--
PEPE / USDT
1. Aktueller Preis
Preis: 0.00000520 USDT
Heute: 1.14% im Minus
Typ: MEME-Coin – sein Kurs wird von Hypes bewegt, nicht von echtem Nutzen
Der Preis hat viele Nullen, deshalb kaufen ihn manche in Milliardenstückzahlen.
2. Letzte 24 Stunden
24h-Volumen: 91.70M USDT
Das bedeutet, dass heute viele Menschen mit PEPE handeln. Das Volumen ist hoch.
3. Was zeigt der Chart?
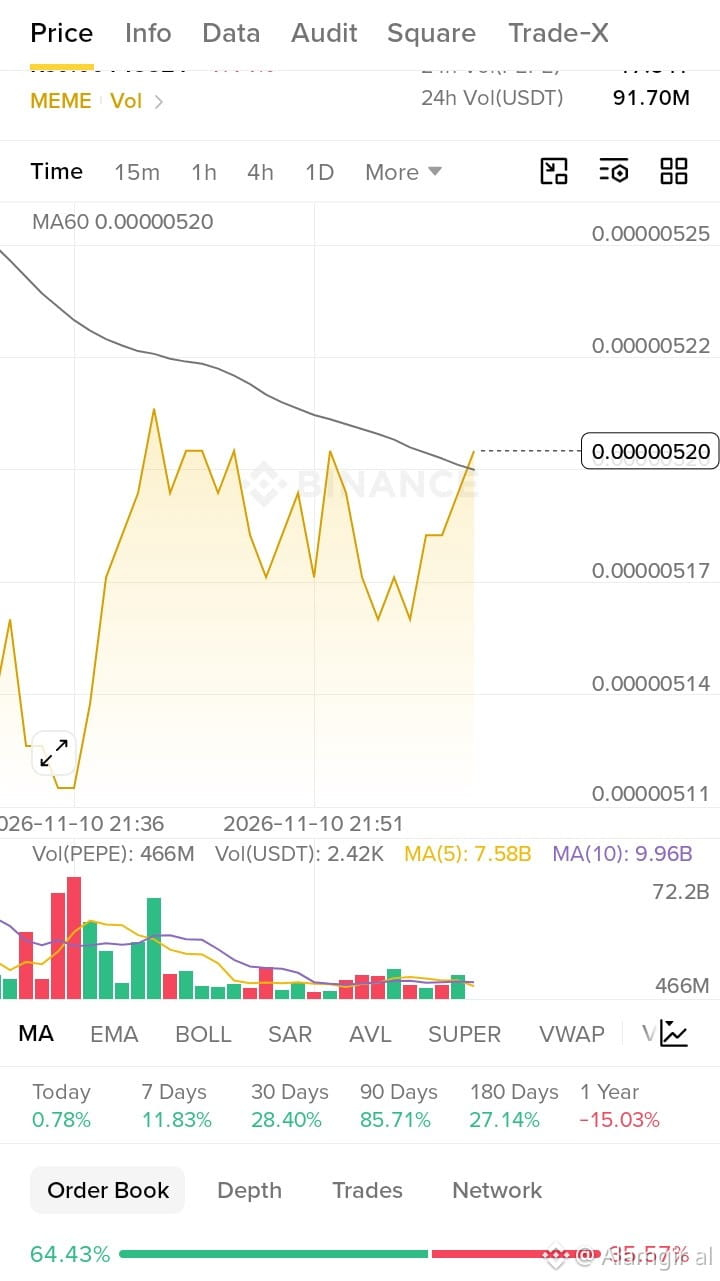
Im Chart ist PEPE gefallen, dann schnell wieder gestiegen und steht jetzt bei 0.00000520 ganz oben.
Die schwarze Linie MA60 = 0.00000520. Der Preis liegt genau AUF dieser Linie. Das bedeutet, dass PEPE an einem Entscheidungspunkt steht. Steigt der Kurs darüber, kann er weiter steigen. Fällt er darunter, kann er erneut sinken.
4. Vergangene Wertentwicklung
Heute: +0.78%
7 Tage: +11.83%
30 Tage: +28.40%
90 Tage: +85.71%
180 Tage: +27.14%
1 Jahr: 15.03%
Einfach ausgedrückt: In den letzten 3 Monaten ist PEPE um 85% gestiegen, aber im Vergleich zum Vorjahr liegt der Kurs immer noch 15% im Minus. Der Kurs erholt sich also, hat aber noch nicht seinen früheren Höchststand erreicht.
5. Das Orderbuch – sehr wichtig
Unten siehst du:
Grüne Käufer: 64.43%
Rote Verkäufer: 35.57%
Das bedeutet, dass im Moment mehr Menschen PEPE KAUFEN als VERKAUFEN möchten. Das ist ein gutes kurzfristiges Zeichen.
PEPE entwickelt sich heute besser als XRP. XRP fällt, während PEPE versucht zu steigen.
Aber denk daran: PEPE ist ein MEME-Coin. Der Kurs kann innerhalb einer Stunde um 20% steigen und in der nächsten Stunde um 20% fallen. Sehr schnell, sehr riskant.
Besitzt du PEPE oder möchtest du PEPE kaufen, weil es günstig ist?
PEPE / USDT
1. Aktueller Preis
Preis: 0.00000520 USDT
Heute: 1.14% im Minus
Typ: MEME-Coin – sein Kurs wird von Hypes bewegt, nicht von echtem Nutzen
Der Preis hat viele Nullen, deshalb kaufen ihn manche in Milliardenstückzahlen.
2. Letzte 24 Stunden
24h-Volumen: 91.70M USDT
Das bedeutet, dass heute viele Menschen mit PEPE handeln. Das Volumen ist hoch.
3. Was zeigt der Chart?
Im Chart ist PEPE gefallen, dann schnell wieder gestiegen und steht jetzt bei 0.00000520 ganz oben.
Die schwarze Linie MA60 = 0.00000520. Der Preis liegt genau AUF dieser Linie. Das bedeutet, dass PEPE an einem Entscheidungspunkt steht. Steigt der Kurs darüber, kann er weiter steigen. Fällt er darunter, kann er erneut sinken.
4. Vergangene Wertentwicklung
Heute: +0.78%
7 Tage: +11.83%
30 Tage: +28.40%
90 Tage: +85.71%
180 Tage: +27.14%
1 Jahr: 15.03%
Einfach ausgedrückt: In den letzten 3 Monaten ist PEPE um 85% gestiegen, aber im Vergleich zum Vorjahr liegt der Kurs immer noch 15% im Minus. Der Kurs erholt sich also, hat aber noch nicht seinen früheren Höchststand erreicht.
5. Das Orderbuch – sehr wichtig
Unten siehst du:
Grüne Käufer: 64.43%
Rote Verkäufer: 35.57%
Das bedeutet, dass im Moment mehr Menschen PEPE KAUFEN als VERKAUFEN möchten. Das ist ein gutes kurzfristiges Zeichen.
PEPE entwickelt sich heute besser als XRP. XRP fällt, während PEPE versucht zu steigen.
Aber denk daran: PEPE ist ein MEME-Coin. Der Kurs kann innerhalb einer Stunde um 20% steigen und in der nächsten Stunde um 20% fallen. Sehr schnell, sehr riskant.
Besitzt du PEPE oder möchtest du PEPE kaufen, weil es günstig ist?
1. Aktueller Preis
Preis: 0.00000520 USDT
Heute: 1.14% im Minus
Typ: MEME-Coin – sein Kurs wird von Hypes bewegt, nicht von echtem Nutzen
Der Preis hat viele Nullen, deshalb kaufen ihn manche in Milliardenstückzahlen.
2. Letzte 24 Stunden
24h-Volumen: 91.70M USDT
Das bedeutet, dass heute viele Menschen mit PEPE handeln. Das Volumen ist hoch.
3. Was zeigt der Chart?
Im Chart ist PEPE gefallen, dann schnell wieder gestiegen und steht jetzt bei 0.00000520 ganz oben.
Die schwarze Linie MA60 = 0.00000520. Der Preis liegt genau AUF dieser Linie. Das bedeutet, dass PEPE an einem Entscheidungspunkt steht. Steigt der Kurs darüber, kann er weiter steigen. Fällt er darunter, kann er erneut sinken.
4. Vergangene Wertentwicklung
Heute: +0.78%
7 Tage: +11.83%
30 Tage: +28.40%
90 Tage: +85.71%
180 Tage: +27.14%
1 Jahr: 15.03%
Einfach ausgedrückt: In den letzten 3 Monaten ist PEPE um 85% gestiegen, aber im Vergleich zum Vorjahr liegt der Kurs immer noch 15% im Minus. Der Kurs erholt sich also, hat aber noch nicht seinen früheren Höchststand erreicht.
5. Das Orderbuch – sehr wichtig
Unten siehst du:
Grüne Käufer: 64.43%
Rote Verkäufer: 35.57%
Das bedeutet, dass im Moment mehr Menschen PEPE KAUFEN als VERKAUFEN möchten. Das ist ein gutes kurzfristiges Zeichen.
PEPE entwickelt sich heute besser als XRP. XRP fällt, während PEPE versucht zu steigen.
Aber denk daran: PEPE ist ein MEME-Coin. Der Kurs kann innerhalb einer Stunde um 20% steigen und in der nächsten Stunde um 20% fallen. Sehr schnell, sehr riskant.
Besitzt du PEPE oder möchtest du PEPE kaufen, weil es günstig ist?
1
86
·
--
INIT / USDT
1. Aktueller Preis
Preis: 0.27100 USDT
In Rupien: Rs 74.95
Heute: +79.51% im Plus
Es sieht grün aus, aber sei vorsichtig. Der Chart erzählt eine andere Geschichte.
2. Letzte 24 Stunden
24h-Hoch: 0.33193
24h-Tief: 0.13625
24h-Volumen:
32.22M USDT
Das bedeutet, INIT lag morgens bei 0.136, schoss auf 0.331 hoch und ist jetzt wieder auf 0.271 gefallen.
3. Was zeigt der Chart?
Schau dir den Chart an. Zuerst ging es immer weiter nach oben bis zum Höchststand. Dann fiel der Kurs sehr schnell wie ein Berg hinunter.
Die schwarze Linie MA60 = 0.28228. Der Kurs von 0.271 liegt jetzt unter dieser Linie. Das bedeutet, der Pump ist vorerst vorbei und die Verkäufer nehmen Gewinne mit.
4. Vergangene Entwicklung
Heute: +81.21%
7 Tage: +96.97%
30 Tage: +129.55%
90 Tage: +400.13%
1 Jahr: +97.00%
Ja, der Kurs ist in 90 Tagen um 400% gestiegen. Das ist ein enormer Pump.
Einfach erklärt:
INIT hat bereits stark zugelegt. Jetzt verkaufen die Leute, die früh eingestiegen sind. Wenn du jetzt bei 0.271 kaufst, kaufst du nach dem Pump und nicht davor. Das ist riskant, genau wie zuvor bei JCT.
Hast du INIT bereits oder hast du +79% gesehen und möchtest jetzt kaufen?
INIT / USDT
1. Aktueller Preis
Preis: 0.27100 USDT
In Rupien: Rs 74.95
Heute: +79.51% im Plus
Es sieht grün aus, aber sei vorsichtig. Der Chart erzählt eine andere Geschichte.
2. Letzte 24 Stunden
24h-Hoch: 0.33193
24h-Tief: 0.13625
24h-Volumen:
32.22M USDT
Das bedeutet, INIT lag morgens bei 0.136, schoss auf 0.331 hoch und ist jetzt wieder auf 0.271 gefallen.
3. Was zeigt der Chart?
Schau dir den Chart an. Zuerst ging es immer weiter nach oben bis zum Höchststand. Dann fiel der Kurs sehr schnell wie ein Berg hinunter.
Die schwarze Linie MA60 = 0.28228. Der Kurs von 0.271 liegt jetzt unter dieser Linie. Das bedeutet, der Pump ist vorerst vorbei und die Verkäufer nehmen Gewinne mit.
4. Vergangene Entwicklung
Heute: +81.21%
7 Tage: +96.97%
30 Tage: +129.55%
90 Tage: +400.13%
1 Jahr: +97.00%
Ja, der Kurs ist in 90 Tagen um 400% gestiegen. Das ist ein enormer Pump.
Einfach erklärt:
INIT hat bereits stark zugelegt. Jetzt verkaufen die Leute, die früh eingestiegen sind. Wenn du jetzt bei 0.271 kaufst, kaufst du nach dem Pump und nicht davor. Das ist riskant, genau wie zuvor bei JCT.
Hast du INIT bereits oder hast du +79% gesehen und möchtest jetzt kaufen?
1. Aktueller Preis
Preis: 0.27100 USDT
In Rupien: Rs 74.95
Heute: +79.51% im Plus
Es sieht grün aus, aber sei vorsichtig. Der Chart erzählt eine andere Geschichte.
2. Letzte 24 Stunden
24h-Hoch: 0.33193
24h-Tief: 0.13625
24h-Volumen:
32.22M USDT
Das bedeutet, INIT lag morgens bei 0.136, schoss auf 0.331 hoch und ist jetzt wieder auf 0.271 gefallen.
3. Was zeigt der Chart?
Schau dir den Chart an. Zuerst ging es immer weiter nach oben bis zum Höchststand. Dann fiel der Kurs sehr schnell wie ein Berg hinunter.
Die schwarze Linie MA60 = 0.28228. Der Kurs von 0.271 liegt jetzt unter dieser Linie. Das bedeutet, der Pump ist vorerst vorbei und die Verkäufer nehmen Gewinne mit.
4. Vergangene Entwicklung
Heute: +81.21%
7 Tage: +96.97%
30 Tage: +129.55%
90 Tage: +400.13%
1 Jahr: +97.00%
Ja, der Kurs ist in 90 Tagen um 400% gestiegen. Das ist ein enormer Pump.
Einfach erklärt:
INIT hat bereits stark zugelegt. Jetzt verkaufen die Leute, die früh eingestiegen sind. Wenn du jetzt bei 0.271 kaufst, kaufst du nach dem Pump und nicht davor. Das ist riskant, genau wie zuvor bei JCT.
Hast du INIT bereits oder hast du +79% gesehen und möchtest jetzt kaufen?
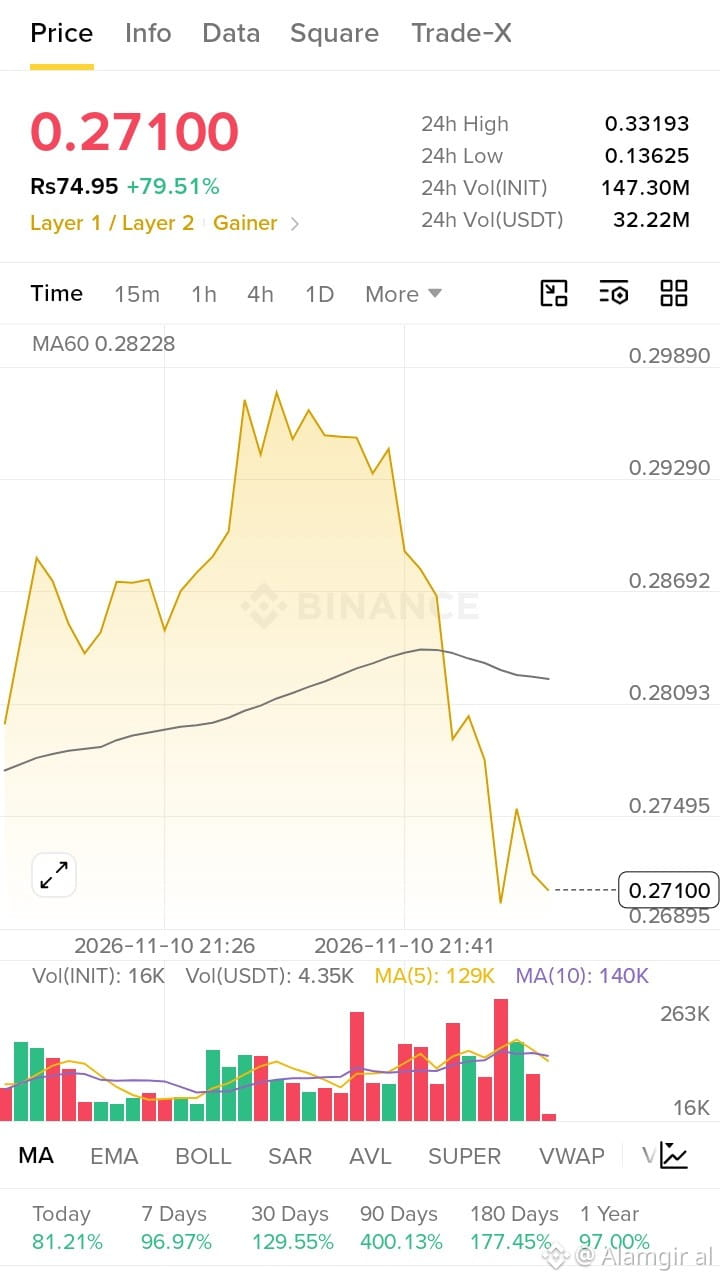
1
234
·
--
Übersetzung ansehen
NVDA
1. Current Price
Price: $169.845
Today: $8.82 / 4.93% DOWN
Market is OPEN
This is a big fall for one day.
2. Today Details
Open: $182.65
High: $182.70
Low: $167.68
Previous Close: $178.49
It means NVDA opened at 182, then fell down to 167, now it is at 169. It lost almost $13 from top to bottom today.
3. What Does The Chart Show?
In the morning, big red candles - price falling fast.
Then it touched the bottom at 167.68 and went up a little to 169.84.
The lines on top:
MA(7): 169.59
MA(25): 169.16
MA(99): 171.01
Price is below MA(99) = 171.01. That means short-term trend is weak.
4. Important Date
At the top it says: 2026-11-17 Earnings Release
That means on 17 November, NVIDIA will show its profit report. Many people are selling before earnings because they are scared.
Simple Meaning in English:
Today NVDA is falling more than BTC, XRP and BNB.
Crypto is also down, and US stocks are also down. The whole market is red today.
Do you have NVDA also? Or you just want to learn?
Tell me in English:
1 = I have NVDA in loss
2 = I want to buy NVDA
3 = Just learning
NVDA
1. Current Price
Price: $169.845
Today: $8.82 / 4.93% DOWN
Market is OPEN
This is a big fall for one day.
2. Today Details
Open: $182.65
High: $182.70
Low: $167.68
Previous Close: $178.49
It means NVDA opened at 182, then fell down to 167, now it is at 169. It lost almost $13 from top to bottom today.
3. What Does The Chart Show?
In the morning, big red candles - price falling fast.
Then it touched the bottom at 167.68 and went up a little to 169.84.
The lines on top:
MA(7): 169.59
MA(25): 169.16
MA(99): 171.01
Price is below MA(99) = 171.01. That means short-term trend is weak.
4. Important Date
At the top it says: 2026-11-17 Earnings Release
That means on 17 November, NVIDIA will show its profit report. Many people are selling before earnings because they are scared.
Simple Meaning in English:
Today NVDA is falling more than BTC, XRP and BNB.
Crypto is also down, and US stocks are also down. The whole market is red today.
Do you have NVDA also? Or you just want to learn?
Tell me in English:
1 = I have NVDA in loss
2 = I want to buy NVDA
3 = Just learning
1. Current Price
Price: $169.845
Today: $8.82 / 4.93% DOWN
Market is OPEN
This is a big fall for one day.
2. Today Details
Open: $182.65
High: $182.70
Low: $167.68
Previous Close: $178.49
It means NVDA opened at 182, then fell down to 167, now it is at 169. It lost almost $13 from top to bottom today.
3. What Does The Chart Show?
In the morning, big red candles - price falling fast.
Then it touched the bottom at 167.68 and went up a little to 169.84.
The lines on top:
MA(7): 169.59
MA(25): 169.16
MA(99): 171.01
Price is below MA(99) = 171.01. That means short-term trend is weak.
4. Important Date
At the top it says: 2026-11-17 Earnings Release
That means on 17 November, NVIDIA will show its profit report. Many people are selling before earnings because they are scared.
Simple Meaning in English:
Today NVDA is falling more than BTC, XRP and BNB.
Crypto is also down, and US stocks are also down. The whole market is red today.
Do you have NVDA also? Or you just want to learn?
Tell me in English:
1 = I have NVDA in loss
2 = I want to buy NVDA
3 = Just learning
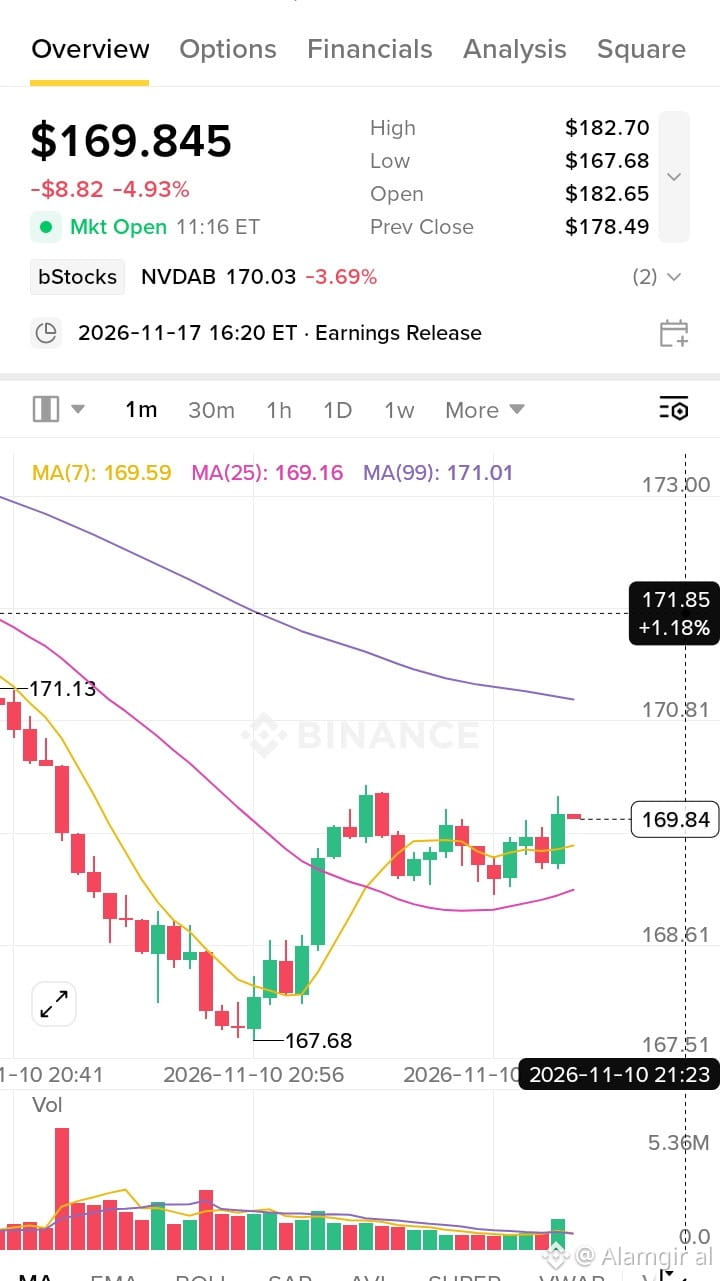
2
429
·
--
BTC USDT
Hier ist dein Vergleich aller 4 Coins:
Coin Preis Heute Entwicklung
BTC 74,073 -0.90% Fällt langsam
XRP 1.0601 -3.13% Fällt schnell
BNB 684.81 +0.06% Stabil, heute am stärksten
JCT 0.0126 +352% Kurs-Pump, sehr riskant
*In einer Zeile:
BNB ist heute am besten. XRP ist heute am schlechtesten. JCT ist eine Falle, jetzt nicht kaufen.
BTC USDT
Hier ist dein Vergleich aller 4 Coins:
Coin Preis Heute Entwicklung
BTC 74,073 -0.90% Fällt langsam
XRP 1.0601 -3.13% Fällt schnell
BNB 684.81 +0.06% Stabil, heute am stärksten
JCT 0.0126 +352% Kurs-Pump, sehr riskant
*In einer Zeile:
BNB ist heute am besten. XRP ist heute am schlechtesten. JCT ist eine Falle, jetzt nicht kaufen.
Hier ist dein Vergleich aller 4 Coins:
Coin Preis Heute Entwicklung
BTC 74,073 -0.90% Fällt langsam
XRP 1.0601 -3.13% Fällt schnell
BNB 684.81 +0.06% Stabil, heute am stärksten
JCT 0.0126 +352% Kurs-Pump, sehr riskant
*In einer Zeile:
BNB ist heute am besten. XRP ist heute am schlechtesten. JCT ist eine Falle, jetzt nicht kaufen.
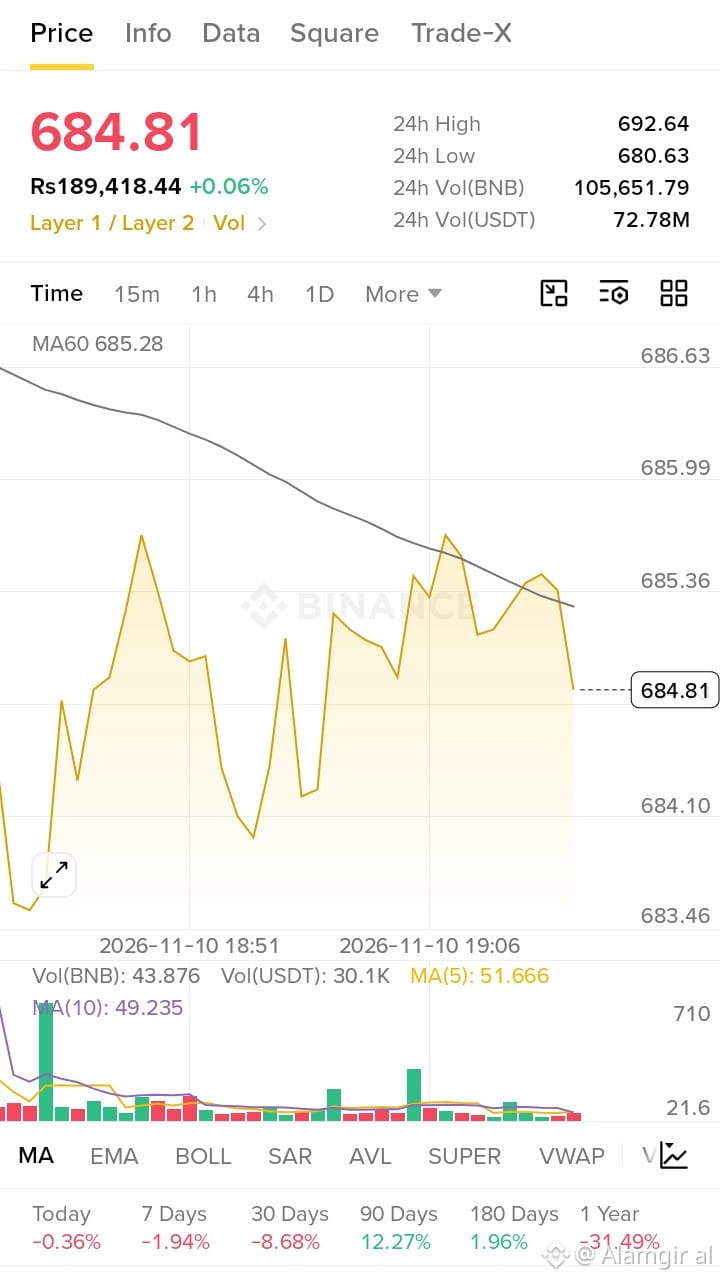
1
411
Anmelden und weiter Inhalte entdecken
Krypto-Nutzer weltweit auf Binance Square kennenlernen
⚡️ Bleib in Sachen Krypto stets am Puls.
💬 Die weltgrößte Kryptobörse vertraut darauf.
👍 Erhalte verlässliche Einblicke von verifizierten Creators.
E-Mail-Adresse/Telefonnummer
Trendthemen
NvidiaEarningsTonight:AIStocks’NextMove?
3,106 Aufrufe
103 Kommentare
Nvidias Bilanzvorlage: Erster Auftritt der Interims-CEO – Hält die KI-Story stand?
Binance News
·3 Likes
·2.1k Aufrufe
A Packed Week of Earnings and Data Tests Markets
92,286 Aufrufe
511 Kommentare
AnthropicIPOTestsInvestorAppetiteForAI
188,072 Aufrufe
1,945 Kommentare