
Abdullah Zulfiqar-93
157 Beiträge

Abdullah Zulfiqar-93
Melden
Nutzer blockieren
58 Following
31 Follower
51 Like gegeben
Beiträge
Alle
Zitierungen
Videos
Übersetzung ansehen
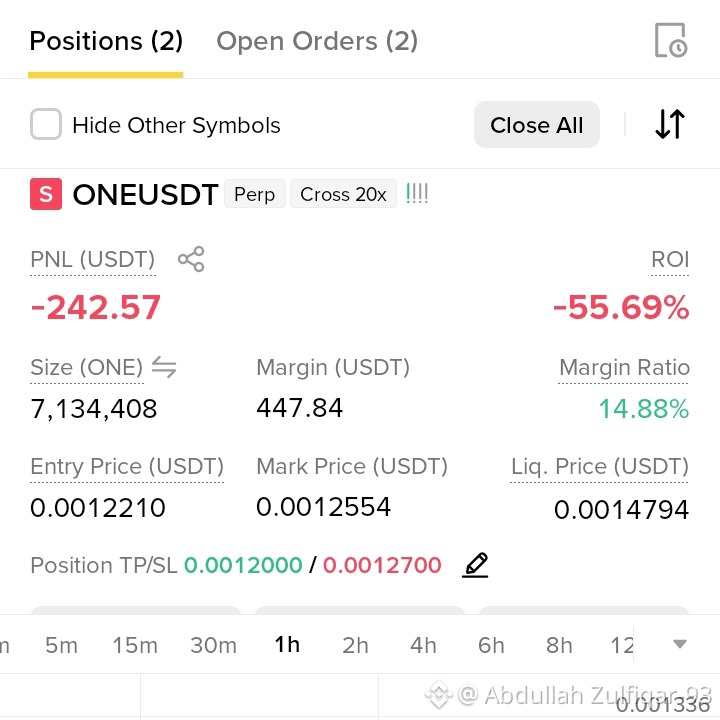
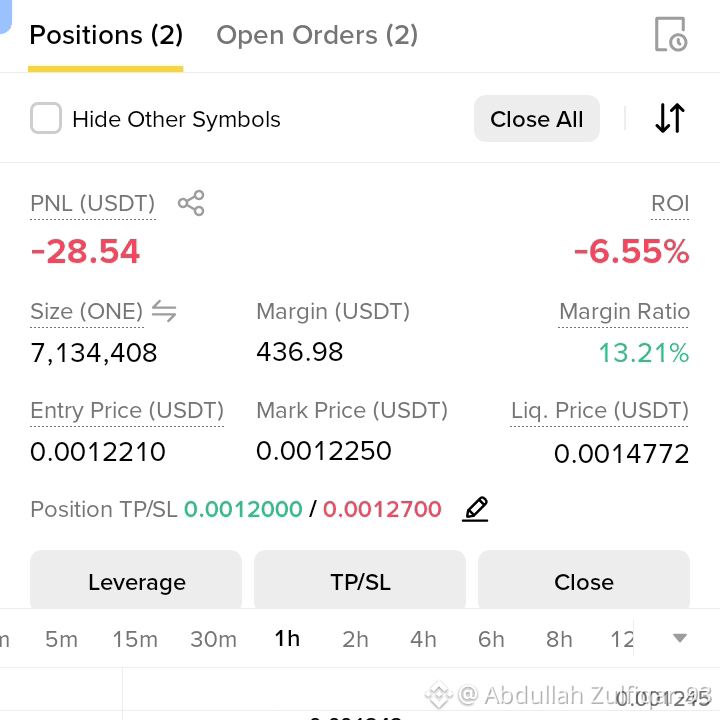
what I do now? 2 hour before or after
$SOL
{spot}(SOLUSDT)
$XRP
{spot}(XRPUSDT)
$BTC
{spot}(BTCUSDT)
#CanNvidia’sDataCenterGrowthContinue?
#AdvancedCryptoTrading 😭🥶
what I do now? 2 hour before or after
$SOL
$XRP
$BTC
#CanNvidia’sDataCenterGrowthContinue?
#AdvancedCryptoTrading 😭🥶
$SOL
$XRP
$BTC
#CanNvidia’sDataCenterGrowthContinue?
#AdvancedCryptoTrading 😭🥶
59
Übersetzung ansehen
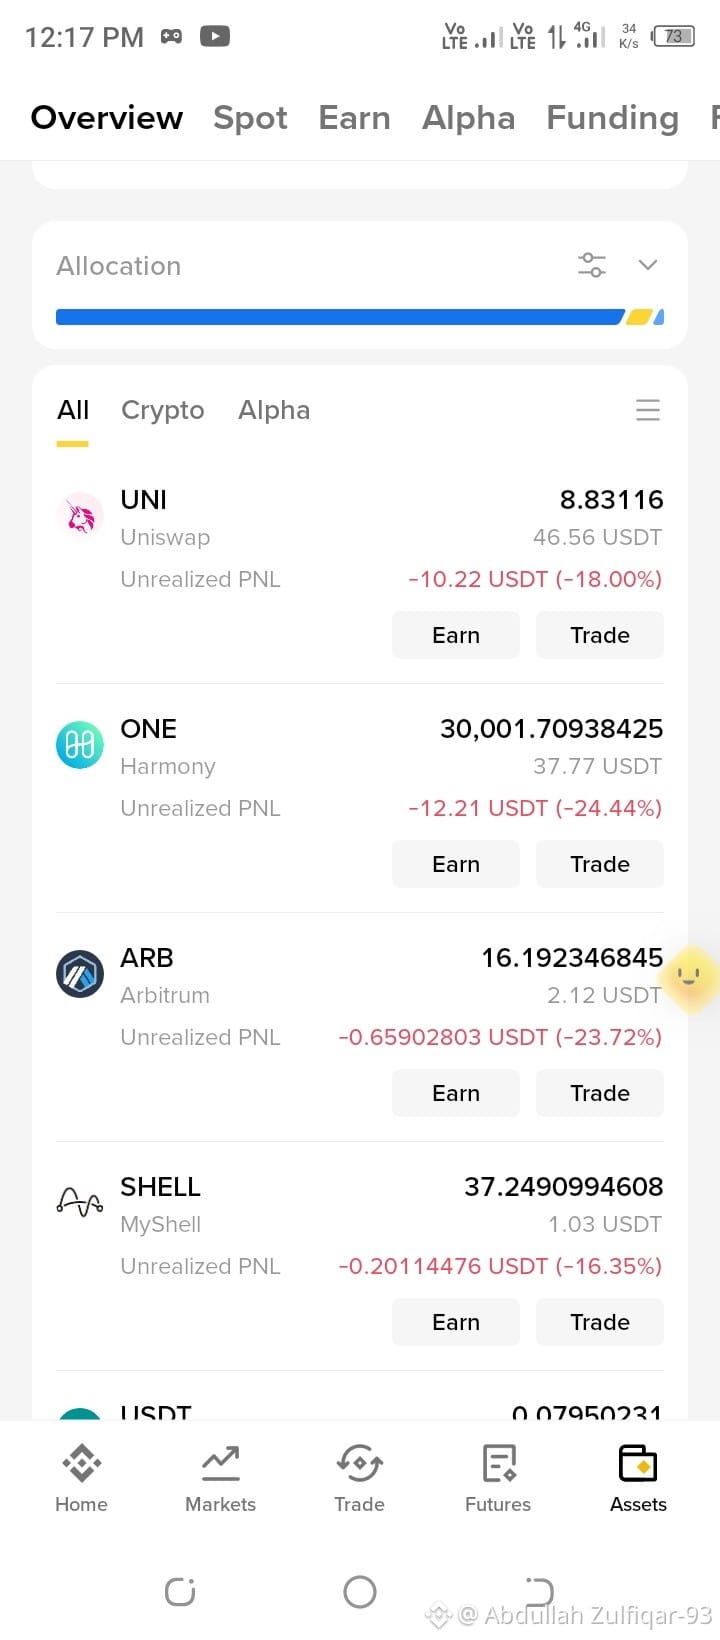
what I do right now?hold or sell
$ICP
{spot}(ICPUSDT)
$EVAA
{future}(EVAAUSDT)
$BTC
{spot}(BTCUSDT)
what I do right now?hold or sell
$ICP
$EVAA
$BTC
$ICP
$EVAA
$BTC
299
EILMELDUNG: 🇺🇸 DIE 5-BILLIONEN-DOLLAR-BANK OF AMERICA GAB GERADE BEKANNT, DASS SIE IHRE #BITCOIN-BESTÄNDE UM ÜBER 580 % AUF ÜBER 700.000.000 $ ERHÖHT HAT
DIE ZWEITGRÖSSTE BANK AMERIKAS SETZT VOLL AUF BTC
DAS INSTITUTIONELLE FOMO IST REAL 🔥
$BTC
{spot}(BTCUSDT)
$ETH
{spot}(ETHUSDT)
EILMELDUNG: 🇺🇸 DIE 5-BILLIONEN-DOLLAR-BANK OF AMERICA GAB GERADE BEKANNT, DASS SIE IHRE #BITCOIN-BESTÄNDE UM ÜBER 580 % AUF ÜBER 700.000.000 $ ERHÖHT HAT
DIE ZWEITGRÖSSTE BANK AMERIKAS SETZT VOLL AUF BTC
DAS INSTITUTIONELLE FOMO IST REAL 🔥
$BTC
$ETH
DIE ZWEITGRÖSSTE BANK AMERIKAS SETZT VOLL AUF BTC
DAS INSTITUTIONELLE FOMO IST REAL 🔥
$BTC
$ETH

53
Übersetzung ansehen
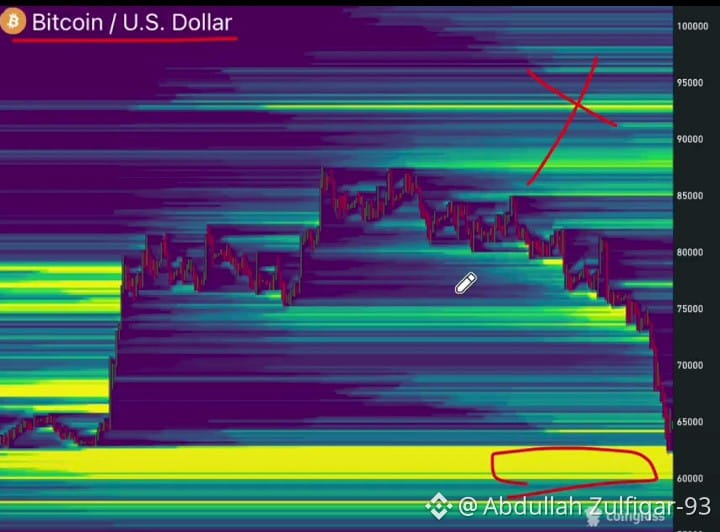
NOBODY IS TALKING ABOUT THIS
Check the $BTC liquidity map below current price.
It's basically empty down there.
What happens next is going to surprise a lot of people.
$BTC
{spot}(BTCUSDT)
$ETH
{spot}(ETHUSDT)
NOBODY IS TALKING ABOUT THIS
Check the $BTC liquidity map below current price.
It's basically empty down there.
What happens next is going to surprise a lot of people.
$BTC
$ETH
Check the $BTC liquidity map below current price.
It's basically empty down there.
What happens next is going to surprise a lot of people.
$BTC
$ETH
72
Übersetzung ansehen
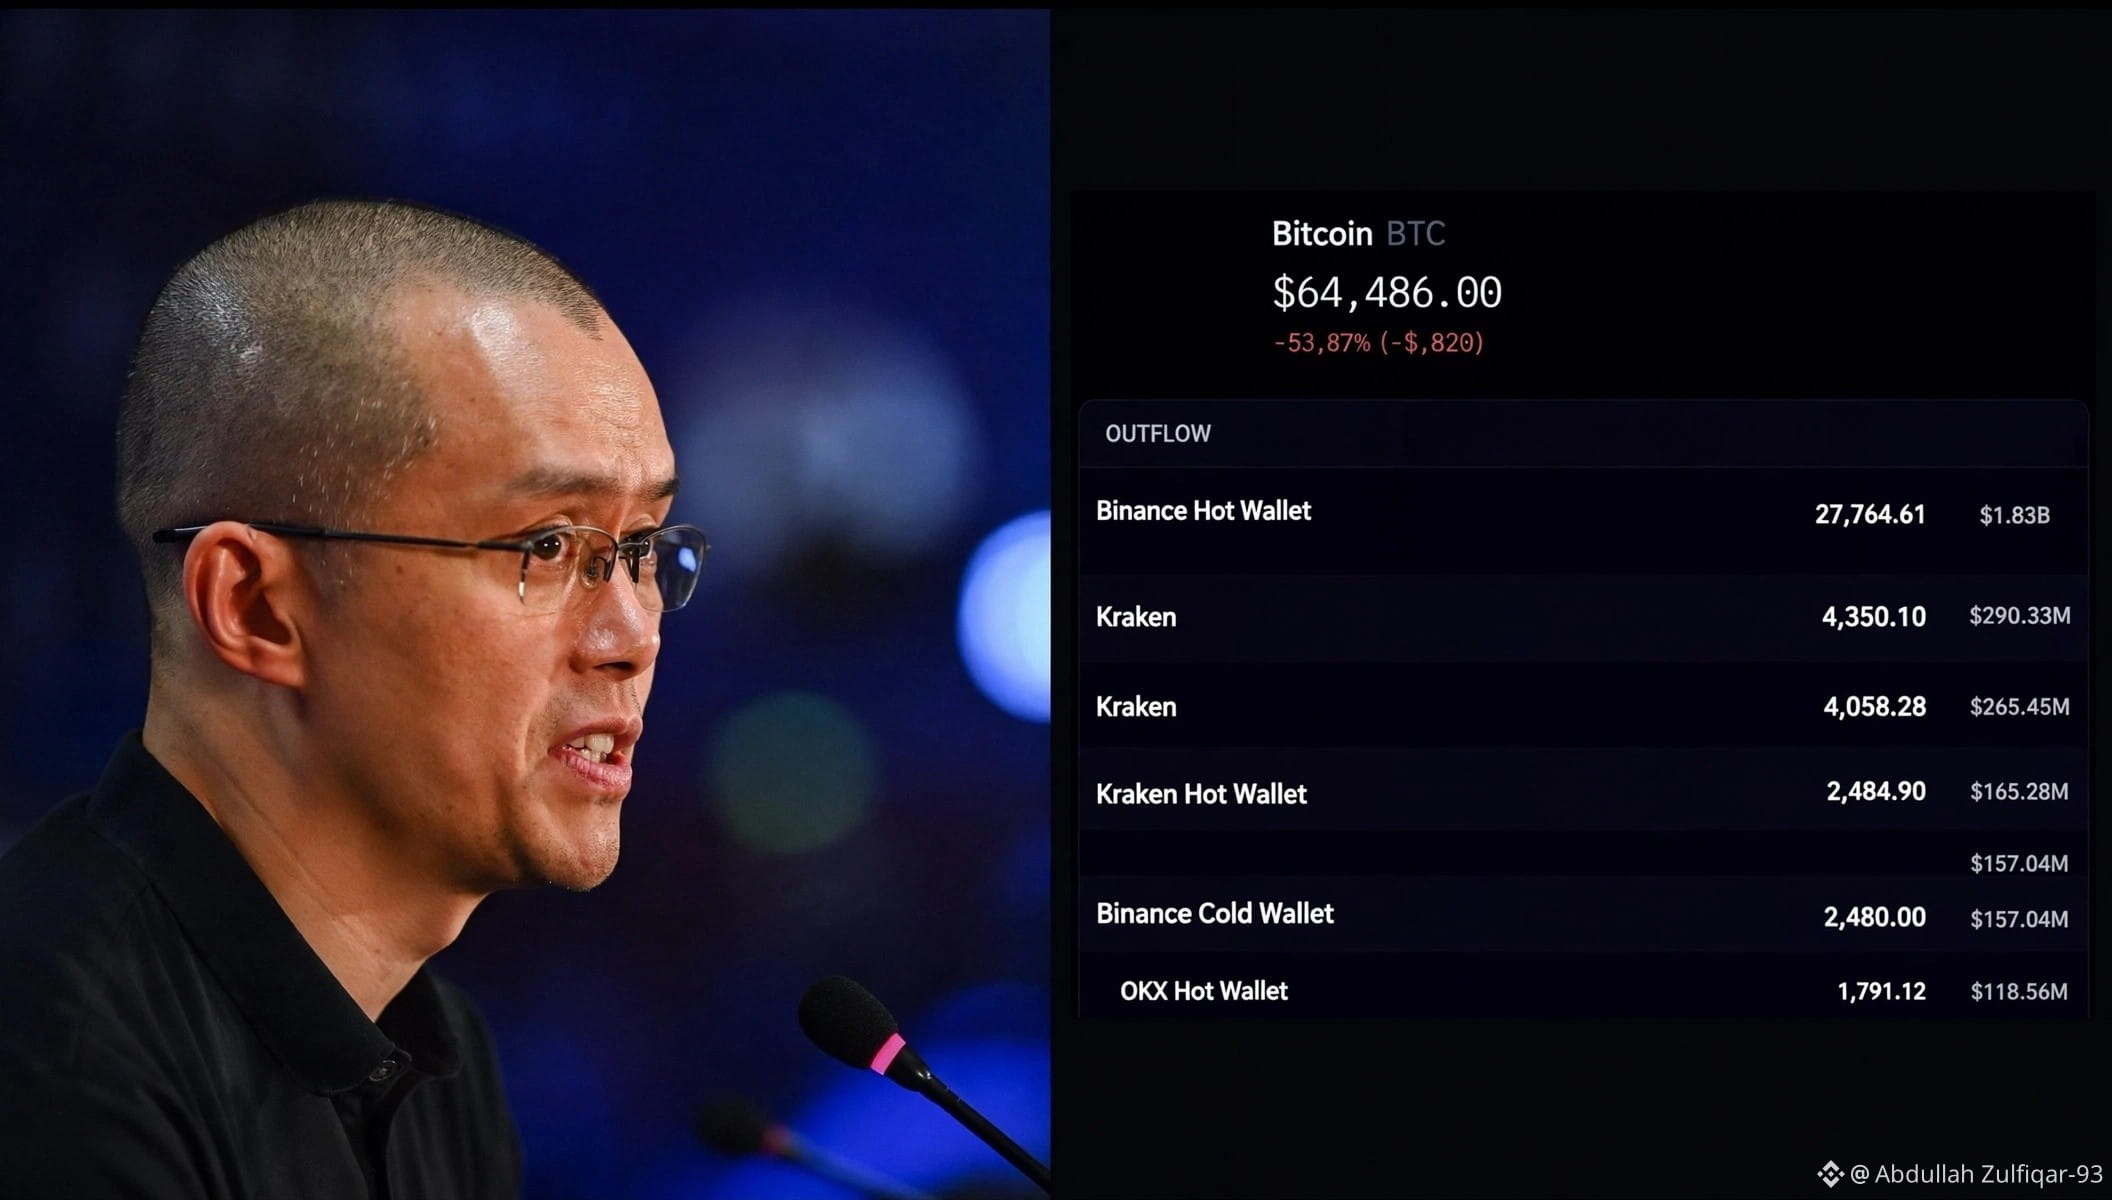
🚨 BREAKING: $1.77 BILLION WORTH OF BITCOIN HAS LEFT #BINANCE� IN JUST 24 HOURS.
AND INSOLVENCY SPECULATIONS ARE NOW EXPLODING!!!
27,764 BTC WERE WITHDRAWN FROM A SINGLE BINANCE HOT WALLET ALONE.
REMEMBER: JUST 17 DAYS AGO, BINANCE REPORTEDLY SUFFERED A $6.36 BILLION HACK AND VOWED TO REIMBURSE EVERY SINGLE DOLLAR.
BUT HERE’S THE QUESTION NOBODY IS ASKING:
WHERE IS THAT MONEY COMING FROM?
ARE THEY SELLING THEIR OWN BTC TO COVER THE LOSSES?
AND ARE YOUR LIQUIDATIONS FUNDING THE ENTIRE OPERATION?
@grok IS BINANCE DUMPING BITCOIN, OR ARE WE WITNESSING THE BEGINNING OF A BANK RUN?
$BTC
{spot}(BTCUSDT)
$BNB
{spot}(BNBUSDT)
🚨 BREAKING: $1.77 BILLION WORTH OF BITCOIN HAS LEFT #BINANCE� IN JUST 24 HOURS.
AND INSOLVENCY SPECULATIONS ARE NOW EXPLODING!!!
27,764 BTC WERE WITHDRAWN FROM A SINGLE BINANCE HOT WALLET ALONE.
REMEMBER: JUST 17 DAYS AGO, BINANCE REPORTEDLY SUFFERED A $6.36 BILLION HACK AND VOWED TO REIMBURSE EVERY SINGLE DOLLAR.
BUT HERE’S THE QUESTION NOBODY IS ASKING:
WHERE IS THAT MONEY COMING FROM?
ARE THEY SELLING THEIR OWN BTC TO COVER THE LOSSES?
AND ARE YOUR LIQUIDATIONS FUNDING THE ENTIRE OPERATION?
@grok IS BINANCE DUMPING BITCOIN, OR ARE WE WITNESSING THE BEGINNING OF A BANK RUN?
$BTC
$BNB
AND INSOLVENCY SPECULATIONS ARE NOW EXPLODING!!!
27,764 BTC WERE WITHDRAWN FROM A SINGLE BINANCE HOT WALLET ALONE.
REMEMBER: JUST 17 DAYS AGO, BINANCE REPORTEDLY SUFFERED A $6.36 BILLION HACK AND VOWED TO REIMBURSE EVERY SINGLE DOLLAR.
BUT HERE’S THE QUESTION NOBODY IS ASKING:
WHERE IS THAT MONEY COMING FROM?
ARE THEY SELLING THEIR OWN BTC TO COVER THE LOSSES?
AND ARE YOUR LIQUIDATIONS FUNDING THE ENTIRE OPERATION?
@grok IS BINANCE DUMPING BITCOIN, OR ARE WE WITNESSING THE BEGINNING OF A BANK RUN?
$BTC
$BNB
4
Übersetzung ansehen
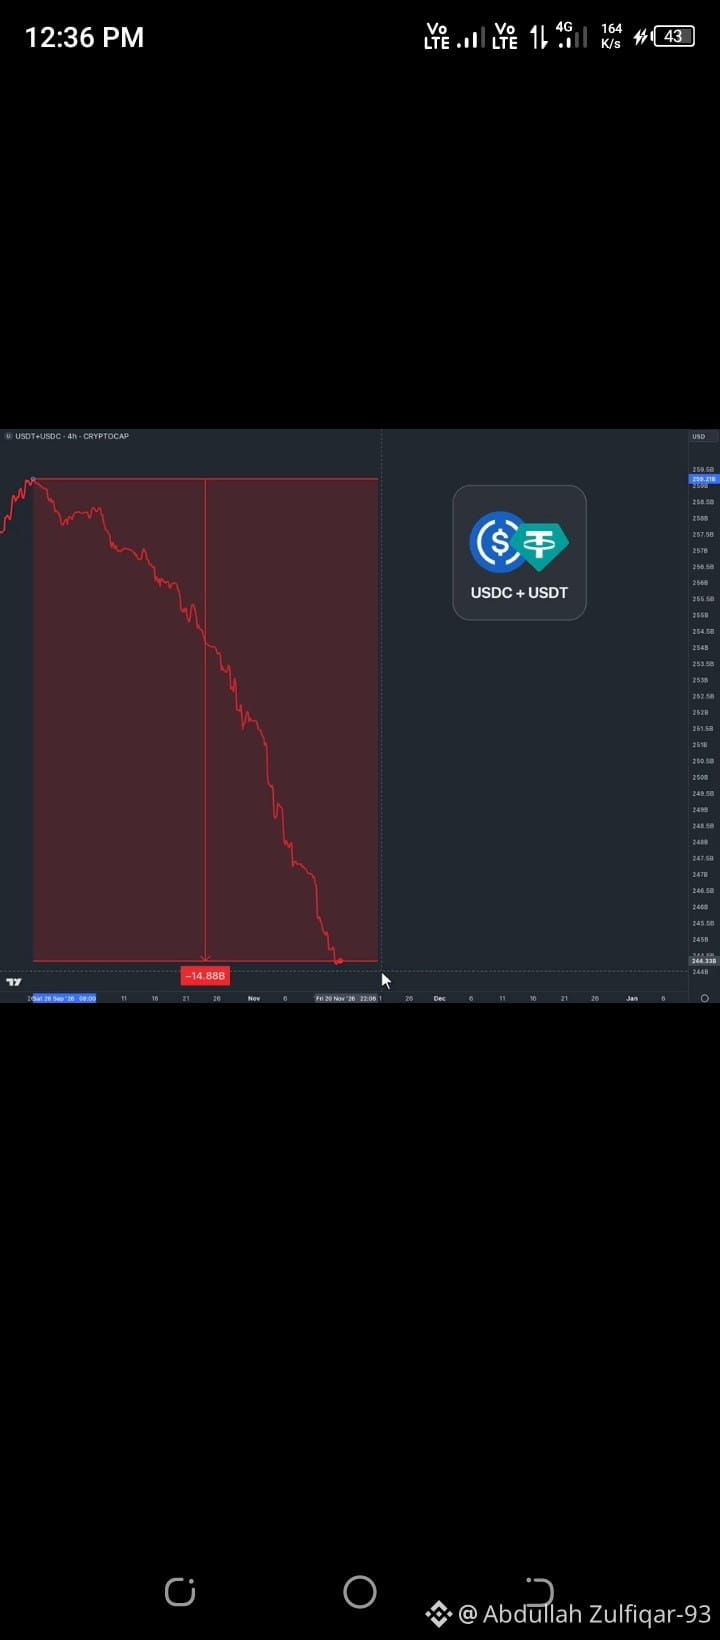
WARNING TO $BTC & CRYPTO HOLDERS!
🩸 The $USDT + $USDC mcap is CRASHING.
Liquidity is being drained, you already know what that means.
$ONE
{spot}(ONEUSDT)
$ETH
{spot}(ETHUSDT)
WARNING TO $BTC & CRYPTO HOLDERS!
🩸 The $USDT + $USDC mcap is CRASHING.
Liquidity is being drained, you already know what that means.
$ONE
$ETH
🩸 The $USDT + $USDC mcap is CRASHING.
Liquidity is being drained, you already know what that means.
$ONE
$ETH
126
Übersetzung ansehen
🚨JUST IN: CZ HAS WARNED EVERY IPHONE USER TO UPDATE THEIR PHONE IMMEDIATELY
A NEW ATTACK CALLED "DARKSWORD" IS DRAINING CRYPTO WALLETS
OVER $4 MILLION REPORTEDLY STOLEN ALREADY
IF YOU HOLD CRYPTO ON YOUR PHONE, DO THIS NOW!
$AAPLB
{spot}(AAPLBUSDT)
$SPCXB
{spot}(SPCXBUSDT)
$BTC
{spot}(BTCUSDT)
🚨JUST IN: CZ HAS WARNED EVERY IPHONE USER TO UPDATE THEIR PHONE IMMEDIATELY
A NEW ATTACK CALLED "DARKSWORD" IS DRAINING CRYPTO WALLETS
OVER $4 MILLION REPORTEDLY STOLEN ALREADY
IF YOU HOLD CRYPTO ON YOUR PHONE, DO THIS NOW!
$AAPLB
$SPCXB
$BTC
A NEW ATTACK CALLED "DARKSWORD" IS DRAINING CRYPTO WALLETS
OVER $4 MILLION REPORTEDLY STOLEN ALREADY
IF YOU HOLD CRYPTO ON YOUR PHONE, DO THIS NOW!
$AAPLB
$SPCXB
$BTC

160
Artikel
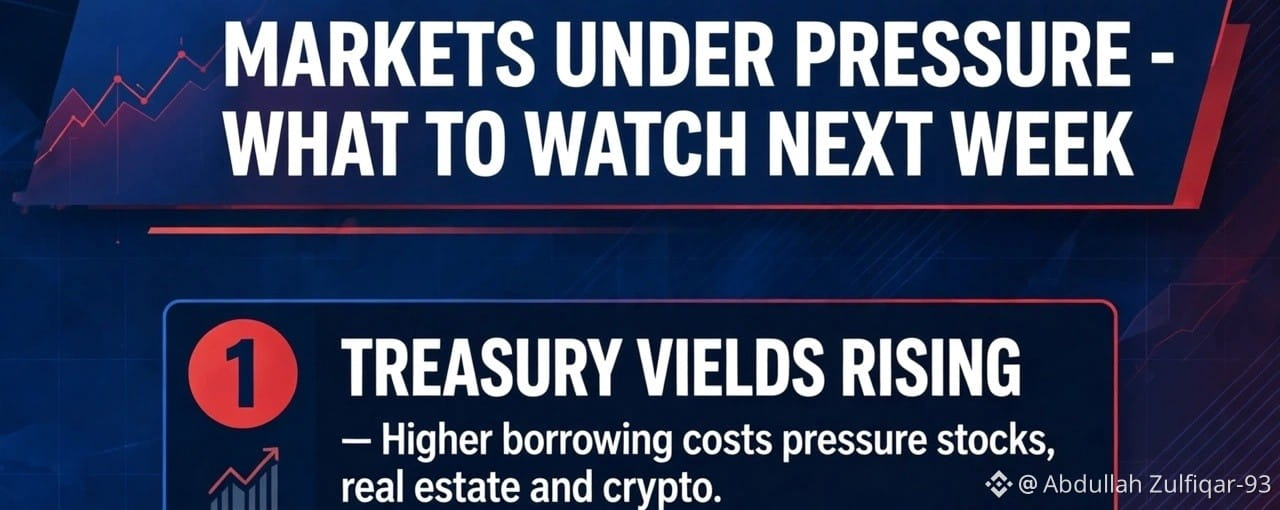
Markt unter DruckDer perfekte Sturm: Warum der 16. November eine historische Abrechnung an den globalen Märkten auslösen könnte
Während sich die globalen Finanzmärkte auf die Eröffnung am Montag, dem 16. November 2026, vorbereiten, halten sich die Schlagzeilen der Mainstream-Medien weiterhin an vertraute Erzählungen: das Abkühlen des Booms der künstlichen Intelligenz, den starken Rücksetzer bei Nvidia und die anhaltende Volatilität von Bitcoin. Unter der Oberfläche zeichnet sich jedoch still und leise ein weitaus gefährlicheres Zusammentreffen makroökonomischer, geopolitischer und staatlicher Schuldenprobleme ab.
Was sich hier entfaltet, ist längst keine isolierte Korrektur im Technologiesektor oder ein gewöhnlicher konjunktureller Abschwung mehr. Mehrere systemische Schocks treffen gleichzeitig aufeinander und setzen Aktien, Anleihen, Edelmetalle, Immobilien und Kryptowährungen enorm unter Druck.
Markt unter Druck
Der perfekte Sturm: Warum der 16. November eine historische Abrechnung an den globalen Märkten auslösen könnte
Während sich die globalen Finanzmärkte auf die Eröffnung am Montag, dem 16. November 2026, vorbereiten, halten sich die Schlagzeilen der Mainstream-Medien weiterhin an vertraute Erzählungen: das Abkühlen des Booms der künstlichen Intelligenz, den starken Rücksetzer bei Nvidia und die anhaltende Volatilität von Bitcoin. Unter der Oberfläche zeichnet sich jedoch still und leise ein weitaus gefährlicheres Zusammentreffen makroökonomischer, geopolitischer und staatlicher Schuldenprobleme ab.
Was sich hier entfaltet, ist längst keine isolierte Korrektur im Technologiesektor oder ein gewöhnlicher konjunktureller Abschwung mehr. Mehrere systemische Schocks treffen gleichzeitig aufeinander und setzen Aktien, Anleihen, Edelmetalle, Immobilien und Kryptowährungen enorm unter Druck.
Während sich die globalen Finanzmärkte auf die Eröffnung am Montag, dem 16. November 2026, vorbereiten, halten sich die Schlagzeilen der Mainstream-Medien weiterhin an vertraute Erzählungen: das Abkühlen des Booms der künstlichen Intelligenz, den starken Rücksetzer bei Nvidia und die anhaltende Volatilität von Bitcoin. Unter der Oberfläche zeichnet sich jedoch still und leise ein weitaus gefährlicheres Zusammentreffen makroökonomischer, geopolitischer und staatlicher Schuldenprobleme ab.
Was sich hier entfaltet, ist längst keine isolierte Korrektur im Technologiesektor oder ein gewöhnlicher konjunktureller Abschwung mehr. Mehrere systemische Schocks treffen gleichzeitig aufeinander und setzen Aktien, Anleihen, Edelmetalle, Immobilien und Kryptowährungen enorm unter Druck.
1
801
Eine Wallet-Freigabe überträgt Verfügungsbefugnis und ist kein routinemäßiger Klick. Prüfen Sie vor dem Signieren vier Dinge: den Spender, das Asset, den Umfang der Berechtigung und die Möglichkeit zum Widerruf. Selbstverwahrung bedeutet, zu kontrollieren, was bewegt werden kann – und nicht nur die Schlüssel zu besitzen.
$AKE
{future}(AKEUSDT)
$BTC
{spot}(BTCUSDT)
$SHELL
{spot}(SHELLUSDT)
Eine Wallet-Freigabe überträgt Verfügungsbefugnis und ist kein routinemäßiger Klick. Prüfen Sie vor dem Signieren vier Dinge: den Spender, das Asset, den Umfang der Berechtigung und die Möglichkeit zum Widerruf. Selbstverwahrung bedeutet, zu kontrollieren, was bewegt werden kann – und nicht nur die Schlüssel zu besitzen.
$AKE
$BTC
$SHELL
$AKE
$BTC
$SHELL

536
Übersetzung ansehen
MARKET UPDATE: $ALTCOINS
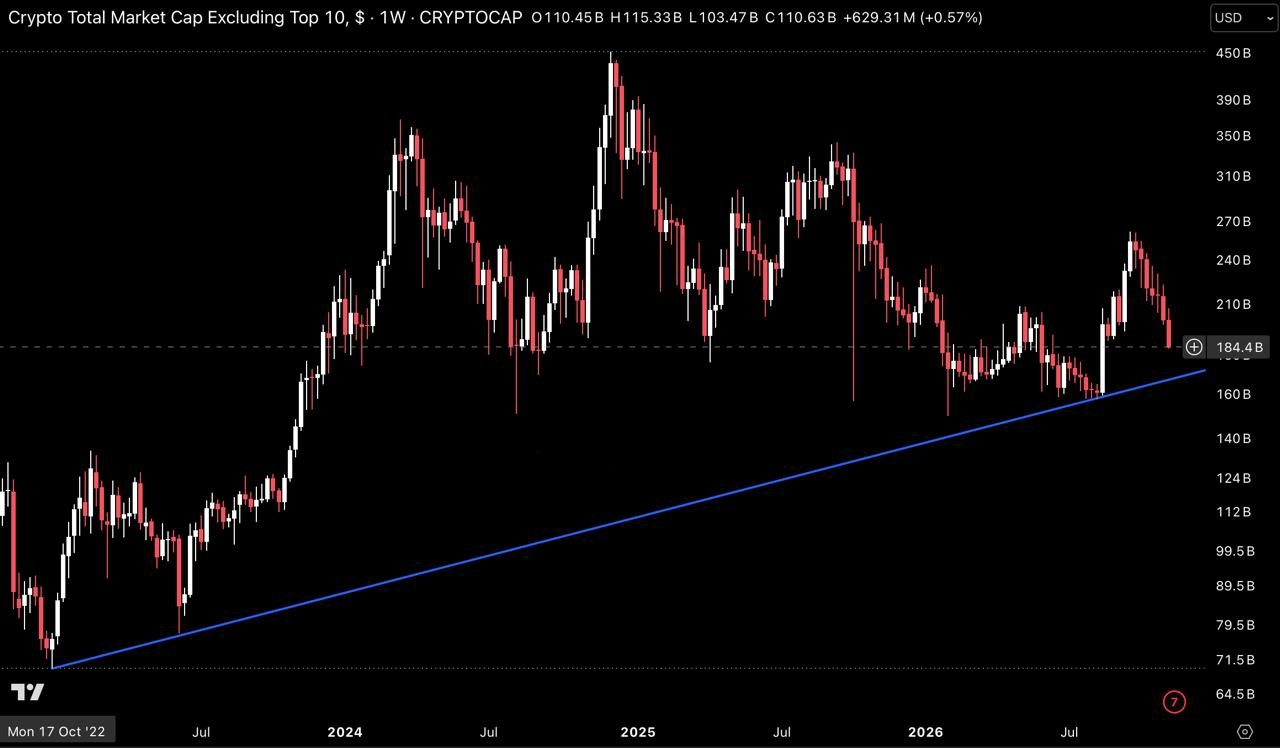
The altcoin market cap (excluding the top 10) is at 184.4B and on track to close its seventh red weekly candle in a row, now below the 50 week moving average near 192B that held in our last update, with the rising trendline from 2022 near 172B as the next major support.
Hold the trendline near 172B and the long term structure stays intact, with a weekly reclaim of 192B as the first sign of strength toward 210B. A weekly close below the trendline puts 160B to 140B in play.
$AKE
{future}(AKEUSDT)
$BTC
{spot}(BTCUSDT)
$KLAY
MARKET UPDATE: $ALTCOINS
The altcoin market cap (excluding the top 10) is at 184.4B and on track to close its seventh red weekly candle in a row, now below the 50 week moving average near 192B that held in our last update, with the rising trendline from 2022 near 172B as the next major support.
Hold the trendline near 172B and the long term structure stays intact, with a weekly reclaim of 192B as the first sign of strength toward 210B. A weekly close below the trendline puts 160B to 140B in play.
$AKE
$BTC
$KLAY
The altcoin market cap (excluding the top 10) is at 184.4B and on track to close its seventh red weekly candle in a row, now below the 50 week moving average near 192B that held in our last update, with the rising trendline from 2022 near 172B as the next major support.
Hold the trendline near 172B and the long term structure stays intact, with a weekly reclaim of 192B as the first sign of strength toward 210B. A weekly close below the trendline puts 160B to 140B in play.
$AKE
$BTC
$KLAY
155
Artikel
Übersetzung ansehen
HERE’S WHY BITCOIN IS NONSTOP DUMPING RIGHT NOW🚨 HERE’S WHY BITCOIN IS NONSTOP DUMPING RIGHT NOW
It's NOT because of the stock market AI bubble.
It's NOT because of the rising inflation.
It's NOT because of retail panic selling.
Bitcoin no longer trades like a supply-and-demand asset.
The crypto market has changed FOREVER.
And what we're seeing right now is not ordinary price action.
It’s not weak hands, changing sentiment, or retail panic.
Something much bigger is happening behind the scenes, and most people haven't even realized it yet.
By the time the crowd catches on, it'll already be too late.
This didn't happen overnight.
The structural shift has been developing for YEARS, and now we're seeing its consequences.
Here's what nobody wants to acknowledge:
The moment synthetic supply enters the equation, genuine scarcity loses its meaning.
And once scarcity stops determining price, the market no longer discovers value through actual ownership.
Price discovery moves into derivatives.
That's precisely what has happened to Bitcoin.
We've already witnessed this exact transformation in:
→ Gold
→ Silver
→ Oil
→ Equities
Once derivatives became dominant, the underlying market structure changed permanently.
Bitcoin is now facing the same reality.
The entire original investment thesis was based on 2 fundamental principles:
1. A fixed maximum supply of 21 million BTC.
2. No rehypothecation.
Both principles lost their effectiveness once Wall Street built an entire financial system around Bitcoin:
→ Cash-settled futures
→ Perpetual swaps
→ Options markets
→ ETFs
→ Prime broker lending
→ Wrapped BTC
→ Total return swaps
And from that moment onward, synthetic Bitcoin exposure became effectively UNLIMITED.
Not in actual blockchain supply.
But in the financial markets that determine the price.
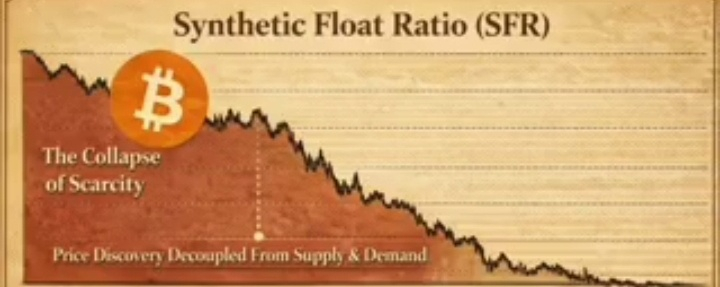
Synthetic Float Ratio (SFR).
This is the missing metric most people aren't aware of.
When synthetic exposure exceeds the available real supply, price stops following demand.
It becomes driven by positioning, hedging, and liquidation cascades.
Wall Street now has the ability to manufacture Bitcoin exposure and trade against the underlying asset.
Their playbook is really simple:
1. Manufacture unlimited paper BTC
2. Short aggressively into rallies
3. Trigger cascading liquidations
4. Cover positions at lower prices
5. Take profit and repeat
This isn't simple speculation.
It's financial inventory manufacturing.
A single real BTC can simultaneously support:
→ An ETF share
→ A futures position
→ A perpetual swap
→ An options delta
→ A broker loan
→ A structured note
ALL AT THE SAME TIME.
6 separate financial claims backed by one actual on-chain Bitcoin.
That's NOT the decentralized free market people believe they're participating in.
That's a new financial system operating under the Bitcoin name.
You can ignore this reality, but you cannot escape its consequences.
Quick reminder
I’ve successfully called every major Bitcoin top and bottom for the past 10+ years.
I publicly called the $17K BTC bottom in 2022 and the $126K top in 2025.
Then, I called the $57K local bottom in 2026.
Missed those calls?
Don't worry, you'll get another chance soon.
If you haven’t followed yet, now is the best time.
$BARD
$BTC
{spot}(BTCUSDT)
$AKE
{future}(AKEUSDT)
HERE’S WHY BITCOIN IS NONSTOP DUMPING RIGHT NOW
🚨 HERE’S WHY BITCOIN IS NONSTOP DUMPING RIGHT NOW
It's NOT because of the stock market AI bubble.
It's NOT because of the rising inflation.
It's NOT because of retail panic selling.
Bitcoin no longer trades like a supply-and-demand asset.
The crypto market has changed FOREVER.
And what we're seeing right now is not ordinary price action.
It’s not weak hands, changing sentiment, or retail panic.
Something much bigger is happening behind the scenes, and most people haven't even realized it yet.
By the time the crowd catches on, it'll already be too late.
This didn't happen overnight.
The structural shift has been developing for YEARS, and now we're seeing its consequences.
Here's what nobody wants to acknowledge:
The moment synthetic supply enters the equation, genuine scarcity loses its meaning.
And once scarcity stops determining price, the market no longer discovers value through actual ownership.
Price discovery moves into derivatives.
That's precisely what has happened to Bitcoin.
We've already witnessed this exact transformation in:
→ Gold
→ Silver
→ Oil
→ Equities
Once derivatives became dominant, the underlying market structure changed permanently.
Bitcoin is now facing the same reality.
The entire original investment thesis was based on 2 fundamental principles:
1. A fixed maximum supply of 21 million BTC.
2. No rehypothecation.
Both principles lost their effectiveness once Wall Street built an entire financial system around Bitcoin:
→ Cash-settled futures
→ Perpetual swaps
→ Options markets
→ ETFs
→ Prime broker lending
→ Wrapped BTC
→ Total return swaps
And from that moment onward, synthetic Bitcoin exposure became effectively UNLIMITED.
Not in actual blockchain supply.
But in the financial markets that determine the price.
Synthetic Float Ratio (SFR).
This is the missing metric most people aren't aware of.
When synthetic exposure exceeds the available real supply, price stops following demand.
It becomes driven by positioning, hedging, and liquidation cascades.
Wall Street now has the ability to manufacture Bitcoin exposure and trade against the underlying asset.
Their playbook is really simple:
1. Manufacture unlimited paper BTC
2. Short aggressively into rallies
3. Trigger cascading liquidations
4. Cover positions at lower prices
5. Take profit and repeat
This isn't simple speculation.
It's financial inventory manufacturing.
A single real BTC can simultaneously support:
→ An ETF share
→ A futures position
→ A perpetual swap
→ An options delta
→ A broker loan
→ A structured note
ALL AT THE SAME TIME.
6 separate financial claims backed by one actual on-chain Bitcoin.
That's NOT the decentralized free market people believe they're participating in.
That's a new financial system operating under the Bitcoin name.
You can ignore this reality, but you cannot escape its consequences.
Quick reminder
I’ve successfully called every major Bitcoin top and bottom for the past 10+ years.
I publicly called the $17K BTC bottom in 2022 and the $126K top in 2025.
Then, I called the $57K local bottom in 2026.
Missed those calls?
Don't worry, you'll get another chance soon.
If you haven’t followed yet, now is the best time.
$BARD
$BTC
$AKE
It's NOT because of the stock market AI bubble.
It's NOT because of the rising inflation.
It's NOT because of retail panic selling.
Bitcoin no longer trades like a supply-and-demand asset.
The crypto market has changed FOREVER.
And what we're seeing right now is not ordinary price action.
It’s not weak hands, changing sentiment, or retail panic.
Something much bigger is happening behind the scenes, and most people haven't even realized it yet.
By the time the crowd catches on, it'll already be too late.
This didn't happen overnight.
The structural shift has been developing for YEARS, and now we're seeing its consequences.
Here's what nobody wants to acknowledge:
The moment synthetic supply enters the equation, genuine scarcity loses its meaning.
And once scarcity stops determining price, the market no longer discovers value through actual ownership.
Price discovery moves into derivatives.
That's precisely what has happened to Bitcoin.
We've already witnessed this exact transformation in:
→ Gold
→ Silver
→ Oil
→ Equities
Once derivatives became dominant, the underlying market structure changed permanently.
Bitcoin is now facing the same reality.
The entire original investment thesis was based on 2 fundamental principles:
1. A fixed maximum supply of 21 million BTC.
2. No rehypothecation.
Both principles lost their effectiveness once Wall Street built an entire financial system around Bitcoin:
→ Cash-settled futures
→ Perpetual swaps
→ Options markets
→ ETFs
→ Prime broker lending
→ Wrapped BTC
→ Total return swaps
And from that moment onward, synthetic Bitcoin exposure became effectively UNLIMITED.
Not in actual blockchain supply.
But in the financial markets that determine the price.
Synthetic Float Ratio (SFR).
This is the missing metric most people aren't aware of.
When synthetic exposure exceeds the available real supply, price stops following demand.
It becomes driven by positioning, hedging, and liquidation cascades.
Wall Street now has the ability to manufacture Bitcoin exposure and trade against the underlying asset.
Their playbook is really simple:
1. Manufacture unlimited paper BTC
2. Short aggressively into rallies
3. Trigger cascading liquidations
4. Cover positions at lower prices
5. Take profit and repeat
This isn't simple speculation.
It's financial inventory manufacturing.
A single real BTC can simultaneously support:
→ An ETF share
→ A futures position
→ A perpetual swap
→ An options delta
→ A broker loan
→ A structured note
ALL AT THE SAME TIME.
6 separate financial claims backed by one actual on-chain Bitcoin.
That's NOT the decentralized free market people believe they're participating in.
That's a new financial system operating under the Bitcoin name.
You can ignore this reality, but you cannot escape its consequences.
Quick reminder
I’ve successfully called every major Bitcoin top and bottom for the past 10+ years.
I publicly called the $17K BTC bottom in 2022 and the $126K top in 2025.
Then, I called the $57K local bottom in 2026.
Missed those calls?
Don't worry, you'll get another chance soon.
If you haven’t followed yet, now is the best time.
$BARD
$BTC
$AKE
33
·
--
Bullisch
🚨 Krypto-Marktupdate: Breiter Ausverkauf & Liquidationen erschüttern den Markt
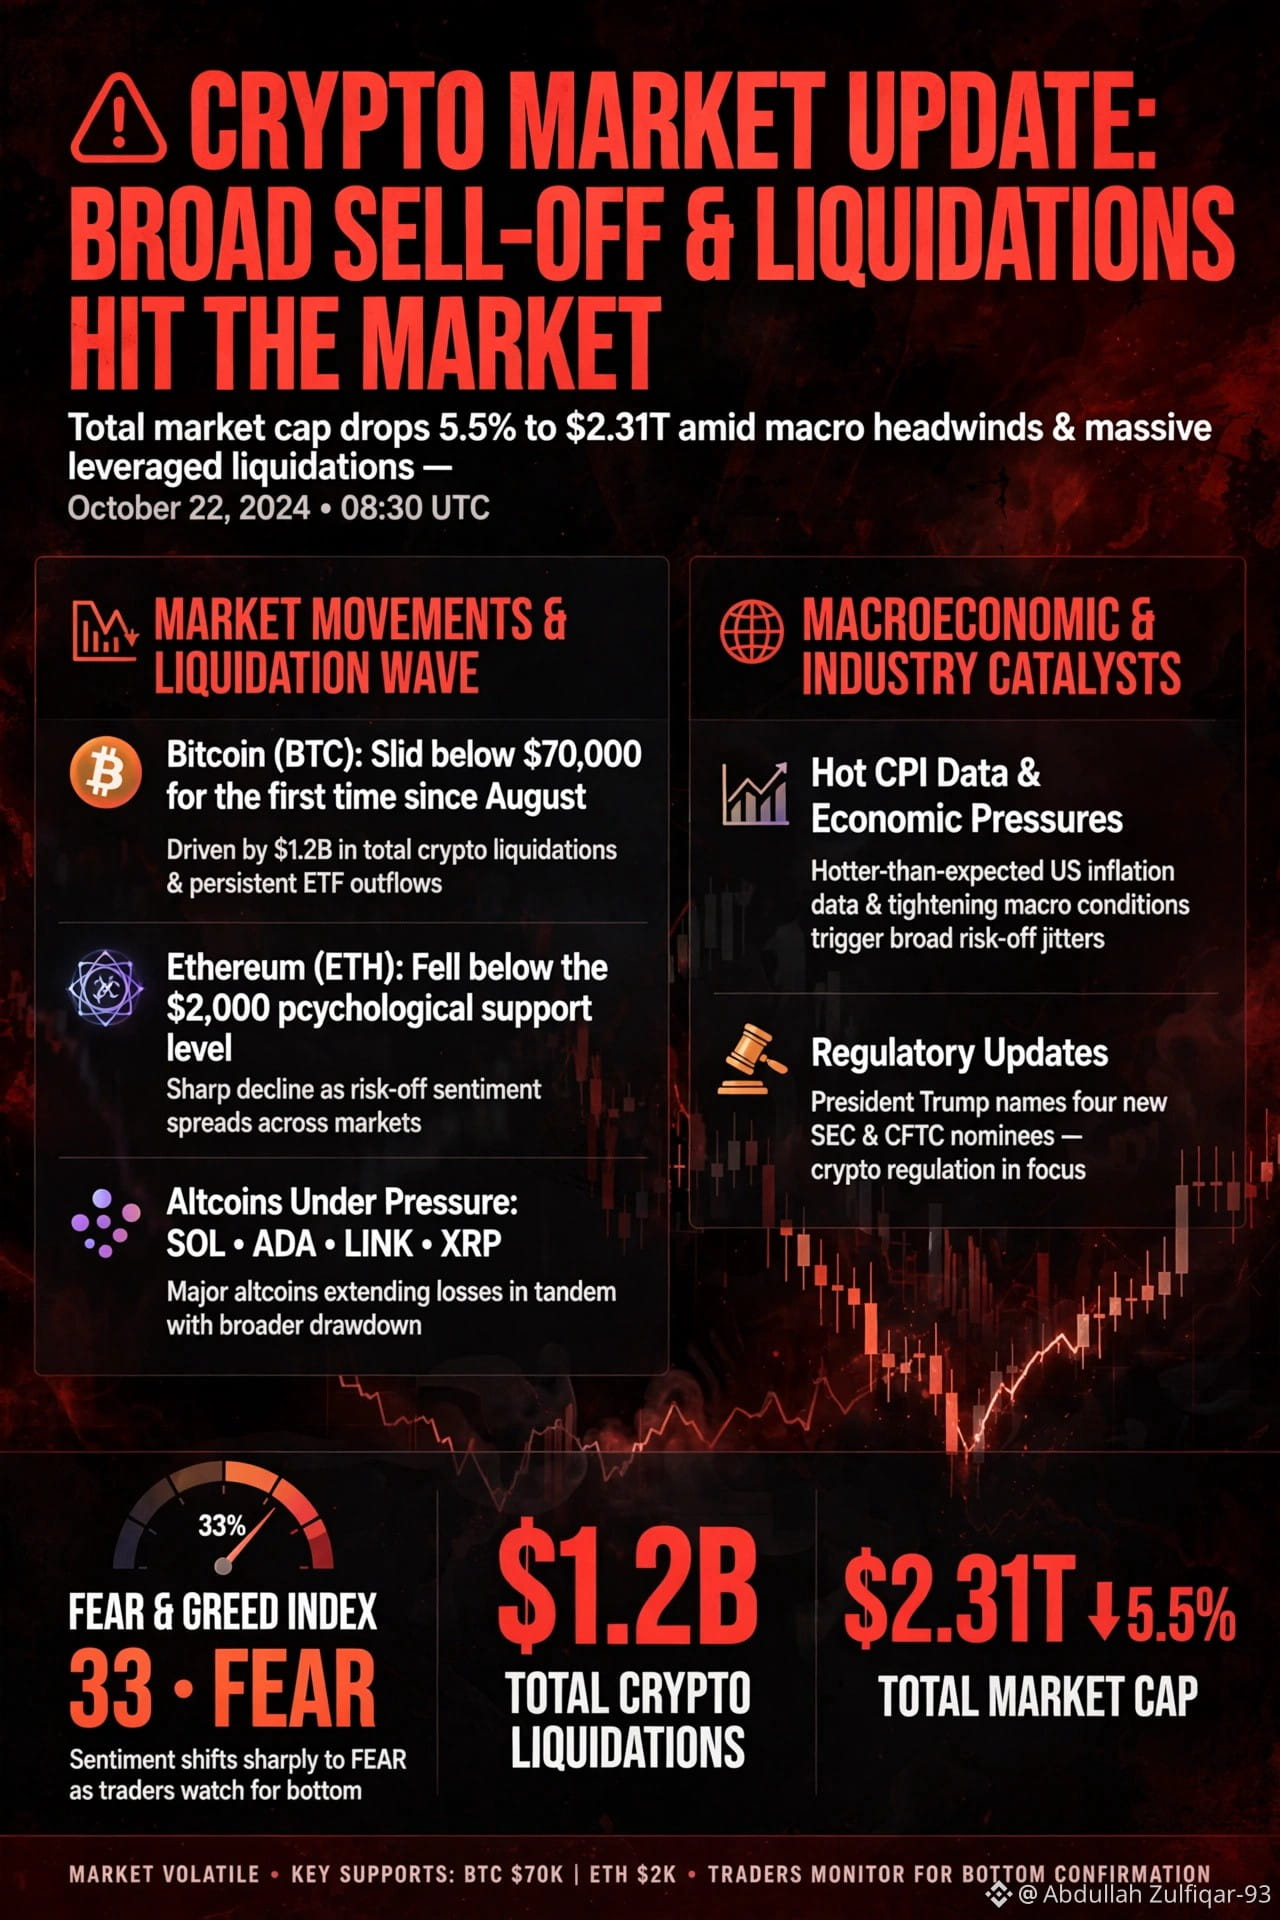
Der Kryptowährungsmarkt erlebt einen starken risikoscheuen Rücksetzer. Die gesamte Marktkapitalisierung sank angesichts weitreichender makroökonomischer Gegenwinde und massiver Liquidationen gehebelter Positionen um rund 5,5 % auf etwa 2,31–2,39 Billionen US-Dollar.
📉 Marktbewegungen & Liquidationswelle
Bitcoin (BTC): Fiel erstmals seit August unter die Marke von 70.000 US-Dollar. Auslöser waren marktweit insgesamt mehr als 1,2 Milliarden US-Dollar an Krypto-Liquidationen sowie anhaltende ETF-Mittelabflüsse.
Ethereum (ETH): Gab deutlich nach und rutschte unter die wichtige psychologische Unterstützung bei 2.000 US-Dollar.
Altcoins unter Druck: Große Altcoins wie Solana (SOL), Cardano (ADA), Chainlink (LINK) und XRP weiten ihre Verluste parallel zum breiteren Marktrückgang aus.
🌐 Makroökonomische & branchenbezogene Auslöser
Hohe CPI-Daten & wirtschaftlicher Druck: Die jüngsten US-Inflationsdaten, die höher als erwartet ausfielen, und die Verschärfung der makroökonomischen Bedingungen haben größere Unruhe an den Märkten ausgelöst und weltweit Risikoanlagen belastet.
Regulatorische Entwicklungen: Präsident Trump hat vier neue Kandidaten für die SEC und die CFTC nominiert. Damit stehen die Regulierung und Compliance im US-Kryptobereich weiterhin im Mittelpunkt der Diskussionen unter Händlern.
Marktstimmung: Die Stimmungsindikatoren für Angst und Gier sind deutlich in den Bereich „Angst“ gerutscht (Wert etwa 33), während Händler wichtige technische Unterstützungsniveaus beobachten, um festzustellen, ob ein Boden nahe ist.
$BARD
{spot}(BARDUSDT)
$LISTA
🚨 Krypto-Marktupdate: Breiter Ausverkauf & Liquidationen erschüttern den Markt
Der Kryptowährungsmarkt erlebt einen starken risikoscheuen Rücksetzer. Die gesamte Marktkapitalisierung sank angesichts weitreichender makroökonomischer Gegenwinde und massiver Liquidationen gehebelter Positionen um rund 5,5 % auf etwa 2,31–2,39 Billionen US-Dollar.
📉 Marktbewegungen & Liquidationswelle
Bitcoin (BTC): Fiel erstmals seit August unter die Marke von 70.000 US-Dollar. Auslöser waren marktweit insgesamt mehr als 1,2 Milliarden US-Dollar an Krypto-Liquidationen sowie anhaltende ETF-Mittelabflüsse.
Ethereum (ETH): Gab deutlich nach und rutschte unter die wichtige psychologische Unterstützung bei 2.000 US-Dollar.
Altcoins unter Druck: Große Altcoins wie Solana (SOL), Cardano (ADA), Chainlink (LINK) und XRP weiten ihre Verluste parallel zum breiteren Marktrückgang aus.
🌐 Makroökonomische & branchenbezogene Auslöser
Hohe CPI-Daten & wirtschaftlicher Druck: Die jüngsten US-Inflationsdaten, die höher als erwartet ausfielen, und die Verschärfung der makroökonomischen Bedingungen haben größere Unruhe an den Märkten ausgelöst und weltweit Risikoanlagen belastet.
Regulatorische Entwicklungen: Präsident Trump hat vier neue Kandidaten für die SEC und die CFTC nominiert. Damit stehen die Regulierung und Compliance im US-Kryptobereich weiterhin im Mittelpunkt der Diskussionen unter Händlern.
Marktstimmung: Die Stimmungsindikatoren für Angst und Gier sind deutlich in den Bereich „Angst“ gerutscht (Wert etwa 33), während Händler wichtige technische Unterstützungsniveaus beobachten, um festzustellen, ob ein Boden nahe ist.
$BARD
$LISTA
Der Kryptowährungsmarkt erlebt einen starken risikoscheuen Rücksetzer. Die gesamte Marktkapitalisierung sank angesichts weitreichender makroökonomischer Gegenwinde und massiver Liquidationen gehebelter Positionen um rund 5,5 % auf etwa 2,31–2,39 Billionen US-Dollar.
📉 Marktbewegungen & Liquidationswelle
Bitcoin (BTC): Fiel erstmals seit August unter die Marke von 70.000 US-Dollar. Auslöser waren marktweit insgesamt mehr als 1,2 Milliarden US-Dollar an Krypto-Liquidationen sowie anhaltende ETF-Mittelabflüsse.
Ethereum (ETH): Gab deutlich nach und rutschte unter die wichtige psychologische Unterstützung bei 2.000 US-Dollar.
Altcoins unter Druck: Große Altcoins wie Solana (SOL), Cardano (ADA), Chainlink (LINK) und XRP weiten ihre Verluste parallel zum breiteren Marktrückgang aus.
🌐 Makroökonomische & branchenbezogene Auslöser
Hohe CPI-Daten & wirtschaftlicher Druck: Die jüngsten US-Inflationsdaten, die höher als erwartet ausfielen, und die Verschärfung der makroökonomischen Bedingungen haben größere Unruhe an den Märkten ausgelöst und weltweit Risikoanlagen belastet.
Regulatorische Entwicklungen: Präsident Trump hat vier neue Kandidaten für die SEC und die CFTC nominiert. Damit stehen die Regulierung und Compliance im US-Kryptobereich weiterhin im Mittelpunkt der Diskussionen unter Händlern.
Marktstimmung: Die Stimmungsindikatoren für Angst und Gier sind deutlich in den Bereich „Angst“ gerutscht (Wert etwa 33), während Händler wichtige technische Unterstützungsniveaus beobachten, um festzustellen, ob ein Boden nahe ist.
$BARD
$LISTA
140
Übersetzung ansehen
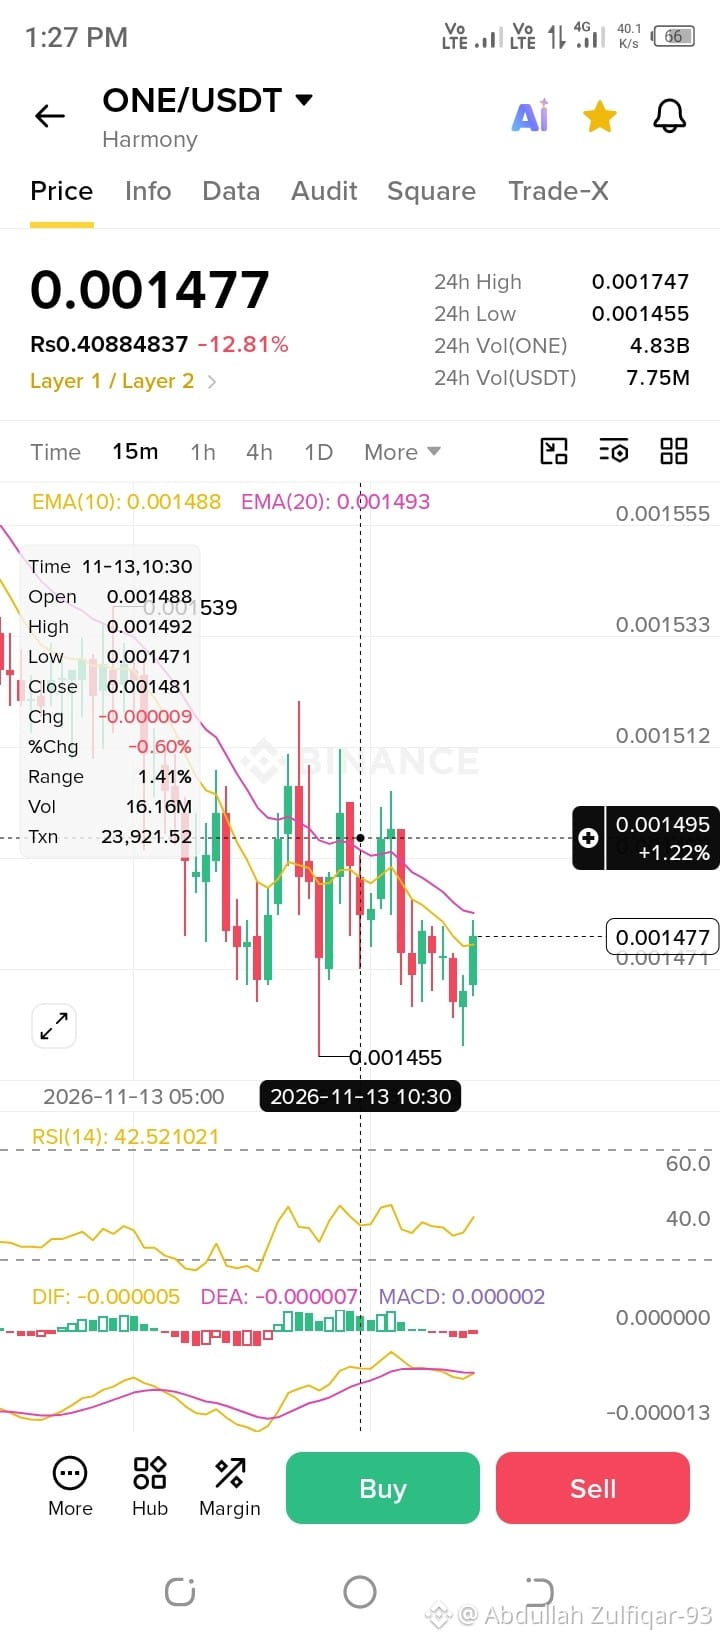
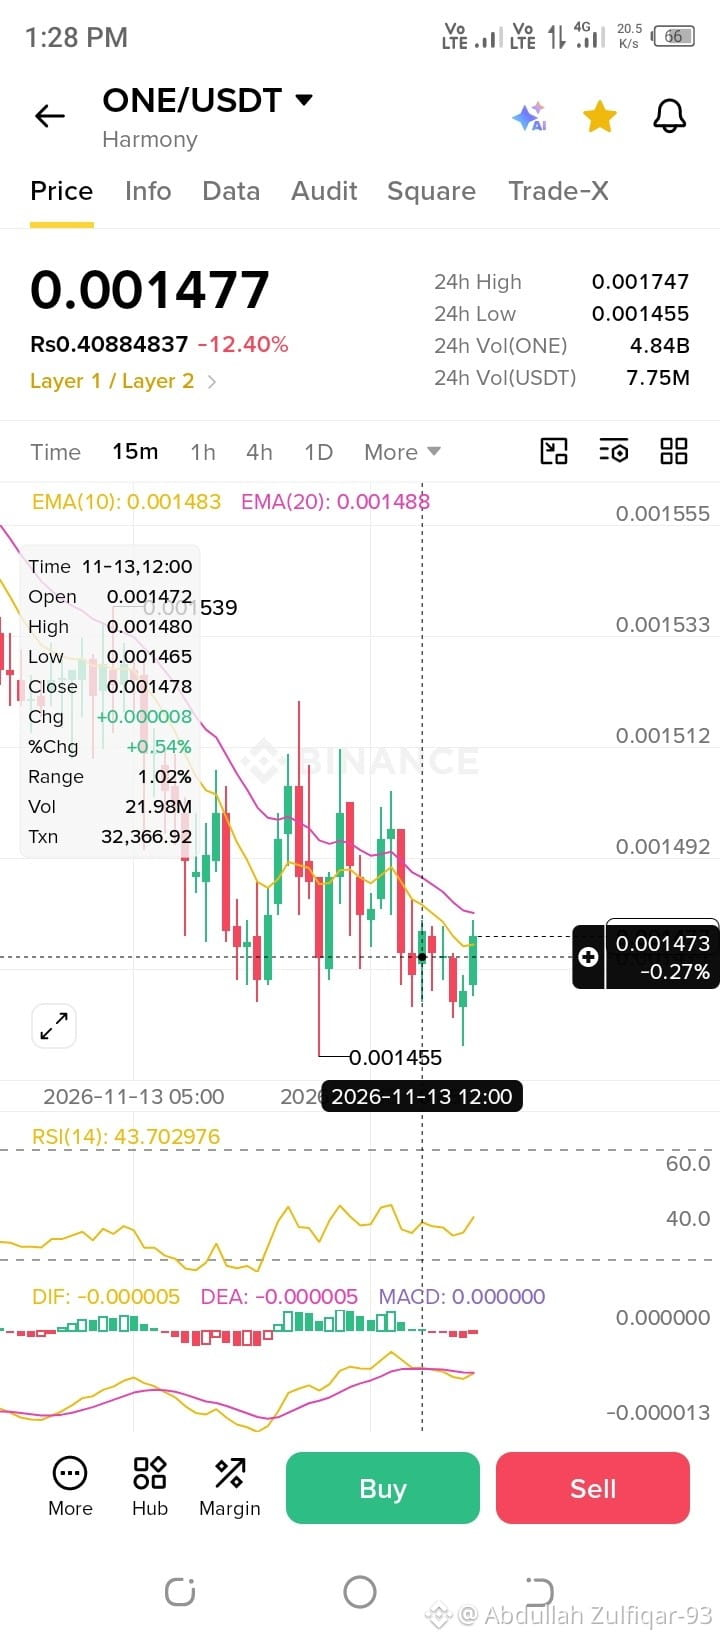
don't worry in downtrend!
I have a strategy for spot
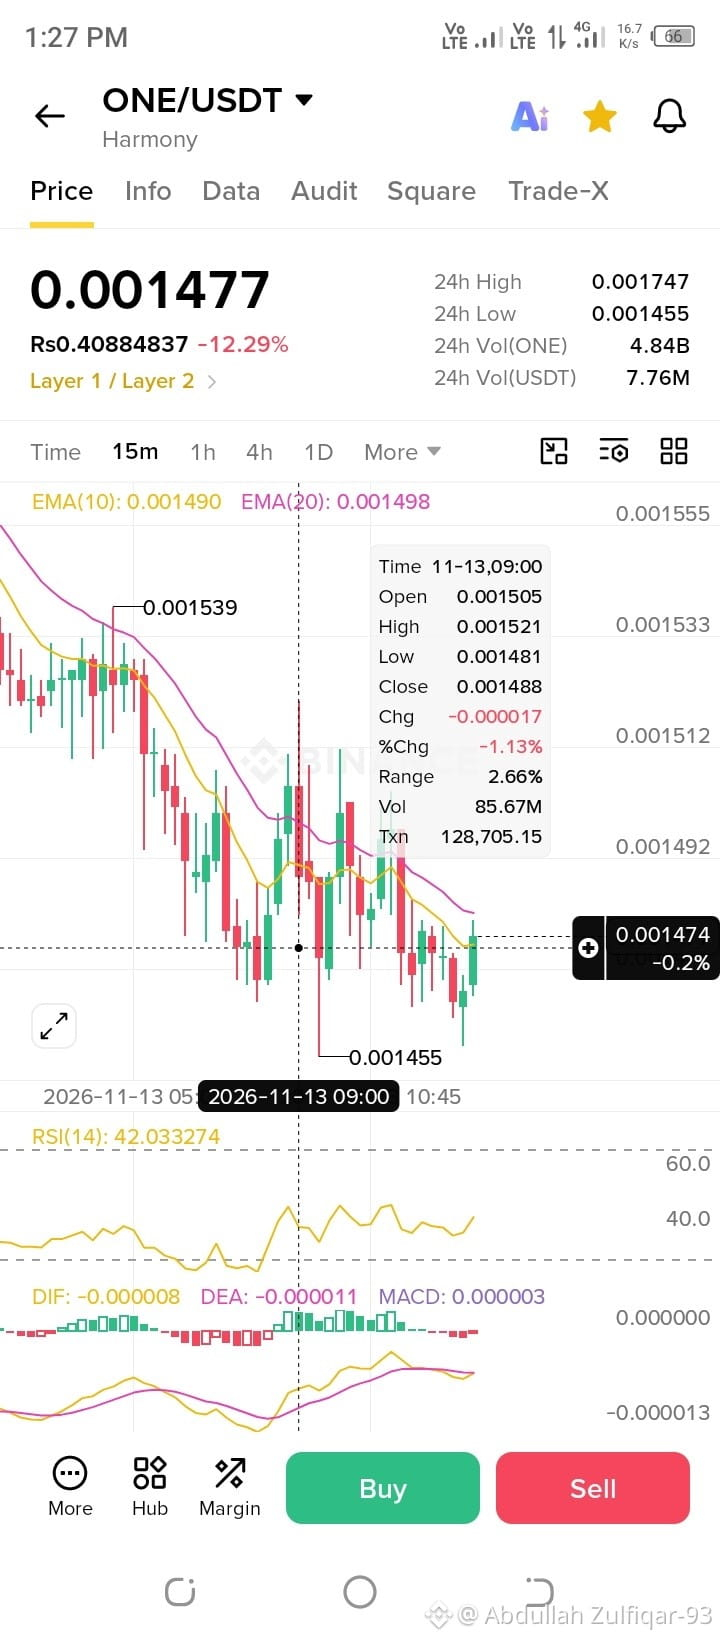
I analysis about $ONE !
15min chart
Example:
current value is 0.001420
if you spend in 50$ to buy
you sell on 0.001440
is normally going.
your profit is some about 0.3767 and after fee cutting you get about 0.3604.
this is a one trade in one candle. so you take a 64 trades in 8 hour and day end is
23.065$ profits. if I can miss some candle
due to market conditions so I probably take
15$ must in a whole day.
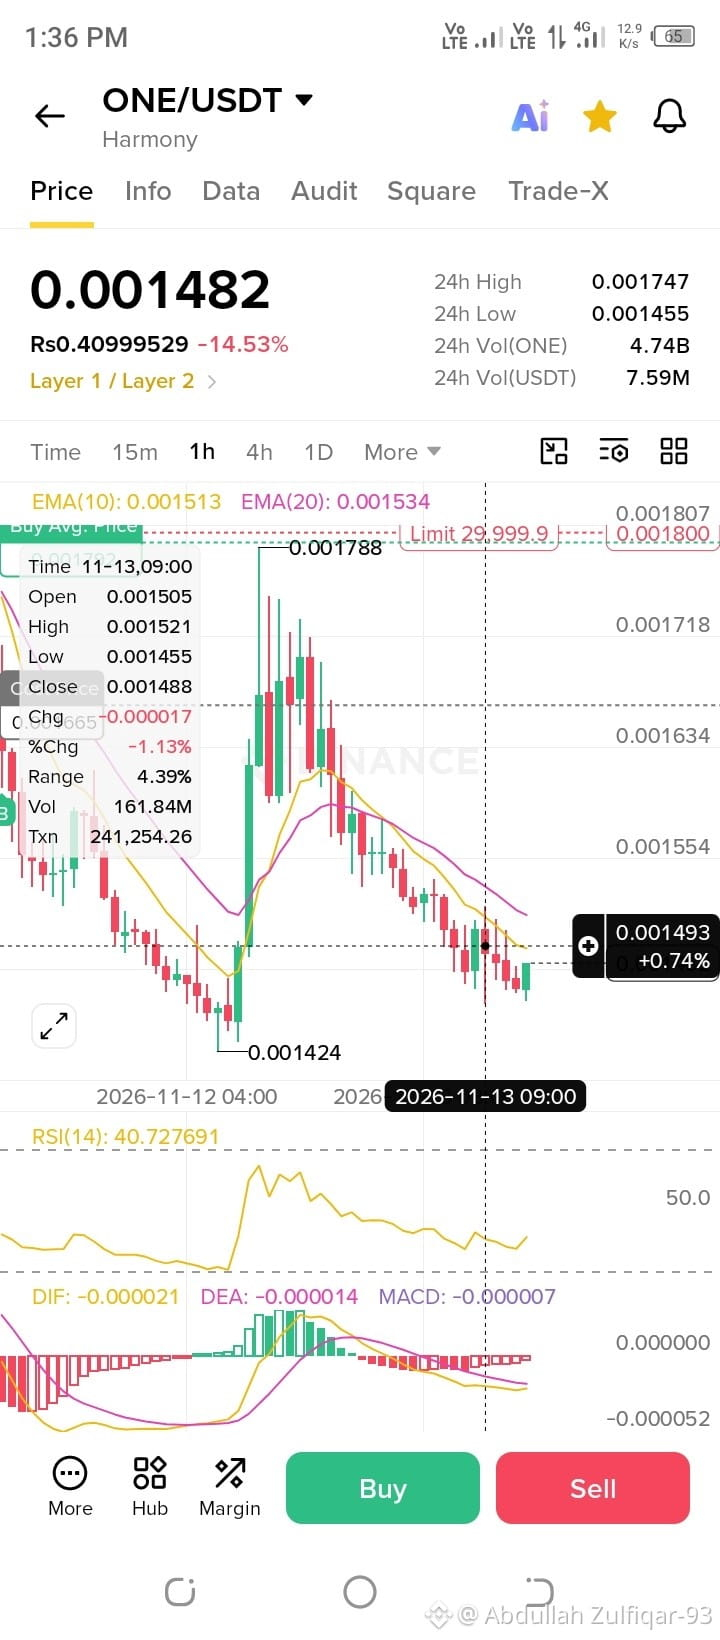
Same as in 1 hour:
buy on low 0.001420
sell on 0.001470
so 0.000050
is minimum market give to you.
Same as in 4hour:
buy on 0.001420
sell on 0.001520
so 0.000100
give market in 4 hour
These values are use for example so plz check the candle for 15min;1hour;4hour;
which one is suitable time for trade using this strategy.
this strategy is experienced by me I take a
profit from this strategy.
best of luck evertime.
$ONE
$ETH
don't worry in downtrend!
I have a strategy for spot
I analysis about $ONE !
15min chart
Example:
current value is 0.001420
if you spend in 50$ to buy
you sell on 0.001440
is normally going.
your profit is some about 0.3767 and after fee cutting you get about 0.3604.
this is a one trade in one candle. so you take a 64 trades in 8 hour and day end is
23.065$ profits. if I can miss some candle
due to market conditions so I probably take
15$ must in a whole day.
Same as in 1 hour:
buy on low 0.001420
sell on 0.001470
so 0.000050
is minimum market give to you.
Same as in 4hour:
buy on 0.001420
sell on 0.001520
so 0.000100
give market in 4 hour
These values are use for example so plz check the candle for 15min;1hour;4hour;
which one is suitable time for trade using this strategy.
this strategy is experienced by me I take a
profit from this strategy.
best of luck evertime.
$ONE
$ETH
I have a strategy for spot
I analysis about $ONE !
15min chart
Example:
current value is 0.001420
if you spend in 50$ to buy
you sell on 0.001440
is normally going.
your profit is some about 0.3767 and after fee cutting you get about 0.3604.
this is a one trade in one candle. so you take a 64 trades in 8 hour and day end is
23.065$ profits. if I can miss some candle
due to market conditions so I probably take
15$ must in a whole day.
Same as in 1 hour:
buy on low 0.001420
sell on 0.001470
so 0.000050
is minimum market give to you.
Same as in 4hour:
buy on 0.001420
sell on 0.001520
so 0.000100
give market in 4 hour
These values are use for example so plz check the candle for 15min;1hour;4hour;
which one is suitable time for trade using this strategy.
this strategy is experienced by me I take a
profit from this strategy.
best of luck evertime.
$ONE
$ETH
485
·
--
Bärisch
Spot $ONE 44.2 USDT
Übersetzung ansehen
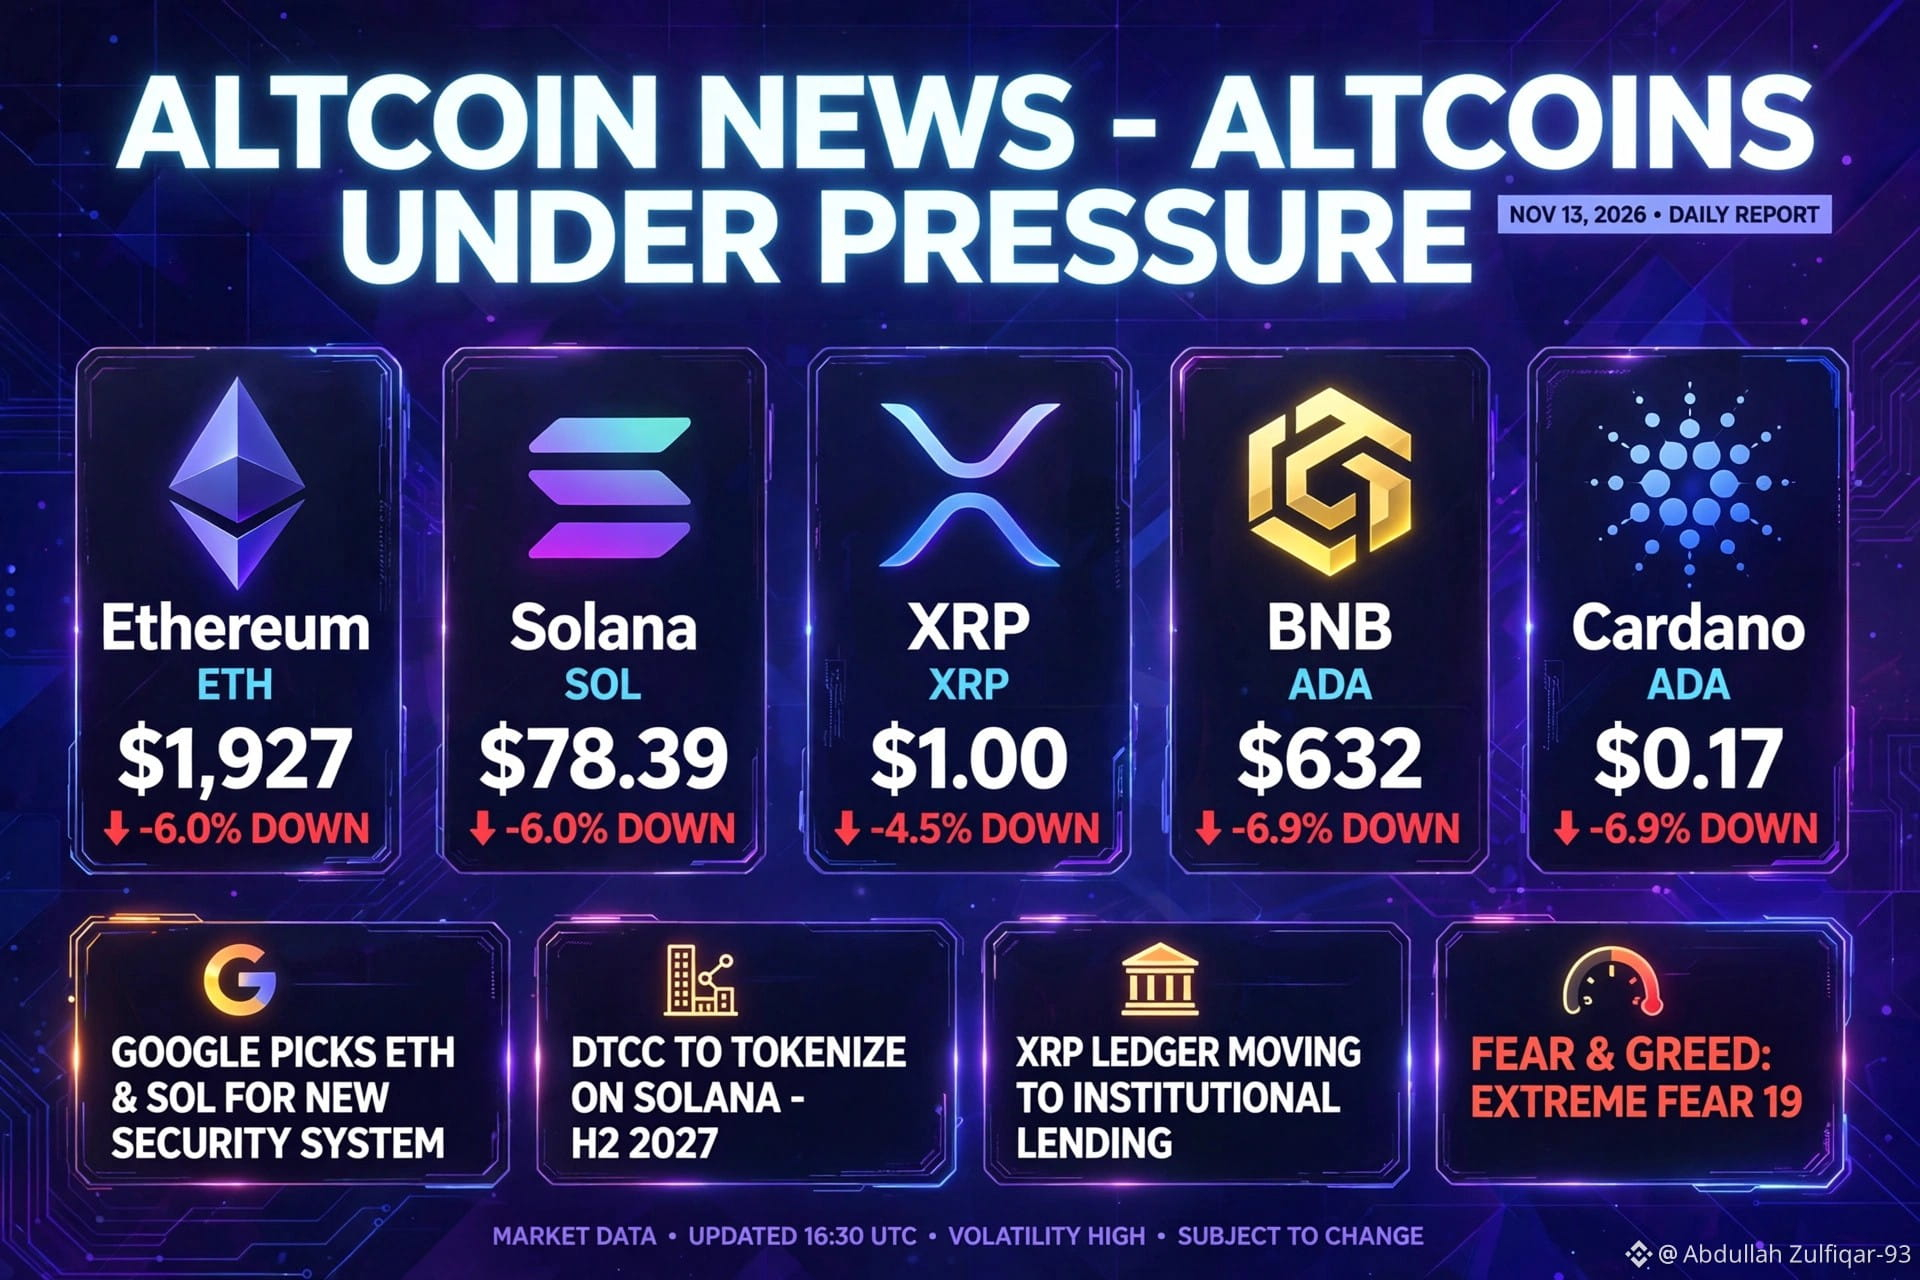
now bearish open for week or month!
$ONE
$UNI
now bearish open for week or month!
$ONE
$UNI
$ONE
$UNI
380
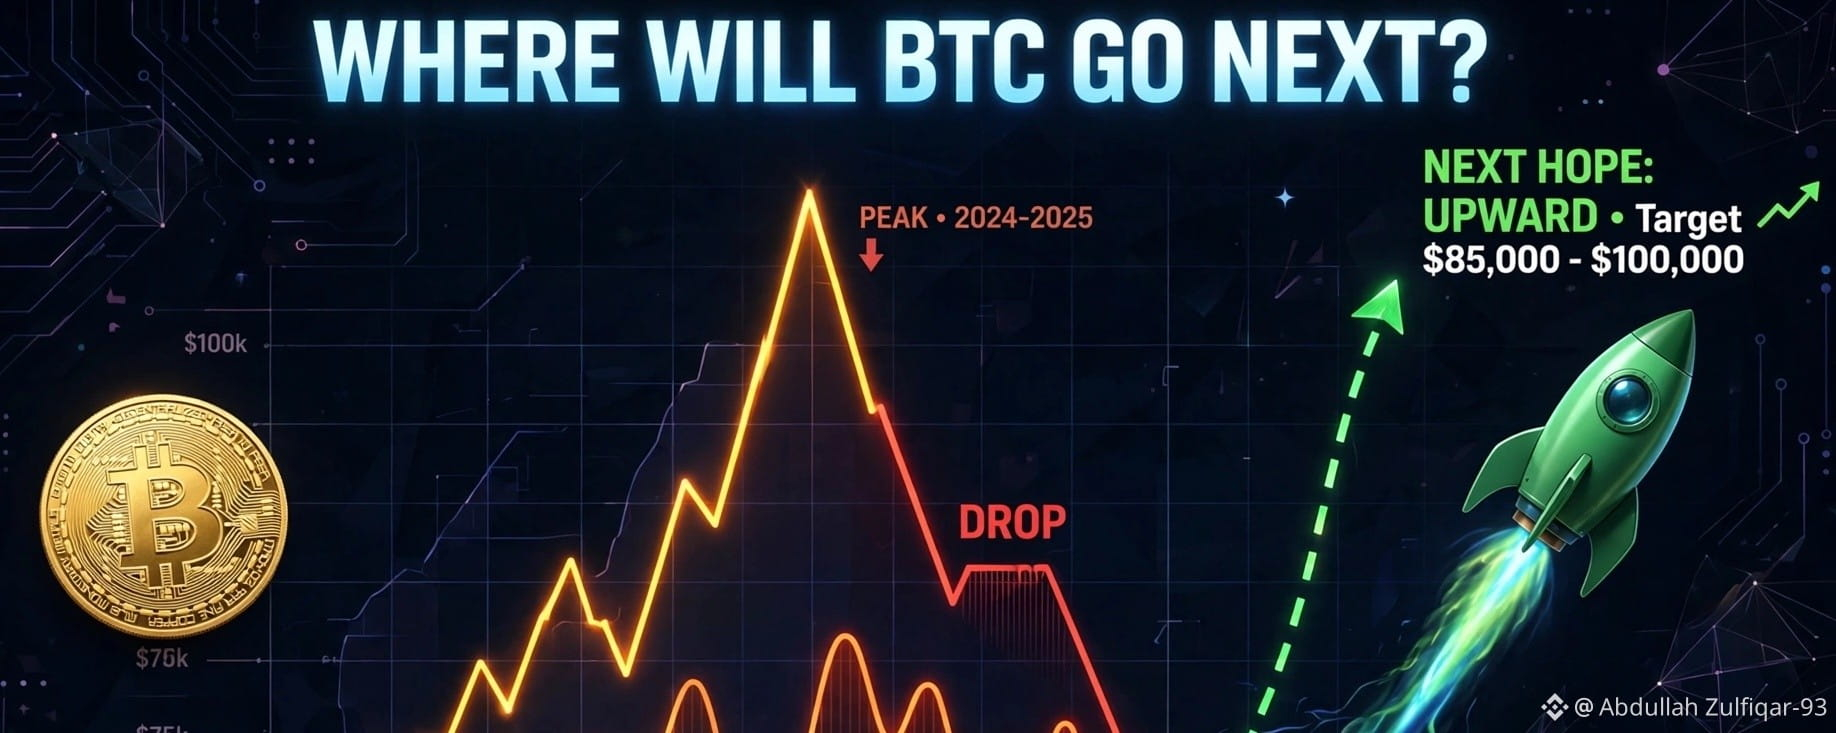
Artikel
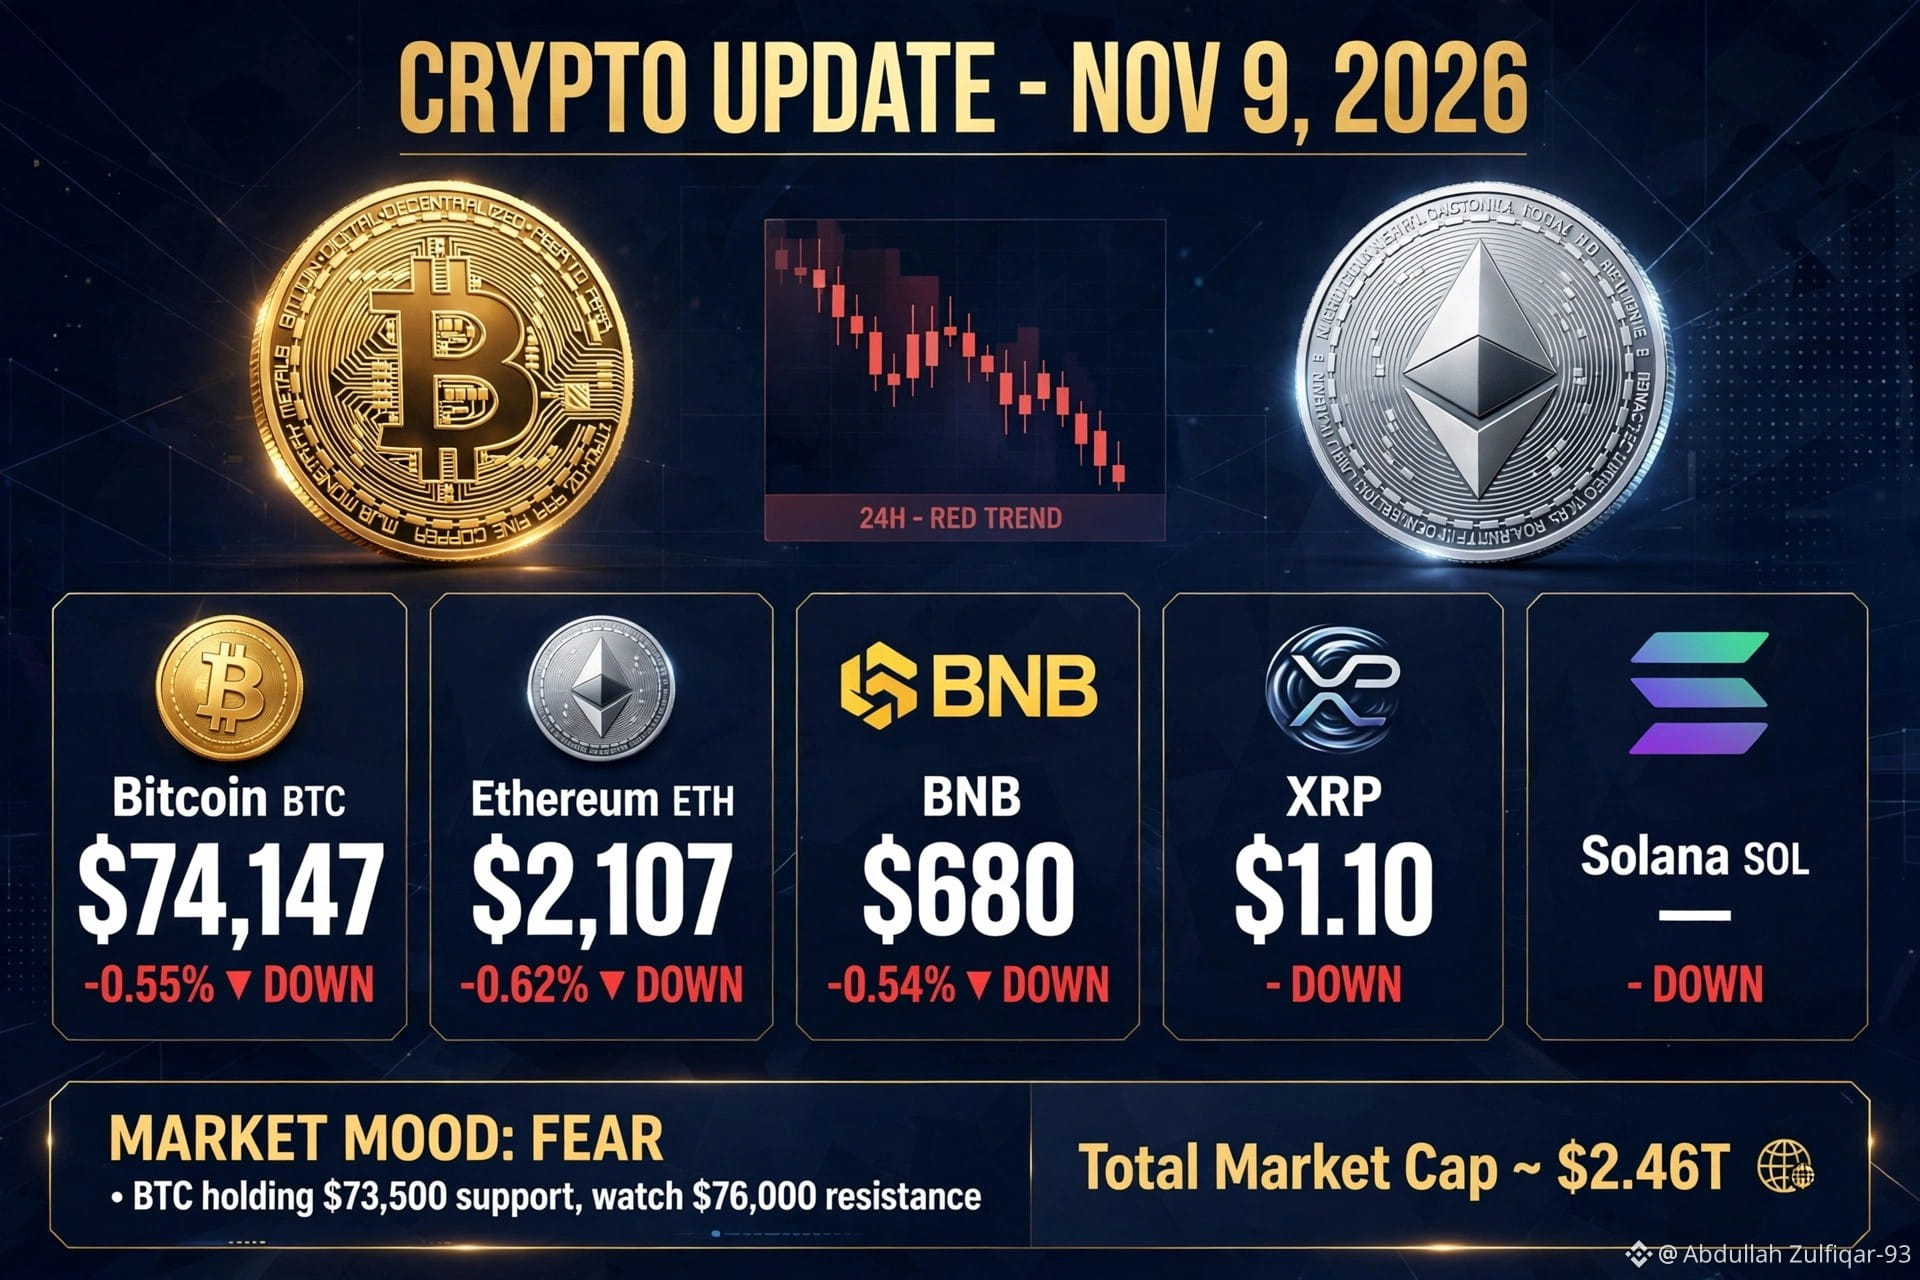
Bereitet sich Bitcoin auf einen ultimativen Ausbruch vor? Eine technische Analyse vom 9. November 2026
9. November 2026Angesichts eines entscheidenden Wendepunkts am globalen Markt offenbart eine neue Analyse der langfristigen Kursentwicklung von Bitcoin – von seiner Entstehung 2023 bis zum heutigen Datum, dem 9. November 2026 – eine komplexe, aber vielversprechende Geschichte für Anleger, mit dem Potenzial für ein neues Allzeithoch.
#BTC #Bitcoin #Krypto #TechnischeAnalyse #Marktzyklus #Kursprognose #KryptoNews
Die Reise: Zurück zum „START“ von 2023
Unsere technische Karte mit dem Titel „WOHIN GEHT BTC ALS NÄCHSTES?“ bietet einen visuell beeindruckenden Überblick über die vergangenen vier Jahre. Die Reise beginnt 2023 mit einem bescheidenen „START“, als BTC um die Marke von 25.000 $ pendelte. Darauf folgte eine äußerst „VOLATILE“ Phase. Die orangefarbene Kurslinie zeichnet ein Bild ständiger „AUF UND ABs“, während der Markt vergeblich nach einer klaren Richtung suchte – eine Phase, die von Konsolidierung und plötzlichen, dramatischen Veränderungen geprägt war.
Bereitet sich Bitcoin auf einen ultimativen Ausbruch vor? Eine technische Analyse vom 9. November 2026 9. November 2026
Angesichts eines entscheidenden Wendepunkts am globalen Markt offenbart eine neue Analyse der langfristigen Kursentwicklung von Bitcoin – von seiner Entstehung 2023 bis zum heutigen Datum, dem 9. November 2026 – eine komplexe, aber vielversprechende Geschichte für Anleger, mit dem Potenzial für ein neues Allzeithoch.
#BTC #Bitcoin #Krypto #TechnischeAnalyse #Marktzyklus #Kursprognose #KryptoNews
Die Reise: Zurück zum „START“ von 2023
Unsere technische Karte mit dem Titel „WOHIN GEHT BTC ALS NÄCHSTES?“ bietet einen visuell beeindruckenden Überblick über die vergangenen vier Jahre. Die Reise beginnt 2023 mit einem bescheidenen „START“, als BTC um die Marke von 25.000 $ pendelte. Darauf folgte eine äußerst „VOLATILE“ Phase. Die orangefarbene Kurslinie zeichnet ein Bild ständiger „AUF UND ABs“, während der Markt vergeblich nach einer klaren Richtung suchte – eine Phase, die von Konsolidierung und plötzlichen, dramatischen Veränderungen geprägt war.
#BTC #Bitcoin #Krypto #TechnischeAnalyse #Marktzyklus #Kursprognose #KryptoNews
Die Reise: Zurück zum „START“ von 2023
Unsere technische Karte mit dem Titel „WOHIN GEHT BTC ALS NÄCHSTES?“ bietet einen visuell beeindruckenden Überblick über die vergangenen vier Jahre. Die Reise beginnt 2023 mit einem bescheidenen „START“, als BTC um die Marke von 25.000 $ pendelte. Darauf folgte eine äußerst „VOLATILE“ Phase. Die orangefarbene Kurslinie zeichnet ein Bild ständiger „AUF UND ABs“, während der Markt vergeblich nach einer klaren Richtung suchte – eine Phase, die von Konsolidierung und plötzlichen, dramatischen Veränderungen geprägt war.
1
994
Übersetzung ansehen
121
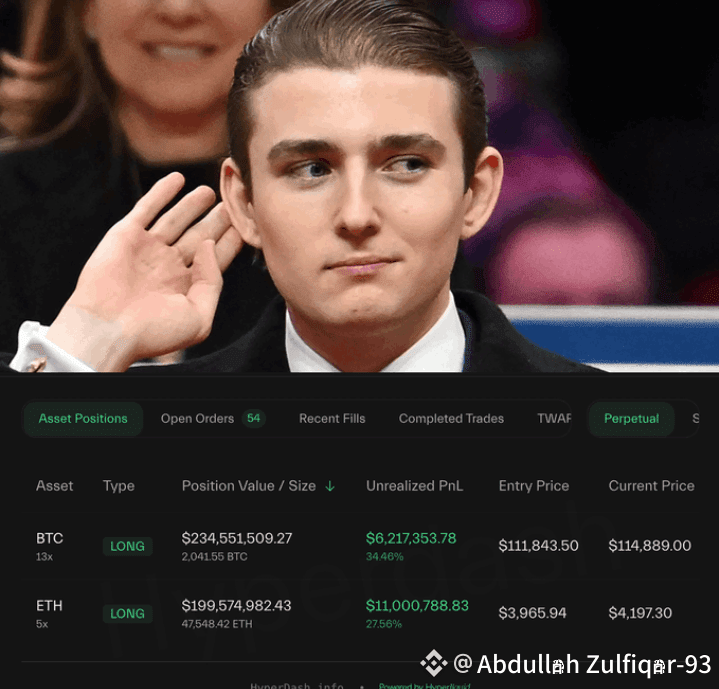
🚨 BREAKING:
EIN INSIDER MIT 100% TREFFERQUOTE HÄLT JETZT $234,5M $BTC und $199,5M $ETH LONG-POSITIONEN
WAS WEISS ER??
$BTC
{spot}(BTCUSDT)
$ZEC
{spot}(ZECUSDT)
🚨 BREAKING:
EIN INSIDER MIT 100% TREFFERQUOTE HÄLT JETZT $234,5M $BTC und $199,5M $ETH LONG-POSITIONEN
WAS WEISS ER??
$BTC
$ZEC
EIN INSIDER MIT 100% TREFFERQUOTE HÄLT JETZT $234,5M $BTC und $199,5M $ETH LONG-POSITIONEN
WAS WEISS ER??
$BTC
$ZEC
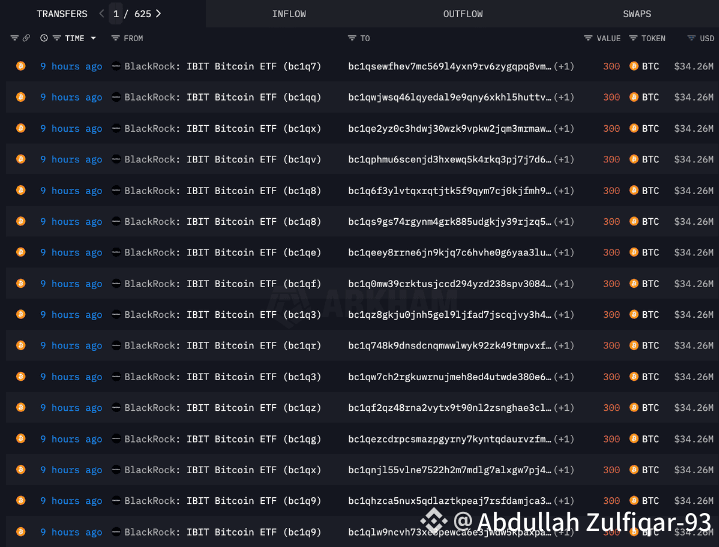
17
🚨 SENSATIONELLE NEWS:
BLACKROCK HAT HEUTE $1,73 MRD. WERT VON $BTC VERKAUFT
WAS PASSIERT HIER??
$XRP
{spot}(XRPUSDT)
$BTC
{spot}(BTCUSDT)
🚨 SENSATIONELLE NEWS:
BLACKROCK HAT HEUTE $1,73 MRD. WERT VON $BTC VERKAUFT
WAS PASSIERT HIER??
$XRP
$BTC
BLACKROCK HAT HEUTE $1,73 MRD. WERT VON $BTC VERKAUFT
WAS PASSIERT HIER??
$XRP
$BTC
4
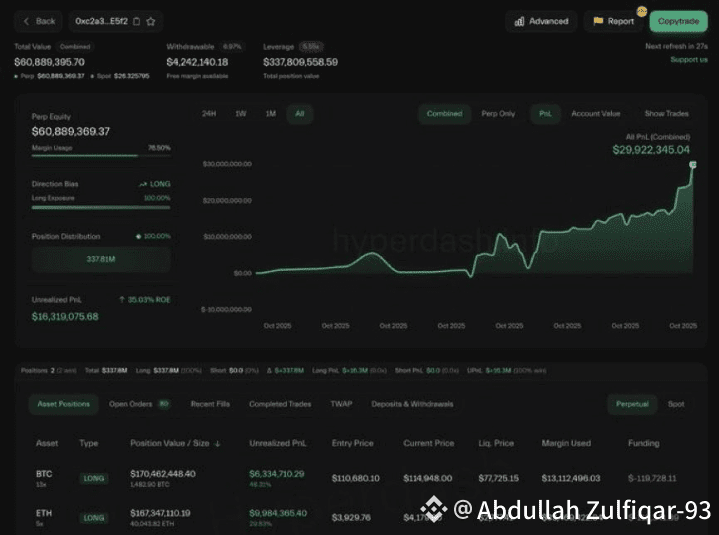
💥BREAKING:
HÄNDLER MIT 100% WIN-RATE HAT SOEBEN MEHR ZU SEINEN $ETH-LONGS HINZUGEFÜGT.
AKTUELLE POSITIONEN:
• 1,483 $BTC ($170.46M)
• 40,044 $ETH ($167.35M)
WAS WEISS ER?
$TON
{spot}(TONUSDT)
$HBAR
{spot}(HBARUSDT)
💥BREAKING:
HÄNDLER MIT 100% WIN-RATE HAT SOEBEN MEHR ZU SEINEN $ETH-LONGS HINZUGEFÜGT.
AKTUELLE POSITIONEN:
• 1,483 $BTC ($170.46M)
• 40,044 $ETH ($167.35M)
WAS WEISS ER?
$TON
$HBAR
HÄNDLER MIT 100% WIN-RATE HAT SOEBEN MEHR ZU SEINEN $ETH-LONGS HINZUGEFÜGT.
AKTUELLE POSITIONEN:
• 1,483 $BTC ($170.46M)
• 40,044 $ETH ($167.35M)
WAS WEISS ER?
$TON
$HBAR
1
Anmelden und weiter Inhalte entdecken
Krypto-Nutzer weltweit auf Binance Square kennenlernen
⚡️ Bleib in Sachen Krypto stets am Puls.
💬 Die weltgrößte Kryptobörse vertraut darauf.
👍 Erhalte verlässliche Einblicke von verifizierten Creators.
E-Mail-Adresse/Telefonnummer
Trendthemen
MoreHikesExpectedIsBTCUnderPressure
8,333 Aufrufe
113 Kommentare
FOMC-Protokoll | Fed-Protokoll zeigt: Fast alle Vertreter rechnen mit weiteren Zinserhöhungen, einige halten im Dezember einen größeren Schritt für möglich
Binance News
·16 Likes
·22.5k Aufrufe
NvidiaBeatsEstimatesWith$130BQ4Outlook
75,159 Aufrufe
304 Kommentare
AnthropicIPOPriceCouldExceed$80
73,472 Aufrufe
251 Kommentare