

Rahmani 1970
7 Beiträge

Rahmani 1970
Melden
Nutzer blockieren
islamic vibes
3 Following
7 Follower
1 Like gegeben
Beiträge
·
--
Übersetzung ansehen
🚨 CRYPTO ALERT: $BTC Slips, but Wall Street Moves On-Chain!
📉 Market Update — October 29, 2026
Crypto markets are facing fresh pressure. Bitcoin traded below $80,000, while Ethereum and several major altcoins also declined. Market uncertainty and interest-rate concerns are keeping traders cautious. citeturn317778search0turn317778news27
🏦 Meanwhile, Wall Street is making a major blockchain move!
The Depository Trust & Clearing Corporation (DTCC) has launched a tokenization service for selected U.S. stocks, ETFs, and Treasury securities. Around 20 major financial firms have signed up to access the service. citeturn317778search1
🔍 My Analysis
This market tells two different stories: short-term price pressure and long-term blockchain development.
Bitcoin’s next moves may depend on macroeconomic signals and market sentiment. Meanwhile, tokenization could help connect traditional finance with blockchain infrastructure—but adoption will take time, and it does not guarantee higher crypto prices.
💬 Question for the community: Is institutional blockchain adoption the bigger story, or are you watching Bitcoin’s price action more closely?
#Tokenization #CryptoMarket #BTC #ETH #BinanceSquare
58
·
--
Übersetzung ansehen
Ethereum (ETH) Latest Technical Analysis
1. Market Overview
$ETH Ethereum is currently navigating a period of range-bound consolidation, trading near $2,315. The market sentiment for ETH is cautious. While long-term fundamentals like ecosystem adoption remain strong, the short-term price action has been sluggish. $ETH has been heavily correlated with $BTC
but has underperformed slightly, waiting for a catalyst to define its next major trend.
2. Technical Setup & Key Levels
Major Support Zone ($2,285): This is the primary accumulation floor. Bulls are aggressively defending this level. A break below this support would be significant and could accelerate a sell-off.
Major Resistance Zone ($2,385): This is the key breakout trigger. To confirm a reversal and build substantial upward momentum, ETH must clear this resistance with high trading volume.
Moving Averages: The price is below key 50-day and 200-day moving averages (MAs) on major timeframes, which is a medium-term bearish signal, highlighting the prevailing weakness.
3. Short-Term Scenarios & Narrative
Scenario A: Bullish Rebound (The Comeback): In this narrative, the $2,285 support holds. Accumulation continues in this "Primary Accumulation Zone," leading to a retest and breakout of the $2,385 resistance. This successful breakout signals a renewed bullish wave, targeting levels above $2,500.
Scenario B: Bearish Breakdown (The Capitulation): In this outcome, the $2,285 support is breached. This capitulation confirms the medium-term downtrend, leading to a swift drop toward deeper liquidity levels, potentially retesting the $2,000 – $2,100 psychological support area.
#ETH(二饼) #FedWatch #CryptoAnalysis #EarningsSeason
{spot}(ETHUSDT)
Ethereum (ETH) Latest Technical Analysis
1. Market Overview
$ETH Ethereum is currently navigating a period of range-bound consolidation, trading near $2,315. The market sentiment for ETH is cautious. While long-term fundamentals like ecosystem adoption remain strong, the short-term price action has been sluggish. $ETH has been heavily correlated with $BTC
but has underperformed slightly, waiting for a catalyst to define its next major trend.
2. Technical Setup & Key Levels
Major Support Zone ($2,285): This is the primary accumulation floor. Bulls are aggressively defending this level. A break below this support would be significant and could accelerate a sell-off.
Major Resistance Zone ($2,385): This is the key breakout trigger. To confirm a reversal and build substantial upward momentum, ETH must clear this resistance with high trading volume.
Moving Averages: The price is below key 50-day and 200-day moving averages (MAs) on major timeframes, which is a medium-term bearish signal, highlighting the prevailing weakness.
3. Short-Term Scenarios & Narrative
Scenario A: Bullish Rebound (The Comeback): In this narrative, the $2,285 support holds. Accumulation continues in this "Primary Accumulation Zone," leading to a retest and breakout of the $2,385 resistance. This successful breakout signals a renewed bullish wave, targeting levels above $2,500.
Scenario B: Bearish Breakdown (The Capitulation): In this outcome, the $2,285 support is breached. This capitulation confirms the medium-term downtrend, leading to a swift drop toward deeper liquidity levels, potentially retesting the $2,000 – $2,100 psychological support area.
#ETH(二饼) #FedWatch #CryptoAnalysis #EarningsSeason
47
·
--
Übersetzung ansehen
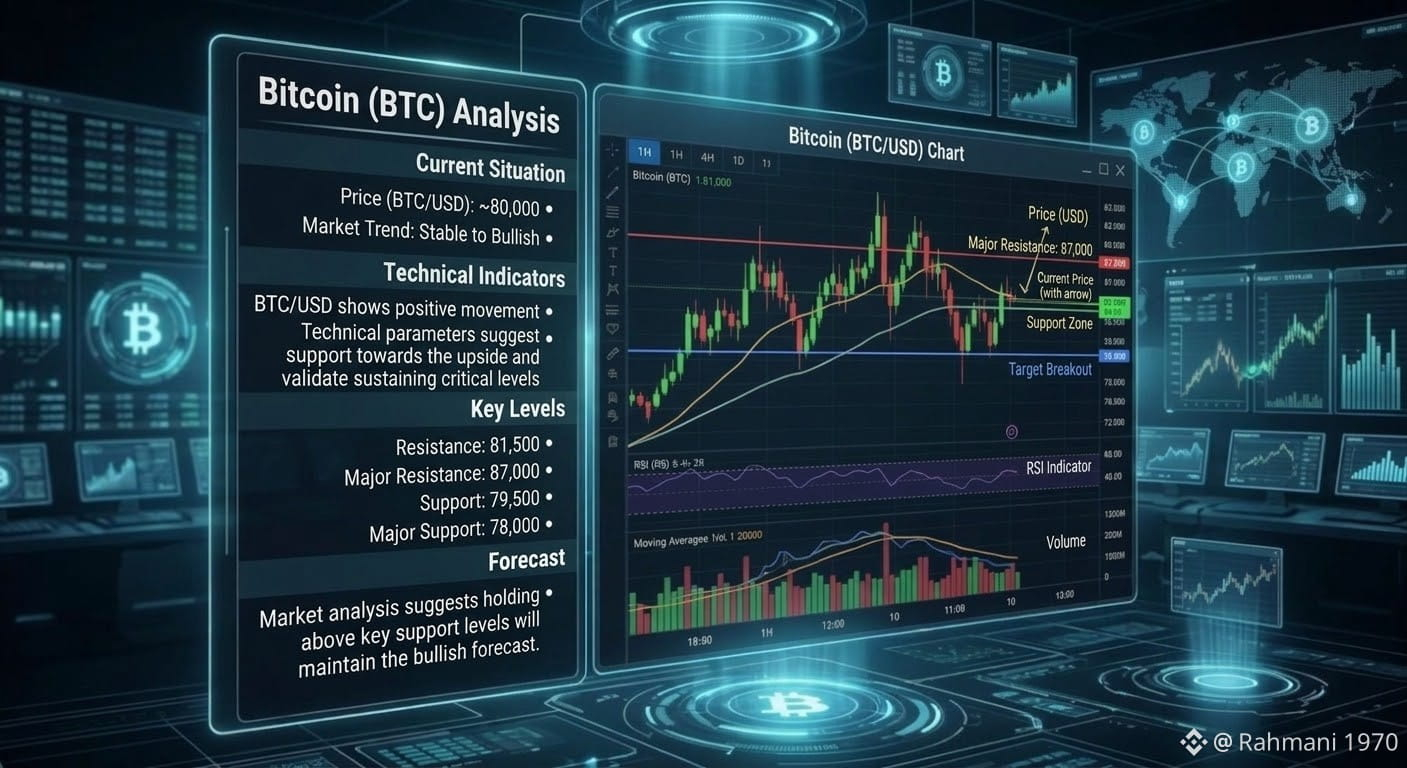
$BTC is currently consolidating tightly around the $79,000 – $80,500 region. After facing headwinds from macro uncertainty, looming Federal Reserve rate decisions, and tech-sector correlations, BTC has experienced a classic "Red October" consolidation phase. Interestingly, heavy exchange outflows (with thousands of BTC pulled off platforms) hint that long-term holders are accumulating despite the short-term price drag.
#FedWatch #BitcoinCore32.1RaisesPeerConnectionLimit #EarningsSeason
{spot}(BTCUSDT)
$BTC is currently consolidating tightly around the $79,000 – $80,500 region. After facing headwinds from macro uncertainty, looming Federal Reserve rate decisions, and tech-sector correlations, BTC has experienced a classic "Red October" consolidation phase. Interestingly, heavy exchange outflows (with thousands of BTC pulled off platforms) hint that long-term holders are accumulating despite the short-term price drag.
#FedWatch #BitcoinCore32.1RaisesPeerConnectionLimit #EarningsSeason
#FedWatch #BitcoinCore32.1RaisesPeerConnectionLimit #EarningsSeason
73
·
--
Übersetzung ansehen
$BNB is showing renewed upward momentum after recovering from its recent decline. On October 28, the price closed near $759.89, up about 2% for the day. The next challenge is resistance around $763–$770. Support near $750 is an important level to watch. A sustained move above resistance could strengthen the recovery, while a drop below support may weaken it.
Market outlook: Cautiously bullish, but volatility remains possible.
#CanMicrosoftDeliverOnAI #EarningsSeason #CanGoogleDefindItsCore
Market outlook: Cautiously bullish, but volatility remains possible.
#CanMicrosoftDeliverOnAI #EarningsSeason #CanGoogleDefindItsCore
151
·
--
{spot}(FETUSDT)
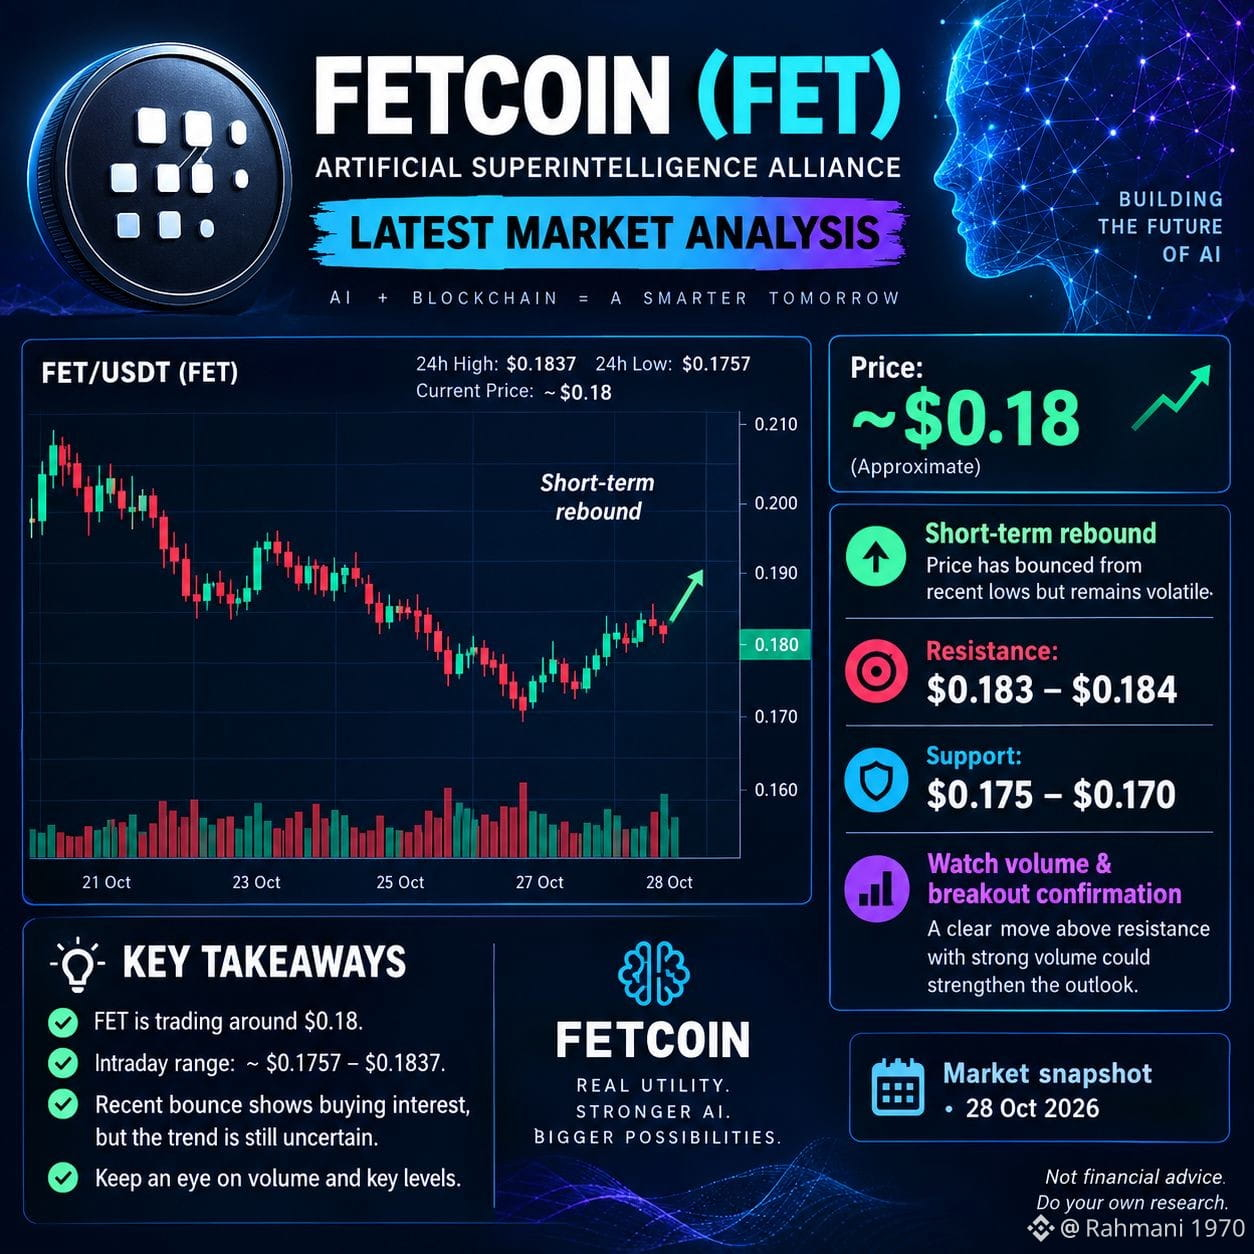
$FETCOIN wird aktuell bei etwa 0,18 $ gehandelt und zeigt nach der jüngsten Schwäche eine moderate Erholung. Der nächste wichtige Test wird sein, ob die Käufer den Kurs über den Widerstand heben können.
🔹 Widerstand: 0,183–0,184 $
🔹 Unterstützung: 0,175–0,170 $
🔹 Marktausblick: Kurzfristig vorsichtig optimistisch, die Volatilität bleibt jedoch hoch.
📈 Ein kräftiger Anstieg über den Widerstand bei höherem Handelsvolumen könnte die Dynamik verbessern. Ein Rückgang unter die Unterstützung könnte auf erneuten Verkaufsdruck hindeuten.
💡 Beobachten Sie die wichtigen Kursmarken und das Handelsvolumen, bevor Sie Schlussfolgerungen ziehen.
#FET #BinanceSquare #
1
319
·
--
Übersetzung ansehen
$Solana (SOL) Latest Analysis: Can Bulls Regain Control?
$Solana SOL was reported near $101.26, up 0.36% over 24 hours, but the broader trend remains uncertain. <Cite refs={["turn581615search4","turn581615search2"]}/>
📊 Key Levels to Watch
Support: $98–$99
Resistance: $102–$105
Outlook: Cautious until price action confirms a stronger recovery.
A break above resistance could improve momentum, while losing support may increase downside risk. Watch trading volume and broader market conditions before drawing conclusions.
💬 Are you bullish or bearish on SOL?
#Solana #SOL #Altcoins #CryptoAnalysis #BinanceSquare

119
·
--
Bullisch
Tritt diesem Link bei und erhalte mehr Boni
Tritt diesem Link bei und erhalte mehr Boni

259
Anmelden und weiter Inhalte entdecken
Krypto-Nutzer weltweit auf Binance Square kennenlernen
⚡️ Bleib in Sachen Krypto stets am Puls.
💬 Die weltgrößte Kryptobörse vertraut darauf.
👍 Erhalte verlässliche Einblicke von verifizierten Creators.
E-Mail-Adresse/Telefonnummer
Trendthemen
FedWatch
16.3M Aufrufe
39,185 Kommentare
🚨 DIE ALARMGLOCKEN LÄUTEN WIEDER LAUT!
Wie du weißt, hat die Fed gestern Abend ihren Zinsentscheid bekannt gegeben und die Zinsen unverändert gelassen. Hier ist die Lage bei den weiteren anschließend veröffentlichten Daten #FedWatch
Die jährliche Inflation stieg auf 3,6 %, während die monatliche Inflation auf 0,5 % kletterte. Auch der Kernindex der persönlichen Konsumausgaben (PCE) erreichte auf Jahresbasis 3,1 %.
Obwohl diese Zahlen den Erwartungen entsprechen, ist besonders besorgniserregend, dass die Inflation wieder zu steigen begonnen hat. Das 2-%-Ziel der Fed scheint weiterhin in weiter Ferne zu liegen.
Meiner Ansicht nach macht es das schwierig, Zinssenkungen in naher Zukunft zu rechtfertigen. Sollten die hohen Zinsen länger bestehen bleiben, könnte das zusätzlichen Verkaufsdruck auf $BTC und Altcoins ausüben.
Glaubst du, dass Krypto-Assets sich behaupten können?
Kripto Kurdu
·20 Likes
·3.8k Aufrufe
EarningsSeason
6.4M Aufrufe
31,904 Kommentare
USMidtermElections
26,759 Aufrufe
524 Kommentare