
Muhammad Irfan goraya418
9 Beiträge

Muhammad Irfan goraya418
Melden
Nutzer blockieren
0 Following
1 Follower
1 Like gegeben
Beiträge
·
--
Bullisch
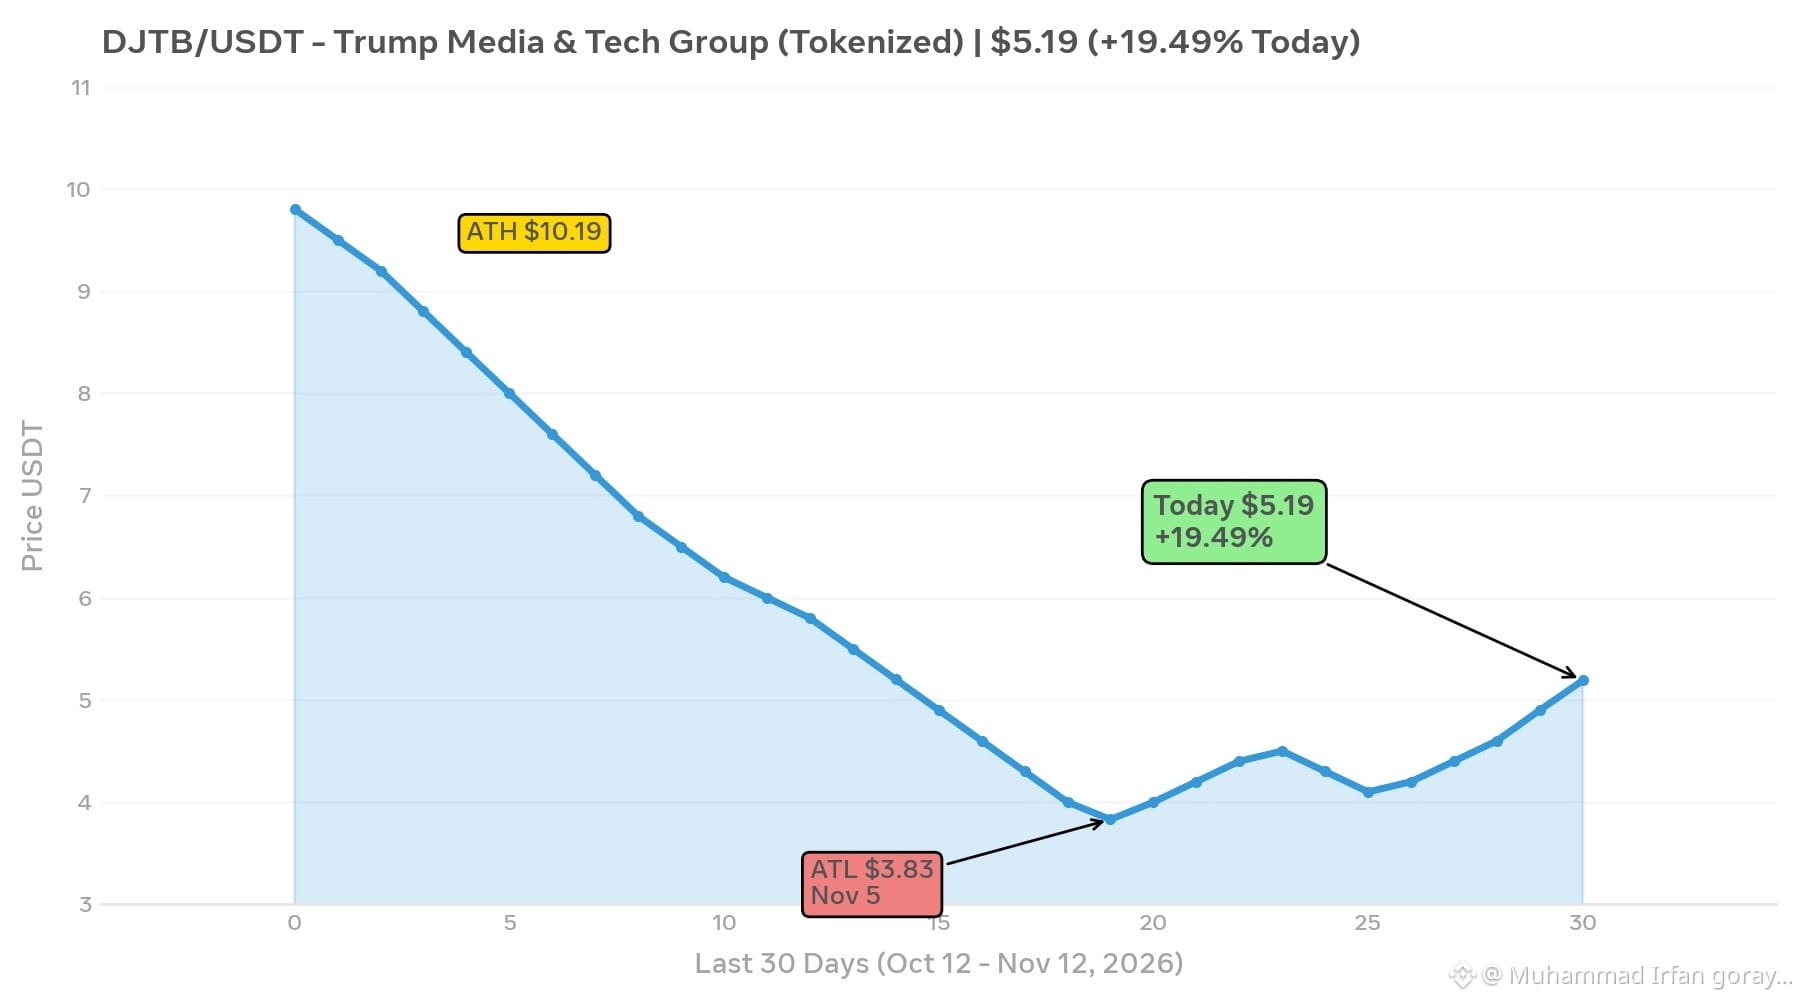
$DJTB /USDT-Chart – Heute*
$DJTB = Tokenisierte bStock von Trump Media & Technology Group (DJT)*
*Live-Daten für heute – 12. Nov. 2026:*
- *Preis: $5.19* – *+19.49% heute* – Starker grüner Handelstag
- *24-Stunden-Spanne: $4.17 / $5.21*
- *Marktkapitalisierung: $908K* – Rang #3076
- *Volumen: $1.2M – $1.87M* täglich
- *ATH: $10.19* am 27. Aug. 2026 – Aktuell 47% unter dem Höchststand
- *ATL: $3.83* am 5. Nov. 2026 – Erholung um +35% vom Tiefpunkt 94832487
*Analyse:*
1. *Trend:* Abwärtstrend von $9.8 auf $3.83 in 3 Monaten – Rückgang um 45.79% in den letzten 3 Monaten
2. *Tiefpunkt:* Tiefststand von $3.83 am 5. Nov. erreicht – am selben Tag erreichten $BTC und andere bStocks ihren Tiefststand
3. *Erholung:* In den letzten 7 Tagen +13.28% – Langsame, stetige Erholung nach dem Tiefpunkt
4. *Heutiger Kurssprung:* +19.49% bei hohem Volumen – Ausbruch über den Widerstand bei $4.60 2487
*Niveaus:*
- *Unterstützung: $4.60 / $4.18 / $3.83*
- *Widerstand: $5.21 (heutiges Hoch) / $5.80 / $6.20*
- *Bei einem Ausbruch über $5.21:* Nächstes Ziel $6.00-$6.20
Dies ist ein politischer Aktientoken, dessen Kurs stark von Nachrichten beeinflusst wird. Er ist nicht gehebelt wie MVLLB/SOXLB und daher weniger riskant, reagiert aber dennoch schnell auf Nachrichten über Trump.#AnthropicRejectsIPODelayValuationinQuestion #TradFiForBeginners #HuangRisksOusterOverReportedAffairWithSubordinate
$DJTB /USDT-Chart – Heute*
$DJTB = Tokenisierte bStock von Trump Media & Technology Group (DJT)*
*Live-Daten für heute – 12. Nov. 2026:*
- *Preis: $5.19* – *+19.49% heute* – Starker grüner Handelstag
- *24-Stunden-Spanne: $4.17 / $5.21*
- *Marktkapitalisierung: $908K* – Rang #3076
- *Volumen: $1.2M – $1.87M* täglich
- *ATH: $10.19* am 27. Aug. 2026 – Aktuell 47% unter dem Höchststand
- *ATL: $3.83* am 5. Nov. 2026 – Erholung um +35% vom Tiefpunkt 94832487
*Analyse:*
1. *Trend:* Abwärtstrend von $9.8 auf $3.83 in 3 Monaten – Rückgang um 45.79% in den letzten 3 Monaten
2. *Tiefpunkt:* Tiefststand von $3.83 am 5. Nov. erreicht – am selben Tag erreichten $BTC und andere bStocks ihren Tiefststand
3. *Erholung:* In den letzten 7 Tagen +13.28% – Langsame, stetige Erholung nach dem Tiefpunkt
4. *Heutiger Kurssprung:* +19.49% bei hohem Volumen – Ausbruch über den Widerstand bei $4.60 2487
*Niveaus:*
- *Unterstützung: $4.60 / $4.18 / $3.83*
- *Widerstand: $5.21 (heutiges Hoch) / $5.80 / $6.20*
- *Bei einem Ausbruch über $5.21:* Nächstes Ziel $6.00-$6.20
Dies ist ein politischer Aktientoken, dessen Kurs stark von Nachrichten beeinflusst wird. Er ist nicht gehebelt wie MVLLB/SOXLB und daher weniger riskant, reagiert aber dennoch schnell auf Nachrichten über Trump.#AnthropicRejectsIPODelayValuationinQuestion #TradFiForBeginners #HuangRisksOusterOverReportedAffairWithSubordinate
$DJTB = Tokenisierte bStock von Trump Media & Technology Group (DJT)*
*Live-Daten für heute – 12. Nov. 2026:*
- *Preis: $5.19* – *+19.49% heute* – Starker grüner Handelstag
- *24-Stunden-Spanne: $4.17 / $5.21*
- *Marktkapitalisierung: $908K* – Rang #3076
- *Volumen: $1.2M – $1.87M* täglich
- *ATH: $10.19* am 27. Aug. 2026 – Aktuell 47% unter dem Höchststand
- *ATL: $3.83* am 5. Nov. 2026 – Erholung um +35% vom Tiefpunkt 94832487
*Analyse:*
1. *Trend:* Abwärtstrend von $9.8 auf $3.83 in 3 Monaten – Rückgang um 45.79% in den letzten 3 Monaten
2. *Tiefpunkt:* Tiefststand von $3.83 am 5. Nov. erreicht – am selben Tag erreichten $BTC und andere bStocks ihren Tiefststand
3. *Erholung:* In den letzten 7 Tagen +13.28% – Langsame, stetige Erholung nach dem Tiefpunkt
4. *Heutiger Kurssprung:* +19.49% bei hohem Volumen – Ausbruch über den Widerstand bei $4.60 2487
*Niveaus:*
- *Unterstützung: $4.60 / $4.18 / $3.83*
- *Widerstand: $5.21 (heutiges Hoch) / $5.80 / $6.20*
- *Bei einem Ausbruch über $5.21:* Nächstes Ziel $6.00-$6.20
Dies ist ein politischer Aktientoken, dessen Kurs stark von Nachrichten beeinflusst wird. Er ist nicht gehebelt wie MVLLB/SOXLB und daher weniger riskant, reagiert aber dennoch schnell auf Nachrichten über Trump.#AnthropicRejectsIPODelayValuationinQuestion #TradFiForBeginners #HuangRisksOusterOverReportedAffairWithSubordinate
27
·
--
Bullisch
Übersetzung ansehen
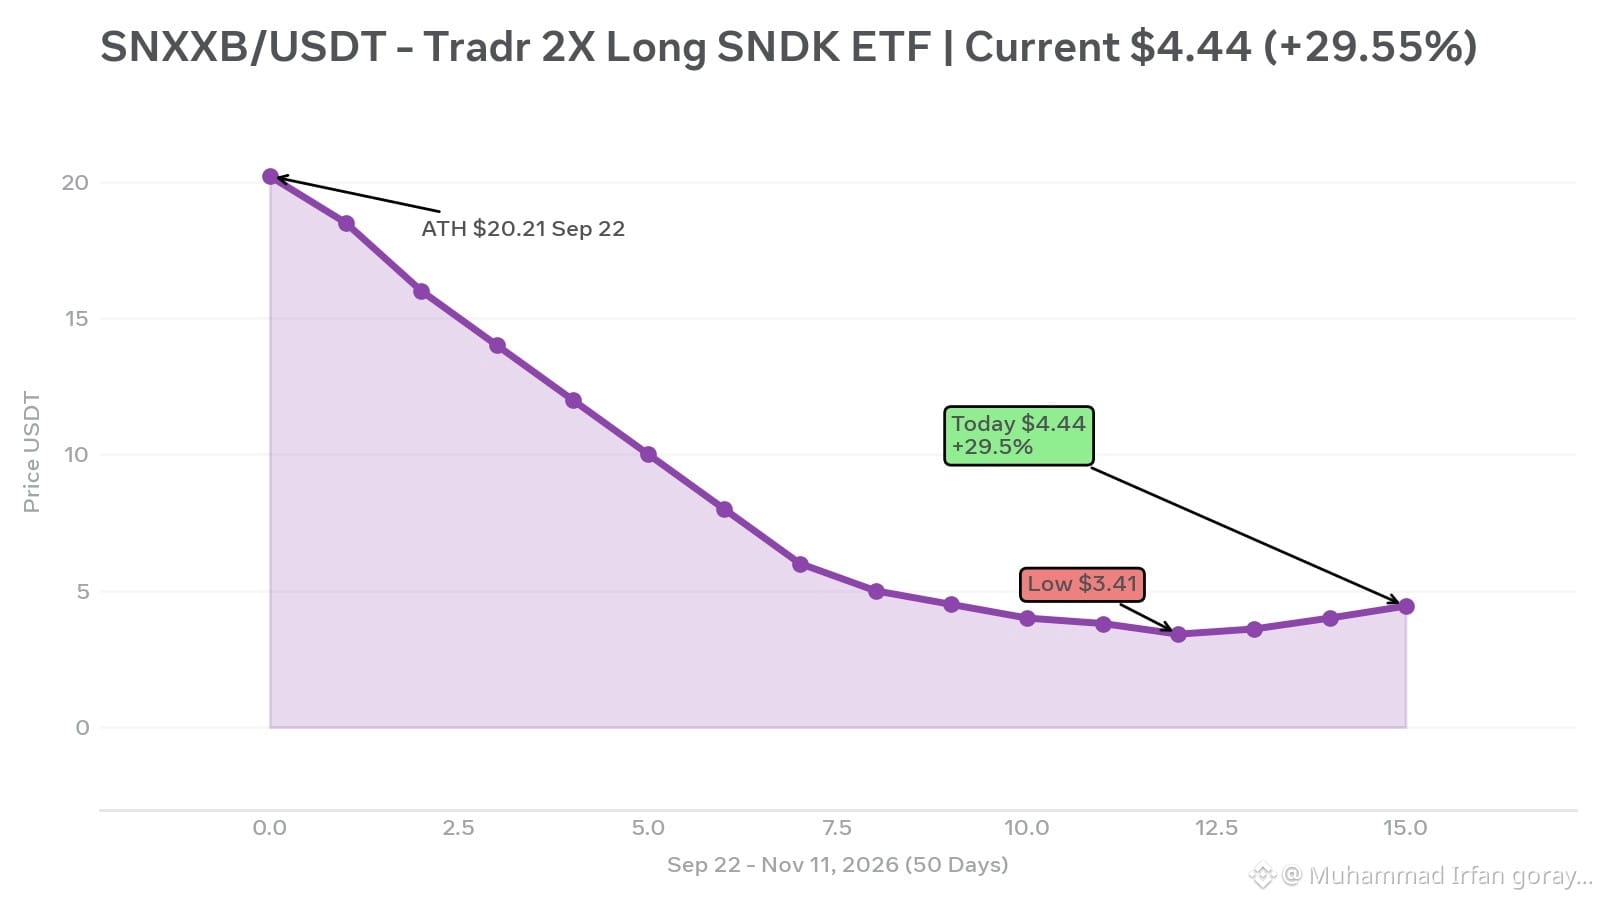
$SNXXB /USDT - Today 11 Nov 2026*
$SNXXB is *Tradr 2X Long SNDK ETF* - a 2X leveraged tokenized version of SanDisk (SNDK) stock trading on Binance.
*Today's Live Data:*
- *Price: $4.44* - *+29.55% Today* - Very strong pump
- *24h Range: $3.41 - $4.65*
- *Volume: $29.8M*
- *ATH: $20.21* on Sep 22, 2026
- *Currently -78% down* from ATH
- *Low: $3.41* made yesterday, recovered +30% from there
*Chart Analysis:*
1. Downtrend for 50 days straight - from $20 to $3.41
2. Bottom formed at $3.41 yesterday
3. Today reversal with high volume to $4.44 - buyers are back
*Key Levels:*
- *Support: $4.00 / $3.60 / $3.41*
- *Resistance: $4.65 / $5.00 / $5.35*
- *If $4.65 breaks, next target $5.68*
*Risk:* It's 2X leveraged, so very volatile. Not for long-term holding, only for short-term trading. Use strict stop-loss.
$SNXXB /USDT - Today 11 Nov 2026*
$SNXXB is *Tradr 2X Long SNDK ETF* - a 2X leveraged tokenized version of SanDisk (SNDK) stock trading on Binance.
*Today's Live Data:*
- *Price: $4.44* - *+29.55% Today* - Very strong pump
- *24h Range: $3.41 - $4.65*
- *Volume: $29.8M*
- *ATH: $20.21* on Sep 22, 2026
- *Currently -78% down* from ATH
- *Low: $3.41* made yesterday, recovered +30% from there
*Chart Analysis:*
1. Downtrend for 50 days straight - from $20 to $3.41
2. Bottom formed at $3.41 yesterday
3. Today reversal with high volume to $4.44 - buyers are back
*Key Levels:*
- *Support: $4.00 / $3.60 / $3.41*
- *Resistance: $4.65 / $5.00 / $5.35*
- *If $4.65 breaks, next target $5.68*
*Risk:* It's 2X leveraged, so very volatile. Not for long-term holding, only for short-term trading. Use strict stop-loss.
$SNXXB is *Tradr 2X Long SNDK ETF* - a 2X leveraged tokenized version of SanDisk (SNDK) stock trading on Binance.
*Today's Live Data:*
- *Price: $4.44* - *+29.55% Today* - Very strong pump
- *24h Range: $3.41 - $4.65*
- *Volume: $29.8M*
- *ATH: $20.21* on Sep 22, 2026
- *Currently -78% down* from ATH
- *Low: $3.41* made yesterday, recovered +30% from there
*Chart Analysis:*
1. Downtrend for 50 days straight - from $20 to $3.41
2. Bottom formed at $3.41 yesterday
3. Today reversal with high volume to $4.44 - buyers are back
*Key Levels:*
- *Support: $4.00 / $3.60 / $3.41*
- *Resistance: $4.65 / $5.00 / $5.35*
- *If $4.65 breaks, next target $5.68*
*Risk:* It's 2X leveraged, so very volatile. Not for long-term holding, only for short-term trading. Use strict stop-loss.
170
Übersetzung ansehen
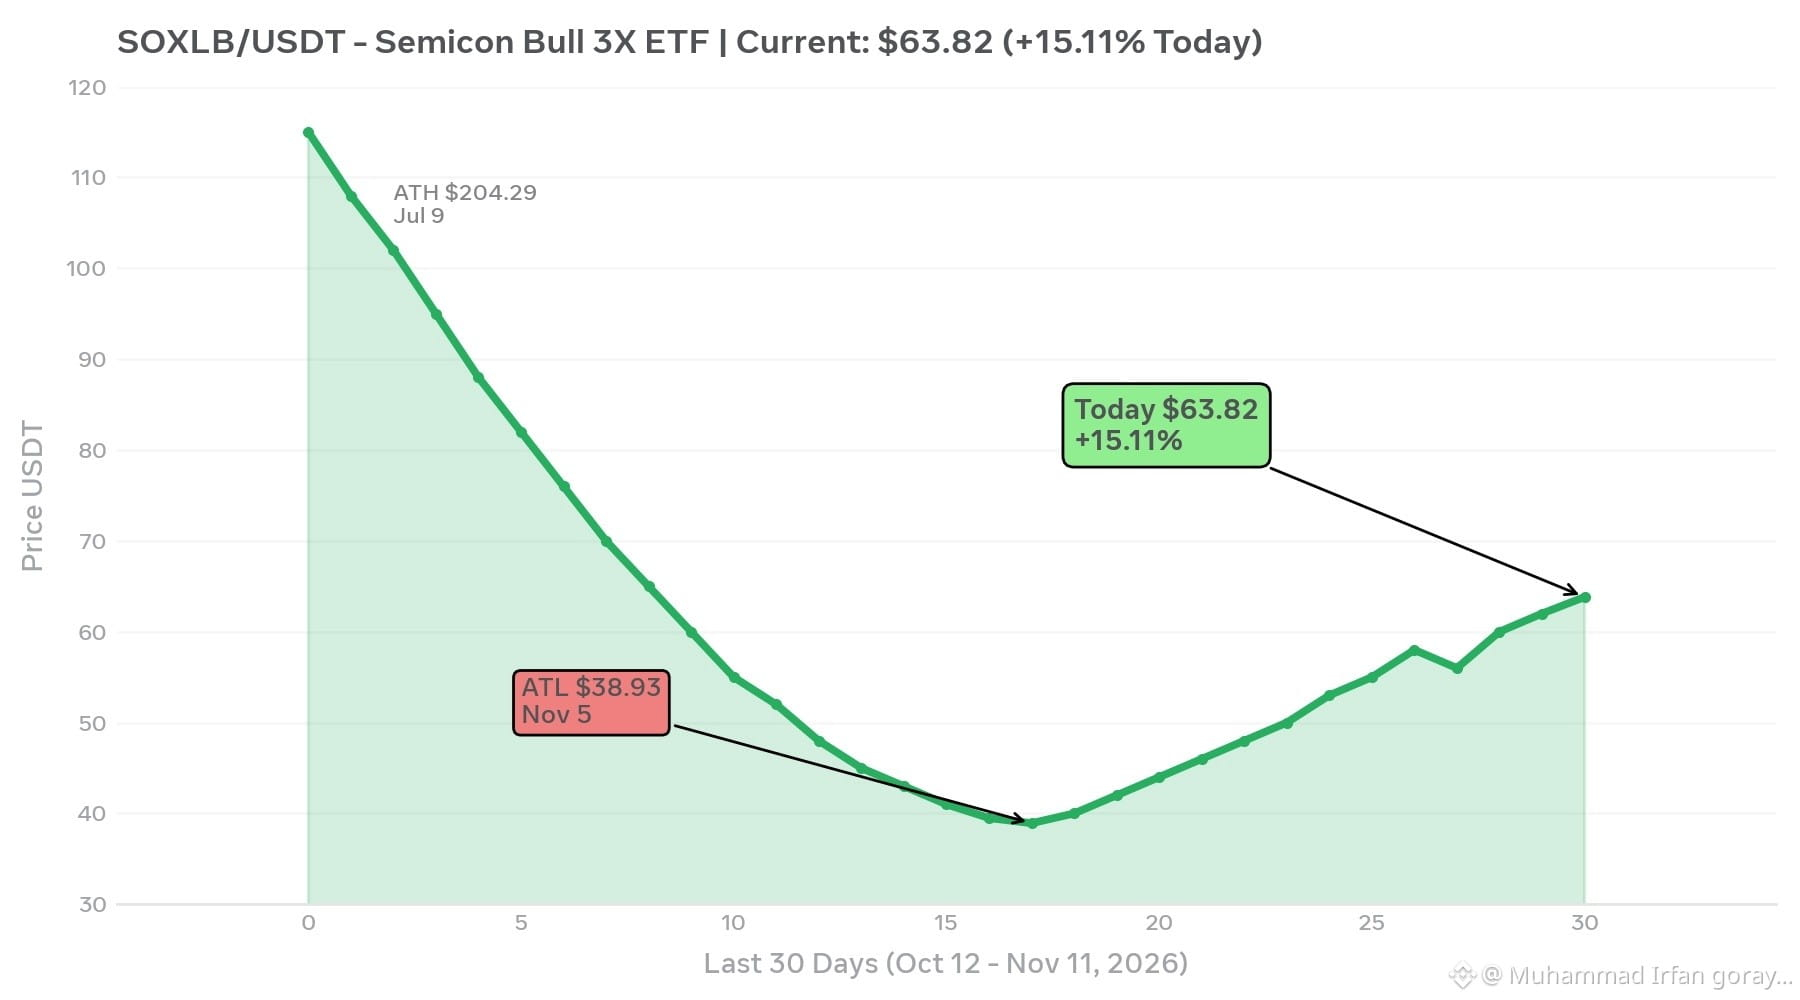
$SOXLB /USDT - Today 11 Nov 2026*
$SOXLB is *Semicon Bull 3X ETF (bStocks Tokenized)* - a 3X leveraged token tracking the SOXL semiconductor ETF.
*Today's Live Data:*
- *Price: $63.82* (+15.11% Today) - Strong bullish day
- *24h Range: $51.07 - $64.95*
- *Binance Volume: $51.48M* (79% of total volume)
- *Total Volume: ∼$72.4M*
- *ATH: $204.29* on July 9, 2026 - Currently -68.34% from peak
- *ATL: $38.93* on Nov 5, 2026 - Recovered +66% from bottom in just 6 days
*Chart Analysis:*
*Trend: Reversal from Bottom*
1. Crashed from $115 to $38.93 in 25 days (-66%)
2. Formed a bottom at $38.93 on Nov 5 and now in strong recovery
3. Up 6 consecutive days from $38 to $63.82
*Key Levels:*
- *Support: $60 / $56 / $50* - If $56 breaks, could drop to $50
- *Resistance: $65 / $70 / $76 / $80*
- *Breakout Target: If $65 breaks with volume, next target $80-85*
*Volatility: 12.14%* daily - Very high because it's 3X leveraged.
*Risk Warning:* This is a 3X leveraged tokenized ETF. It moves 3X faster than the underlying SOXL. Yesterday it was -16%, today +15%. Not for long-term holding, only for short-term trading with strict stop-loss.
#HotCPIDecemberHikePriced #AnthropicRejectsIPODelayValuationinQuestion #CoreWeaveJumps10%On168%RevenueGrowth
$SOXLB /USDT - Today 11 Nov 2026*
$SOXLB is *Semicon Bull 3X ETF (bStocks Tokenized)* - a 3X leveraged token tracking the SOXL semiconductor ETF.
*Today's Live Data:*
- *Price: $63.82* (+15.11% Today) - Strong bullish day
- *24h Range: $51.07 - $64.95*
- *Binance Volume: $51.48M* (79% of total volume)
- *Total Volume: ∼$72.4M*
- *ATH: $204.29* on July 9, 2026 - Currently -68.34% from peak
- *ATL: $38.93* on Nov 5, 2026 - Recovered +66% from bottom in just 6 days
*Chart Analysis:*
*Trend: Reversal from Bottom*
1. Crashed from $115 to $38.93 in 25 days (-66%)
2. Formed a bottom at $38.93 on Nov 5 and now in strong recovery
3. Up 6 consecutive days from $38 to $63.82
*Key Levels:*
- *Support: $60 / $56 / $50* - If $56 breaks, could drop to $50
- *Resistance: $65 / $70 / $76 / $80*
- *Breakout Target: If $65 breaks with volume, next target $80-85*
*Volatility: 12.14%* daily - Very high because it's 3X leveraged.
*Risk Warning:* This is a 3X leveraged tokenized ETF. It moves 3X faster than the underlying SOXL. Yesterday it was -16%, today +15%. Not for long-term holding, only for short-term trading with strict stop-loss.
#HotCPIDecemberHikePriced #AnthropicRejectsIPODelayValuationinQuestion #CoreWeaveJumps10%On168%RevenueGrowth
$SOXLB is *Semicon Bull 3X ETF (bStocks Tokenized)* - a 3X leveraged token tracking the SOXL semiconductor ETF.
*Today's Live Data:*
- *Price: $63.82* (+15.11% Today) - Strong bullish day
- *24h Range: $51.07 - $64.95*
- *Binance Volume: $51.48M* (79% of total volume)
- *Total Volume: ∼$72.4M*
- *ATH: $204.29* on July 9, 2026 - Currently -68.34% from peak
- *ATL: $38.93* on Nov 5, 2026 - Recovered +66% from bottom in just 6 days
*Chart Analysis:*
*Trend: Reversal from Bottom*
1. Crashed from $115 to $38.93 in 25 days (-66%)
2. Formed a bottom at $38.93 on Nov 5 and now in strong recovery
3. Up 6 consecutive days from $38 to $63.82
*Key Levels:*
- *Support: $60 / $56 / $50* - If $56 breaks, could drop to $50
- *Resistance: $65 / $70 / $76 / $80*
- *Breakout Target: If $65 breaks with volume, next target $80-85*
*Volatility: 12.14%* daily - Very high because it's 3X leveraged.
*Risk Warning:* This is a 3X leveraged tokenized ETF. It moves 3X faster than the underlying SOXL. Yesterday it was -16%, today +15%. Not for long-term holding, only for short-term trading with strict stop-loss.
#HotCPIDecemberHikePriced #AnthropicRejectsIPODelayValuationinQuestion #CoreWeaveJumps10%On168%RevenueGrowth
117
·
--
Bullisch
Übersetzung ansehen
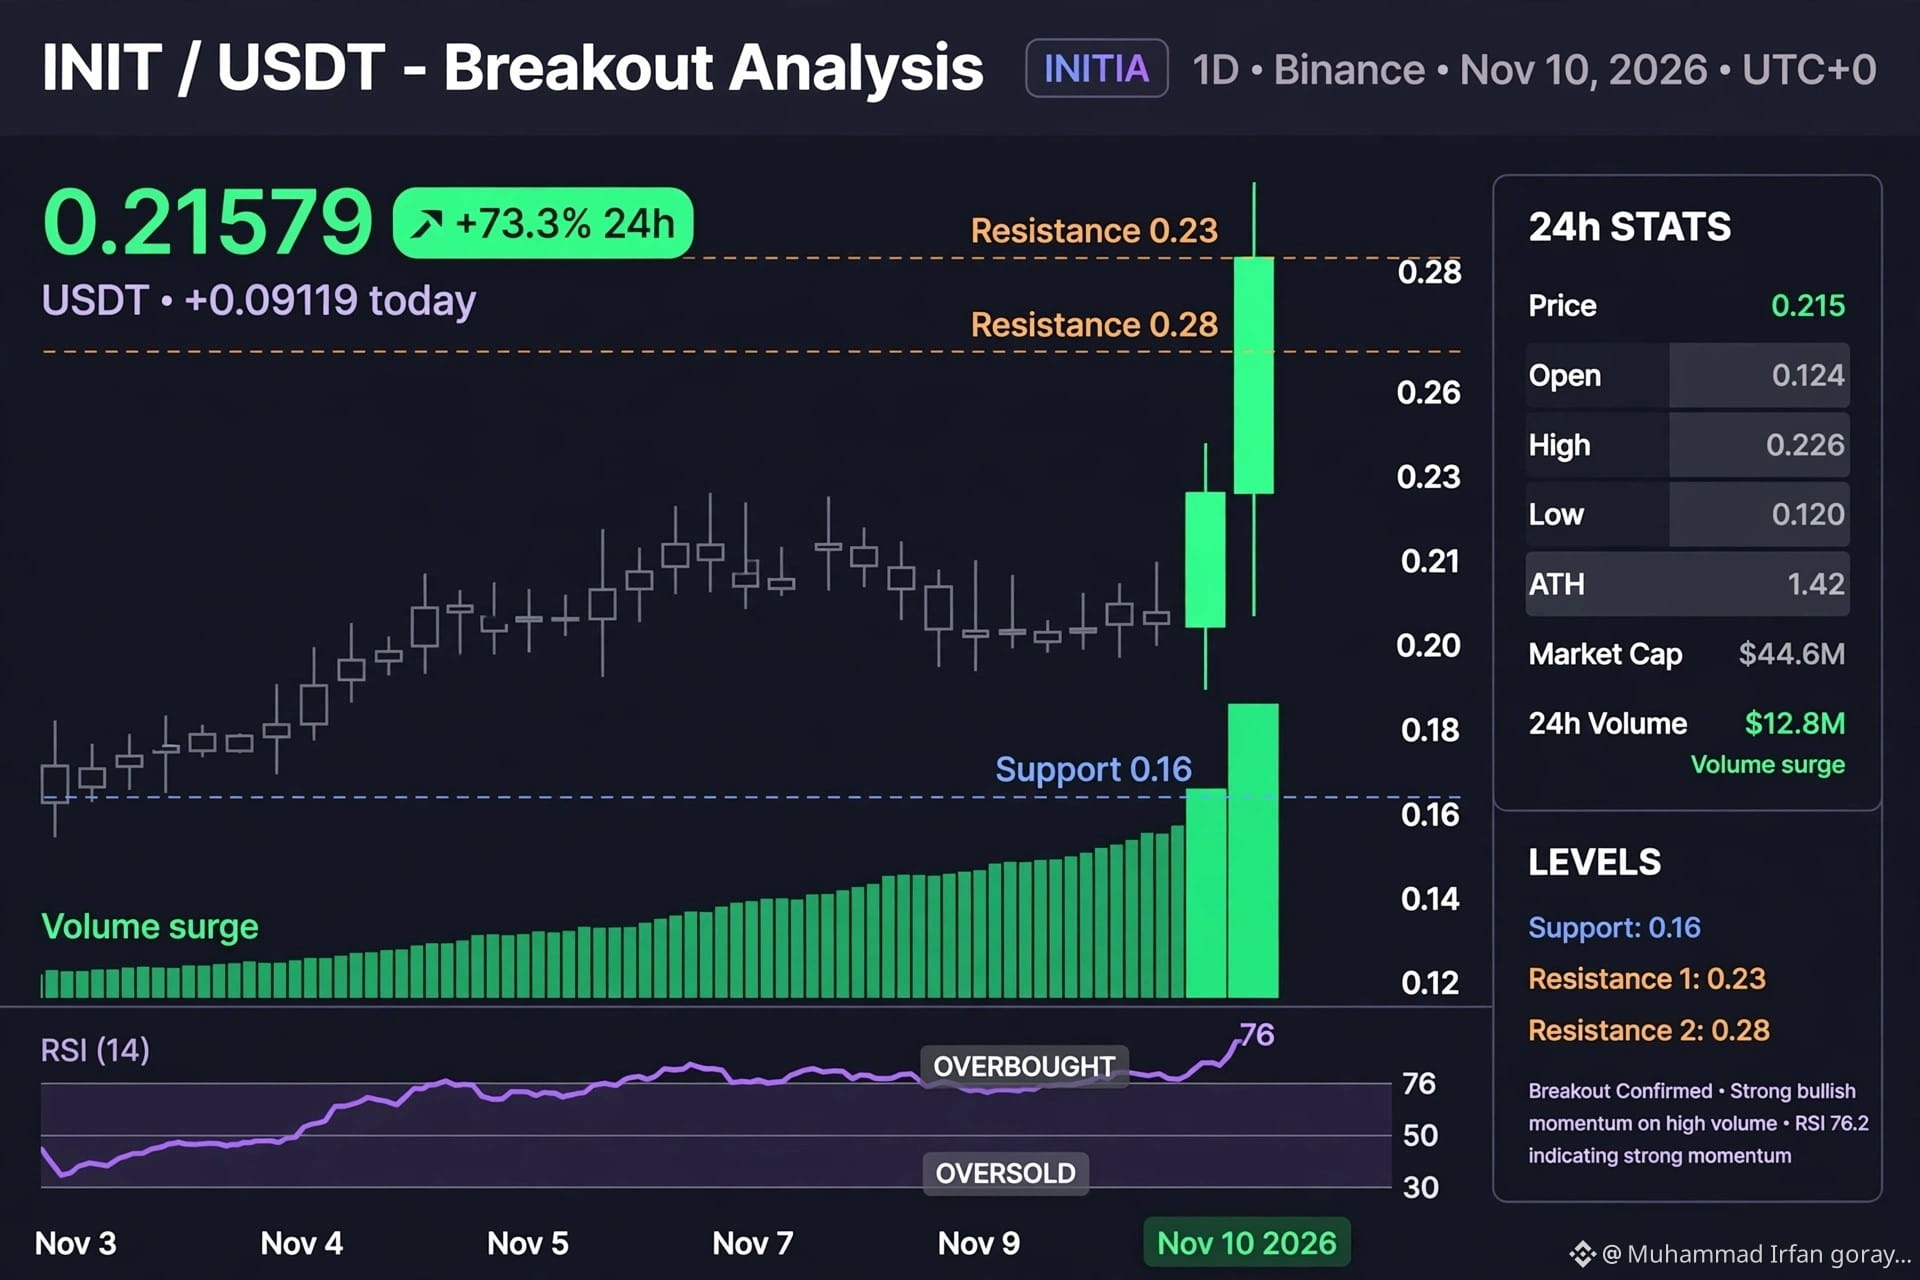
Here is $INIT Analysis in English:
$INIT / USDT - Breakout Analysis - Nov 10, 2026 🚀
*Today's Performance:*
- *Price:* $0.21579
- *24h Gain:* +73.3% 🔥
- *Open:* $0.124 | *High:* $0.226 | *Low:* $0.120 | *Change:* +$0.09119 today
- *Market Cap:* $44.6M | *Volume:* $12.8M+ (Volume Surge)
- *ATH:* $1.42 (May 13, 2025) - Still -85% down from ATH
*Technical Analysis:*
*1. Why the Breakout?*
INIT was stuck in $0.12 - $0.16 range for days. Today with huge volume it pumped to $0.226 on Binance, becoming one of the top gainers. 73% daily candle confirms breakout.
*2. Key Levels:*
- *Support:* $0.16 - Strongest support now, buyers will defend here
- *Resistance 1:* $0.23 - Immediate resistance, rejection possible
- *Resistance 2:* $0.28 - Next target if $0.23 breaks
- *RSI (14):* 76.2 - In Overbought zone, so short-term caution needed
*3. What Next?*
Trend is strongly Bullish with volume surge. Short-term pullback to $0.16 is healthy. If $0.23 breaks with volume, $0.28 is next. Keep stop-loss below $0.14.
> *Note:* This is low-cap, high risk. Don't FOMO. Always DYOR. This is not financial advice. #CPITestsDecemberRateOutlook #BitcoinFiveWeeklyLosses $INIT
Here is $INIT Analysis in English:
$INIT / USDT - Breakout Analysis - Nov 10, 2026 🚀
*Today's Performance:*
- *Price:* $0.21579
- *24h Gain:* +73.3% 🔥
- *Open:* $0.124 | *High:* $0.226 | *Low:* $0.120 | *Change:* +$0.09119 today
- *Market Cap:* $44.6M | *Volume:* $12.8M+ (Volume Surge)
- *ATH:* $1.42 (May 13, 2025) - Still -85% down from ATH
*Technical Analysis:*
*1. Why the Breakout?*
INIT was stuck in $0.12 - $0.16 range for days. Today with huge volume it pumped to $0.226 on Binance, becoming one of the top gainers. 73% daily candle confirms breakout.
*2. Key Levels:*
- *Support:* $0.16 - Strongest support now, buyers will defend here
- *Resistance 1:* $0.23 - Immediate resistance, rejection possible
- *Resistance 2:* $0.28 - Next target if $0.23 breaks
- *RSI (14):* 76.2 - In Overbought zone, so short-term caution needed
*3. What Next?*
Trend is strongly Bullish with volume surge. Short-term pullback to $0.16 is healthy. If $0.23 breaks with volume, $0.28 is next. Keep stop-loss below $0.14.
> *Note:* This is low-cap, high risk. Don't FOMO. Always DYOR. This is not financial advice. #CPITestsDecemberRateOutlook #BitcoinFiveWeeklyLosses $INIT
$INIT / USDT - Breakout Analysis - Nov 10, 2026 🚀
*Today's Performance:*
- *Price:* $0.21579
- *24h Gain:* +73.3% 🔥
- *Open:* $0.124 | *High:* $0.226 | *Low:* $0.120 | *Change:* +$0.09119 today
- *Market Cap:* $44.6M | *Volume:* $12.8M+ (Volume Surge)
- *ATH:* $1.42 (May 13, 2025) - Still -85% down from ATH
*Technical Analysis:*
*1. Why the Breakout?*
INIT was stuck in $0.12 - $0.16 range for days. Today with huge volume it pumped to $0.226 on Binance, becoming one of the top gainers. 73% daily candle confirms breakout.
*2. Key Levels:*
- *Support:* $0.16 - Strongest support now, buyers will defend here
- *Resistance 1:* $0.23 - Immediate resistance, rejection possible
- *Resistance 2:* $0.28 - Next target if $0.23 breaks
- *RSI (14):* 76.2 - In Overbought zone, so short-term caution needed
*3. What Next?*
Trend is strongly Bullish with volume surge. Short-term pullback to $0.16 is healthy. If $0.23 breaks with volume, $0.28 is next. Keep stop-loss below $0.14.
> *Note:* This is low-cap, high risk. Don't FOMO. Always DYOR. This is not financial advice. #CPITestsDecemberRateOutlook #BitcoinFiveWeeklyLosses $INIT
181
Artikel
Übersetzung ansehen
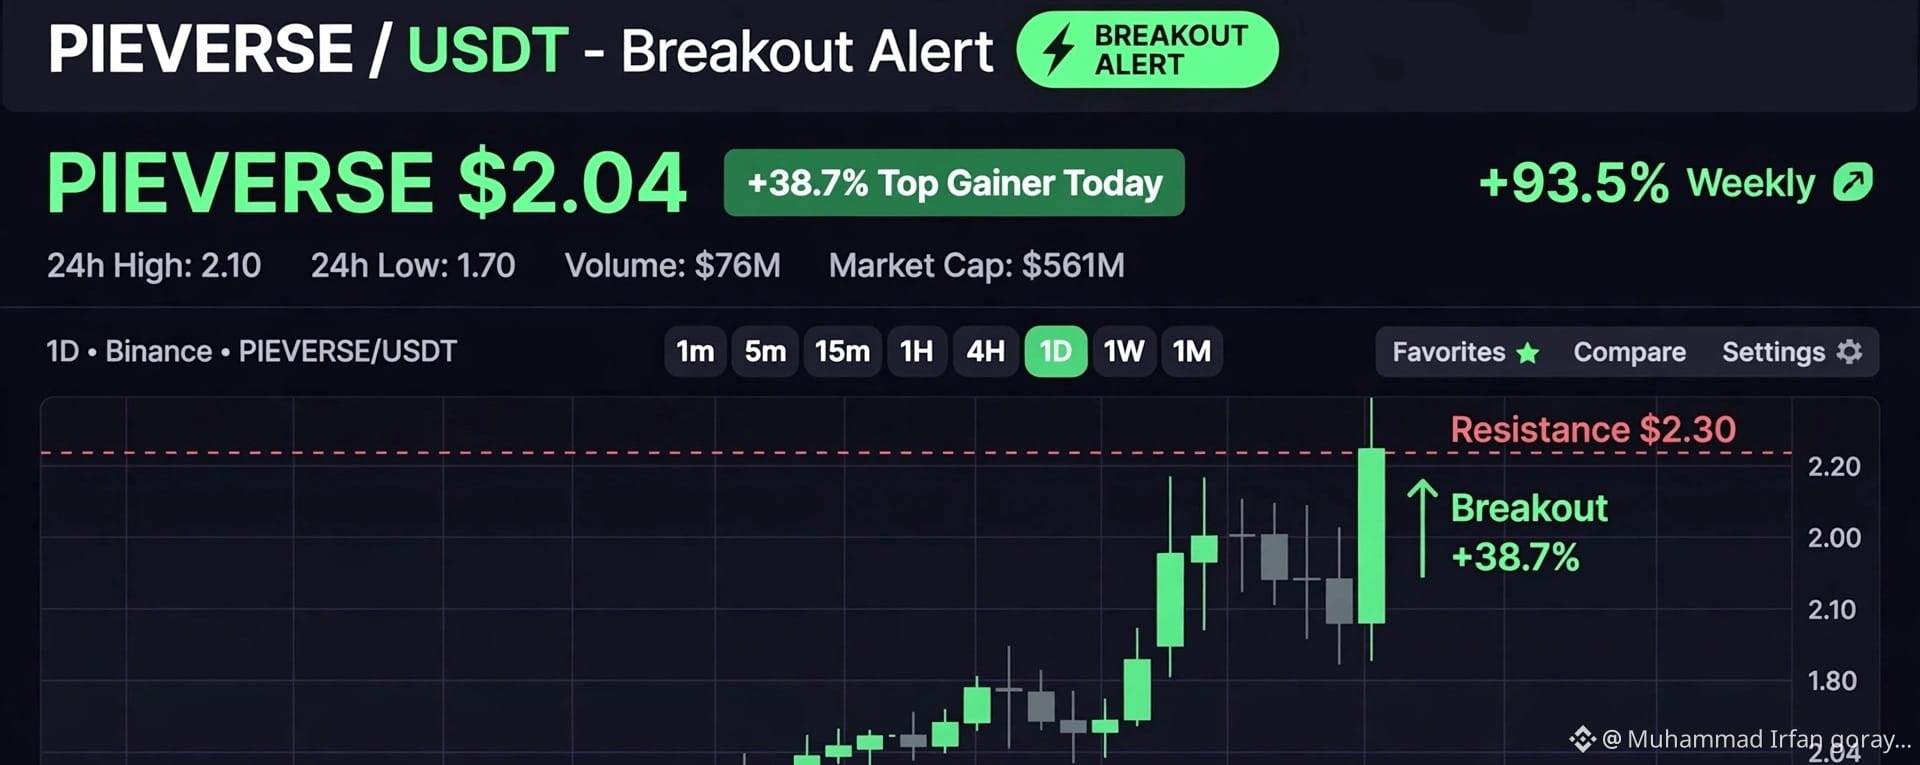
Today's Hero: PIEVERSE / USDT 🚀Today's Hero:$PIEVERSE / USDT 🚀
Market is down today, but this new coin is leading!
On Nov 10, 2026, while Bitcoin is in Fear, $PIEVERSE has outperformed everything. It is today's top gainer.
Latest Data:
- Price: $2.04
- 24h Gain: +38.7% ( #1 Today )
- Weekly Gain: +93.5%
- Market Cap: $561M
- 24h Volume: $76M
Technical Analysis:
1. Why the Breakout Happened?
$PIEVERSE was accumulating around $1.50 for days. Today with huge volume it pumped to $2.10 and is trying to break the $2.30 resistance.
2. Key Levels:
- Support: $1.80 - This is now the strongest support. If price drops, buyers will return here.
- Resistance: $2.30 - If this breaks, next target could be $2.60
- RSI: 72.3 - In Overbought zone, so need to be careful.
3. What Next?
This pump is due to new listing and community hype. Short-term correction is possible because RSI is very high. But the trend is still strongly Bullish.
> Note: This is a new and small-cap coin, so risk is very high. Don't FOMO. Always DYOR and keep stop-loss below $1.70.
Not financial advice.
#NvidiaInvestigatesAfterHuang’sAffairApology #CPITestsDecemberRateOutlook #AnthropicRejectsIPODelayValuationinQuestion #US-IranTalksFuelStrongStockMarketRebound
Today's Hero: PIEVERSE / USDT 🚀
Today's Hero:$PIEVERSE / USDT 🚀
Market is down today, but this new coin is leading!
On Nov 10, 2026, while Bitcoin is in Fear, $PIEVERSE has outperformed everything. It is today's top gainer.
Latest Data:
- Price: $2.04
- 24h Gain: +38.7% ( #1 Today )
- Weekly Gain: +93.5%
- Market Cap: $561M
- 24h Volume: $76M
Technical Analysis:
1. Why the Breakout Happened?
$PIEVERSE was accumulating around $1.50 for days. Today with huge volume it pumped to $2.10 and is trying to break the $2.30 resistance.
2. Key Levels:
- Support: $1.80 - This is now the strongest support. If price drops, buyers will return here.
- Resistance: $2.30 - If this breaks, next target could be $2.60
- RSI: 72.3 - In Overbought zone, so need to be careful.
3. What Next?
This pump is due to new listing and community hype. Short-term correction is possible because RSI is very high. But the trend is still strongly Bullish.
> Note: This is a new and small-cap coin, so risk is very high. Don't FOMO. Always DYOR and keep stop-loss below $1.70.
Not financial advice.
#NvidiaInvestigatesAfterHuang’sAffairApology #CPITestsDecemberRateOutlook #AnthropicRejectsIPODelayValuationinQuestion #US-IranTalksFuelStrongStockMarketRebound
Market is down today, but this new coin is leading!
On Nov 10, 2026, while Bitcoin is in Fear, $PIEVERSE has outperformed everything. It is today's top gainer.
Latest Data:
- Price: $2.04
- 24h Gain: +38.7% ( #1 Today )
- Weekly Gain: +93.5%
- Market Cap: $561M
- 24h Volume: $76M
Technical Analysis:
1. Why the Breakout Happened?
$PIEVERSE was accumulating around $1.50 for days. Today with huge volume it pumped to $2.10 and is trying to break the $2.30 resistance.
2. Key Levels:
- Support: $1.80 - This is now the strongest support. If price drops, buyers will return here.
- Resistance: $2.30 - If this breaks, next target could be $2.60
- RSI: 72.3 - In Overbought zone, so need to be careful.
3. What Next?
This pump is due to new listing and community hype. Short-term correction is possible because RSI is very high. But the trend is still strongly Bullish.
> Note: This is a new and small-cap coin, so risk is very high. Don't FOMO. Always DYOR and keep stop-loss below $1.70.
Not financial advice.
#NvidiaInvestigatesAfterHuang’sAffairApology #CPITestsDecemberRateOutlook #AnthropicRejectsIPODelayValuationinQuestion #US-IranTalksFuelStrongStockMarketRebound
1
174
Artikel
Übersetzung ansehen
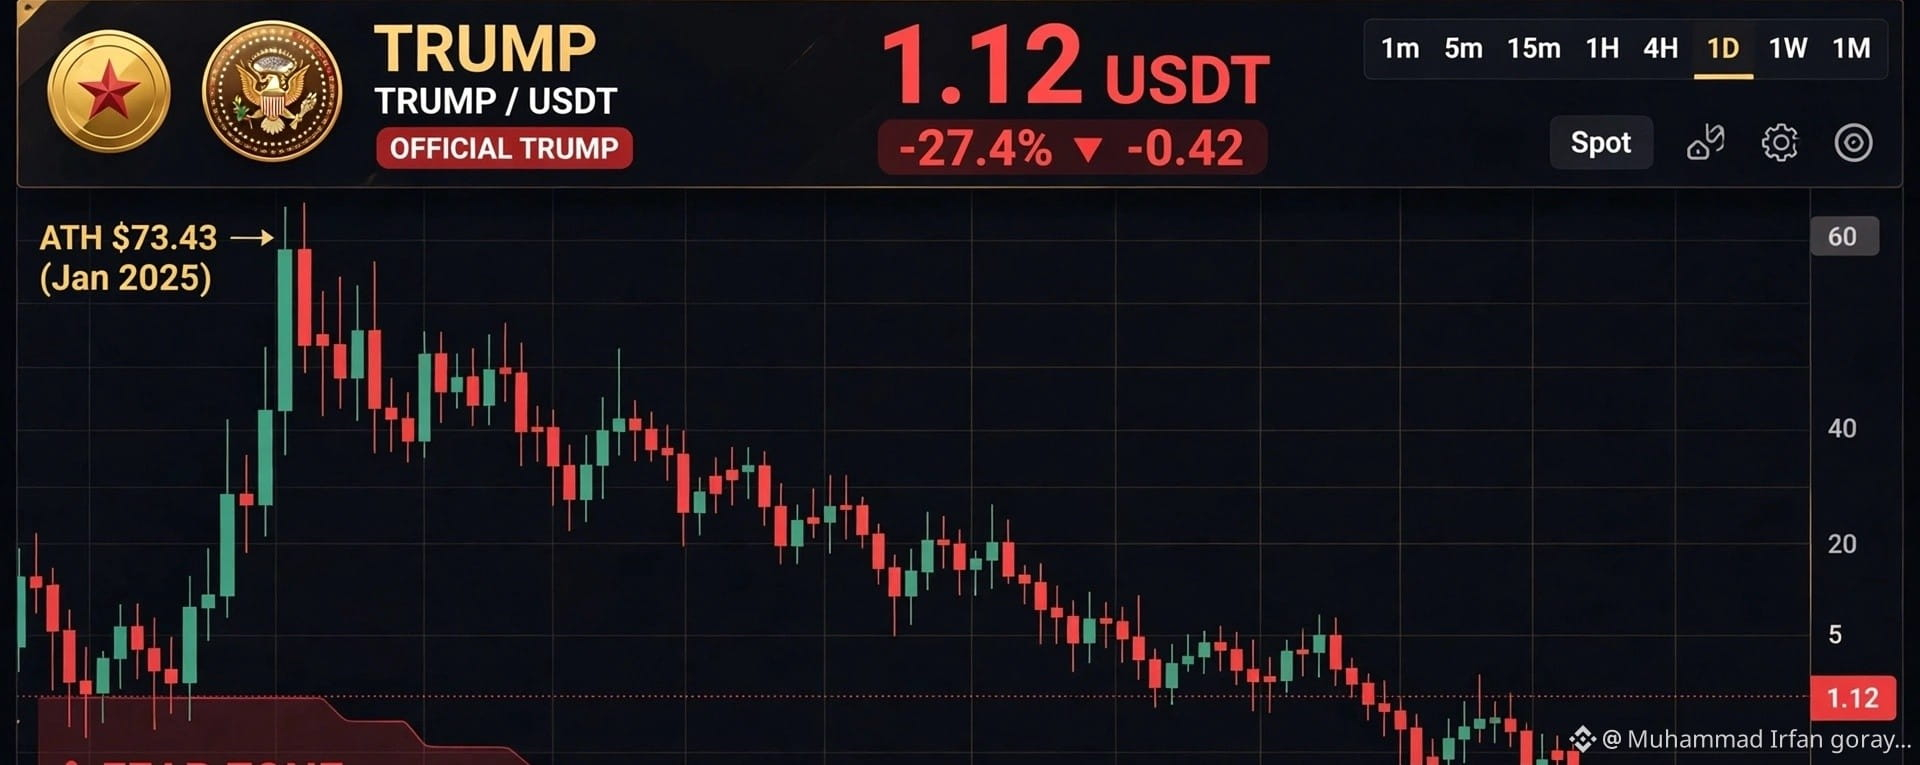
🚨 $TRUMP TOKEN: HISTORY REPEATS ITSELF?From $76 to $1.12!
When $TRUMP was at $76, everyone was rushing to buy. Today, at $1.12, the market is quiet. Is this a second chance or more downside ahead?
Current Stats - Nov 10, 2026:
- Price: $1.12 USDT (Binance)
- 24h: -3.7% | 30D: -40.85% | From ATH: -98.5%
- ATH: $73.43 on Jan 19, 2025
- Market Cap: $314M | 24h Volume: $99M
- All-Time Low: $1.11 (Today)
Technical Analysis:
The chart shows a continuous downtrend since February. RSI is at 18.2 - extremely oversold. TRUMP is now trading at its historical bottom zone $1.10-$1.12. This is the ultimate Fear Zone.
Opportunity vs Risk:
Volume is still very high at $99M, which means interest is alive. Memecoins often bottom when retail is silent. But risk is huge - if $1.10 support breaks, next level could be $0.60.
Smart investors study history. This could be a second chance for those who missed $76, but only with proper risk management.
💡 DYOR - Not financial advice. Invest only what you can afford to lose.
#TRUMP #TrumpToken #CryptoOpportunity #Memecoins $PEPE $FLOKI
{spot}(PEPEUSDT)
🚨 $TRUMP TOKEN: HISTORY REPEATS ITSELF?
From $76 to $1.12!
When $TRUMP was at $76, everyone was rushing to buy. Today, at $1.12, the market is quiet. Is this a second chance or more downside ahead?
Current Stats - Nov 10, 2026:
- Price: $1.12 USDT (Binance)
- 24h: -3.7% | 30D: -40.85% | From ATH: -98.5%
- ATH: $73.43 on Jan 19, 2025
- Market Cap: $314M | 24h Volume: $99M
- All-Time Low: $1.11 (Today)
Technical Analysis:
The chart shows a continuous downtrend since February. RSI is at 18.2 - extremely oversold. TRUMP is now trading at its historical bottom zone $1.10-$1.12. This is the ultimate Fear Zone.
Opportunity vs Risk:
Volume is still very high at $99M, which means interest is alive. Memecoins often bottom when retail is silent. But risk is huge - if $1.10 support breaks, next level could be $0.60.
Smart investors study history. This could be a second chance for those who missed $76, but only with proper risk management.
💡 DYOR - Not financial advice. Invest only what you can afford to lose.
#TRUMP #TrumpToken #CryptoOpportunity #Memecoins $PEPE $FLOKI
When $TRUMP was at $76, everyone was rushing to buy. Today, at $1.12, the market is quiet. Is this a second chance or more downside ahead?
Current Stats - Nov 10, 2026:
- Price: $1.12 USDT (Binance)
- 24h: -3.7% | 30D: -40.85% | From ATH: -98.5%
- ATH: $73.43 on Jan 19, 2025
- Market Cap: $314M | 24h Volume: $99M
- All-Time Low: $1.11 (Today)
Technical Analysis:
The chart shows a continuous downtrend since February. RSI is at 18.2 - extremely oversold. TRUMP is now trading at its historical bottom zone $1.10-$1.12. This is the ultimate Fear Zone.
Opportunity vs Risk:
Volume is still very high at $99M, which means interest is alive. Memecoins often bottom when retail is silent. But risk is huge - if $1.10 support breaks, next level could be $0.60.
Smart investors study history. This could be a second chance for those who missed $76, but only with proper risk management.
💡 DYOR - Not financial advice. Invest only what you can afford to lose.
#TRUMP #TrumpToken #CryptoOpportunity #Memecoins $PEPE $FLOKI
369
Übersetzung ansehen
$BTC /USDT Analysis - Nov 10, 2026*
*Current Price: $74,500 (-0.80% today)*
Bitcoin is under pressure after dropping to a 3-month low of $73,510 yesterday. The market saw around $1B in liquidations and $1.28B in ETF outflows last week.
*1. Technical Analysis*
- *Support:* $73,500 - $74,000. This is the critical zone. If this holds, buyers can push it up. If it breaks, next target is $70,000 - $71,500.
- *Resistance:* $75,800 - $76,000 is the first hurdle. BTC needs a daily close above $74,853 (daily pivot) to confirm a real recovery.
- *Trend:* Bearish on 1H and Daily. Price is below all major EMAs.
*2. Indicators*
- *RSI (14):* 35 - Near oversold, showing bearish momentum but close to bottom.
- *Fear & Greed Index:* 29 - Fear zone. Extreme fear often comes near local bottoms.
- *MACD:* -210, Bearish but histogram narrowing on lower timeframes.
*3. Outlook for Today*
Expect sideways movement between $73,500 and $76,000 before US CPI data tomorrow.
*Strategy (Educational only):* Don't rush for Longs. Wait for support confirmation at $73,500 with a stop-loss below $71,500. Risk only 1-2%.
> This is not financial advice, just market education.
Want the same for ETH or SOL? #NvidiaInvestigatesAfterHuang’sAffairApology #CPITestsDecemberRateOutlook #AnthropicRejectsIPODelayValuationinQuestion #US-IranTalksFuelStrongStockMarketRebound
$BTC /USDT Analysis - Nov 10, 2026*
*Current Price: $74,500 (-0.80% today)*
Bitcoin is under pressure after dropping to a 3-month low of $73,510 yesterday. The market saw around $1B in liquidations and $1.28B in ETF outflows last week.
*1. Technical Analysis*
- *Support:* $73,500 - $74,000. This is the critical zone. If this holds, buyers can push it up. If it breaks, next target is $70,000 - $71,500.
- *Resistance:* $75,800 - $76,000 is the first hurdle. BTC needs a daily close above $74,853 (daily pivot) to confirm a real recovery.
- *Trend:* Bearish on 1H and Daily. Price is below all major EMAs.
*2. Indicators*
- *RSI (14):* 35 - Near oversold, showing bearish momentum but close to bottom.
- *Fear & Greed Index:* 29 - Fear zone. Extreme fear often comes near local bottoms.
- *MACD:* -210, Bearish but histogram narrowing on lower timeframes.
*3. Outlook for Today*
Expect sideways movement between $73,500 and $76,000 before US CPI data tomorrow.
*Strategy (Educational only):* Don't rush for Longs. Wait for support confirmation at $73,500 with a stop-loss below $71,500. Risk only 1-2%.
> This is not financial advice, just market education.
Want the same for ETH or SOL? #NvidiaInvestigatesAfterHuang’sAffairApology #CPITestsDecemberRateOutlook #AnthropicRejectsIPODelayValuationinQuestion #US-IranTalksFuelStrongStockMarketRebound
*Current Price: $74,500 (-0.80% today)*
Bitcoin is under pressure after dropping to a 3-month low of $73,510 yesterday. The market saw around $1B in liquidations and $1.28B in ETF outflows last week.
*1. Technical Analysis*
- *Support:* $73,500 - $74,000. This is the critical zone. If this holds, buyers can push it up. If it breaks, next target is $70,000 - $71,500.
- *Resistance:* $75,800 - $76,000 is the first hurdle. BTC needs a daily close above $74,853 (daily pivot) to confirm a real recovery.
- *Trend:* Bearish on 1H and Daily. Price is below all major EMAs.
*2. Indicators*
- *RSI (14):* 35 - Near oversold, showing bearish momentum but close to bottom.
- *Fear & Greed Index:* 29 - Fear zone. Extreme fear often comes near local bottoms.
- *MACD:* -210, Bearish but histogram narrowing on lower timeframes.
*3. Outlook for Today*
Expect sideways movement between $73,500 and $76,000 before US CPI data tomorrow.
*Strategy (Educational only):* Don't rush for Longs. Wait for support confirmation at $73,500 with a stop-loss below $71,500. Risk only 1-2%.
> This is not financial advice, just market education.
Want the same for ETH or SOL? #NvidiaInvestigatesAfterHuang’sAffairApology #CPITestsDecemberRateOutlook #AnthropicRejectsIPODelayValuationinQuestion #US-IranTalksFuelStrongStockMarketRebound
71
Übersetzung ansehen
*Bitcoin Latest Analysis - Nov 9, 2026*
*Current Price: $74,500 (-1.7% / 24h)*
$BTC
{spot}(BTCUSDT)
touched 3-month low $73,510 today before small bounce. Trading below daily pivot $74,853 and all daily EMAs - bearish short-term. ddcf44f6
*Key Data Today:*
- *Sentiment:* Fear & Greed 29 - Fear territory
- *Volatility:* 1-week IV jumped to 43%, puts at $70k-$72k most active
- *Liquidations:* ∼$1 Billion, mostly longs
- *ETF Flows:* $1.28B net outflow last week, $412M on Friday alone - institutional caution 44f63534fea7
*Technical Levels:*
- *Support:* $73,500 - $74,000 (Daily low + 200-day SMA ~ $73,200)
- *Resistance:* $75,800 - $76,000 first, then $77,375
- *RSI:* 35.6 Daily - near oversold but not yet ddcfaa4844f6
*Short Outlook:*
Base case for next 24h is sideways $73,500 - $75,900 ahead of US CPI Tuesday. Need daily close above $74,853 to confirm recovery. If $73.5k breaks, next target $65k-$67k. ddcf44f6
Not financial advice - just market update.
*Bitcoin Latest Analysis - Nov 9, 2026*
*Current Price: $74,500 (-1.7% / 24h)*
$BTC
touched 3-month low $73,510 today before small bounce. Trading below daily pivot $74,853 and all daily EMAs - bearish short-term. ddcf44f6
*Key Data Today:*
- *Sentiment:* Fear & Greed 29 - Fear territory
- *Volatility:* 1-week IV jumped to 43%, puts at $70k-$72k most active
- *Liquidations:* ∼$1 Billion, mostly longs
- *ETF Flows:* $1.28B net outflow last week, $412M on Friday alone - institutional caution 44f63534fea7
*Technical Levels:*
- *Support:* $73,500 - $74,000 (Daily low + 200-day SMA ~ $73,200)
- *Resistance:* $75,800 - $76,000 first, then $77,375
- *RSI:* 35.6 Daily - near oversold but not yet ddcfaa4844f6
*Short Outlook:*
Base case for next 24h is sideways $73,500 - $75,900 ahead of US CPI Tuesday. Need daily close above $74,853 to confirm recovery. If $73.5k breaks, next target $65k-$67k. ddcf44f6
Not financial advice - just market update.
*Current Price: $74,500 (-1.7% / 24h)*
$BTC
touched 3-month low $73,510 today before small bounce. Trading below daily pivot $74,853 and all daily EMAs - bearish short-term. ddcf44f6
*Key Data Today:*
- *Sentiment:* Fear & Greed 29 - Fear territory
- *Volatility:* 1-week IV jumped to 43%, puts at $70k-$72k most active
- *Liquidations:* ∼$1 Billion, mostly longs
- *ETF Flows:* $1.28B net outflow last week, $412M on Friday alone - institutional caution 44f63534fea7
*Technical Levels:*
- *Support:* $73,500 - $74,000 (Daily low + 200-day SMA ~ $73,200)
- *Resistance:* $75,800 - $76,000 first, then $77,375
- *RSI:* 35.6 Daily - near oversold but not yet ddcfaa4844f6
*Short Outlook:*
Base case for next 24h is sideways $73,500 - $75,900 ahead of US CPI Tuesday. Need daily close above $74,853 to confirm recovery. If $73.5k breaks, next target $65k-$67k. ddcf44f6
Not financial advice - just market update.
74

Artikel
Übersetzung ansehen
Bitcoin (BTC): Is This a Buying Opportunity or a Market WarningBitcoin is under market pressure, with prices moving down and investors acting cautiously. But remember, every market correction can also bring new opportunities. Smart traders follow market trends, manage their risk, and make decisions with patience. The big question: Will Bitcoin recover or slide further? Are you bullish or bearish on BTC? Share your opinion in the comments! 🚀 #Bitcoin, #BTC, #BinanceSquare, #CryptoNews, #CryptoMarket, #trading. $BTC
Bitcoin (BTC): Is This a Buying Opportunity or a Market Warning
Bitcoin is under market pressure, with prices moving down and investors acting cautiously. But remember, every market correction can also bring new opportunities. Smart traders follow market trends, manage their risk, and make decisions with patience. The big question: Will Bitcoin recover or slide further? Are you bullish or bearish on BTC? Share your opinion in the comments! 🚀 #Bitcoin, #BTC, #BinanceSquare, #CryptoNews, #CryptoMarket, #trading. $BTC
95
Anmelden und weiter Inhalte entdecken
Krypto-Nutzer weltweit auf Binance Square kennenlernen
⚡️ Bleib in Sachen Krypto stets am Puls.
💬 Die weltgrößte Kryptobörse vertraut darauf.
👍 Erhalte verlässliche Einblicke von verifizierten Creators.
E-Mail-Adresse/Telefonnummer
Trendthemen
HuangRisksOusterOverReportedAffairWithSubordinate
3,545 Aufrufe
57 Kommentare
Nvidia-Vorstand berät über Jensen Huangs Zukunft, während sich die Krise verschärft
Binance News
·3 Likes
·1.5k Aufrufe
AnthropicRejectsIPODelayValuationinQuestion
423,749 Aufrufe
3,603 Kommentare
CoreWeaveJumps10%On168%RevenueGrowth
45,010 Aufrufe
670 Kommentare