
User-a71b6fc1
3 Beiträge

User-a71b6fc1
Melden
Nutzer blockieren
Trade eröffnen
5 Tage
0 Following
0 Follower
0 Like gegeben
Beiträge
Portfolio
🚨 BITCOIN UNTER DRUCK: KOMMT EINE ERHOLUNG ODER STEHT EIN WEITERER RÜCKGANG BEVOR? 📉
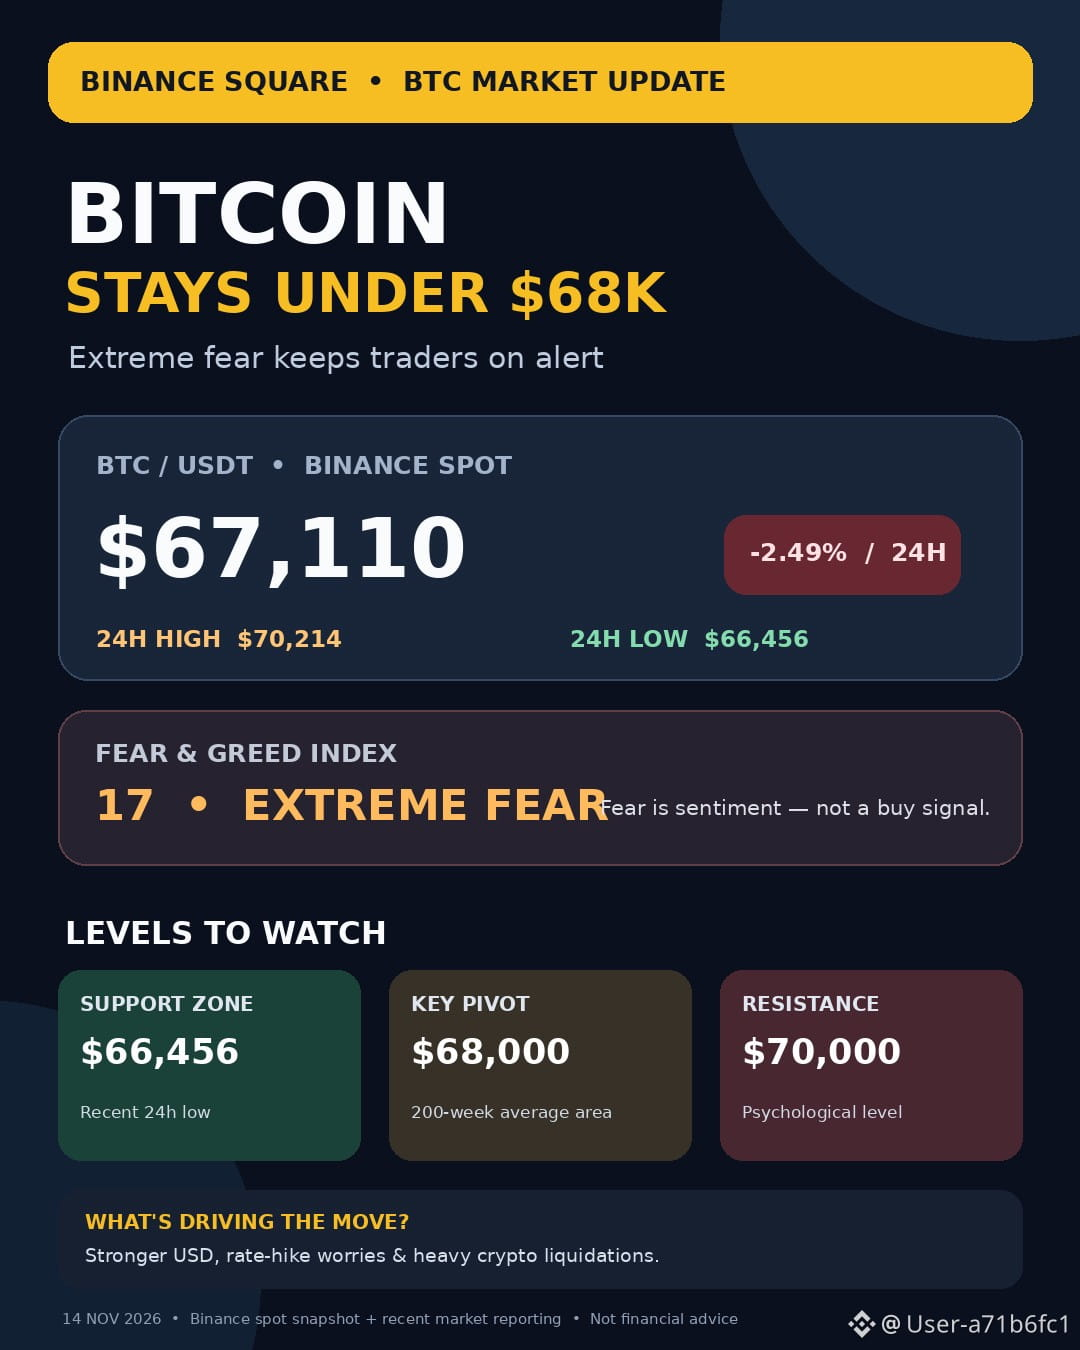
Bitcoin steht erneut unter Verkaufsdruck. BTC wird bei etwa 67.168 $ gehandelt und liegt damit in den letzten 24 Stunden rund 2,53 % im Minus.
Anleger sollten jedoch auf ein wichtiges Zeichen achten, ein wichtiges Zeichen, ein wichtiges Zeichen, ein wichtiges Zeichen, ein wichtiges Zeichen: Die Marktstimmung hat den Bereich „Extreme Angst“ erreicht (17).
🔍 WICHTIGE KURSLEVEL, DIE ES ZU BEOBACHTEN GILT
🟢 66.456 $ – Tagestief: Beobachte, ob die Käufer diesen Bereich verteidigen.
🔴 68.900 $ – Erholungsbereich: Ein Anstieg über dieses Niveau könnte auf eine Verbesserung des kurzfristigen Momentums hindeuten.
🔴 70.214 $ – Tageshoch: Ein Durchbruch über dieses Niveau könnte das Erholungsszenario stärken.
📊 DREI MÖGLICHE SZENARIEN
1️⃣ Bullishes Szenario: Die Käufer verteidigen das jüngste Tief und BTC beginnt sich in Richtung 68.900 $ zu erholen.
2️⃣ Bärisches Szenario: Der Verkaufsdruck hält an und BTC fällt unter das heutige Tief.
3️⃣ Seitwärtsszenario: Bitcoin konsolidiert, während die Händler auf eine klarere Richtung warten.
💡 MEIN FAZIT
Extreme Angst bedeutet nicht automatisch, dass Bitcoin seinen Tiefpunkt erreicht hat. Händler sollten das Handelsvolumen und bestätigende Signale beobachten, bevor sie Entscheidungen treffen.
🔥 FRAGE AN DIE COMMUNITY:
Glaubst du, dass sich BTC über 70.000 $ erholen wird, oder drücken die Verkäufer den Kurs zuerst unter 66.000 $?
Teile deine Analyse in den Kommentaren!
#Bitcoin #BTC #Kryptomarkt #BinanceSquare #Cry ptoAnalysis
🚨 BITCOIN UNTER DRUCK: KOMMT EINE ERHOLUNG ODER STEHT EIN WEITERER RÜCKGANG BEVOR? 📉
Bitcoin steht erneut unter Verkaufsdruck. BTC wird bei etwa 67.168 $ gehandelt und liegt damit in den letzten 24 Stunden rund 2,53 % im Minus.
Anleger sollten jedoch auf ein wichtiges Zeichen achten, ein wichtiges Zeichen, ein wichtiges Zeichen, ein wichtiges Zeichen, ein wichtiges Zeichen: Die Marktstimmung hat den Bereich „Extreme Angst“ erreicht (17).
🔍 WICHTIGE KURSLEVEL, DIE ES ZU BEOBACHTEN GILT
🟢 66.456 $ – Tagestief: Beobachte, ob die Käufer diesen Bereich verteidigen.
🔴 68.900 $ – Erholungsbereich: Ein Anstieg über dieses Niveau könnte auf eine Verbesserung des kurzfristigen Momentums hindeuten.
🔴 70.214 $ – Tageshoch: Ein Durchbruch über dieses Niveau könnte das Erholungsszenario stärken.
📊 DREI MÖGLICHE SZENARIEN
1️⃣ Bullishes Szenario: Die Käufer verteidigen das jüngste Tief und BTC beginnt sich in Richtung 68.900 $ zu erholen.
2️⃣ Bärisches Szenario: Der Verkaufsdruck hält an und BTC fällt unter das heutige Tief.
3️⃣ Seitwärtsszenario: Bitcoin konsolidiert, während die Händler auf eine klarere Richtung warten.
💡 MEIN FAZIT
Extreme Angst bedeutet nicht automatisch, dass Bitcoin seinen Tiefpunkt erreicht hat. Händler sollten das Handelsvolumen und bestätigende Signale beobachten, bevor sie Entscheidungen treffen.
🔥 FRAGE AN DIE COMMUNITY:
Glaubst du, dass sich BTC über 70.000 $ erholen wird, oder drücken die Verkäufer den Kurs zuerst unter 66.000 $?
Teile deine Analyse in den Kommentaren!
#Bitcoin #BTC #Kryptomarkt #BinanceSquare #Cry ptoAnalysis
Bitcoin steht erneut unter Verkaufsdruck. BTC wird bei etwa 67.168 $ gehandelt und liegt damit in den letzten 24 Stunden rund 2,53 % im Minus.
Anleger sollten jedoch auf ein wichtiges Zeichen achten, ein wichtiges Zeichen, ein wichtiges Zeichen, ein wichtiges Zeichen, ein wichtiges Zeichen: Die Marktstimmung hat den Bereich „Extreme Angst“ erreicht (17).
🔍 WICHTIGE KURSLEVEL, DIE ES ZU BEOBACHTEN GILT
🟢 66.456 $ – Tagestief: Beobachte, ob die Käufer diesen Bereich verteidigen.
🔴 68.900 $ – Erholungsbereich: Ein Anstieg über dieses Niveau könnte auf eine Verbesserung des kurzfristigen Momentums hindeuten.
🔴 70.214 $ – Tageshoch: Ein Durchbruch über dieses Niveau könnte das Erholungsszenario stärken.
📊 DREI MÖGLICHE SZENARIEN
1️⃣ Bullishes Szenario: Die Käufer verteidigen das jüngste Tief und BTC beginnt sich in Richtung 68.900 $ zu erholen.
2️⃣ Bärisches Szenario: Der Verkaufsdruck hält an und BTC fällt unter das heutige Tief.
3️⃣ Seitwärtsszenario: Bitcoin konsolidiert, während die Händler auf eine klarere Richtung warten.
💡 MEIN FAZIT
Extreme Angst bedeutet nicht automatisch, dass Bitcoin seinen Tiefpunkt erreicht hat. Händler sollten das Handelsvolumen und bestätigende Signale beobachten, bevor sie Entscheidungen treffen.
🔥 FRAGE AN DIE COMMUNITY:
Glaubst du, dass sich BTC über 70.000 $ erholen wird, oder drücken die Verkäufer den Kurs zuerst unter 66.000 $?
Teile deine Analyse in den Kommentaren!
#Bitcoin #BTC #Kryptomarkt #BinanceSquare #Cry ptoAnalysis
71
Übersetzung ansehen
Bitcoin Under Pressure: Is the $67K Support Zone About to Be Tested?
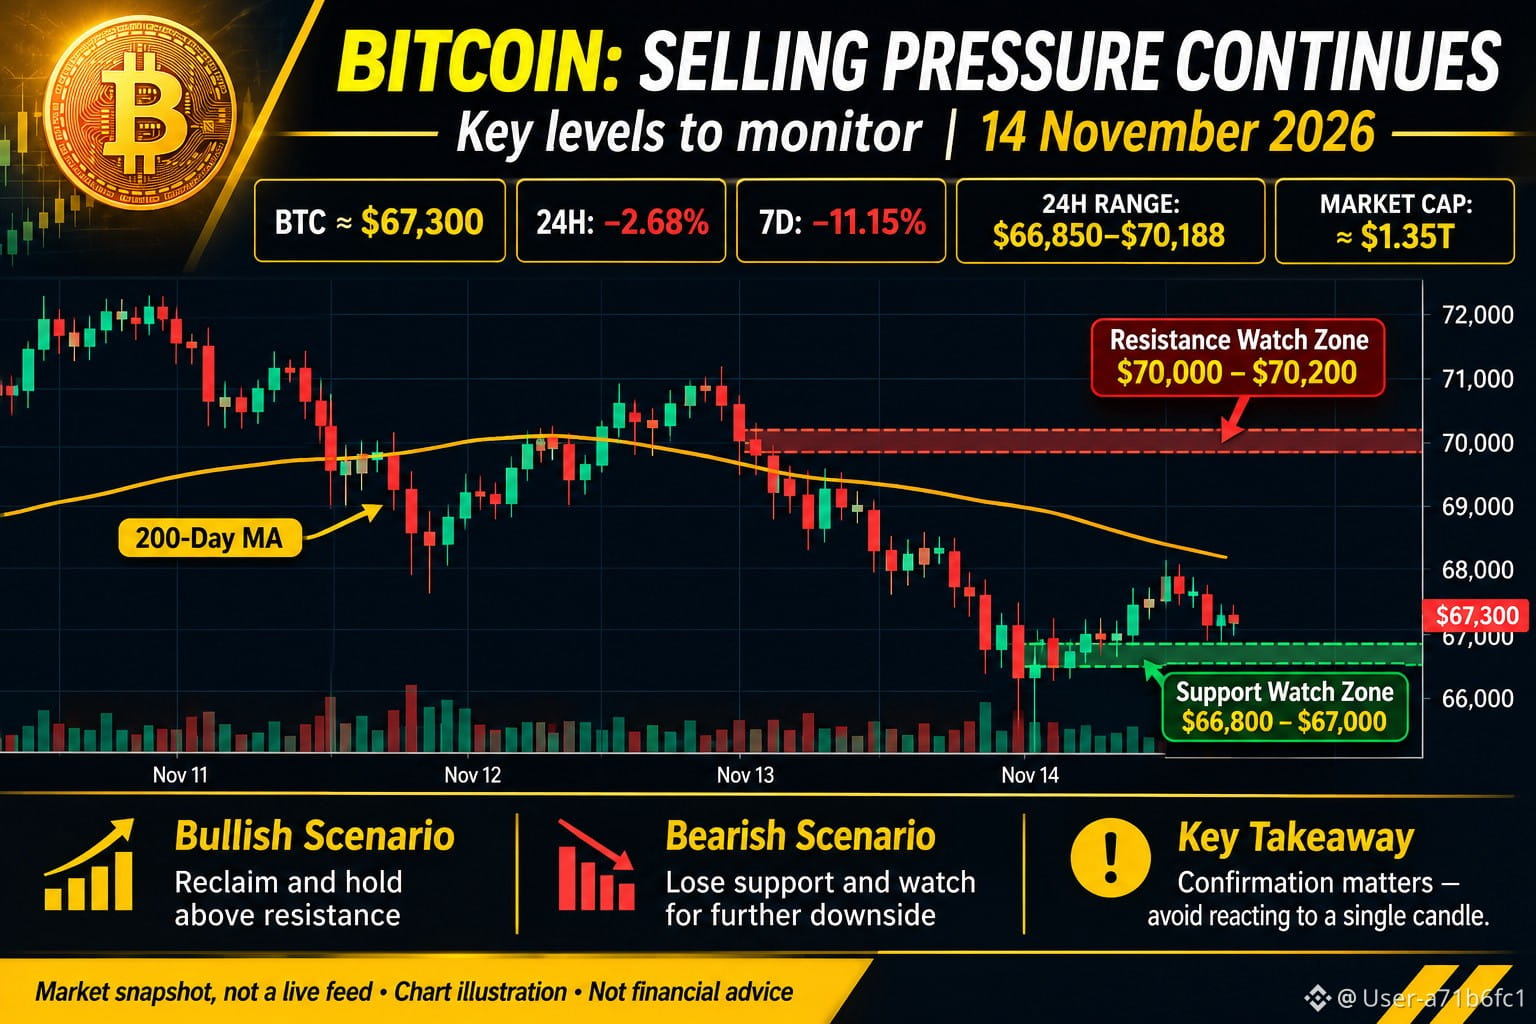
Bitcoin is facing renewed selling pressure, with market momentum remaining bearish as BTC trades around $67,300.
The latest market data shows:
Current price: ~$67,300
24-hour change: -2.68%
7-day change: -11.15%
24-hour high: ~$70,188
24-hour low: ~$66,850
Key BTC levels to watch
1. Support: $66,800–$67,000
This is an important short-term support area. If buyers defend this zone, BTC could attempt a recovery. However, a decisive breakdown could expose the market to further downside.
2. Resistance: $70,000–$70,200
This is the first major recovery area I'm watching. A sustained move above this zone could indicate improving buying pressure and open the possibility of a stronger rebound.
Market outlook
My approach is to remain patient rather than react emotionally to short-term price movements.
Bullish scenario: BTC holds support and reclaims $70K with strong volume.
Bearish scenario: BTC loses the $66.8K–$67K zone and selling pressure increases.
For now, confirmation matters more than prediction.
The big question: Will Bitcoin defend $67K, or are we preparing for another leg down?
Share your analysis and the levels you're watching.
#Bitcoin #BTC #CryptoMarket #BinanceSquare #Write2Earn
Market data is a dated snapshot, not a live feed. This is personal market commentary, not financial advice. Always DYOR.
Bitcoin Under Pressure: Is the $67K Support Zone About to Be Tested?
Bitcoin is facing renewed selling pressure, with market momentum remaining bearish as BTC trades around $67,300.
The latest market data shows:
Current price: ~$67,300
24-hour change: -2.68%
7-day change: -11.15%
24-hour high: ~$70,188
24-hour low: ~$66,850
Key BTC levels to watch
1. Support: $66,800–$67,000
This is an important short-term support area. If buyers defend this zone, BTC could attempt a recovery. However, a decisive breakdown could expose the market to further downside.
2. Resistance: $70,000–$70,200
This is the first major recovery area I'm watching. A sustained move above this zone could indicate improving buying pressure and open the possibility of a stronger rebound.
Market outlook
My approach is to remain patient rather than react emotionally to short-term price movements.
Bullish scenario: BTC holds support and reclaims $70K with strong volume.
Bearish scenario: BTC loses the $66.8K–$67K zone and selling pressure increases.
For now, confirmation matters more than prediction.
The big question: Will Bitcoin defend $67K, or are we preparing for another leg down?
Share your analysis and the levels you're watching.
#Bitcoin #BTC #CryptoMarket #BinanceSquare #Write2Earn
Market data is a dated snapshot, not a live feed. This is personal market commentary, not financial advice. Always DYOR.
Bitcoin is facing renewed selling pressure, with market momentum remaining bearish as BTC trades around $67,300.
The latest market data shows:
Current price: ~$67,300
24-hour change: -2.68%
7-day change: -11.15%
24-hour high: ~$70,188
24-hour low: ~$66,850
Key BTC levels to watch
1. Support: $66,800–$67,000
This is an important short-term support area. If buyers defend this zone, BTC could attempt a recovery. However, a decisive breakdown could expose the market to further downside.
2. Resistance: $70,000–$70,200
This is the first major recovery area I'm watching. A sustained move above this zone could indicate improving buying pressure and open the possibility of a stronger rebound.
Market outlook
My approach is to remain patient rather than react emotionally to short-term price movements.
Bullish scenario: BTC holds support and reclaims $70K with strong volume.
Bearish scenario: BTC loses the $66.8K–$67K zone and selling pressure increases.
For now, confirmation matters more than prediction.
The big question: Will Bitcoin defend $67K, or are we preparing for another leg down?
Share your analysis and the levels you're watching.
#Bitcoin #BTC #CryptoMarket #BinanceSquare #Write2Earn
Market data is a dated snapshot, not a live feed. This is personal market commentary, not financial advice. Always DYOR.
76
Übersetzung ansehen
Here is the infographic for your high-value crypto analysis post, along with a structured text template you can use. This combination is designed to drive engagement, which is key to succeeding with 'Write to Earn.'
Post Image: 'THE CRYPTO INSIDER'S WEEKLY GUIDE: KEY SIGNALS'
Proposed Post Text for Binance Square:
Headline: 🚨 The Week Ahead: Critical Crypto Signals Unpacked! 🤔
A massive week is unfolding in the crypto markets, and preparation is everything. My latest deep dive has just dropped, and it’s an essential read for anyone navigating these waters. This image summarises the key data I've been tracking, and the full analysis goes even deeper.
Here is a sneak peek of what the infographic and the complete guide cover:
📊 Macro Outlook: Beyond the headlines, what does the CPI trend (#CPITestsDecemberRateOutlook) really mean for the next Fed rate decision? I unpack the scenario analysis.
📉 Asset Focus: BTC and ETHHHHH support levels are under test. I share precise technical ranges and crucial on-chain metrics, including Long-Term Holder supply.
🚀 Narrative Watch: We must look beyond the top two. My analysis spotlights why sectors like DePIN and RWA tokens are showing incredible strength. Which one should you be positioned in?
The Full Deep Dive (Article Format) Goes Deeper!
I cover risk management strategies for the week, individual token picks with clear entry zones, and a macro masterclass to help you predict the market, not just react to it.
💬 Your Voice Matters! I want to hear from this community. After seeing this overview, which metric do you believe is the absolute MOST critical for the crypto market’s next major move? 🤔
Drop your vote below and explain your reasoning! The best, most insightful comment gets a special shout-out in my next analysis!
#Bitcoin #Ethereum #CryptoAnalysis #DePIN #RWA #BinanceSquare #WriteToEarn#$
Here is the infographic for your high-value crypto analysis post, along with a structured text template you can use. This combination is designed to drive engagement, which is key to succeeding with 'Write to Earn.'
Post Image: 'THE CRYPTO INSIDER'S WEEKLY GUIDE: KEY SIGNALS'
Proposed Post Text for Binance Square:
Headline: 🚨 The Week Ahead: Critical Crypto Signals Unpacked! 🤔
A massive week is unfolding in the crypto markets, and preparation is everything. My latest deep dive has just dropped, and it’s an essential read for anyone navigating these waters. This image summarises the key data I've been tracking, and the full analysis goes even deeper.
Here is a sneak peek of what the infographic and the complete guide cover:
📊 Macro Outlook: Beyond the headlines, what does the CPI trend (#CPITestsDecemberRateOutlook) really mean for the next Fed rate decision? I unpack the scenario analysis.
📉 Asset Focus: BTC and ETHHHHH support levels are under test. I share precise technical ranges and crucial on-chain metrics, including Long-Term Holder supply.
🚀 Narrative Watch: We must look beyond the top two. My analysis spotlights why sectors like DePIN and RWA tokens are showing incredible strength. Which one should you be positioned in?
The Full Deep Dive (Article Format) Goes Deeper!
I cover risk management strategies for the week, individual token picks with clear entry zones, and a macro masterclass to help you predict the market, not just react to it.
💬 Your Voice Matters! I want to hear from this community. After seeing this overview, which metric do you believe is the absolute MOST critical for the crypto market’s next major move? 🤔
Drop your vote below and explain your reasoning! The best, most insightful comment gets a special shout-out in my next analysis!
#Bitcoin #Ethereum #CryptoAnalysis #DePIN #RWA #BinanceSquare #WriteToEarn#$
Post Image: 'THE CRYPTO INSIDER'S WEEKLY GUIDE: KEY SIGNALS'
Proposed Post Text for Binance Square:
Headline: 🚨 The Week Ahead: Critical Crypto Signals Unpacked! 🤔
A massive week is unfolding in the crypto markets, and preparation is everything. My latest deep dive has just dropped, and it’s an essential read for anyone navigating these waters. This image summarises the key data I've been tracking, and the full analysis goes even deeper.
Here is a sneak peek of what the infographic and the complete guide cover:
📊 Macro Outlook: Beyond the headlines, what does the CPI trend (#CPITestsDecemberRateOutlook) really mean for the next Fed rate decision? I unpack the scenario analysis.
📉 Asset Focus: BTC and ETHHHHH support levels are under test. I share precise technical ranges and crucial on-chain metrics, including Long-Term Holder supply.
🚀 Narrative Watch: We must look beyond the top two. My analysis spotlights why sectors like DePIN and RWA tokens are showing incredible strength. Which one should you be positioned in?
The Full Deep Dive (Article Format) Goes Deeper!
I cover risk management strategies for the week, individual token picks with clear entry zones, and a macro masterclass to help you predict the market, not just react to it.
💬 Your Voice Matters! I want to hear from this community. After seeing this overview, which metric do you believe is the absolute MOST critical for the crypto market’s next major move? 🤔
Drop your vote below and explain your reasoning! The best, most insightful comment gets a special shout-out in my next analysis!
#Bitcoin #Ethereum #CryptoAnalysis #DePIN #RWA #BinanceSquare #WriteToEarn#$
9
Anmelden und weiter Inhalte entdecken
Krypto-Nutzer weltweit auf Binance Square kennenlernen
⚡️ Bleib in Sachen Krypto stets am Puls.
💬 Die weltgrößte Kryptobörse vertraut darauf.
👍 Erhalte verlässliche Einblicke von verifizierten Creators.
E-Mail-Adresse/Telefonnummer
Trendthemen
WhoWillSucceedJensenHuangatNvidia?
121,639 Aufrufe
1,413 Kommentare
Nvidia: Keine Gespräche über CEO-Nachfolge – Petition „Stand With Jensen“ erreicht mehr als 77.900 Unterschriften
Binance News
·30 Likes
·48k Aufrufe
WhatWillDriveCryptoandStocks’NextRebound?
506,875 Aufrufe
3,293 Kommentare
BitcoinActiveSupplyInProfitDropsBelow45%
49,611 Aufrufe
567 Kommentare