

Muhammad Anwar 99u
22 Beiträge

Muhammad Anwar 99u
Melden
Nutzer blockieren
52 Following
58 Follower
20 Like gegeben
Beiträge
Alle
Zitierungen

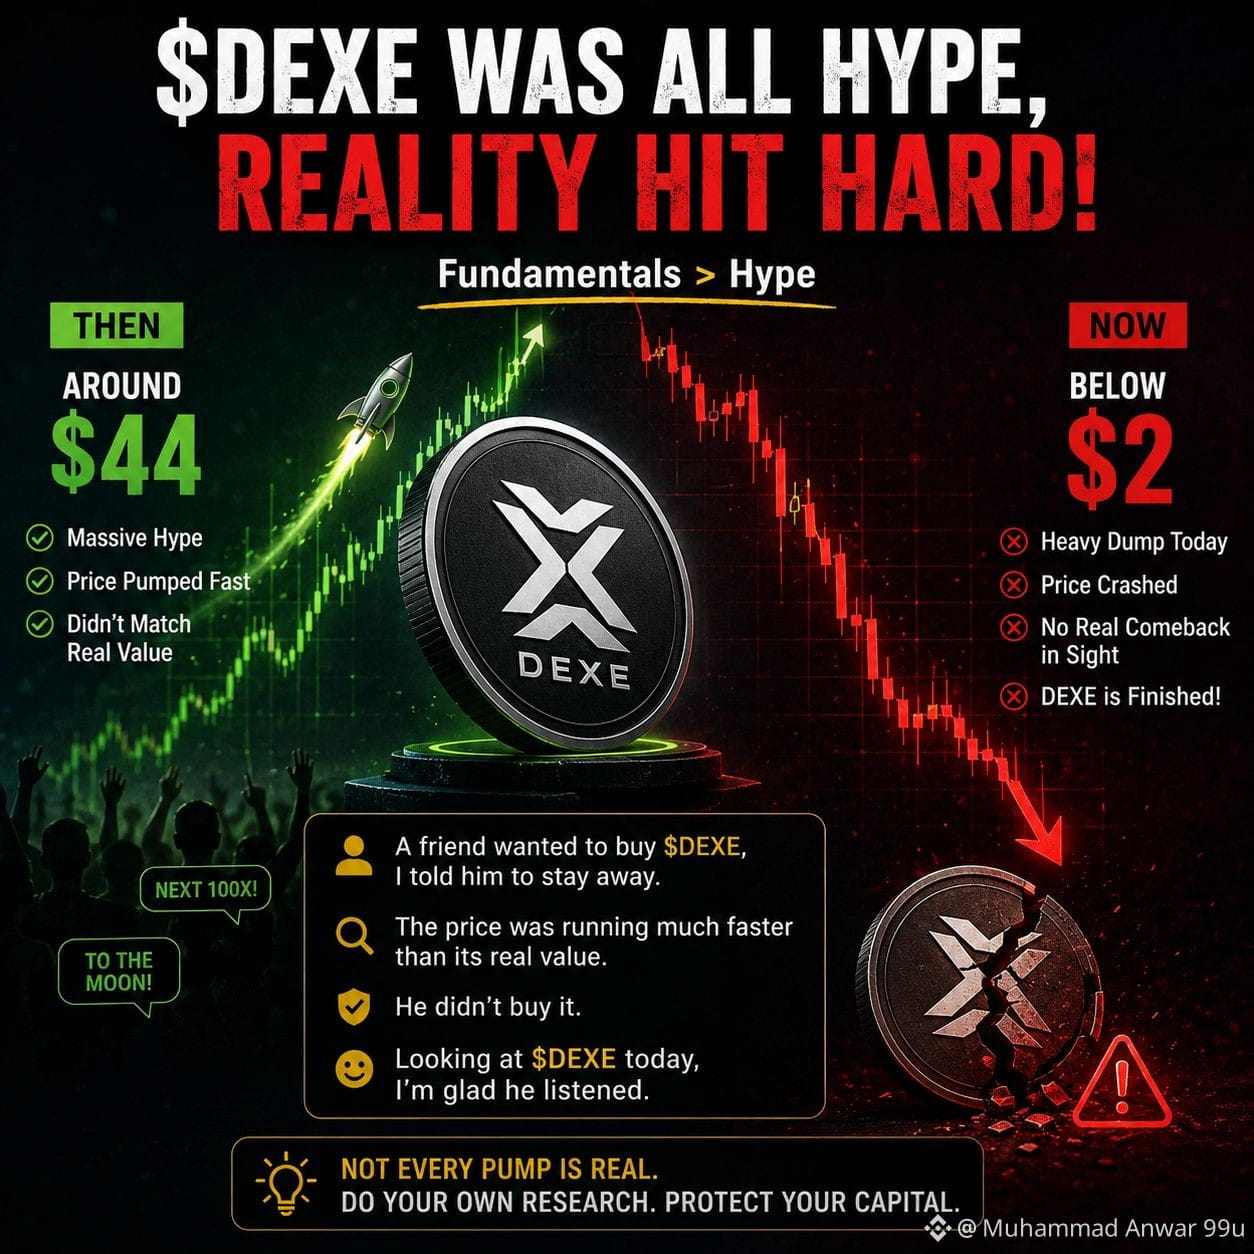
$DEXE: Wenn Hype auf die Realität trifft$DEXE
Ich versuche immer, mich auf die Grundlagen zu konzentrieren, statt dem Hype zu folgen.
Vor einiger Zeit fragte mich ein Freund, ob er $DEXE kaufen sollte. Nachdem ich mir das Projekt angesehen hatte, riet ich ihm davon ab, weil der Marktpreis weit hinter dem zurückzubleiben schien, was das Projekt tatsächlich bot.
Er entschied sich, nicht zu investieren.
Wenn man sich den Chart heute ansieht, hat sich diese Entscheidung als richtig erwiesen. Ein Token, der einst bei etwa 44 US-Dollar gehandelt wurde, ist inzwischen unter 2 US-Dollar gefallen – und der starke Verkaufsdruck hält an.
Dies ist eine weitere Erinnerung daran, dass nicht jede Rallye durch echten Wert untermauert ist. Bevor du in irgendeinen Altcoin investierst, mach immer deine eigene Recherche und lass nicht zu, dass dich der Hype zu Entscheidungen verleitet.$DEXE
AlphabetToLiftCapexToAsMuchAs$205B
#DEXE/USDT
#Crypto_Jobs🎯
#Altcoins!
$DEXE : Wenn Hype auf die Realität trifft$DEXE
Ich versuche immer, mich auf die Grundlagen zu konzentrieren, statt dem Hype zu folgen.
Vor einiger Zeit fragte mich ein Freund, ob er $DEXE kaufen sollte. Nachdem ich mir das Projekt angesehen hatte, riet ich ihm davon ab, weil der Marktpreis weit hinter dem zurückzubleiben schien, was das Projekt tatsächlich bot.
Er entschied sich, nicht zu investieren.
Wenn man sich den Chart heute ansieht, hat sich diese Entscheidung als richtig erwiesen. Ein Token, der einst bei etwa 44 US-Dollar gehandelt wurde, ist inzwischen unter 2 US-Dollar gefallen – und der starke Verkaufsdruck hält an.
Dies ist eine weitere Erinnerung daran, dass nicht jede Rallye durch echten Wert untermauert ist. Bevor du in irgendeinen Altcoin investierst, mach immer deine eigene Recherche und lass nicht zu, dass dich der Hype zu Entscheidungen verleitet.$DEXE
AlphabetToLiftCapexToAsMuchAs$205B
#DEXE/USDT
#Crypto_Jobs🎯
#Altcoins!
424
#BinancePickAndWin 🚀 Binance Pick & Win ist deine Chance, deine Vorhersagen zu testen und aufregende Belohnungen zu genießen! Bleib aktiv, triff deine Picks und verpasse nicht die Gelegenheit, Teil des Spaßes zu werden. Viel Glück allen Teilnehmenden — und mögen eure Vorhersagen punktgenau sein! ⚽🎉 #Binance #PickAndWin #Crypto #BNB $NVDAB Binance1B$inStocks
#BinancePickAndWin 🚀 Binance Pick & Win ist deine Chance, deine Vorhersagen zu testen und aufregende Belohnungen zu genießen! Bleib aktiv, triff deine Picks und verpasse nicht die Gelegenheit, Teil des Spaßes zu werden. Viel Glück allen Teilnehmenden — und mögen eure Vorhersagen punktgenau sein! ⚽🎉 #Binance #PickAndWin #Crypto #BNB $NVDAB Binance1B$inStocks
62
#BinancePickAndWin 🚀 BTC & BNB Marktupdate
Bitcoin (BTC) führt weiterhin die gesamte Marktsentiment an, während BNB durch die Stärke des Binance-Ökosystems und fortlaufende Token-Burns gestützt bleibt. Wenn BTC eine wichtige Unterstützung beibehält, könnte BNB mit erneuter bullischer Dynamik nachziehen. Bleib geduldig, manage dein Risiko und mach immer deine eigene Recherche, bevor du investierst. 📈 #BTC #BNB #Crypto #BinanceSquareBinance1B$inStock#OilPriceFalls $BNB $BTC
Bitcoin (BTC) führt weiterhin die gesamte Marktsentiment an, während BNB durch die Stärke des Binance-Ökosystems und fortlaufende Token-Burns gestützt bleibt. Wenn BTC eine wichtige Unterstützung beibehält, könnte BNB mit erneuter bullischer Dynamik nachziehen. Bleib geduldig, manage dein Risiko und mach immer deine eigene Recherche, bevor du investierst. 📈 #BTC #BNB #Crypto #BinanceSquareBinance1B$inStock#OilPriceFalls $BNB $BTC
107
#BinancePickAndWin
Jedes Spiel ist eine neue Gelegenheit zu beweisen, dass Leidenschaft, Teamwork und Entschlossenheit jede Herausforderung meistern können. Der Sieg gehört denen, die niemals aufhören zu glauben, zu kämpfen und ihr Bestes zu geben, bis zum Schlusspfiff. Spiel mit Herz, respektiere das Spiel und lass deine Leistung alle inspirieren, die zuschauen. 🏆🔥 #Fußball #GibNieAuf #Meister #GameDay #SOLRises9% #SOLRises9% $SPCXB $BTC
Jedes Spiel ist eine neue Gelegenheit zu beweisen, dass Leidenschaft, Teamwork und Entschlossenheit jede Herausforderung meistern können. Der Sieg gehört denen, die niemals aufhören zu glauben, zu kämpfen und ihr Bestes zu geben, bis zum Schlusspfiff. Spiel mit Herz, respektiere das Spiel und lass deine Leistung alle inspirieren, die zuschauen. 🏆🔥 #Fußball #GibNieAuf #Meister #GameDay #SOLRises9% #SOLRises9% $SPCXB $BTC
73
·
--
Bullisch
$BTC Der Preis von Bitcoin ist kürzlich erheblich gefallen und liegt jetzt auf dem niedrigsten Niveau seit sieben Monaten. Am 18. November 2025 wird Bitcoin zu einem Preis von etwa 91.588 $ gehandelt, verglichen mit seinem Höchststand von etwa $BTC 126.000 $ im Oktober. Der Rückgang wird auf Unsicherheiten in den Finanzpolitiken der USA und den Druck der globalen Märkte zurückgeführt.
{spot}(BTCUSDT)
$BTC Der Preis von Bitcoin ist kürzlich erheblich gefallen und liegt jetzt auf dem niedrigsten Niveau seit sieben Monaten. Am 18. November 2025 wird Bitcoin zu einem Preis von etwa 91.588 $ gehandelt, verglichen mit seinem Höchststand von etwa $BTC 126.000 $ im Oktober. Der Rückgang wird auf Unsicherheiten in den Finanzpolitiken der USA und den Druck der globalen Märkte zurückgeführt.
1
152
Übersetzung ansehen


Guru_Traders
·
--
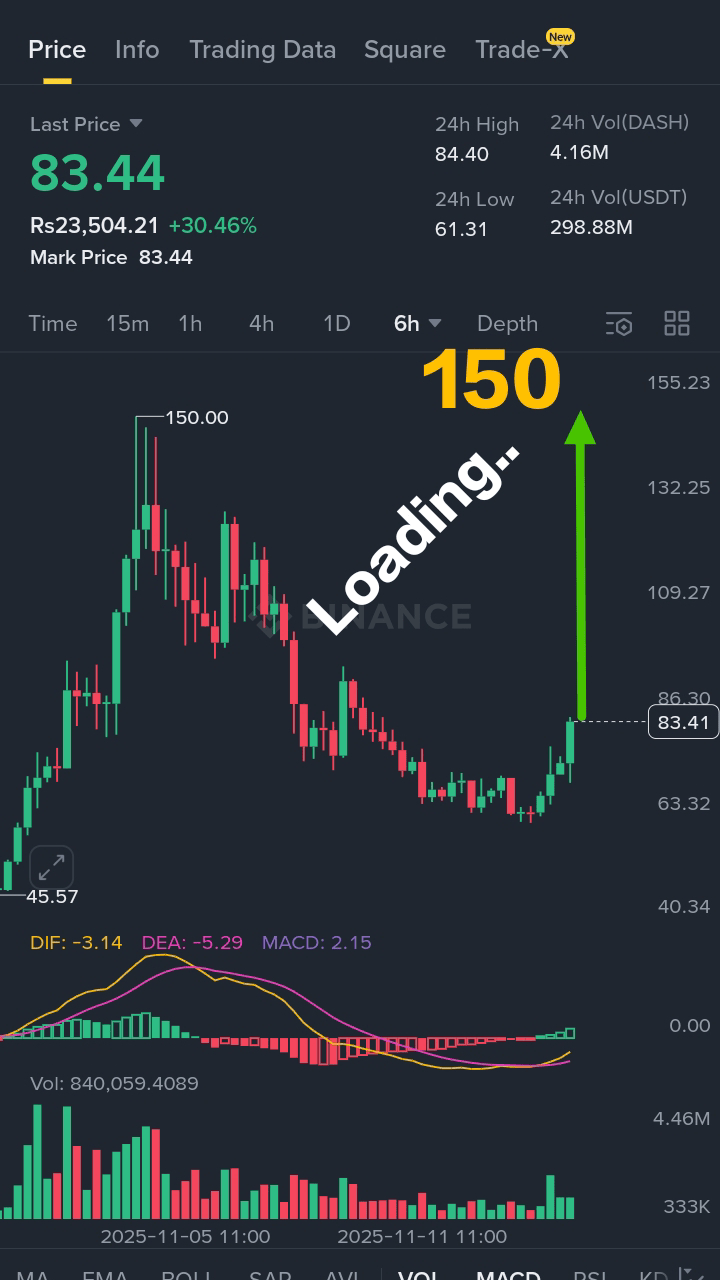
Bullisch💰Wer möchte 50$ in 5000$+ verwandeln? 💥🤍
$DASH LONG 🟢 JETZT 📈 🚀
Verpassen Sie nicht diesen wirklich sehr großen Schritt 📈 Kommt BALD Ziel 🎯 100$__120$__150$
$DASH LONG 🟢 JETZT 📈 🚀
Verpassen Sie nicht diesen wirklich sehr großen Schritt 📈 Kommt BALD Ziel 🎯 100$__120$__150$
4
ZEC steigt in 24 Stunden um über 26%, überschreitet kurzzeitig 650 USDT
Laut Odaily erlebte die Kryptowährung $ZEC
{spot}(ZECUSDT)
einen signifikanten Preisanstieg und überschritt kurzzeitig 650 USDT. Nach dem neuesten Update wird ZEC bei 645,9 USDT gehandelt, was einem Anstieg von 26,38% in 24 Stunden entspricht.
$USDC
ZEC steigt in 24 Stunden um über 26%, überschreitet kurzzeitig 650 USDT
Laut Odaily erlebte die Kryptowährung $ZEC
einen signifikanten Preisanstieg und überschritt kurzzeitig 650 USDT. Nach dem neuesten Update wird ZEC bei 645,9 USDT gehandelt, was einem Anstieg von 26,38% in 24 Stunden entspricht.
$USDC
Laut Odaily erlebte die Kryptowährung $ZEC
einen signifikanten Preisanstieg und überschritt kurzzeitig 650 USDT. Nach dem neuesten Update wird ZEC bei 645,9 USDT gehandelt, was einem Anstieg von 26,38% in 24 Stunden entspricht.
$USDC
258
Übersetzung ansehen
🚨 BREAKING MOMENT FOR THE MARKETS 🇺🇸🔥
The wait is finally over.
President Trump has signed the bill, ending the longest shutdown in U.S. history, and the entire system is roaring back to life. The mood has flipped from uncertainty to pure momentum, and traders can already feel the shift pulsing through the market.
For weeks, everything moved in slow motion. Now the floodgates open.
Government workers return, payments restart, federal services kick back in, and the economy regains its heartbeat. Every stalled process begins to move again, and that wave of activity sends fresh energy straight into risk assets.
This is the kind of catalyst that wakes up $BTC $ETH , $SOL with force.
Liquidity reenters, buyers regain confidence, and charts start flashing signals that only appear during major macro resets.
The calm is gone. The acceleration phase starts now.
Traders are sharpening their focus because when money begins to circulate again after weeks of pressure, markets don’t move slowly — they snap back with power.
🔥 Stay sharp.
🔥 Stay ready.
Moments like this often turn into the biggest opportunities of the entire cycle.
{spot}(BTCUSDT)
🚨 BREAKING MOMENT FOR THE MARKETS 🇺🇸🔥
The wait is finally over.
President Trump has signed the bill, ending the longest shutdown in U.S. history, and the entire system is roaring back to life. The mood has flipped from uncertainty to pure momentum, and traders can already feel the shift pulsing through the market.
For weeks, everything moved in slow motion. Now the floodgates open.
Government workers return, payments restart, federal services kick back in, and the economy regains its heartbeat. Every stalled process begins to move again, and that wave of activity sends fresh energy straight into risk assets.
This is the kind of catalyst that wakes up $BTC $ETH , $SOL with force.
Liquidity reenters, buyers regain confidence, and charts start flashing signals that only appear during major macro resets.
The calm is gone. The acceleration phase starts now.
Traders are sharpening their focus because when money begins to circulate again after weeks of pressure, markets don’t move slowly — they snap back with power.
🔥 Stay sharp.
🔥 Stay ready.
Moments like this often turn into the biggest opportunities of the entire cycle.
1
Übersetzung ansehen
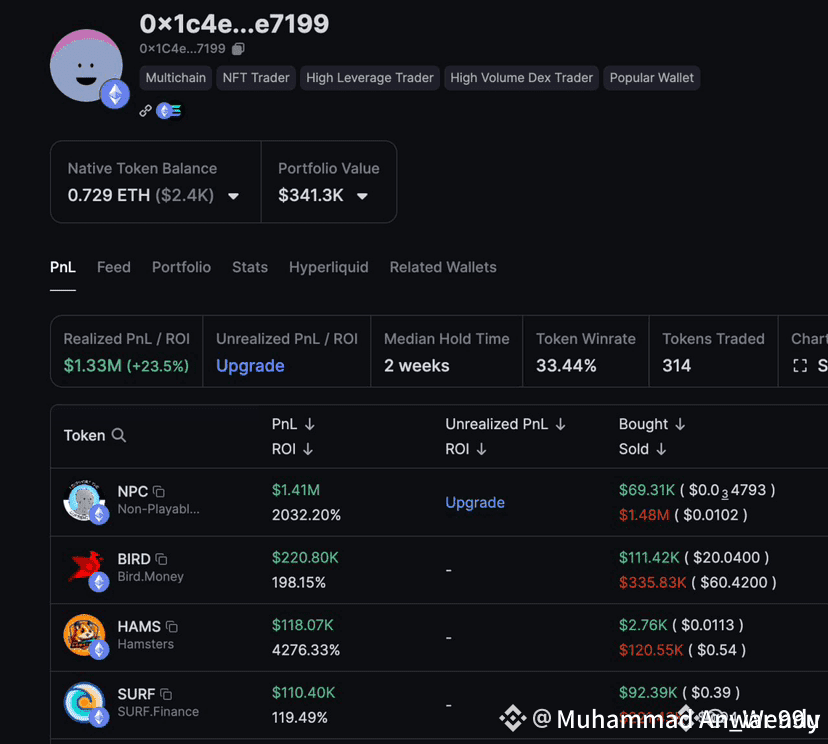
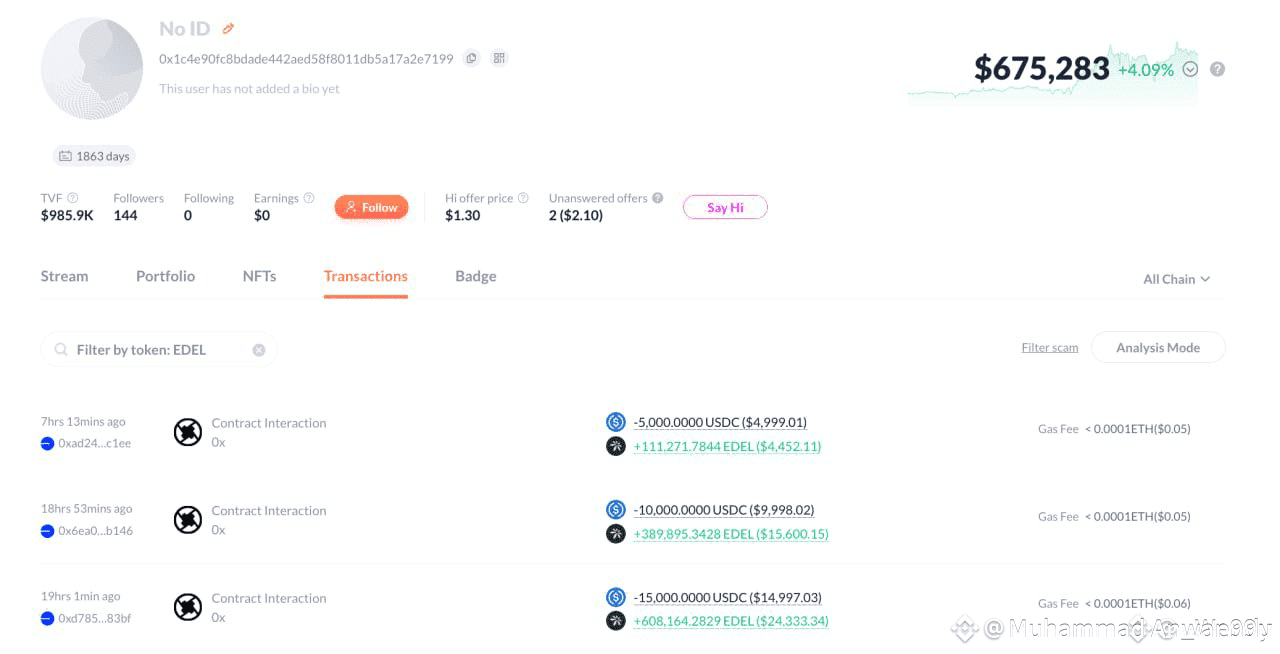
$BTC Smart Trader With $1.33M in Profits Scoops Up 1.11M $EDEL
Sharp moves continue from 0x1c4e, a trader already up $1.33M+ from previous wins. Earlier today, he deployed 30,000 $USDC to accumulate 1.11M $EDEL, signaling fresh conviction in the token.
This wallet has a track record of timing entries well — and when profitable traders rotate into new assets, the market tends to pay attention.
Is this the start of a bigger $EDEL position… or just the first probe? 👀
Follow Wendy for more
{future}(BTCUSDT)
#MarketPullback $BTC
$BTC Smart Trader With $1.33M in Profits Scoops Up 1.11M $EDEL
Sharp moves continue from 0x1c4e, a trader already up $1.33M+ from previous wins. Earlier today, he deployed 30,000 $USDC to accumulate 1.11M $EDEL, signaling fresh conviction in the token.
This wallet has a track record of timing entries well — and when profitable traders rotate into new assets, the market tends to pay attention.
Is this the start of a bigger $EDEL position… or just the first probe? 👀
Follow Wendy for more
#MarketPullback $BTC
3
Übersetzung ansehen
$XRP LATEST ANALYSIS $XRP 2.50
+$0.09 (3.73%) Today
1D
5D
1M
6M
YTD
1Y
5Y
📊 Market Summary
XRP is trading around $2.45-$2.50 today, showing moderate stability after recent moves.
A recent report notes that the token climbed about 3.28% to $2.48 on strong volume as the first U.S. spot XRP ETF got certified by Nasdaq. �
CoinDesk +3
One technical note: an analysis warns of a bearish “death cross” (50-day EMA crossing below 200-day EMA) that could imply a potential drop to ~$1.25 if key support breaks. �
Finance Magnates
🔍 Technical Outlook
Support & Resistance:
Support zone: ~$2.30-$2.20. If this zone fails, downside risks increase. �
Finance Magnates +1
Resistance zone: ~$2.58-$2.70. A break above this could signal stronger upside. �
CoinDCX
Indicators:
RSI is in neutral territory (≈44 in one study) — suggesting neither strong over-bought nor over-sold conditions yet. �
CoinDCX
The “death cross” formation is flagged as a bearish signal by technical analysts. �
Finance Magnates
Scenario Analysis:
Bullish case: If XRP holds above ~$2.40-$2.50 and breaks out above ~$2.70, it may retest ~$2.85-$3.00 by end of year. �
CoinDCX
Bearish case: If key support ~$2.30-$2.20 is broken, targets could drop toward ~$2.10 or even ~$1.90-$1.60 in a deeper pull-back. �
Finance Magnates
📰 Macro / Sentiment Factors
The ETF approval for XRP is a positive catalyst, as institutional investors may now have a clearer path into the token. �
CoinDesk +1
On the flip side, despite positive signals, caution remains high because broader crypto market sentiment is still volatile.
Ownership concentration: The top holders (including Ripple Labs and major exchanges) control a large portion of XRP supply, which may impact market dynamics (liquidity, volatility). �
CoinGape
✅ Key Takeaways
XRP is at a critical juncture. While upside remains possible, the risk of a deeper correction is real if key supports fail.
Traders/investors should watch:
Breakout above ~$2.70 for bullish confirmation.
Breakdown below ~$2.30 for bearish confirmation.
Given current conditions, the market appears to be in a neutral-to-cautious phase, leaning slightly bullish if catalysts play out.
Always remember: crypto markets are highly volatile and dependent on both technicals and regulatory/adoption developments.
$XRP
{future}(XRPUSDT)
#BTC #ETH #StrategyBTCPurchase #ProjectCrypto
$XRP LATEST ANALYSIS
$XRP 2.50
+$0.09 (3.73%) Today
1D
5D
1M
6M
YTD
1Y
5Y
📊 Market Summary
XRP is trading around $2.45-$2.50 today, showing moderate stability after recent moves.
A recent report notes that the token climbed about 3.28% to $2.48 on strong volume as the first U.S. spot XRP ETF got certified by Nasdaq. �
CoinDesk +3
One technical note: an analysis warns of a bearish “death cross” (50-day EMA crossing below 200-day EMA) that could imply a potential drop to ~$1.25 if key support breaks. �
Finance Magnates
🔍 Technical Outlook
Support & Resistance:
Support zone: ~$2.30-$2.20. If this zone fails, downside risks increase. �
Finance Magnates +1
Resistance zone: ~$2.58-$2.70. A break above this could signal stronger upside. �
CoinDCX
Indicators:
RSI is in neutral territory (≈44 in one study) — suggesting neither strong over-bought nor over-sold conditions yet. �
CoinDCX
The “death cross” formation is flagged as a bearish signal by technical analysts. �
Finance Magnates
Scenario Analysis:
Bullish case: If XRP holds above ~$2.40-$2.50 and breaks out above ~$2.70, it may retest ~$2.85-$3.00 by end of year. �
CoinDCX
Bearish case: If key support ~$2.30-$2.20 is broken, targets could drop toward ~$2.10 or even ~$1.90-$1.60 in a deeper pull-back. �
Finance Magnates
📰 Macro / Sentiment Factors
The ETF approval for XRP is a positive catalyst, as institutional investors may now have a clearer path into the token. �
CoinDesk +1
On the flip side, despite positive signals, caution remains high because broader crypto market sentiment is still volatile.
Ownership concentration: The top holders (including Ripple Labs and major exchanges) control a large portion of XRP supply, which may impact market dynamics (liquidity, volatility). �
CoinGape
✅ Key Takeaways
XRP is at a critical juncture. While upside remains possible, the risk of a deeper correction is real if key supports fail.
Traders/investors should watch:
Breakout above ~$2.70 for bullish confirmation.
Breakdown below ~$2.30 for bearish confirmation.
Given current conditions, the market appears to be in a neutral-to-cautious phase, leaning slightly bullish if catalysts play out.
Always remember: crypto markets are highly volatile and dependent on both technicals and regulatory/adoption developments.
$XRP
#BTC #ETH #StrategyBTCPurchase #ProjectCrypto
3
Übersetzung ansehen
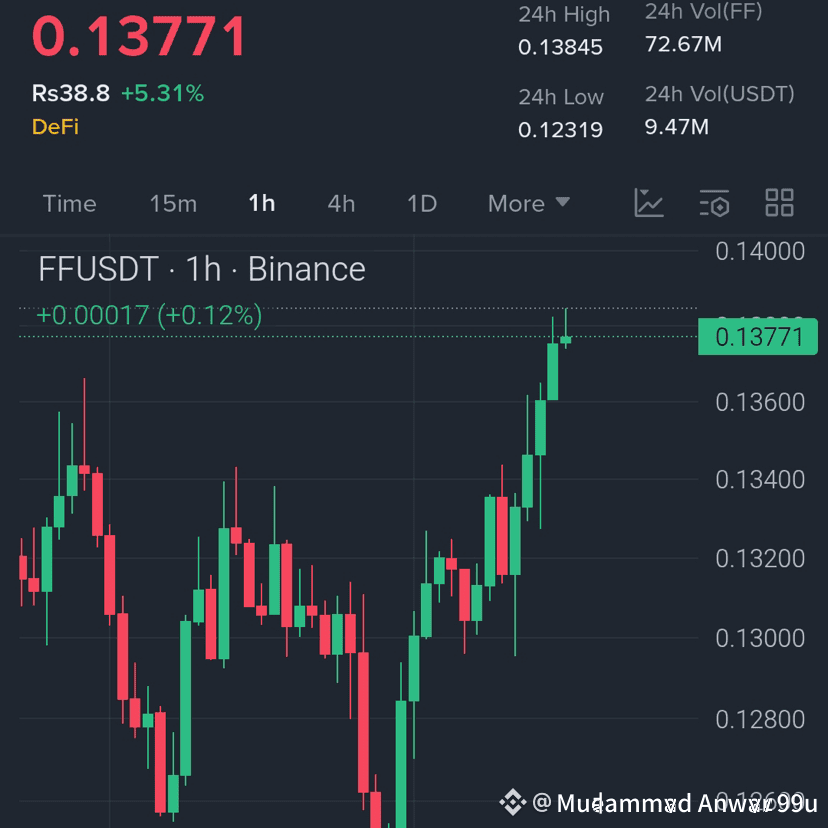
$FF $FF is showing strong bullish momentum on the 1H, breaking previous lower highs and forming a clean upward structure....
Buy Zone: 0.1340 – 0.1370
Targets:
T1: 0.1405
T2: 0.1440
T3: 0.1485
Stop-Loss: 0.1295
$FF $FF is showing strong bullish momentum on the 1H, breaking previous lower highs and forming a clean upward structure....
Buy Zone: 0.1340 – 0.1370
Targets:
T1: 0.1405
T2: 0.1440
T3: 0.1485
Stop-Loss: 0.1295
Buy Zone: 0.1340 – 0.1370
Targets:
T1: 0.1405
T2: 0.1440
T3: 0.1485
Stop-Loss: 0.1295
2
Übersetzung ansehen
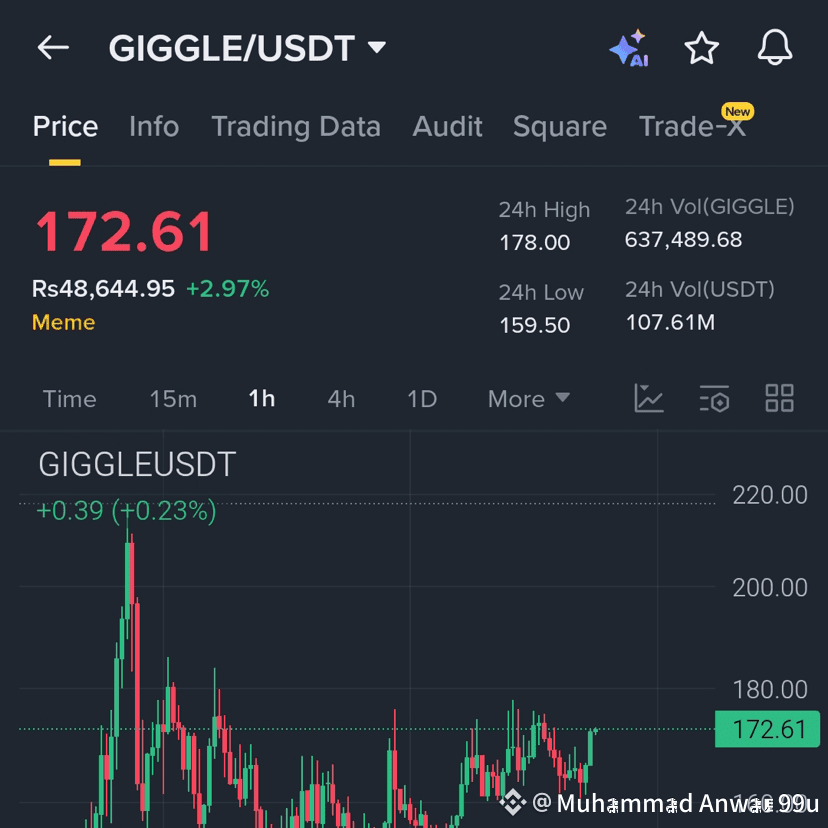
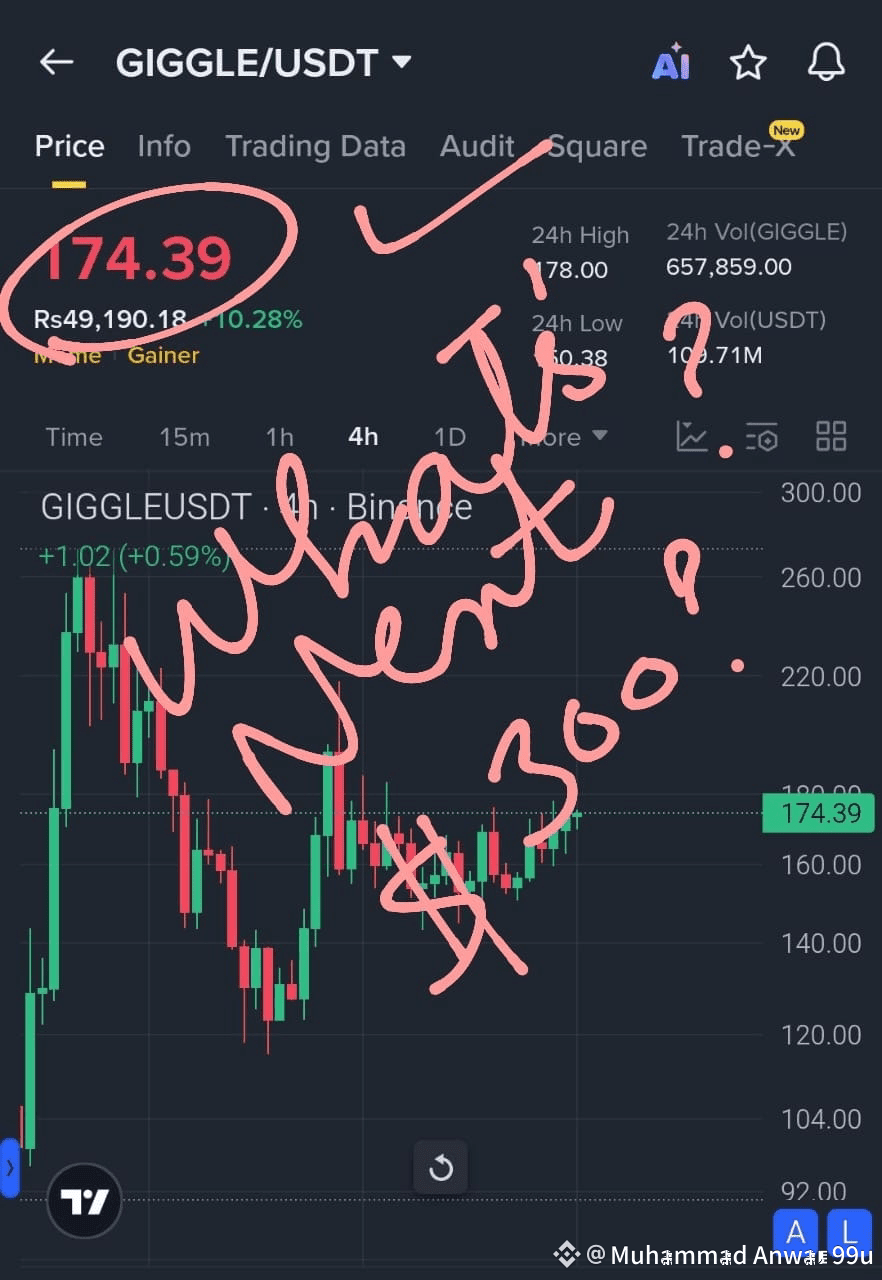
$GIGGLE is building strong support near 160–165 and repeatedly testing resistance around 175–178, indicating a potential breakout continuation on the 1H chart.....
Buy Zone: 168 – 174
Targets:
T1: 182
T2: 195
T3: 210
Stop-Loss: 158
$GIGGLE is building strong support near 160–165 and repeatedly testing resistance around 175–178, indicating a potential breakout continuation on the 1H chart.....
Buy Zone: 168 – 174
Targets:
T1: 182
T2: 195
T3: 210
Stop-Loss: 158
Buy Zone: 168 – 174
Targets:
T1: 182
T2: 195
T3: 210
Stop-Loss: 158
Übersetzung ansehen
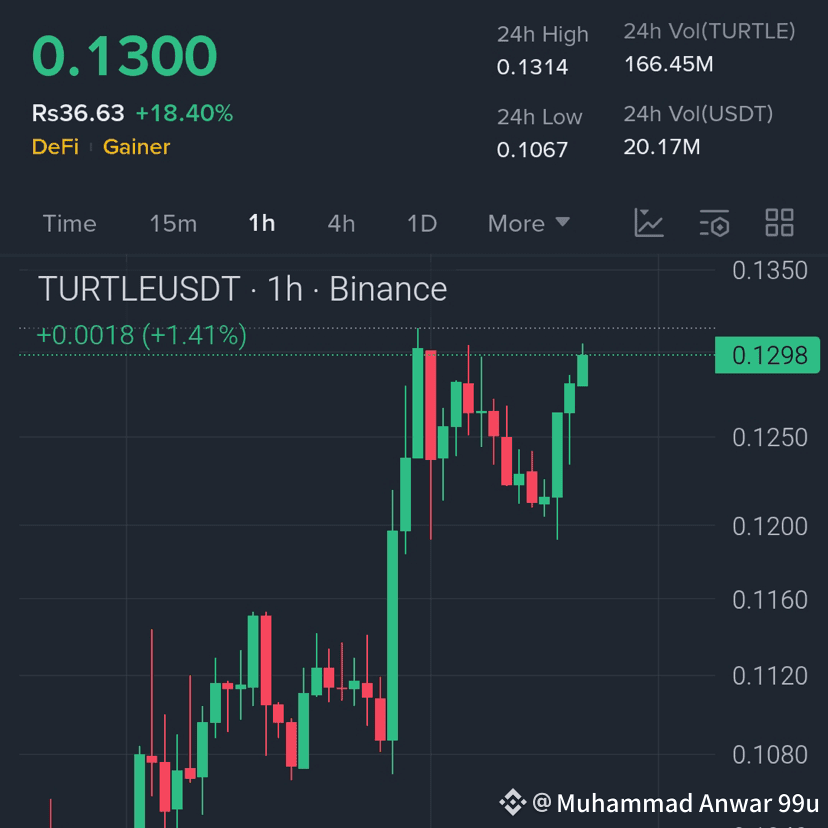
$TURTLE $TURTLE has surged strongly on the 1H forming higher highs and clean bullish structure, signaling continuation potential.
Buy Zone: 0.1260 – 0.1290
Targets:
T1: 0.1335
T2: 0.1380
T3: 0.1440
Stop-Loss: 0.1210
{spot}(TURTLEUSDT)
$TURTLE $TURTLE has surged strongly on the 1H forming higher highs and clean bullish structure, signaling continuation potential.
Buy Zone: 0.1260 – 0.1290
Targets:
T1: 0.1335
T2: 0.1380
T3: 0.1440
Stop-Loss: 0.1210
Buy Zone: 0.1260 – 0.1290
Targets:
T1: 0.1335
T2: 0.1380
T3: 0.1440
Stop-Loss: 0.1210
Übersetzung ansehen
$BTC NEWS
itcoin News Today: BTC Price Rebounds Nearly 4% Amid Macro Relief
Binance News
Nov 10
・
Verified Binance official account
AI Summary
Key Takeaways
Bitcoin price rises 3.94% to $106,430 as U.S. government shutdown resolution boosts risk sentiment
Institutional sentiment improves after Kynikos Associates closes its short position on Strategy (MSTR)
Analysts eye $108,500 resistance as the next major test for sustained bullish momentum
Technical Indicators Signal Stabilization
According to the latest oscillator and moving average data, Bitcoin’s technical picture shows a mixed but stabilizing trend:
Relative Strength Index (RSI) sits at 46, indicating neutral momentum after recent volatility.
The MACD Level (12, 26) is at -2,379, showing mild downward divergence, while Momentum (10) at -3,323 reflects a short-term recovery phase.
Source: TradingView
What the moving averages show:
The Exponential Moving Average (10) stands at 105,300, while the Simple Moving Average (10) is 105,024, both below the current market price — a potential early bullish crossover signal.
The 50-day EMA at 110,264 and 100-day SMA at 113,160 act as overhead resistance levels to monitor.
{future}(BTCUSDT)
$BTC #USGovShutdownEnd? #AITokensRally
$BTC NEWS
itcoin News Today: BTC Price Rebounds Nearly 4% Amid Macro Relief
Binance News
Nov 10
・
Verified Binance official account
AI Summary
Key Takeaways
Bitcoin price rises 3.94% to $106,430 as U.S. government shutdown resolution boosts risk sentiment
Institutional sentiment improves after Kynikos Associates closes its short position on Strategy (MSTR)
Analysts eye $108,500 resistance as the next major test for sustained bullish momentum
Technical Indicators Signal Stabilization
According to the latest oscillator and moving average data, Bitcoin’s technical picture shows a mixed but stabilizing trend:
Relative Strength Index (RSI) sits at 46, indicating neutral momentum after recent volatility.
The MACD Level (12, 26) is at -2,379, showing mild downward divergence, while Momentum (10) at -3,323 reflects a short-term recovery phase.
Source: TradingView
What the moving averages show:
The Exponential Moving Average (10) stands at 105,300, while the Simple Moving Average (10) is 105,024, both below the current market price — a potential early bullish crossover signal.
The 50-day EMA at 110,264 and 100-day SMA at 113,160 act as overhead resistance levels to monitor.
$BTC #USGovShutdownEnd? #AITokensRally
$BTC (BTC)
📰 Neueste Aktualisierung
Bitcoin wird nahe $105.000 USD gehandelt, nachdem es am Wochenende von etwas unter $100.000 abgeprallt ist. �
Investing News Network (INN) +3
Der Rückgang auf ~$103K erfolgte im Zuge von Gewinnmitnahmen und einer Abkühlung des Interesses an Technologie-/KI-Vermögenswerten, was die Krypto-Stimmung belastete. �
The Economic Times
Die institutionelle Stimmung bleibt vorsichtig optimistisch: Umfragedaten zeigen, dass viele vermögende Privatpersonen und professionelle Investoren planen, ihre Krypto-Engagements trotz der jüngsten Volatilität zu erhöhen. �
marketwatch.com
📊 Was uns das sagt
Ein Halten über ~$100K ist eine psychologisch wichtige Unterstützungsregion — ein Bruch darunter könnte weitere Schwäche auslösen.
Eine Erholung deutet darauf hin, dass die Bullen wichtige Levels verteidigen, aber das Aufwärtspotenzial könnte begrenzt sein, bis die breitere Markt-Risikobereitschaft zurückkehrt (Technologieaktien, makroökonomische Daten usw.).
Institutionelle Ströme und der Zugang zu ETFs sind weiterhin unterstützende Rückenwinde, auch wenn die kurzfristige Dynamik gedämpft ist.
🔍 Wichtige Levels im Auge behalten
Unterstützung: ~$100.000 und die ~$99K-Zone, die kürzlich getestet wurde. �
Investing News Network (INN)
Widerstand: ~$110.000+ könnte vorerst als Deckel wirken, es sei denn, die Dynamik nimmt zu.
Katalysatoren:
Makroökonomische Daten (z. B. US-Arbeitsmarkt, Fed-Politik)
Wesentliche ETF-Ströme in Bitcoin
Regulatorische Entwicklungen weltweit
✅ Schneller Überblick
Bitcoin befindet sich in einer Konsolidierungsphase: Es bleibt in einem insgesamt bullishen strukturellen Setup (institutionelles Interesse, makroökonomische Absicherung), sieht sich aber kurzfristig Gegenwind durch Gewinnmitnahmen und breitere Risikoaversion gegenüber. Wenn Sie sich BTC ansehen: Es macht Sinn, die wichtigsten Unterstützungs- und Widerstandsbereiche im Auge zu behalten; ein sofortiger Einstieg birgt Risiken, wenn die $100K-Marke bricht.
{future}(BTCUSDT)
#StrategyBTCPurchase #StablecoinLaw #AITokensRally
$BTC (BTC)
📰 Neueste Aktualisierung
Bitcoin wird nahe $105.000 USD gehandelt, nachdem es am Wochenende von etwas unter $100.000 abgeprallt ist. �
Investing News Network (INN) +3
Der Rückgang auf ~$103K erfolgte im Zuge von Gewinnmitnahmen und einer Abkühlung des Interesses an Technologie-/KI-Vermögenswerten, was die Krypto-Stimmung belastete. �
The Economic Times
Die institutionelle Stimmung bleibt vorsichtig optimistisch: Umfragedaten zeigen, dass viele vermögende Privatpersonen und professionelle Investoren planen, ihre Krypto-Engagements trotz der jüngsten Volatilität zu erhöhen. �
marketwatch.com
📊 Was uns das sagt
Ein Halten über ~$100K ist eine psychologisch wichtige Unterstützungsregion — ein Bruch darunter könnte weitere Schwäche auslösen.
Eine Erholung deutet darauf hin, dass die Bullen wichtige Levels verteidigen, aber das Aufwärtspotenzial könnte begrenzt sein, bis die breitere Markt-Risikobereitschaft zurückkehrt (Technologieaktien, makroökonomische Daten usw.).
Institutionelle Ströme und der Zugang zu ETFs sind weiterhin unterstützende Rückenwinde, auch wenn die kurzfristige Dynamik gedämpft ist.
🔍 Wichtige Levels im Auge behalten
Unterstützung: ~$100.000 und die ~$99K-Zone, die kürzlich getestet wurde. �
Investing News Network (INN)
Widerstand: ~$110.000+ könnte vorerst als Deckel wirken, es sei denn, die Dynamik nimmt zu.
Katalysatoren:
Makroökonomische Daten (z. B. US-Arbeitsmarkt, Fed-Politik)
Wesentliche ETF-Ströme in Bitcoin
Regulatorische Entwicklungen weltweit
✅ Schneller Überblick
Bitcoin befindet sich in einer Konsolidierungsphase: Es bleibt in einem insgesamt bullishen strukturellen Setup (institutionelles Interesse, makroökonomische Absicherung), sieht sich aber kurzfristig Gegenwind durch Gewinnmitnahmen und breitere Risikoaversion gegenüber. Wenn Sie sich BTC ansehen: Es macht Sinn, die wichtigsten Unterstützungs- und Widerstandsbereiche im Auge zu behalten; ein sofortiger Einstieg birgt Risiken, wenn die $100K-Marke bricht.
#StrategyBTCPurchase #StablecoinLaw #AITokensRally
1
32
Übersetzung ansehen
$SOL
{spot}(SOLUSDT)
$ (SOL)
Here’s a short latest analysis of Solana (SOL):
🔍 Current Status
SOL is trading around $160–$165 at the moment. �
FXStreet +2
Technical indicators show weakness: for example, the 14-day RSI is relatively low, suggesting lack of strong momentum. �
Investing.com +1
On the ecosystem front: growing institutional interest and ETF flows are positive signals. �
Cryptonews +1
📈 Technical Outlook
Bullish scenario:
A falling wedge pattern has been identified on the daily chart. If SOL breaks above the upper trendline, a possible upside of ~22% could target ~$200. �
FXStreet +1
Some analysts project recovery toward ~$175-185 before month-end. �
Blockchain News
Bearish scenario:
If support fails — e.g., a break below ~$145–150 — there’s risk of further decline. �
Blockchain News +1
The broader crypto/tech market weakness is putting pressure on SOL’s price. �
CoinMarketCap +1
🧭 Key Levels to Watch
Support zone: ~$145 is a critical support line. �
Blockchain News
Resistance zone: ~$170–175 initially; ~$185+ if momentum returns. �
Blockchain News +1
Catalysts: ETF flows, network adoption, macro risk sentiment.
Risks: Market correlation with equities, low leverage build-up (open interest is muted) for SOL. �
FXStreet +1
✅ Quick Take
SOL is at a crossroads: while the long-term picture has some bullish underpinnings (institutional interest, ecosystem growth), near-term technicals and market sentiment are cautious. If you’re bullish, watching for a breakout above the wedge toward ~$200 could be interesting. If you’re cautious, keeping an eye on support near ~$145 is prudent.
Note: This is not financial advice — just a snapshot of current market conditions and technicals. Would you like a deeper dive into the ecosystem (e.g., projects built on Solana) or a comparison vs another token?#
#USGovShutdownEnd? #BinanceHODLerALLO #IPOWave #CPIWatch
$SOL
$ (SOL)
Here’s a short latest analysis of Solana (SOL):
🔍 Current Status
SOL is trading around $160–$165 at the moment. �
FXStreet +2
Technical indicators show weakness: for example, the 14-day RSI is relatively low, suggesting lack of strong momentum. �
Investing.com +1
On the ecosystem front: growing institutional interest and ETF flows are positive signals. �
Cryptonews +1
📈 Technical Outlook
Bullish scenario:
A falling wedge pattern has been identified on the daily chart. If SOL breaks above the upper trendline, a possible upside of ~22% could target ~$200. �
FXStreet +1
Some analysts project recovery toward ~$175-185 before month-end. �
Blockchain News
Bearish scenario:
If support fails — e.g., a break below ~$145–150 — there’s risk of further decline. �
Blockchain News +1
The broader crypto/tech market weakness is putting pressure on SOL’s price. �
CoinMarketCap +1
🧭 Key Levels to Watch
Support zone: ~$145 is a critical support line. �
Blockchain News
Resistance zone: ~$170–175 initially; ~$185+ if momentum returns. �
Blockchain News +1
Catalysts: ETF flows, network adoption, macro risk sentiment.
Risks: Market correlation with equities, low leverage build-up (open interest is muted) for SOL. �
FXStreet +1
✅ Quick Take
SOL is at a crossroads: while the long-term picture has some bullish underpinnings (institutional interest, ecosystem growth), near-term technicals and market sentiment are cautious. If you’re bullish, watching for a breakout above the wedge toward ~$200 could be interesting. If you’re cautious, keeping an eye on support near ~$145 is prudent.
Note: This is not financial advice — just a snapshot of current market conditions and technicals. Would you like a deeper dive into the ecosystem (e.g., projects built on Solana) or a comparison vs another token?#
#USGovShutdownEnd? #BinanceHODLerALLO #IPOWave #CPIWatch
29
Übersetzung ansehen
Short $BNB
{spot}(BNBUSDT)
(Binance Coin) update — quick read:
Price snapshot — BNB ≈ $970–975, down slightly over 24h with market cap ~$134B. �
Binance +1
Technical view — near-term resistance sits around $1,000–1,010; immediate support is testing the $970 psychological level, with a lower target near $959 if $970 breaks. Momentum shows short-term weakness after recent pullbacks. �
coindesk.com +1
Fundamental / catalysts — bullish tailwinds from increased institutional interest and partnerships earlier this year (example: Franklin Templeton tie-ups and large corporate buys), while on-chain adoption stories (BNB Chain partnerships, some national projects) keep medium-term narrative constructive. Regulatory and macro risk remain the main outsized threats. �
The Economic Times +2
What to watch next
Close above $1,010 with volume → continuation to prior highs. �
TradingView
Close below $970 → watch for sellers toward $959 and then the monthly support band. �
coindesk.com
Quick take: BNB is range-bound for now — watch $970 as the key line in the sand. Trade with defined risk; this isn’t financial advice.
#USGovShutdownEnd? #StrategyBTCPurchase #BuiltonSolayer
Short $BNB
(Binance Coin) update — quick read:
Price snapshot — BNB ≈ $970–975, down slightly over 24h with market cap ~$134B. �
Binance +1
Technical view — near-term resistance sits around $1,000–1,010; immediate support is testing the $970 psychological level, with a lower target near $959 if $970 breaks. Momentum shows short-term weakness after recent pullbacks. �
coindesk.com +1
Fundamental / catalysts — bullish tailwinds from increased institutional interest and partnerships earlier this year (example: Franklin Templeton tie-ups and large corporate buys), while on-chain adoption stories (BNB Chain partnerships, some national projects) keep medium-term narrative constructive. Regulatory and macro risk remain the main outsized threats. �
The Economic Times +2
What to watch next
Close above $1,010 with volume → continuation to prior highs. �
TradingView
Close below $970 → watch for sellers toward $959 and then the monthly support band. �
coindesk.com
Quick take: BNB is range-bound for now — watch $970 as the key line in the sand. Trade with defined risk; this isn’t financial advice.
#USGovShutdownEnd? #StrategyBTCPurchase #BuiltonSolayer
27
Übersetzung ansehen
etherium latest analysis $ETH (ETH) — Latest Analysis
1. Current Snapshot
The live price of Ethereum is around USD 3,440 according to recent data. �
CoinMarketCap +2
On-chain & technical metrics paint a mixed picture:
The 14-day RSI (Relative Strength Index) for ETH/USD is showing a sell signal (about 38.55) in one source. �
Investing.com
Moving averages give conflicting signals: some shorter-term averages suggest a “Buy” while others (e.g., 50-day MA) point to “Sell”. �
Investing.com
Recent news: According to Citi, a year-end price target is USD 4,300 for Ethereum, assuming favorable conditions. �
Meanwhile, Standard Chartered has set a more bullish target of USD 7,500 by year-end. �
Reuters
Reuters
2. Key Levels & What to Watch
Support levels:
A near-term support zone appears around USD 3,200-3,300, where buyers may step in if price weakens further. �
TradingView +1
Resistance levels:
The zone around USD 3,600-3,700 is a barrier that ETH must clear to resume stronger bullish momentum. �
FXStreet +1
Catalysts and risks:
Catalysts: Increased staking demand (ETH functions within a proof-of-stake system), institutional flow into ETH ETFs, network growth (DeFi, smart contracts).
Risks: Macroeconomic headwinds, regulatory uncertainty, competition from other blockchains, and technical indicators signalling caution.
3. Fundamental / Structural Drivers
Ethereum’s ecosystem remains strong: Many decentralized applications (dApps), DeFi platforms and NFTs still rely on the Ethereum blockchain.
The protocol’s shift to proof-of-stake increases its utility (staking yields) and reduces some supply pressure.
According to Citi, the recent price strength may reflect sentiment more than underlying activity. �
Reuters
4. Summary View & Strategy Implications
Short term: The technicals suggest caution—market may consolidate or pull back if resistance holds and support breaks.
Medium term: If ETH clears resistance (~USD 3,600-3,700) and sees strong ecosystem growth and fund flows, the case for upside strengthens (targets USD 4,000+).
Strategy note: For traders: look for confirmation of support or a breakout above resistance before significant entry. For investors: align with the long-term structural thesis (staking, network growth), and be prepared for volatility.
{spot}(ETHUSDT)
#CryptoScamSurge #BinanceHODLerALLO #AltcoinMarketRecovery
etherium latest analysis
$ETH (ETH) — Latest Analysis
1. Current Snapshot
The live price of Ethereum is around USD 3,440 according to recent data. �
CoinMarketCap +2
On-chain & technical metrics paint a mixed picture:
The 14-day RSI (Relative Strength Index) for ETH/USD is showing a sell signal (about 38.55) in one source. �
Investing.com
Moving averages give conflicting signals: some shorter-term averages suggest a “Buy” while others (e.g., 50-day MA) point to “Sell”. �
Investing.com
Recent news: According to Citi, a year-end price target is USD 4,300 for Ethereum, assuming favorable conditions. �
Meanwhile, Standard Chartered has set a more bullish target of USD 7,500 by year-end. �
Reuters
Reuters
2. Key Levels & What to Watch
Support levels:
A near-term support zone appears around USD 3,200-3,300, where buyers may step in if price weakens further. �
TradingView +1
Resistance levels:
The zone around USD 3,600-3,700 is a barrier that ETH must clear to resume stronger bullish momentum. �
FXStreet +1
Catalysts and risks:
Catalysts: Increased staking demand (ETH functions within a proof-of-stake system), institutional flow into ETH ETFs, network growth (DeFi, smart contracts).
Risks: Macroeconomic headwinds, regulatory uncertainty, competition from other blockchains, and technical indicators signalling caution.
3. Fundamental / Structural Drivers
Ethereum’s ecosystem remains strong: Many decentralized applications (dApps), DeFi platforms and NFTs still rely on the Ethereum blockchain.
The protocol’s shift to proof-of-stake increases its utility (staking yields) and reduces some supply pressure.
According to Citi, the recent price strength may reflect sentiment more than underlying activity. �
Reuters
4. Summary View & Strategy Implications
Short term: The technicals suggest caution—market may consolidate or pull back if resistance holds and support breaks.
Medium term: If ETH clears resistance (~USD 3,600-3,700) and sees strong ecosystem growth and fund flows, the case for upside strengthens (targets USD 4,000+).
Strategy note: For traders: look for confirmation of support or a breakout above resistance before significant entry. For investors: align with the long-term structural thesis (staking, network growth), and be prepared for volatility.
#CryptoScamSurge #BinanceHODLerALLO #AltcoinMarketRecovery
6
19
Übersetzung ansehen
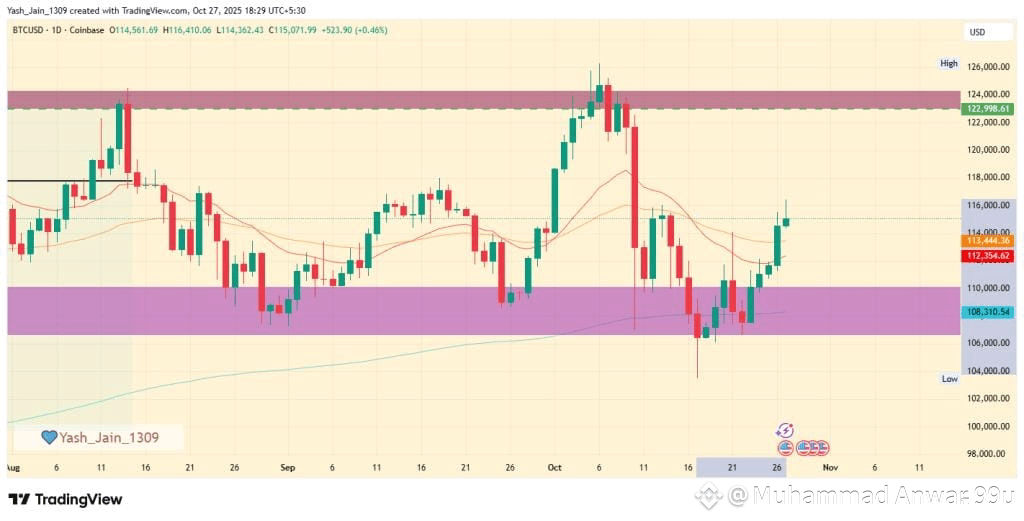
latest analysis $BTC Bitcoin (BTC) — Latest Analysis
1. Current Situation
Bitcoin is trading around USD ~104,700 (≈ USD 104.7 k) as of now.
Bitcoin (BTC)
$104732.00
-$398.00 (-0.38%) Today
1D
5D
1M
6M
YTD
1Y
5Y
The price has recently pulled back after touching higher levels (~USD 107 k) due to profit-taking and weakening demand in related markets (e.g., tech/AI). �
The Economic Times +4
From a technical perspective:
Moving averages and trend-indicators show mixed signals: some averaging windows point to a strong buy, others suggest sell or neutral. �
Investing.com +1
Price structure suggests risk of deeper drop if key support breaks. �
CryptoPotato +1
2. Key Levels to Watch
Support: Around USD 100 k or just below seems critical; a break below this would raise risk of a sharper correction. �
CryptoPotato +1
Resistance: Zones near USD 115 k-118 k are significant; reclaiming and sustaining above these will be bullish for next leg up. �
financemagnates.com +1
Potential target: Some analysts see upside toward USD 150 k-180 k in early 2026 if momentum returns and institutional flows remain strong. �
CryptoRank +1
3. Underlying Drivers
Institutional / macro factors: Interest rate expectations, ETF flows, and regulatory clarity are influencing demand. �
financemagnates.com +1
On-chain & liquidity signals: Some rare liquidity conditions historically preceding large Bitcoin rallies are re-emerging according to recent analysis.
Market structure & sentiment: Bearish signals are appearing (weakening structure, lower volume on up-moves) suggesting caution.
4. Conclusion & View
In short: Bitcoin remains in a critical phase. The upside potential is meaningful if key resistance is overcome and broader macro/flow factors turn favourable. But the downside risk is real if support weakens and momentum fails.
My view: A balanced stance — consider exposure but be prepared for volatility. If you’re holding or looking to buy, watching the ~$100 k support zone is vital. For longer-term horizon (12–18 months), the target range of $150 k+ is plausible but not guaranted.
#USGovShutdownEnd? #BinanceHODLerALLO #BinanceHODLerC #ProjectCrypto
latest analysis
$BTC Bitcoin (BTC) — Latest Analysis
1. Current Situation
Bitcoin is trading around USD ~104,700 (≈ USD 104.7 k) as of now.
Bitcoin (BTC)
$104732.00
-$398.00 (-0.38%) Today
1D
5D
1M
6M
YTD
1Y
5Y
The price has recently pulled back after touching higher levels (~USD 107 k) due to profit-taking and weakening demand in related markets (e.g., tech/AI). �
The Economic Times +4
From a technical perspective:
Moving averages and trend-indicators show mixed signals: some averaging windows point to a strong buy, others suggest sell or neutral. �
Investing.com +1
Price structure suggests risk of deeper drop if key support breaks. �
CryptoPotato +1
2. Key Levels to Watch
Support: Around USD 100 k or just below seems critical; a break below this would raise risk of a sharper correction. �
CryptoPotato +1
Resistance: Zones near USD 115 k-118 k are significant; reclaiming and sustaining above these will be bullish for next leg up. �
financemagnates.com +1
Potential target: Some analysts see upside toward USD 150 k-180 k in early 2026 if momentum returns and institutional flows remain strong. �
CryptoRank +1
3. Underlying Drivers
Institutional / macro factors: Interest rate expectations, ETF flows, and regulatory clarity are influencing demand. �
financemagnates.com +1
On-chain & liquidity signals: Some rare liquidity conditions historically preceding large Bitcoin rallies are re-emerging according to recent analysis.
Market structure & sentiment: Bearish signals are appearing (weakening structure, lower volume on up-moves) suggesting caution.
4. Conclusion & View
In short: Bitcoin remains in a critical phase. The upside potential is meaningful if key resistance is overcome and broader macro/flow factors turn favourable. But the downside risk is real if support weakens and momentum fails.
My view: A balanced stance — consider exposure but be prepared for volatility. If you’re holding or looking to buy, watching the ~$100 k support zone is vital. For longer-term horizon (12–18 months), the target range of $150 k+ is plausible but not guaranted.
#USGovShutdownEnd? #BinanceHODLerALLO #BinanceHODLerC #ProjectCrypto
11
18
Anmelden und weiter Inhalte entdecken
Krypto-Nutzer weltweit auf Binance Square kennenlernen
⚡️ Bleib in Sachen Krypto stets am Puls.
💬 Die weltgrößte Kryptobörse vertraut darauf.
👍 Erhalte verlässliche Einblicke von verifizierten Creators.
E-Mail-Adresse/Telefonnummer
Trendthemen
BinancePick
3M Aufrufe
151,594 Kommentare
Mach bei #Gewinnsaison mit: Prognostiziere Unternehmensergebnisse auf Binance Pick und teile deine Meinung auf Binance Square!
Binance Square Official
·408 Likes
·342.3k Aufrufe
EarningsSeason
5.2M Aufrufe
25,772 Kommentare
AnthropicTTMRevenueGrewAbout1200%
18,112 Aufrufe
329 Kommentare