
Bilal Hussain Siddiqui 1992
15 Beiträge

Bilal Hussain Siddiqui 1992
Melden
Nutzer blockieren
5 Following
20 Follower
28 Like gegeben
Beiträge
Alle
Zitierungen
$BTC
{spot}(BTCUSDT)
# BITCOIN-MARKTUPDATE: BTC TESTET 75.000 $
Bitcoin geriet am 6. November 2026 erneut unter Verkaufsdruck und fiel auf etwa 74.762 $, während Halbleiter- und Technologieaktien eine Erholung verzeichneten.
Wichtige Marktfaktoren:
BTC fiel unter die psychologisch wichtige Marke von 75.000 $.
Nvidia erholte sich im Freitagshandel um etwa 5,6 %.
Halbleiteraktien erholten sich nach den starken Verlusten am Donnerstag.
In den USA kamen 165.000 Arbeitsplätze hinzu – erwartet worden waren 65.000.
Höhere Zinserwartungen setzten Risikoanlagen unter Druck.
Wichtige BTC-Marken:
🔴 Widerstand: 80.000–82.000 $
🟡 Unterstützungsbereich: 75.000–76.000 $
🟢 Mögliches Erholungspotenzial: über 80.000 $
⚠️ Abwärtsziele: 73.000 $ und 69.000 $
Marktausblick: Bitcoin benötigt ein höheres Kaufvolumen und eine anhaltende Erholung über den Widerstand, um eine überzeugende bullische Struktur auszubilden.
#CryptoNews🔒📰🚫
#Bitcoinprice
#cryptotrading
#USMidtermsCouldShakeUpUS-IranTies
#IranWarWillEndVerySoon
$BTC
# BITCOIN-MARKTUPDATE: BTC TESTET 75.000 $
Bitcoin geriet am 6. November 2026 erneut unter Verkaufsdruck und fiel auf etwa 74.762 $, während Halbleiter- und Technologieaktien eine Erholung verzeichneten.
Wichtige Marktfaktoren:
BTC fiel unter die psychologisch wichtige Marke von 75.000 $.
Nvidia erholte sich im Freitagshandel um etwa 5,6 %.
Halbleiteraktien erholten sich nach den starken Verlusten am Donnerstag.
In den USA kamen 165.000 Arbeitsplätze hinzu – erwartet worden waren 65.000.
Höhere Zinserwartungen setzten Risikoanlagen unter Druck.
Wichtige BTC-Marken:
🔴 Widerstand: 80.000–82.000 $
🟡 Unterstützungsbereich: 75.000–76.000 $
🟢 Mögliches Erholungspotenzial: über 80.000 $
⚠️ Abwärtsziele: 73.000 $ und 69.000 $
Marktausblick: Bitcoin benötigt ein höheres Kaufvolumen und eine anhaltende Erholung über den Widerstand, um eine überzeugende bullische Struktur auszubilden.
#CryptoNews🔒📰🚫
#Bitcoinprice
#cryptotrading
#USMidtermsCouldShakeUpUS-IranTies
#IranWarWillEndVerySoon
# BITCOIN-MARKTUPDATE: BTC TESTET 75.000 $
Bitcoin geriet am 6. November 2026 erneut unter Verkaufsdruck und fiel auf etwa 74.762 $, während Halbleiter- und Technologieaktien eine Erholung verzeichneten.
Wichtige Marktfaktoren:
BTC fiel unter die psychologisch wichtige Marke von 75.000 $.
Nvidia erholte sich im Freitagshandel um etwa 5,6 %.
Halbleiteraktien erholten sich nach den starken Verlusten am Donnerstag.
In den USA kamen 165.000 Arbeitsplätze hinzu – erwartet worden waren 65.000.
Höhere Zinserwartungen setzten Risikoanlagen unter Druck.
Wichtige BTC-Marken:
🔴 Widerstand: 80.000–82.000 $
🟡 Unterstützungsbereich: 75.000–76.000 $
🟢 Mögliches Erholungspotenzial: über 80.000 $
⚠️ Abwärtsziele: 73.000 $ und 69.000 $
Marktausblick: Bitcoin benötigt ein höheres Kaufvolumen und eine anhaltende Erholung über den Widerstand, um eine überzeugende bullische Struktur auszubilden.
#CryptoNews🔒📰🚫
#Bitcoinprice
#cryptotrading
#USMidtermsCouldShakeUpUS-IranTies
#IranWarWillEndVerySoon
49
Übersetzung ansehen
$XAU
{future}(XAUUSDT)
Trade Direction: Long / Buy (Rebound off local support)
Deal Entry Price: $4,055.00 – $4,065.00 (Current market area / minor liquidity sweep retest)
Stop-Loss (SL): $3,995.00 (PlACED securely below the recent swing low / psychological $4,000 handle to avoid wick-outs)
Target 1 (TP1): $4,150.00 (Mid-range resistance and previous congestion)
Target 2 (TP2): $4,220.00 (Upper supply zone / major swing high)
Risk-to-Reward Ratio (R:R): Approx. 1 : 2.2 (targeting TP1) to 1 : 3.3 (targeting TP2)
Market Structure & Range Bound Context:
On the daily timeframe, gold has been carving out a corrective descending structure after failing to sustain momentum above the $4,200+ highs earlier in the macro sequence.
However, price recently attempted a sharp recovery leg from the sub-$3,900 demand pocket (late October lows near $3,870), showing that heavy institutional buyers step in aggressively when deep discounts occur.
Liquidity Sweep / Support Defense:
The current price action shows a mild pullback/retest candle right around the $4,061 mark. This acts as a short-term equilibrium level.
A break below the psychological round number of $4,000 would invalidate the immediate bullish thesis, making $3,995 the logical boundary to protect capital.
Probability & Risk Management
Estimated Probability of Profit: ~50% – 55% (typical for counter-trend or range-rebound swing setups in commodities).
Execution Note: Because gold can experience high volatility around macroeconomic data releases (such as US employment reports or central bank policy shifts), it is vital to risk no more than 1% to 2% of your total trading account balance on this idea. Scale out partial profits at Target 1 and move your stop-loss to entry to secure a risk-free trade for the remaining position toward Target 2.
#JobsReportRaisesHikeOdds #WillAnthropicListOnTime #USNovemberMichiganExpectationsIndexPrelimAt50.9 #TradFiForBeginners #USMidtermsCouldShakeUpUS-IranTies
$XAU
Trade Direction: Long / Buy (Rebound off local support)
Deal Entry Price: $4,055.00 – $4,065.00 (Current market area / minor liquidity sweep retest)
Stop-Loss (SL): $3,995.00 (PlACED securely below the recent swing low / psychological $4,000 handle to avoid wick-outs)
Target 1 (TP1): $4,150.00 (Mid-range resistance and previous congestion)
Target 2 (TP2): $4,220.00 (Upper supply zone / major swing high)
Risk-to-Reward Ratio (R:R): Approx. 1 : 2.2 (targeting TP1) to 1 : 3.3 (targeting TP2)
Market Structure & Range Bound Context:
On the daily timeframe, gold has been carving out a corrective descending structure after failing to sustain momentum above the $4,200+ highs earlier in the macro sequence.
However, price recently attempted a sharp recovery leg from the sub-$3,900 demand pocket (late October lows near $3,870), showing that heavy institutional buyers step in aggressively when deep discounts occur.
Liquidity Sweep / Support Defense:
The current price action shows a mild pullback/retest candle right around the $4,061 mark. This acts as a short-term equilibrium level.
A break below the psychological round number of $4,000 would invalidate the immediate bullish thesis, making $3,995 the logical boundary to protect capital.
Probability & Risk Management
Estimated Probability of Profit: ~50% – 55% (typical for counter-trend or range-rebound swing setups in commodities).
Execution Note: Because gold can experience high volatility around macroeconomic data releases (such as US employment reports or central bank policy shifts), it is vital to risk no more than 1% to 2% of your total trading account balance on this idea. Scale out partial profits at Target 1 and move your stop-loss to entry to secure a risk-free trade for the remaining position toward Target 2.
#JobsReportRaisesHikeOdds #WillAnthropicListOnTime #USNovemberMichiganExpectationsIndexPrelimAt50.9 #TradFiForBeginners #USMidtermsCouldShakeUpUS-IranTies
Trade Direction: Long / Buy (Rebound off local support)
Deal Entry Price: $4,055.00 – $4,065.00 (Current market area / minor liquidity sweep retest)
Stop-Loss (SL): $3,995.00 (PlACED securely below the recent swing low / psychological $4,000 handle to avoid wick-outs)
Target 1 (TP1): $4,150.00 (Mid-range resistance and previous congestion)
Target 2 (TP2): $4,220.00 (Upper supply zone / major swing high)
Risk-to-Reward Ratio (R:R): Approx. 1 : 2.2 (targeting TP1) to 1 : 3.3 (targeting TP2)
Market Structure & Range Bound Context:
On the daily timeframe, gold has been carving out a corrective descending structure after failing to sustain momentum above the $4,200+ highs earlier in the macro sequence.
However, price recently attempted a sharp recovery leg from the sub-$3,900 demand pocket (late October lows near $3,870), showing that heavy institutional buyers step in aggressively when deep discounts occur.
Liquidity Sweep / Support Defense:
The current price action shows a mild pullback/retest candle right around the $4,061 mark. This acts as a short-term equilibrium level.
A break below the psychological round number of $4,000 would invalidate the immediate bullish thesis, making $3,995 the logical boundary to protect capital.
Probability & Risk Management
Estimated Probability of Profit: ~50% – 55% (typical for counter-trend or range-rebound swing setups in commodities).
Execution Note: Because gold can experience high volatility around macroeconomic data releases (such as US employment reports or central bank policy shifts), it is vital to risk no more than 1% to 2% of your total trading account balance on this idea. Scale out partial profits at Target 1 and move your stop-loss to entry to secure a risk-free trade for the remaining position toward Target 2.
#JobsReportRaisesHikeOdds #WillAnthropicListOnTime #USNovemberMichiganExpectationsIndexPrelimAt50.9 #TradFiForBeginners #USMidtermsCouldShakeUpUS-IranTies
1
114
Übersetzung ansehen
$BNB
{spot}(BNBUSDT)
A strong sell-off from approximately 716–718 down to 688, followed by sideways consolidation. Buyers have not yet demonstrated a convincing trend reversal
Strong bearish impulse from 716 towards 688.
Price is consolidating between approximately 688 and 698.
Repeated resistance around 696–698.
Support around 691–692.
Sellers still have an advantage unless resistance breaks.
Pattern: Possible bearish flag / sideways consolidation after a sharp decline.
Entry 696.00
Stop-loss 699.20
Take profit 1 692.00
Take profit 2 689.50
Take profit 3 687.00
Price zone Interpretation
700–704 Stronger resistance
696–698 Immediate resistance
694–695 Current trading area
691–692 First support
687–688 Major support
684–685 Lower support
Condition: A strong 30-minute candle must close above 698, followed by a successful retest.
Short setups are currently more attractive than long setups, but wait for rejection near 696–698. Risk no more than 1% of your trading capital.
#JobsReportRaisesHikeOdds #WillAnthropicListOnTime #USNovemberMichiganExpectationsIndexPrelimAt50.9 #TradFiForBeginners #USMidtermsCouldShakeUpUS-IranTies $
$BNB
A strong sell-off from approximately 716–718 down to 688, followed by sideways consolidation. Buyers have not yet demonstrated a convincing trend reversal
Strong bearish impulse from 716 towards 688.
Price is consolidating between approximately 688 and 698.
Repeated resistance around 696–698.
Support around 691–692.
Sellers still have an advantage unless resistance breaks.
Pattern: Possible bearish flag / sideways consolidation after a sharp decline.
Entry 696.00
Stop-loss 699.20
Take profit 1 692.00
Take profit 2 689.50
Take profit 3 687.00
Price zone Interpretation
700–704 Stronger resistance
696–698 Immediate resistance
694–695 Current trading area
691–692 First support
687–688 Major support
684–685 Lower support
Condition: A strong 30-minute candle must close above 698, followed by a successful retest.
Short setups are currently more attractive than long setups, but wait for rejection near 696–698. Risk no more than 1% of your trading capital.
#JobsReportRaisesHikeOdds #WillAnthropicListOnTime #USNovemberMichiganExpectationsIndexPrelimAt50.9 #TradFiForBeginners #USMidtermsCouldShakeUpUS-IranTies $
A strong sell-off from approximately 716–718 down to 688, followed by sideways consolidation. Buyers have not yet demonstrated a convincing trend reversal
Strong bearish impulse from 716 towards 688.
Price is consolidating between approximately 688 and 698.
Repeated resistance around 696–698.
Support around 691–692.
Sellers still have an advantage unless resistance breaks.
Pattern: Possible bearish flag / sideways consolidation after a sharp decline.
Entry 696.00
Stop-loss 699.20
Take profit 1 692.00
Take profit 2 689.50
Take profit 3 687.00
Price zone Interpretation
700–704 Stronger resistance
696–698 Immediate resistance
694–695 Current trading area
691–692 First support
687–688 Major support
684–685 Lower support
Condition: A strong 30-minute candle must close above 698, followed by a successful retest.
Short setups are currently more attractive than long setups, but wait for rejection near 696–698. Risk no more than 1% of your trading capital.
#JobsReportRaisesHikeOdds #WillAnthropicListOnTime #USNovemberMichiganExpectationsIndexPrelimAt50.9 #TradFiForBeginners #USMidtermsCouldShakeUpUS-IranTies $
75
Übersetzung ansehen
$BTC Analysis: Sellers have strong control after a major bearish move from approximately 80,500 to 76,000. Price is now consolidating sideways near the lows
Strong bearish impulse from 80,500.
Previous support around 76,000 was broken.
Price is forming a sideways consolidation.
Repeated rejection around 76,200–76,400.
Support is approximately 75,300–75,500
This looks like a bearish flag / post-breakdown consolidation, although a confirmed breakout is still needed.
Entry 75,350–75,500
Stop-loss 76,050
Target 1 74,800
Target 2 74,300
Target 3 73,800
Important: Enter only if price retests 75,350–75,500 and shows bearish rejection on the 30-minute chart. Do not enter simply because price reaches this level.
TP1: approximately 1:0.92
TP2: approximately 1:1.69
TP3: approximately 1:2.46
Important support and resistance
Zone Price Importance
Resistance 76,200–76,400 Strong
Resistance 76,000 Previous support
Current zone 75,700 Consolidation
Support 75,300–75,500 Important
Lower support 74,800 Target zone
Lower support 74,300 Target zone
Protect your capital and risk no more than 1% per trade.
#JobsReportRaisesHikeOdds #WillAnthropicListOnTime #USNovemberMichiganExpectationsIndexPrelimAt50.9 #TradFiForBeginners #USMidtermsCouldShakeUpUS-IranTies
$BTC Analysis: Sellers have strong control after a major bearish move from approximately 80,500 to 76,000. Price is now consolidating sideways near the lows
Strong bearish impulse from 80,500.
Previous support around 76,000 was broken.
Price is forming a sideways consolidation.
Repeated rejection around 76,200–76,400.
Support is approximately 75,300–75,500
This looks like a bearish flag / post-breakdown consolidation, although a confirmed breakout is still needed.
Entry 75,350–75,500
Stop-loss 76,050
Target 1 74,800
Target 2 74,300
Target 3 73,800
Important: Enter only if price retests 75,350–75,500 and shows bearish rejection on the 30-minute chart. Do not enter simply because price reaches this level.
TP1: approximately 1:0.92
TP2: approximately 1:1.69
TP3: approximately 1:2.46
Important support and resistance
Zone Price Importance
Resistance 76,200–76,400 Strong
Resistance 76,000 Previous support
Current zone 75,700 Consolidation
Support 75,300–75,500 Important
Lower support 74,800 Target zone
Lower support 74,300 Target zone
Protect your capital and risk no more than 1% per trade.
#JobsReportRaisesHikeOdds #WillAnthropicListOnTime #USNovemberMichiganExpectationsIndexPrelimAt50.9 #TradFiForBeginners #USMidtermsCouldShakeUpUS-IranTies
Strong bearish impulse from 80,500.
Previous support around 76,000 was broken.
Price is forming a sideways consolidation.
Repeated rejection around 76,200–76,400.
Support is approximately 75,300–75,500
This looks like a bearish flag / post-breakdown consolidation, although a confirmed breakout is still needed.
Entry 75,350–75,500
Stop-loss 76,050
Target 1 74,800
Target 2 74,300
Target 3 73,800
Important: Enter only if price retests 75,350–75,500 and shows bearish rejection on the 30-minute chart. Do not enter simply because price reaches this level.
TP1: approximately 1:0.92
TP2: approximately 1:1.69
TP3: approximately 1:2.46
Important support and resistance
Zone Price Importance
Resistance 76,200–76,400 Strong
Resistance 76,000 Previous support
Current zone 75,700 Consolidation
Support 75,300–75,500 Important
Lower support 74,800 Target zone
Lower support 74,300 Target zone
Protect your capital and risk no more than 1% per trade.
#JobsReportRaisesHikeOdds #WillAnthropicListOnTime #USNovemberMichiganExpectationsIndexPrelimAt50.9 #TradFiForBeginners #USMidtermsCouldShakeUpUS-IranTies
1
72
Übersetzung ansehen
waiting for next TP ..
waiting for next TP ..
Bilal Hussain Siddiqui 1992
·
--
$BTC Trade Long
$BTC Einstiegspreis: Warten Sie auf einen bestätigten Ausbruch über 104.000 USDT (deutlicher Schluss über dem Mittelband des Kanals und lokalem Widerstand).
Bullish Kerzenschluss mit steigendem Volumen.
Stop-Loss:
Platzieren Sie SL unter 102.800 USDT, direkt unter dem jüngsten Swing-Tief und dem unteren Band des Kanals.
Take-Profit-Ziele (mit Risiko:Ertrag):
Zielpreis TP1-104.8001.5 TP2-105.6002.5 TP3-106.4003.5
#BinanceHODLerALLO #APRBinanceTGE #StrategyBTCPurchase #USGovShutdownEnd? #CPIWatch
$BTC Einstiegspreis: Warten Sie auf einen bestätigten Ausbruch über 104.000 USDT (deutlicher Schluss über dem Mittelband des Kanals und lokalem Widerstand).
Bullish Kerzenschluss mit steigendem Volumen.
Stop-Loss:
Platzieren Sie SL unter 102.800 USDT, direkt unter dem jüngsten Swing-Tief und dem unteren Band des Kanals.
Take-Profit-Ziele (mit Risiko:Ertrag):
Zielpreis TP1-104.8001.5 TP2-105.6002.5 TP3-106.4003.5
#BinanceHODLerALLO #APRBinanceTGE #StrategyBTCPurchase #USGovShutdownEnd? #CPIWatch
Übersetzung ansehen
like and follow please
like and follow please
Bilal Hussain Siddiqui 1992
·
--
$BTC Trade Long
$BTC Einstiegspreis: Warten Sie auf einen bestätigten Ausbruch über 104.000 USDT (deutlicher Schluss über dem Mittelband des Kanals und lokalem Widerstand).
Bullish Kerzenschluss mit steigendem Volumen.
Stop-Loss:
Platzieren Sie SL unter 102.800 USDT, direkt unter dem jüngsten Swing-Tief und dem unteren Band des Kanals.
Take-Profit-Ziele (mit Risiko:Ertrag):
Zielpreis TP1-104.8001.5 TP2-105.6002.5 TP3-106.4003.5
#BinanceHODLerALLO #APRBinanceTGE #StrategyBTCPurchase #USGovShutdownEnd? #CPIWatch
$BTC Einstiegspreis: Warten Sie auf einen bestätigten Ausbruch über 104.000 USDT (deutlicher Schluss über dem Mittelband des Kanals und lokalem Widerstand).
Bullish Kerzenschluss mit steigendem Volumen.
Stop-Loss:
Platzieren Sie SL unter 102.800 USDT, direkt unter dem jüngsten Swing-Tief und dem unteren Band des Kanals.
Take-Profit-Ziele (mit Risiko:Ertrag):
Zielpreis TP1-104.8001.5 TP2-105.6002.5 TP3-106.4003.5
#BinanceHODLerALLO #APRBinanceTGE #StrategyBTCPurchase #USGovShutdownEnd? #CPIWatch
1
1
Übersetzung ansehen
TP 1 HIT ...
TP 1 HIT ...
Bilal Hussain Siddiqui 1992
·
--
$BTC Trade Long
$BTC Einstiegspreis: Warten Sie auf einen bestätigten Ausbruch über 104.000 USDT (deutlicher Schluss über dem Mittelband des Kanals und lokalem Widerstand).
Bullish Kerzenschluss mit steigendem Volumen.
Stop-Loss:
Platzieren Sie SL unter 102.800 USDT, direkt unter dem jüngsten Swing-Tief und dem unteren Band des Kanals.
Take-Profit-Ziele (mit Risiko:Ertrag):
Zielpreis TP1-104.8001.5 TP2-105.6002.5 TP3-106.4003.5
#BinanceHODLerALLO #APRBinanceTGE #StrategyBTCPurchase #USGovShutdownEnd? #CPIWatch
$BTC Einstiegspreis: Warten Sie auf einen bestätigten Ausbruch über 104.000 USDT (deutlicher Schluss über dem Mittelband des Kanals und lokalem Widerstand).
Bullish Kerzenschluss mit steigendem Volumen.
Stop-Loss:
Platzieren Sie SL unter 102.800 USDT, direkt unter dem jüngsten Swing-Tief und dem unteren Band des Kanals.
Take-Profit-Ziele (mit Risiko:Ertrag):
Zielpreis TP1-104.8001.5 TP2-105.6002.5 TP3-106.4003.5
#BinanceHODLerALLO #APRBinanceTGE #StrategyBTCPurchase #USGovShutdownEnd? #CPIWatch
1
1
Übersetzung ansehen
Bilal Hussain Siddiqui 1992
·
--
$BTC Trade Long
$BTC Einstiegspreis: Warten Sie auf einen bestätigten Ausbruch über 104.000 USDT (deutlicher Schluss über dem Mittelband des Kanals und lokalem Widerstand).
Bullish Kerzenschluss mit steigendem Volumen.
Stop-Loss:
Platzieren Sie SL unter 102.800 USDT, direkt unter dem jüngsten Swing-Tief und dem unteren Band des Kanals.
Take-Profit-Ziele (mit Risiko:Ertrag):
Zielpreis TP1-104.8001.5 TP2-105.6002.5 TP3-106.4003.5
#BinanceHODLerALLO #APRBinanceTGE #StrategyBTCPurchase #USGovShutdownEnd? #CPIWatch
$BTC Einstiegspreis: Warten Sie auf einen bestätigten Ausbruch über 104.000 USDT (deutlicher Schluss über dem Mittelband des Kanals und lokalem Widerstand).
Bullish Kerzenschluss mit steigendem Volumen.
Stop-Loss:
Platzieren Sie SL unter 102.800 USDT, direkt unter dem jüngsten Swing-Tief und dem unteren Band des Kanals.
Take-Profit-Ziele (mit Risiko:Ertrag):
Zielpreis TP1-104.8001.5 TP2-105.6002.5 TP3-106.4003.5
#BinanceHODLerALLO #APRBinanceTGE #StrategyBTCPurchase #USGovShutdownEnd? #CPIWatch
1
1
$BTC Trade Long
$BTC Einstiegspreis: Warten Sie auf einen bestätigten Ausbruch über 104.000 USDT (deutlicher Schluss über dem Mittelband des Kanals und lokalem Widerstand).
Bullish Kerzenschluss mit steigendem Volumen.
Stop-Loss:
Platzieren Sie SL unter 102.800 USDT, direkt unter dem jüngsten Swing-Tief und dem unteren Band des Kanals.
Take-Profit-Ziele (mit Risiko:Ertrag):
Zielpreis TP1-104.8001.5 TP2-105.6002.5 TP3-106.4003.5
{future}(BTCUSDT)
#BinanceHODLerALLO #APRBinanceTGE #StrategyBTCPurchase #USGovShutdownEnd? #CPIWatch
$BTC Trade Long
$BTC Einstiegspreis: Warten Sie auf einen bestätigten Ausbruch über 104.000 USDT (deutlicher Schluss über dem Mittelband des Kanals und lokalem Widerstand).
Bullish Kerzenschluss mit steigendem Volumen.
Stop-Loss:
Platzieren Sie SL unter 102.800 USDT, direkt unter dem jüngsten Swing-Tief und dem unteren Band des Kanals.
Take-Profit-Ziele (mit Risiko:Ertrag):
Zielpreis TP1-104.8001.5 TP2-105.6002.5 TP3-106.4003.5
#BinanceHODLerALLO #APRBinanceTGE #StrategyBTCPurchase #USGovShutdownEnd? #CPIWatch
$BTC Einstiegspreis: Warten Sie auf einen bestätigten Ausbruch über 104.000 USDT (deutlicher Schluss über dem Mittelband des Kanals und lokalem Widerstand).
Bullish Kerzenschluss mit steigendem Volumen.
Stop-Loss:
Platzieren Sie SL unter 102.800 USDT, direkt unter dem jüngsten Swing-Tief und dem unteren Band des Kanals.
Take-Profit-Ziele (mit Risiko:Ertrag):
Zielpreis TP1-104.8001.5 TP2-105.6002.5 TP3-106.4003.5
#BinanceHODLerALLO #APRBinanceTGE #StrategyBTCPurchase #USGovShutdownEnd? #CPIWatch
3
4
2
27
·
--
Bullisch
Übersetzung ansehen
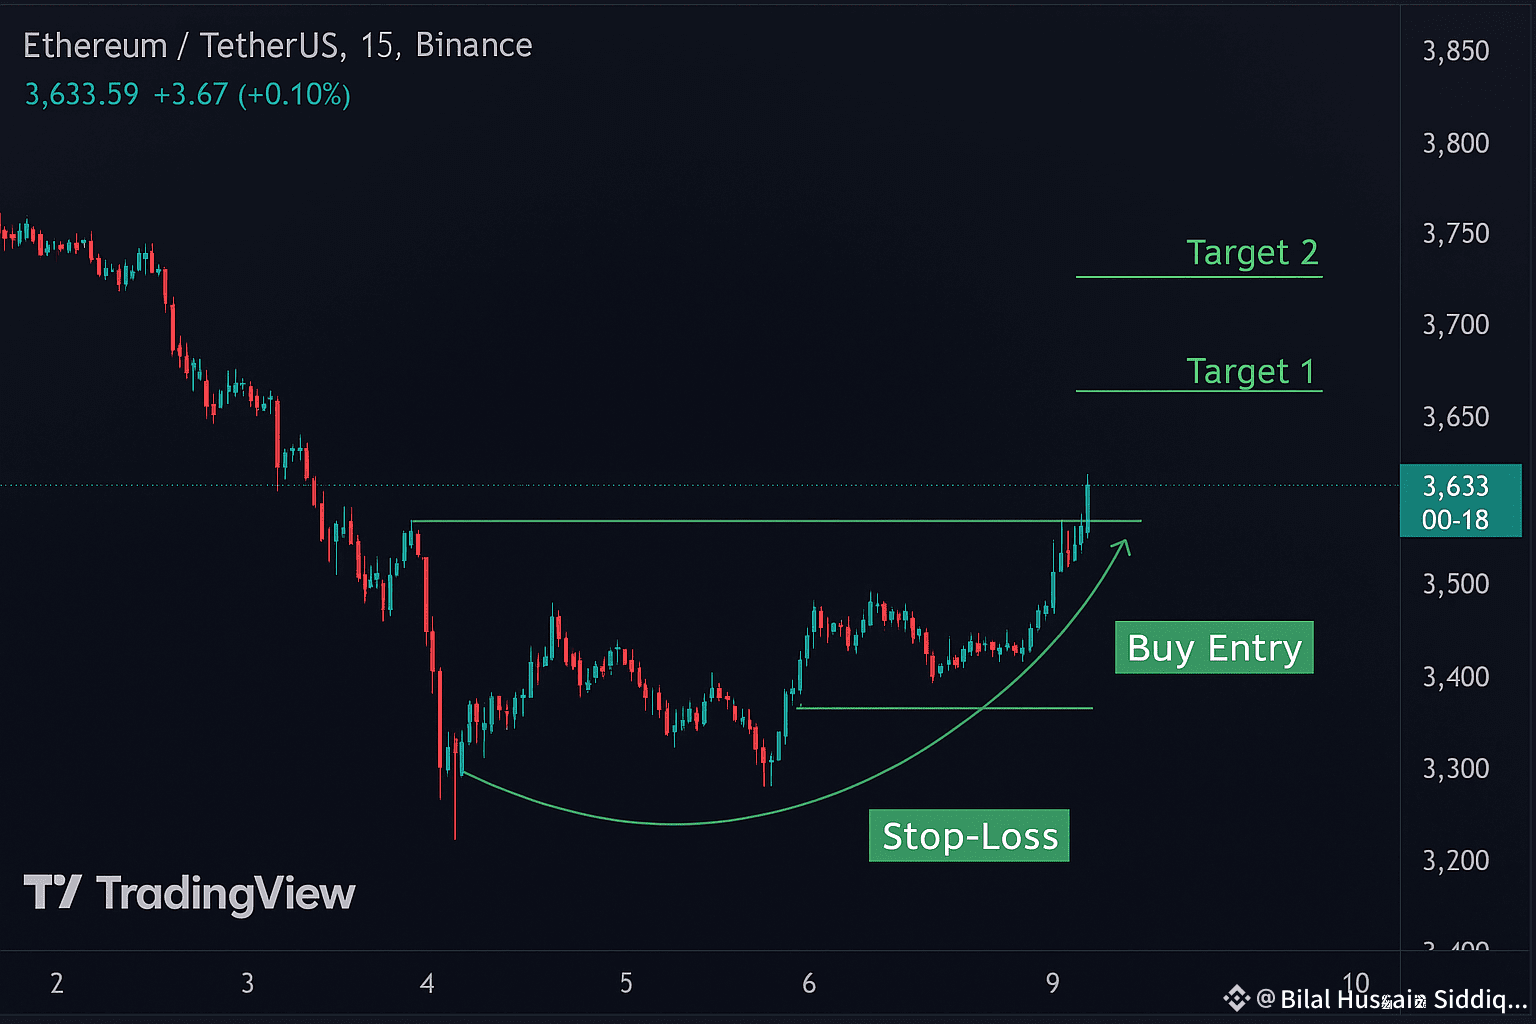
$ETH Long Trade Probability
$ETH has reversed strongly with higher lows and broke the short-term consolidation near 3,600.
The formation resembles a Cup and Handle, trend continuation to the upside.
Trade
Buy Entry: Above 3,650 USDT (confirmation candle close on 15-min TimeFram)
Stop-Loss: 3,550 USDT (below handle / retest support)
Targets:
TP1: 3,720 USDT
TP2: 3,780 USDT
TP3 (extended): 3,850 USDT
{future}(ETHUSDT)
$ETH
#ADPJobsSurge #BinanceHODLerSAPIEN #BinanceHODLerMMT #PrivacyCoinSurge #BuiltonSolayer
$ETH Long Trade Probability
$ETH has reversed strongly with higher lows and broke the short-term consolidation near 3,600.
The formation resembles a Cup and Handle, trend continuation to the upside.
Trade
Buy Entry: Above 3,650 USDT (confirmation candle close on 15-min TimeFram)
Stop-Loss: 3,550 USDT (below handle / retest support)
Targets:
TP1: 3,720 USDT
TP2: 3,780 USDT
TP3 (extended): 3,850 USDT
$ETH
#ADPJobsSurge #BinanceHODLerSAPIEN #BinanceHODLerMMT #PrivacyCoinSurge #BuiltonSolayer
$ETH has reversed strongly with higher lows and broke the short-term consolidation near 3,600.
The formation resembles a Cup and Handle, trend continuation to the upside.
Trade
Buy Entry: Above 3,650 USDT (confirmation candle close on 15-min TimeFram)
Stop-Loss: 3,550 USDT (below handle / retest support)
Targets:
TP1: 3,720 USDT
TP2: 3,780 USDT
TP3 (extended): 3,850 USDT
$ETH
#ADPJobsSurge #BinanceHODLerSAPIEN #BinanceHODLerMMT #PrivacyCoinSurge #BuiltonSolayer
1
6
·
--
Bullisch
Übersetzung ansehen
$BTC Long Trade Higher Probability
{spot}(BTCUSDT)
After prolonged selling, $BTC formed a reversal base with higher lows. Price has broken the minor resistance (106,000) with rising volume.
A move above 106,200 confirms a bullish breakout.
Buy Entry: Above 106,200 USDT (15-min candle close confirmation)
Stop-Loss: 105,200 USDT below recent structure)
Targets:
Target 1 : 107,500 USDT
Target 2: 109,000 USDT
Risk–Reward Ratio:
#ADPJobsSurge #BinanceHODLerSAPIEN #BinanceHODLerMMT #CFTCCryptoSprint #StablecoinLaw
$BTC Long Trade Higher Probability
After prolonged selling, $BTC formed a reversal base with higher lows. Price has broken the minor resistance (106,000) with rising volume.
A move above 106,200 confirms a bullish breakout.
Buy Entry: Above 106,200 USDT (15-min candle close confirmation)
Stop-Loss: 105,200 USDT below recent structure)
Targets:
Target 1 : 107,500 USDT
Target 2: 109,000 USDT
Risk–Reward Ratio:
#ADPJobsSurge #BinanceHODLerSAPIEN #BinanceHODLerMMT #CFTCCryptoSprint #StablecoinLaw
After prolonged selling, $BTC formed a reversal base with higher lows. Price has broken the minor resistance (106,000) with rising volume.
A move above 106,200 confirms a bullish breakout.
Buy Entry: Above 106,200 USDT (15-min candle close confirmation)
Stop-Loss: 105,200 USDT below recent structure)
Targets:
Target 1 : 107,500 USDT
Target 2: 109,000 USDT
Risk–Reward Ratio:
#ADPJobsSurge #BinanceHODLerSAPIEN #BinanceHODLerMMT #CFTCCryptoSprint #StablecoinLaw
1
6
Übersetzung ansehen
Gold spot ( XAU/USD)
Bearish Sell movement
Entry close below 4080 confirm break out of support
Target 4040 - 4000 🎯
Stop loss Above 4115
Risk to reward 1:: 2
Gold spot ( XAU/USD)
Bearish Sell movement
Entry close below 4080 confirm break out of support
Target 4040 - 4000 🎯
Stop loss Above 4115
Risk to reward 1:: 2
Gold spot ( XAU/USD)
Bearish Sell movement
Entry close below 4080 confirm break out of support
Target 4040 - 4000 🎯
Stop loss Above 4115
Risk to reward 1:: 2
1
1
1
Übersetzung ansehen
Recent structure: After a strong rally up to ~$3.2, the coin has been in a sideways-to-downtrend consolidation.
Resistance zone: $2.50–$2.80
Support zone: $2.20–$2.25 (currently near it)
📉 Short Trade Considerations:-
You may only short if:
Price breaks below $2.20 with good volume.
Confirmation candle closes under that level.
RSI or volume indicator supports bearish momentum.
Stop Loss: Around $2.35–$2.40 (above the recent minor high).
Take Profit (TP):
🎯 TP1: $2.05
🎯 TP2: $1.90
🎯 TP3: $1.70
(if momentum continues)
⚠️ Caution:
COAI is a highly volatile, low-liquidity token — possible “pump-dump” behavior.
Keep low leverage (max 3–5x).
Avoid holding short positions during news or exchange listing hype.
Recent structure: After a strong rally up to ~$3.2, the coin has been in a sideways-to-downtrend consolidation.
Resistance zone: $2.50–$2.80
Support zone: $2.20–$2.25 (currently near it)
📉 Short Trade Considerations:-
You may only short if:
Price breaks below $2.20 with good volume.
Confirmation candle closes under that level.
RSI or volume indicator supports bearish momentum.
Stop Loss: Around $2.35–$2.40 (above the recent minor high).
Take Profit (TP):
🎯 TP1: $2.05
🎯 TP2: $1.90
🎯 TP3: $1.70
(if momentum continues)
⚠️ Caution:
COAI is a highly volatile, low-liquidity token — possible “pump-dump” behavior.
Keep low leverage (max 3–5x).
Avoid holding short positions during news or exchange listing hype.
Resistance zone: $2.50–$2.80
Support zone: $2.20–$2.25 (currently near it)
📉 Short Trade Considerations:-
You may only short if:
Price breaks below $2.20 with good volume.
Confirmation candle closes under that level.
RSI or volume indicator supports bearish momentum.
Stop Loss: Around $2.35–$2.40 (above the recent minor high).
Take Profit (TP):
🎯 TP1: $2.05
🎯 TP2: $1.90
🎯 TP3: $1.70
(if momentum continues)
⚠️ Caution:
COAI is a highly volatile, low-liquidity token — possible “pump-dump” behavior.
Keep low leverage (max 3–5x).
Avoid holding short positions during news or exchange listing hype.
1
431
Übersetzung ansehen
Trade ( short Term )
• Entry Long above 123,200 (confirmed breakout )
🎯 Target 124,500-12500
🛑 stop-loss 122,200
• Entry short below 121,000 (confirmed breakdown )
🎯 Target 119,500-11800
🛑 stop-loss 122,000
Trade ( short Term )
• Entry Long above 123,200 (confirmed breakout )
🎯 Target 124,500-12500
🛑 stop-loss 122,200
• Entry short below 121,000 (confirmed breakdown )
🎯 Target 119,500-11800
🛑 stop-loss 122,000
• Entry Long above 123,200 (confirmed breakout )
🎯 Target 124,500-12500
🛑 stop-loss 122,200
• Entry short below 121,000 (confirmed breakdown )
🎯 Target 119,500-11800
🛑 stop-loss 122,000
2
1
3
2
810
Anmelden und weiter Inhalte entdecken
Krypto-Nutzer weltweit auf Binance Square kennenlernen
⚡️ Bleib in Sachen Krypto stets am Puls.
💬 Die weltgrößte Kryptobörse vertraut darauf.
👍 Erhalte verlässliche Einblicke von verifizierten Creators.
E-Mail-Adresse/Telefonnummer
Trendthemen
JobsReportRaisesHikeOdds
229,293 Aufrufe
1,844 Kommentare
TradFi-News | USA schaffen im Oktober 165.000 Stellen – mehr als doppelt so viele wie die prognostizierten 65.000 –, während die Arbeitslosenquote auf 4,1 % sinkt
Binance News
·30 Likes
·21.1k Aufrufe
CPITestsDecemberRateOutlook
13,318 Aufrufe
199 Kommentare
BitcoinRebounds$75KAsChipsLead
19,541 Aufrufe
210 Kommentare