

Shaikhsahb4020
9 Beiträge

Shaikhsahb4020
Melden
Nutzer blockieren
4 Following
1 Follower
7 Like gegeben
Beiträge
Alle
Zitierungen
#PUMP Der Beitrag sagt, dass PUMP nach einer kürzlichen Rallye stark erholt und weiterhin in einem insgesamt bullischen Trend liegt. Die wichtigste Zone, auf die es zu achten gilt, befindet sich bei etwa 0,006 $: Ein Ausbruch darüber mit starkem Volumen könnte weiteres Aufwärtspotenzial stützen, während eine Zurückweisung dort zu einem Rücksetzer in Richtung des Bereichs von 0,0055 $ führen kann.
Zu den positiven Faktoren zählen die Einnahmen von Pump.fun, Token-Rückkäufe und Burns (Verbrennungen). Allerdings könnte ein bevorstehender Token-Unlock im Oktober zusätzlichen Verkaufsdruck erzeugen. Insgesamt betrachtet der Beitrag PUMP als konstruktiv, weist jedoch auf erhöhte kurzfristige Dynamik sowie das Risiko erhöhter Volatilität hin.
#PUMP Der Beitrag sagt, dass PUMP nach einer kürzlichen Rallye stark erholt und weiterhin in einem insgesamt bullischen Trend liegt. Die wichtigste Zone, auf die es zu achten gilt, befindet sich bei etwa 0,006 $: Ein Ausbruch darüber mit starkem Volumen könnte weiteres Aufwärtspotenzial stützen, während eine Zurückweisung dort zu einem Rücksetzer in Richtung des Bereichs von 0,0055 $ führen kann.
Zu den positiven Faktoren zählen die Einnahmen von Pump.fun, Token-Rückkäufe und Burns (Verbrennungen). Allerdings könnte ein bevorstehender Token-Unlock im Oktober zusätzlichen Verkaufsdruck erzeugen. Insgesamt betrachtet der Beitrag PUMP als konstruktiv, weist jedoch auf erhöhte kurzfristige Dynamik sowie das Risiko erhöhter Volatilität hin.
Zu den positiven Faktoren zählen die Einnahmen von Pump.fun, Token-Rückkäufe und Burns (Verbrennungen). Allerdings könnte ein bevorstehender Token-Unlock im Oktober zusätzlichen Verkaufsdruck erzeugen. Insgesamt betrachtet der Beitrag PUMP als konstruktiv, weist jedoch auf erhöhte kurzfristige Dynamik sowie das Risiko erhöhter Volatilität hin.
1
229
#PUMP$PUMP
**PUMP/USDT Analyse (Stand: 2. Oktober 2026)**
Pump.fun (PUMP) handelt derzeit bei etwa **$0.00575 – $0.00584**. Im Tagesverlauf ist es ungefähr unverändert bis leicht rückläufig, bleibt aber über die vergangene Woche hinweg deutlich stärker (**+50%+** in vielen Berichten). Die Marktkapitalisierung liegt nahe **$2.6–2.7 Milliarden**.
### Gesamttrend
Die Struktur im kurzfristigen bis mittelfristigen Bereich ist **bullisch**. PUMP hat eine solide Erholung hingelegt und handelt deutlich über seinen wichtigen gleitenden Durchschnitten (50-Tage-, 100-Tage- und 200-Tage-EMAs). Der Token liegt etwa **34–35% unter** seinem Allzeithoch von **$0.008819**.
#PUMP
$PUMP
**PUMP/USDT Analyse (Stand: 2. Oktober 2026)**
Pump.fun (PUMP) handelt derzeit bei etwa **$0.00575 – $0.00584**. Im Tagesverlauf ist es ungefähr unverändert bis leicht rückläufig, bleibt aber über die vergangene Woche hinweg deutlich stärker (**+50%+** in vielen Berichten). Die Marktkapitalisierung liegt nahe **$2.6–2.7 Milliarden**.
### Gesamttrend
Die Struktur im kurzfristigen bis mittelfristigen Bereich ist **bullisch**. PUMP hat eine solide Erholung hingelegt und handelt deutlich über seinen wichtigen gleitenden Durchschnitten (50-Tage-, 100-Tage- und 200-Tage-EMAs). Der Token liegt etwa **34–35% unter** seinem Allzeithoch von **$0.008819**.
**PUMP/USDT Analyse (Stand: 2. Oktober 2026)**
Pump.fun (PUMP) handelt derzeit bei etwa **$0.00575 – $0.00584**. Im Tagesverlauf ist es ungefähr unverändert bis leicht rückläufig, bleibt aber über die vergangene Woche hinweg deutlich stärker (**+50%+** in vielen Berichten). Die Marktkapitalisierung liegt nahe **$2.6–2.7 Milliarden**.
### Gesamttrend
Die Struktur im kurzfristigen bis mittelfristigen Bereich ist **bullisch**. PUMP hat eine solide Erholung hingelegt und handelt deutlich über seinen wichtigen gleitenden Durchschnitten (50-Tage-, 100-Tage- und 200-Tage-EMAs). Der Token liegt etwa **34–35% unter** seinem Allzeithoch von **$0.008819**.
1
230
Übersetzung ansehen
#SUI USDT$SUI **SUI/USDT Analysis (as of October 2, 2026)**
Sui (SUI) is currently trading around **$1.17 – $1.20**, showing gains of roughly **3–5%** over the last 24 hours in most reports. Market cap sits near **$4.8 billion**.
### Overall Trend
The short- to medium-term structure is **bullish**. SUI is trading above its major moving averages (including the 7-day, 20-day, 50-day, and 200-day), which is a constructive technical setup. RSI is around **67**, indicating strong but not extremely overbought momentum.
The token has recovered well from earlier 2026 lows and is now testing higher levels ahead of key events.
### Key Upcoming Catalysts
- **Token unlock** on October 3: Approximately 23.38 million SUI (about 0.2% of total supply / 0.6% of market cap). This is relatively small and should be absorbable if demand stays firm.
- **Sui Basecamp** in Singapore (October 7–8): A major ecosystem event that could act as a positive catalyst if announcements are strong.
### Key Technical Levels
**Resistance:**
- Immediate: **$1.24 – $1.26**
- Next: **$1.30 – $1.37** (upper Bollinger Band / extension target)
- Higher: $1.40–$1.50 zone if momentum continues
**Support:**
- Near-term / critical: **$1.15 – $1.17**
- Stronger: **$1.10 – $1.12**
- Deeper: Around **$1.00 – $1.015**
### Momentum & Indicators
- Price is stacked above all major moving averages → bullish alignment.
- RSI ~67 → healthy strength with some room left before deep overbought conditions.
- MACD is near neutral/flattening in some readings, suggesting momentum is cooling slightly after the recent push.
- Overall technical bias from automated indicators is strongly bullish.
### Short-Term Outlook
**Bullish case (favored while support holds):**
A clean break and hold above **$1.24–$1.26** opens the path toward **$1.30–$1.37**. Strong Basecamp news or continued Bitcoin strength could accelerate this. Some analysts see potential extension toward $1.40–$1.50 over the next few weeks if the breakout confirms.
**Bearish / pullback case:**
Rejection at current resistance combined with unlock-related selling could push price back to test **$1.15**. A break below that level increases the chance of a deeper move toward **$1.10**. Losing $1.10 would weaken the short-term bullish structure significantly.
### Summary
SUI is in a constructive uptrend and trading above key moving averages. The near-term focus is on holding the **$1.15–$1.17** support zone while attempting to clear **$1.24–$1.26**. The small token unlock tomorrow is manageable, and the upcoming Basecamp event adds potential upside catalyst risk.
As long as $1.15 holds on a closing basis, the bias remains **bullish** with upside targets at $1.30+. Failure of support would shift the short-term outlook more neutral-to-bearish.
**Note:** This is technical market analysis only, not financial advice. Crypto is highly volatile — always use proper risk management and do your own research.
{spot}(SUIUSDT)
#SUI USDT
$SUI **SUI/USDT Analysis (as of October 2, 2026)**
Sui (SUI) is currently trading around **$1.17 – $1.20**, showing gains of roughly **3–5%** over the last 24 hours in most reports. Market cap sits near **$4.8 billion**.
### Overall Trend
The short- to medium-term structure is **bullish**. SUI is trading above its major moving averages (including the 7-day, 20-day, 50-day, and 200-day), which is a constructive technical setup. RSI is around **67**, indicating strong but not extremely overbought momentum.
The token has recovered well from earlier 2026 lows and is now testing higher levels ahead of key events.
### Key Upcoming Catalysts
- **Token unlock** on October 3: Approximately 23.38 million SUI (about 0.2% of total supply / 0.6% of market cap). This is relatively small and should be absorbable if demand stays firm.
- **Sui Basecamp** in Singapore (October 7–8): A major ecosystem event that could act as a positive catalyst if announcements are strong.
### Key Technical Levels
**Resistance:**
- Immediate: **$1.24 – $1.26**
- Next: **$1.30 – $1.37** (upper Bollinger Band / extension target)
- Higher: $1.40–$1.50 zone if momentum continues
**Support:**
- Near-term / critical: **$1.15 – $1.17**
- Stronger: **$1.10 – $1.12**
- Deeper: Around **$1.00 – $1.015**
### Momentum & Indicators
- Price is stacked above all major moving averages → bullish alignment.
- RSI ~67 → healthy strength with some room left before deep overbought conditions.
- MACD is near neutral/flattening in some readings, suggesting momentum is cooling slightly after the recent push.
- Overall technical bias from automated indicators is strongly bullish.
### Short-Term Outlook
**Bullish case (favored while support holds):**
A clean break and hold above **$1.24–$1.26** opens the path toward **$1.30–$1.37**. Strong Basecamp news or continued Bitcoin strength could accelerate this. Some analysts see potential extension toward $1.40–$1.50 over the next few weeks if the breakout confirms.
**Bearish / pullback case:**
Rejection at current resistance combined with unlock-related selling could push price back to test **$1.15**. A break below that level increases the chance of a deeper move toward **$1.10**. Losing $1.10 would weaken the short-term bullish structure significantly.
### Summary
SUI is in a constructive uptrend and trading above key moving averages. The near-term focus is on holding the **$1.15–$1.17** support zone while attempting to clear **$1.24–$1.26**. The small token unlock tomorrow is manageable, and the upcoming Basecamp event adds potential upside catalyst risk.
As long as $1.15 holds on a closing basis, the bias remains **bullish** with upside targets at $1.30+. Failure of support would shift the short-term outlook more neutral-to-bearish.
**Note:** This is technical market analysis only, not financial advice. Crypto is highly volatile — always use proper risk management and do your own research.
Sui (SUI) is currently trading around **$1.17 – $1.20**, showing gains of roughly **3–5%** over the last 24 hours in most reports. Market cap sits near **$4.8 billion**.
### Overall Trend
The short- to medium-term structure is **bullish**. SUI is trading above its major moving averages (including the 7-day, 20-day, 50-day, and 200-day), which is a constructive technical setup. RSI is around **67**, indicating strong but not extremely overbought momentum.
The token has recovered well from earlier 2026 lows and is now testing higher levels ahead of key events.
### Key Upcoming Catalysts
- **Token unlock** on October 3: Approximately 23.38 million SUI (about 0.2% of total supply / 0.6% of market cap). This is relatively small and should be absorbable if demand stays firm.
- **Sui Basecamp** in Singapore (October 7–8): A major ecosystem event that could act as a positive catalyst if announcements are strong.
### Key Technical Levels
**Resistance:**
- Immediate: **$1.24 – $1.26**
- Next: **$1.30 – $1.37** (upper Bollinger Band / extension target)
- Higher: $1.40–$1.50 zone if momentum continues
**Support:**
- Near-term / critical: **$1.15 – $1.17**
- Stronger: **$1.10 – $1.12**
- Deeper: Around **$1.00 – $1.015**
### Momentum & Indicators
- Price is stacked above all major moving averages → bullish alignment.
- RSI ~67 → healthy strength with some room left before deep overbought conditions.
- MACD is near neutral/flattening in some readings, suggesting momentum is cooling slightly after the recent push.
- Overall technical bias from automated indicators is strongly bullish.
### Short-Term Outlook
**Bullish case (favored while support holds):**
A clean break and hold above **$1.24–$1.26** opens the path toward **$1.30–$1.37**. Strong Basecamp news or continued Bitcoin strength could accelerate this. Some analysts see potential extension toward $1.40–$1.50 over the next few weeks if the breakout confirms.
**Bearish / pullback case:**
Rejection at current resistance combined with unlock-related selling could push price back to test **$1.15**. A break below that level increases the chance of a deeper move toward **$1.10**. Losing $1.10 would weaken the short-term bullish structure significantly.
### Summary
SUI is in a constructive uptrend and trading above key moving averages. The near-term focus is on holding the **$1.15–$1.17** support zone while attempting to clear **$1.24–$1.26**. The small token unlock tomorrow is manageable, and the upcoming Basecamp event adds potential upside catalyst risk.
As long as $1.15 holds on a closing basis, the bias remains **bullish** with upside targets at $1.30+. Failure of support would shift the short-term outlook more neutral-to-bearish.
**Note:** This is technical market analysis only, not financial advice. Crypto is highly volatile — always use proper risk management and do your own research.
1
297
#ENA usdt$ENA **ENA/USDT-Analyse (Stand: 2. Oktober 2026)**
Ethena (ENA) wird aktuell rund bei **0,24 – 0,246 $** gehandelt, im letzten 24-Stunden-Zeitraum etwa **5–10%** im Minus. Das kommt nach einer starken Rallye über mehrere Wochen.
### Gesamttrend
ENA hat sich von seinen Tiefs im Sommer nahe **0,07–0,08 $** mit einer kraftvollen Erholung zurückgekämpft. In den letzten 30 Tagen gewann es ungefähr **50–60%** und über 90 Tage **mehr als 200%**. Es liegt weiterhin deutlich über seinen langfristigen gleitenden Durchschnitten (200-Tage-Linie bei etwa 0,11 $). Die breitere Struktur ist im mittelfristigen Zeitrahmen weiterhin bullisch, auch wenn der Token etwa **84% unter** seinem Allzeithoch von 1,52 $ (April 2024) liegt.
#ENA usdt
$ENA **ENA/USDT-Analyse (Stand: 2. Oktober 2026)**
Ethena (ENA) wird aktuell rund bei **0,24 – 0,246 $** gehandelt, im letzten 24-Stunden-Zeitraum etwa **5–10%** im Minus. Das kommt nach einer starken Rallye über mehrere Wochen.
### Gesamttrend
ENA hat sich von seinen Tiefs im Sommer nahe **0,07–0,08 $** mit einer kraftvollen Erholung zurückgekämpft. In den letzten 30 Tagen gewann es ungefähr **50–60%** und über 90 Tage **mehr als 200%**. Es liegt weiterhin deutlich über seinen langfristigen gleitenden Durchschnitten (200-Tage-Linie bei etwa 0,11 $). Die breitere Struktur ist im mittelfristigen Zeitrahmen weiterhin bullisch, auch wenn der Token etwa **84% unter** seinem Allzeithoch von 1,52 $ (April 2024) liegt.
Ethena (ENA) wird aktuell rund bei **0,24 – 0,246 $** gehandelt, im letzten 24-Stunden-Zeitraum etwa **5–10%** im Minus. Das kommt nach einer starken Rallye über mehrere Wochen.
### Gesamttrend
ENA hat sich von seinen Tiefs im Sommer nahe **0,07–0,08 $** mit einer kraftvollen Erholung zurückgekämpft. In den letzten 30 Tagen gewann es ungefähr **50–60%** und über 90 Tage **mehr als 200%**. Es liegt weiterhin deutlich über seinen langfristigen gleitenden Durchschnitten (200-Tage-Linie bei etwa 0,11 $). Die breitere Struktur ist im mittelfristigen Zeitrahmen weiterhin bullisch, auch wenn der Token etwa **84% unter** seinem Allzeithoch von 1,52 $ (April 2024) liegt.
1
514
#Btcusdt$BTC **BTC/USDT-Analyse (Stand: 2. Oktober 2026)**
Bitcoin handelt derzeit in der **$85.900 – $86.900**-Spanne, rund **2–3%** im Plus gegenüber den letzten 24 Stunden. Es hat die mittleren $80Ks zurückerobert, nachdem es nach unten konsolidiert hatte, und testet nun einen wichtigen Widerstand.
### Gesamttrend
Die breitere Struktur bleibt **bullisch**. BTC handelt deutlich über seinen wichtigen gleitenden Durchschnitten (50-Tage-, 100-Tage- und 200-Tage-EMAs, die sich ungefähr zwischen $74.700–$78.400 ballen). Höhere Hochs und höhere Tiefs sind nach der Erholung aus dem Bereich der mittleren $70Ks / den niedrigeren Niveaus zu Jahresbeginn intakt. September schloss mit einem soliden Plus (~6,3%) und bereitet damit eine mögliche „Uptober“-Stärke vor.
#Btcusdt
$BTC **BTC/USDT-Analyse (Stand: 2. Oktober 2026)**
Bitcoin handelt derzeit in der **$85.900 – $86.900**-Spanne, rund **2–3%** im Plus gegenüber den letzten 24 Stunden. Es hat die mittleren $80Ks zurückerobert, nachdem es nach unten konsolidiert hatte, und testet nun einen wichtigen Widerstand.
### Gesamttrend
Die breitere Struktur bleibt **bullisch**. BTC handelt deutlich über seinen wichtigen gleitenden Durchschnitten (50-Tage-, 100-Tage- und 200-Tage-EMAs, die sich ungefähr zwischen $74.700–$78.400 ballen). Höhere Hochs und höhere Tiefs sind nach der Erholung aus dem Bereich der mittleren $70Ks / den niedrigeren Niveaus zu Jahresbeginn intakt. September schloss mit einem soliden Plus (~6,3%) und bereitet damit eine mögliche „Uptober“-Stärke vor.
Bitcoin handelt derzeit in der **$85.900 – $86.900**-Spanne, rund **2–3%** im Plus gegenüber den letzten 24 Stunden. Es hat die mittleren $80Ks zurückerobert, nachdem es nach unten konsolidiert hatte, und testet nun einen wichtigen Widerstand.
### Gesamttrend
Die breitere Struktur bleibt **bullisch**. BTC handelt deutlich über seinen wichtigen gleitenden Durchschnitten (50-Tage-, 100-Tage- und 200-Tage-EMAs, die sich ungefähr zwischen $74.700–$78.400 ballen). Höhere Hochs und höhere Tiefs sind nach der Erholung aus dem Bereich der mittleren $70Ks / den niedrigeren Niveaus zu Jahresbeginn intakt. September schloss mit einem soliden Plus (~6,3%) und bereitet damit eine mögliche „Uptober“-Stärke vor.
1
260
·
--
Bärisch
12
Übersetzung ansehen
Kesy kia apny Kuch deya tha usy
Kesy kia apny Kuch deya tha usy

ZAARO110
·
--
#VoteToListOnBinance . fruadi Pakistaner

1
19
Übersetzung ansehen
hello
hello

Selena Dorie
·
--
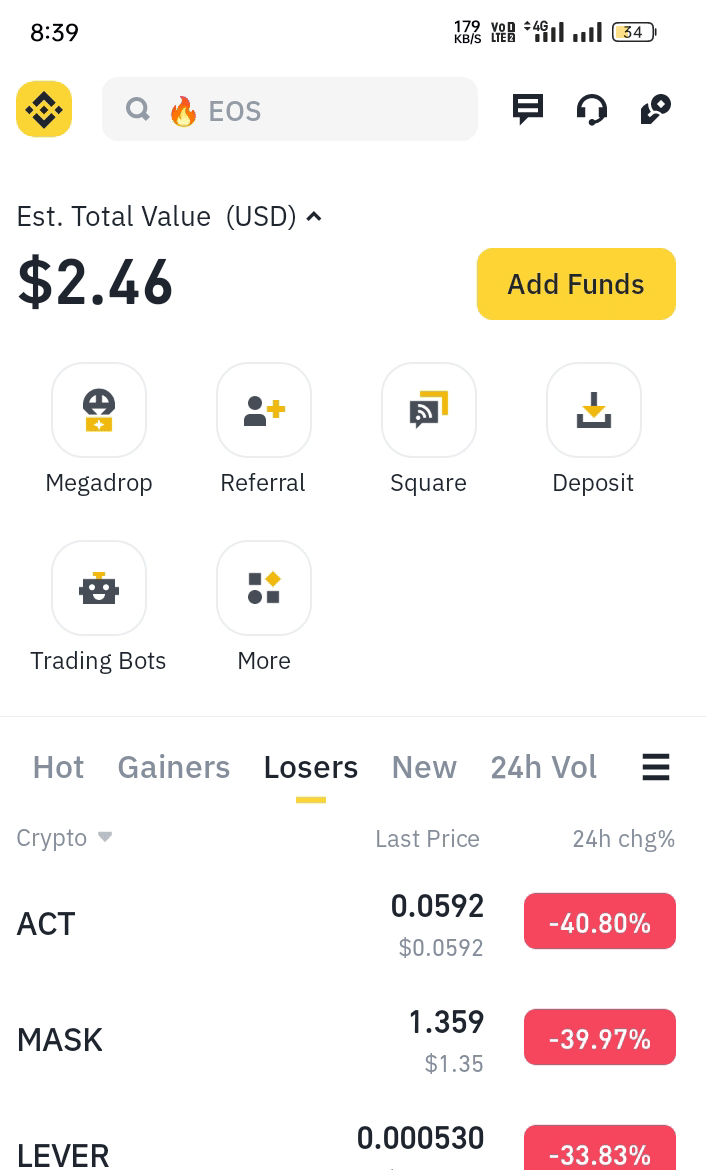
BullischIch habe 2.46$ in meiner Brieftasche, welche Münze sollte ich kaufen, um in einem Tag 10$ zu erreichen?
1
145
Anmelden und weiter Inhalte entdecken
Krypto-Nutzer weltweit auf Binance Square kennenlernen
⚡️ Bleib in Sachen Krypto stets am Puls.
💬 Die weltgrößte Kryptobörse vertraut darauf.
👍 Erhalte verlässliche Einblicke von verifizierten Creators.
E-Mail-Adresse/Telefonnummer
Trendthemen
ZcashETFPostsFirstWeeklyOutflow$93.6M
51 Aufrufe
17 Kommentare
ZCASH-ETF-UPDATE
Der Zcash-ETF verzeichnete seit dem Start im August erstmals einen wöchentlichen Nettoabfluss.
Anleger zogen 93,6 Mio. $ ab, da <a>$ZEC </a> in Richtung 1.300 $ fiel. Grayscale’s ZCSH hatte zwei Wochen zuvor 98,2 Mio. $ angezogen, doch laut SoSoValue wurden seit dem 22. September keine täglichen Nettozuflüsse mehr erfasst.
ZEC lag am 3. Oktober bei etwa 1.308 $, ein Rückgang von rund 17,5% für die Woche und etwa 23% im Vergleich zu seinem jüngsten Hoch bei 1.690 $.
$ZEC
Vicky-143
·0 Likes
·140 Aufrufe
GreekPoliceBustCryptoScamRingArrest17
324 Aufrufe
55 Kommentare
BitcoinRejectedAt$87K
49,390 Aufrufe
86 Kommentare