
tahanawaz59
8 Beiträge

tahanawaz59
Melden
Nutzer blockieren
0 Following
0 Follower
7 Like gegeben
Beiträge
·
--
Übersetzung ansehen
{future}(BTCUSDT)
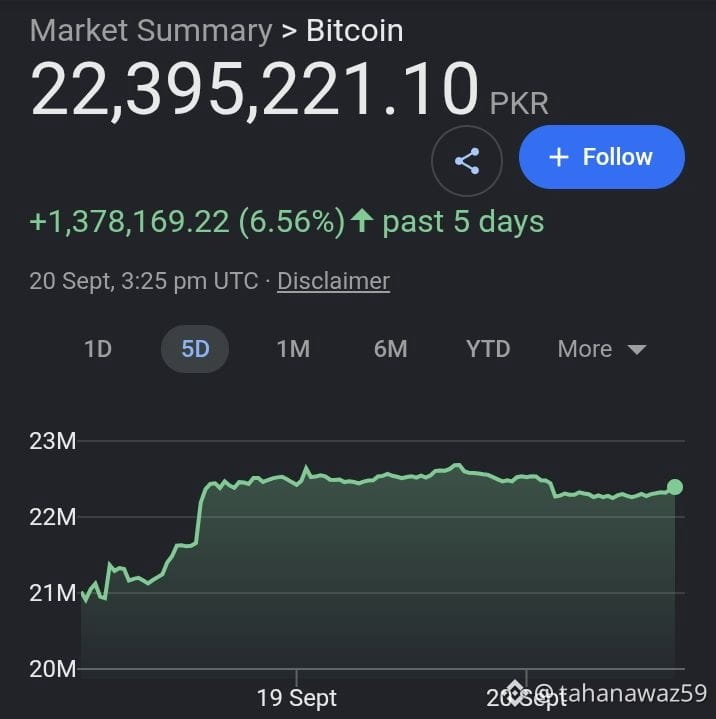
🔥 #BTC Bitcoin has bounced back strongly. BTC recently pushed above $80,000 and briefly above $81,000, after trading around $75K–$76K earlier in the week #SaylorHintsStrategyBitcoinBuy
#BOJRaisesRatesTo31YearHigh
🔥 #BTC Bitcoin has bounced back strongly. BTC recently pushed above $80,000 and briefly above $81,000, after trading around $75K–$76K earlier in the week #SaylorHintsStrategyBitcoinBuy
#BOJRaisesRatesTo31YearHigh
#BOJRaisesRatesTo31YearHigh
8
·
--
Übersetzung ansehen
who much you people make by posting
🤔🤔🫤
Tell me plz
who much you people make by posting
🤔🤔🫤
Tell me plz
🤔🤔🫤
Tell me plz
1
1
·
--
Bullisch
Übersetzung ansehen
BRO just trade in this
🙏 you will regret it later
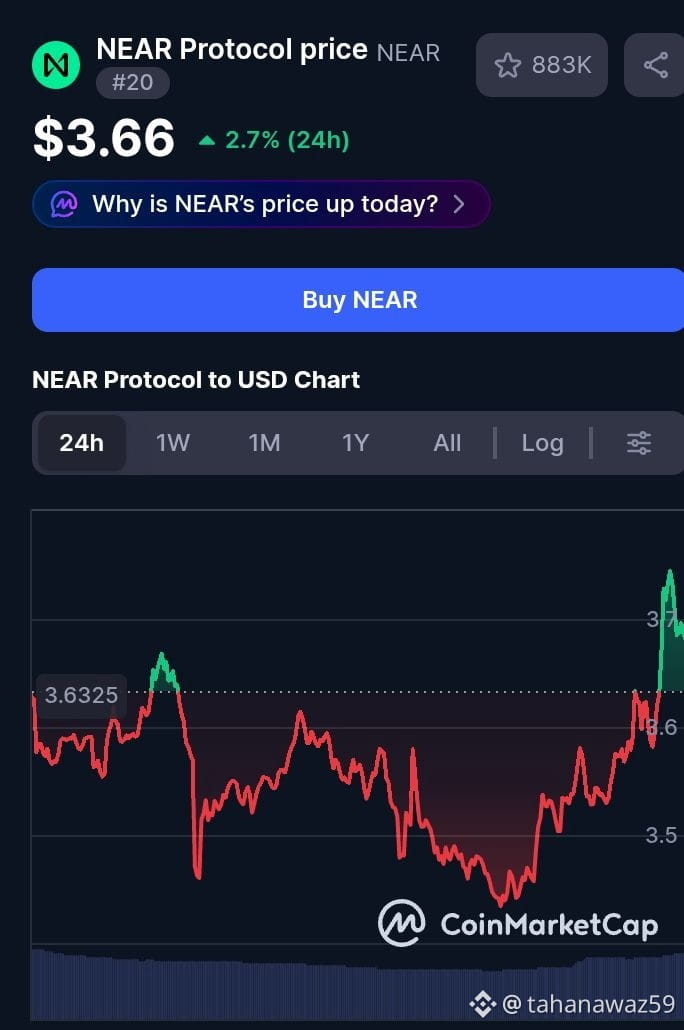
AI + crypto narrative: #NEAR is increasingly focused on AI agents and autonomous transactions $NEAR
{spot}(NEARUSDT)
BRO just trade in this
🙏 you will regret it later
AI + crypto narrative: #NEAR is increasingly focused on AI agents and autonomous transactions $NEAR
🙏 you will regret it later
AI + crypto narrative: #NEAR is increasingly focused on AI agents and autonomous transactions $NEAR
1
90
·
--
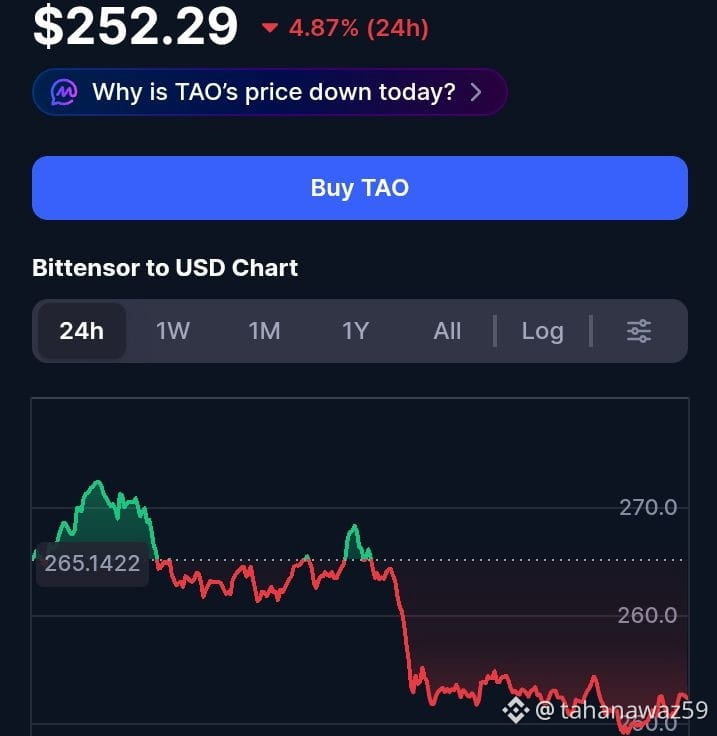
Warum $TAO interessant ist
KI + Krypto-Exposure — Bittensor ist um dezentrale Märkte für digitale Rohstoffe wie maschinelle Intelligenz herum konzipiert, statt nur ein weiterer Zahlungstoken zu sein. �
Bittensor
Echte Netzwerk-Nützlichkeit — TAO wird im Ökosystem von Bittensor genutzt, um an dessen Subnetz-Märkten teilzunehmen und Ressourcen über sie zuzuweisen. �
Bittensor +1
Begrenztes maximales Angebot — #TAO hat ein maximales Angebot von 21 Millionen, ähnlich wie in dieser Hinsicht bei Bitcoin. Das erste Halving fand im Dezember 2025 statt und reduziert die Basisaussendung auf etwa 0,5 TAO pro Block. �
Bittensor
Subnetz-Ökosystem — Bittensor ermöglicht es unterschiedlichen Teams, spezialisierte Subnetze mit eigenen Anreizmechanismen aufzubauen. Das schafft eine Möglichkeit, dass verschiedene KI-/Compute-/Data-Projekte in einem größeren Netzwerk miteinander konkurrieren. �
Bittensor
Emissionssystem belohnt die Nachfrage — Seit dem Upgrade „2026 Emission Gate“ konzentrieren sich Subnetz-Emissionen zunehmend auf Subnetze mit stärkerer Nachfrage, statt die Emissionen relativ gleichmäßig über das Netzwerk zu verteilen.
{spot}(TAOUSDT)
Warum $TAO interessant ist
KI + Krypto-Exposure — Bittensor ist um dezentrale Märkte für digitale Rohstoffe wie maschinelle Intelligenz herum konzipiert, statt nur ein weiterer Zahlungstoken zu sein. �
Bittensor
Echte Netzwerk-Nützlichkeit — TAO wird im Ökosystem von Bittensor genutzt, um an dessen Subnetz-Märkten teilzunehmen und Ressourcen über sie zuzuweisen. �
Bittensor +1
Begrenztes maximales Angebot — #TAO hat ein maximales Angebot von 21 Millionen, ähnlich wie in dieser Hinsicht bei Bitcoin. Das erste Halving fand im Dezember 2025 statt und reduziert die Basisaussendung auf etwa 0,5 TAO pro Block. �
Bittensor
Subnetz-Ökosystem — Bittensor ermöglicht es unterschiedlichen Teams, spezialisierte Subnetze mit eigenen Anreizmechanismen aufzubauen. Das schafft eine Möglichkeit, dass verschiedene KI-/Compute-/Data-Projekte in einem größeren Netzwerk miteinander konkurrieren. �
Bittensor
Emissionssystem belohnt die Nachfrage — Seit dem Upgrade „2026 Emission Gate“ konzentrieren sich Subnetz-Emissionen zunehmend auf Subnetze mit stärkerer Nachfrage, statt die Emissionen relativ gleichmäßig über das Netzwerk zu verteilen.
KI + Krypto-Exposure — Bittensor ist um dezentrale Märkte für digitale Rohstoffe wie maschinelle Intelligenz herum konzipiert, statt nur ein weiterer Zahlungstoken zu sein. �
Bittensor
Echte Netzwerk-Nützlichkeit — TAO wird im Ökosystem von Bittensor genutzt, um an dessen Subnetz-Märkten teilzunehmen und Ressourcen über sie zuzuweisen. �
Bittensor +1
Begrenztes maximales Angebot — #TAO hat ein maximales Angebot von 21 Millionen, ähnlich wie in dieser Hinsicht bei Bitcoin. Das erste Halving fand im Dezember 2025 statt und reduziert die Basisaussendung auf etwa 0,5 TAO pro Block. �
Bittensor
Subnetz-Ökosystem — Bittensor ermöglicht es unterschiedlichen Teams, spezialisierte Subnetze mit eigenen Anreizmechanismen aufzubauen. Das schafft eine Möglichkeit, dass verschiedene KI-/Compute-/Data-Projekte in einem größeren Netzwerk miteinander konkurrieren. �
Bittensor
Emissionssystem belohnt die Nachfrage — Seit dem Upgrade „2026 Emission Gate“ konzentrieren sich Subnetz-Emissionen zunehmend auf Subnetze mit stärkerer Nachfrage, statt die Emissionen relativ gleichmäßig über das Netzwerk zu verteilen.
1
173
·
--
Übersetzung ansehen
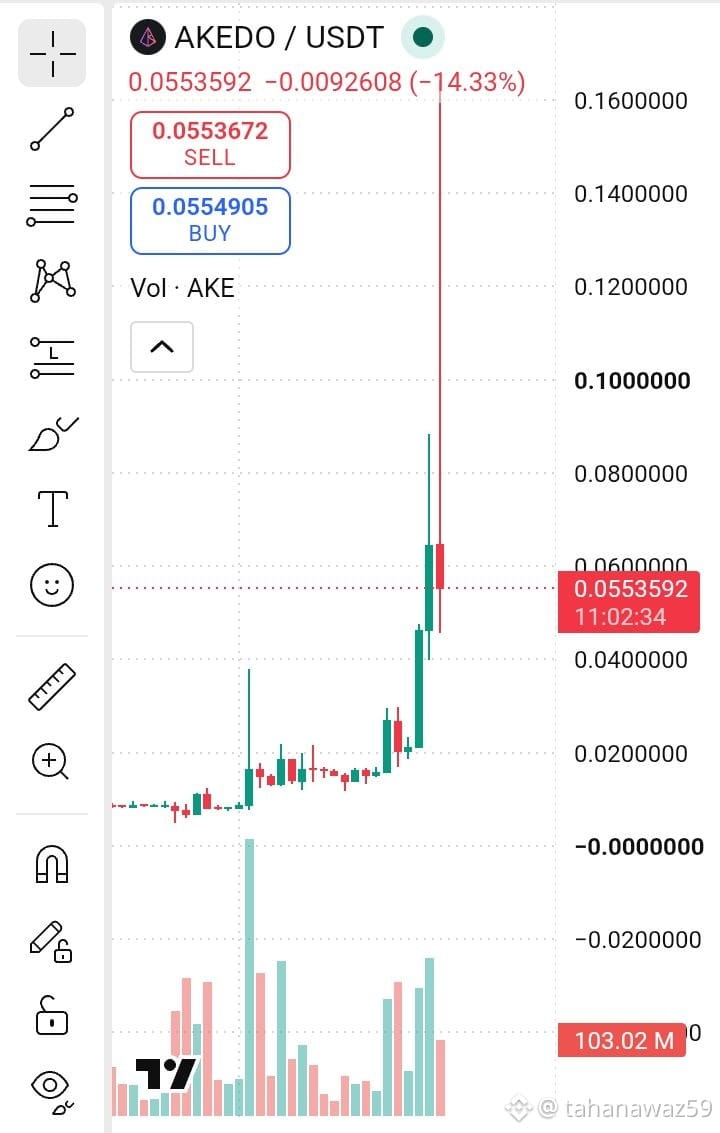
#AKEUSD $AKE I think should buy it
Ticker: AKE
Project: Akedo
Focus: AI + gaming
Max supply: 100 billion AKE
Circulating supply: about 22.8 billion
Recent price: roughly $0.04–$0.07, depending on the data source and exact time. �
CoinGecko +1
It has been extremely volatile recently: CoinGecko shows a large rise over the past week and an all-time high around $0.0856 on September 19, 2026. �
CoinGecko
Important: AKE has already made a very large move recently, so chasing a sudden pump can carry substantial downside risk. Also, the ticker “AKE” can refer to different things, so the contract address matters.
If you meant a different AKE coin, send me its screenshot or contract address, and I can identify it.
{future}(AKEUSDT)
#AKEUSD $AKE I think should buy it
Ticker: AKE
Project: Akedo
Focus: AI + gaming
Max supply: 100 billion AKE
Circulating supply: about 22.8 billion
Recent price: roughly $0.04–$0.07, depending on the data source and exact time. �
CoinGecko +1
It has been extremely volatile recently: CoinGecko shows a large rise over the past week and an all-time high around $0.0856 on September 19, 2026. �
CoinGecko
Important: AKE has already made a very large move recently, so chasing a sudden pump can carry substantial downside risk. Also, the ticker “AKE” can refer to different things, so the contract address matters.
If you meant a different AKE coin, send me its screenshot or contract address, and I can identify it.
Ticker: AKE
Project: Akedo
Focus: AI + gaming
Max supply: 100 billion AKE
Circulating supply: about 22.8 billion
Recent price: roughly $0.04–$0.07, depending on the data source and exact time. �
CoinGecko +1
It has been extremely volatile recently: CoinGecko shows a large rise over the past week and an all-time high around $0.0856 on September 19, 2026. �
CoinGecko
Important: AKE has already made a very large move recently, so chasing a sudden pump can carry substantial downside risk. Also, the ticker “AKE” can refer to different things, so the contract address matters.
If you meant a different AKE coin, send me its screenshot or contract address, and I can identify it.
1
386
·
--
Übersetzung ansehen
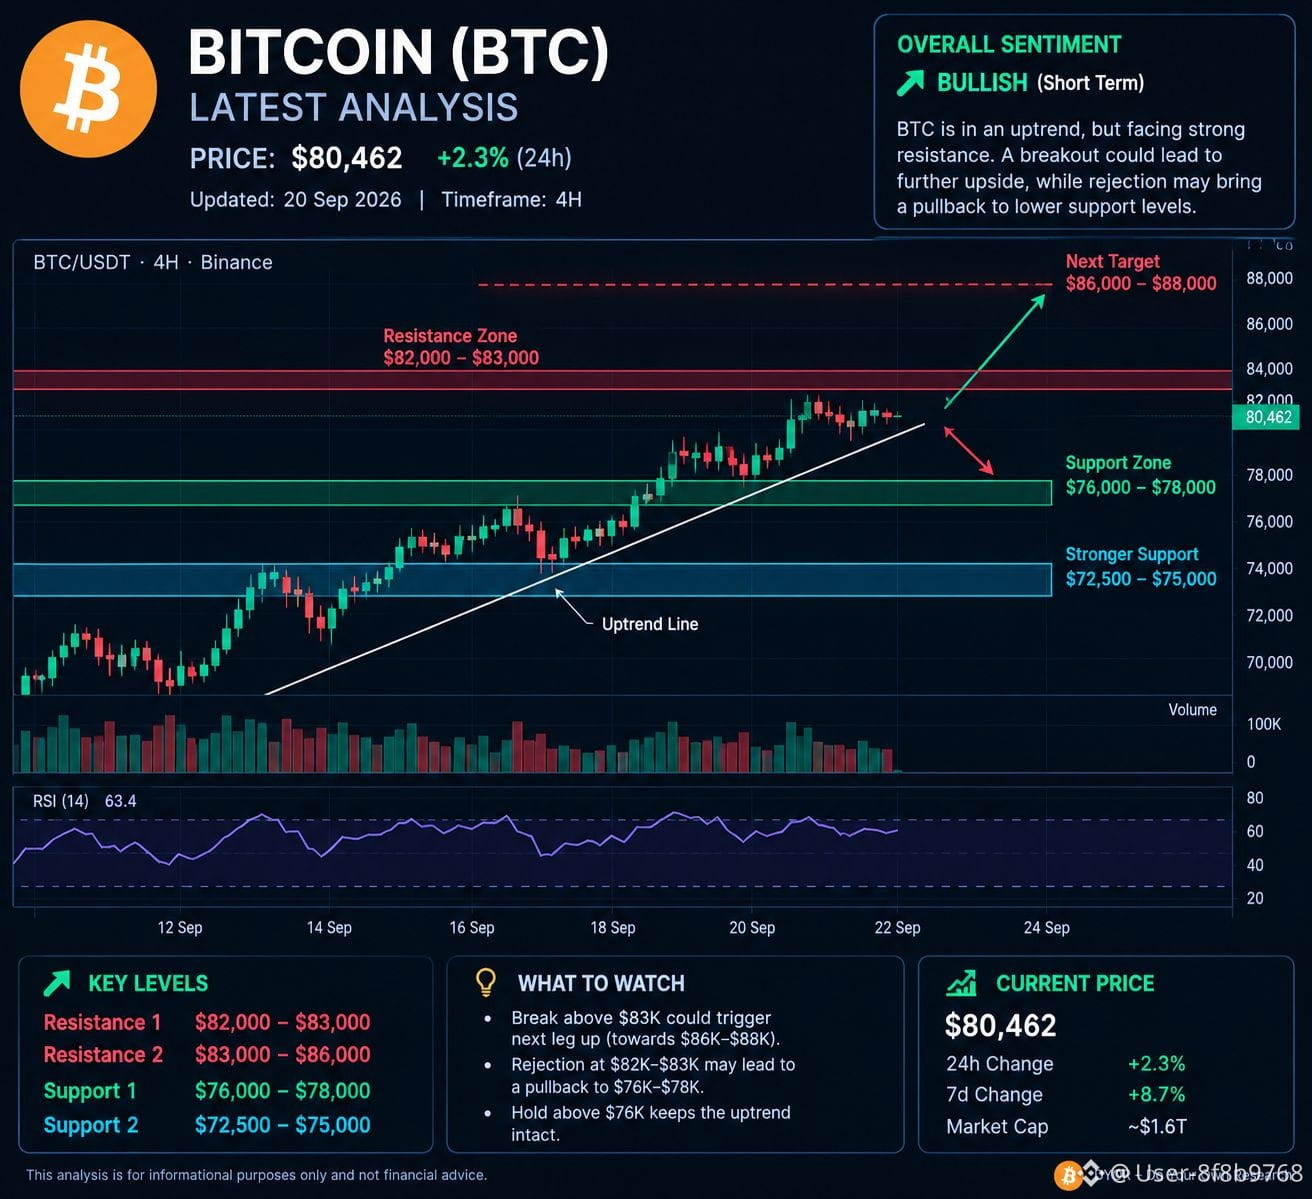
#BTC $Bitcoin (BTC) — Latest Short Analysis
BTC is around $80.4K–$81.7K today. Recent data shows Bitcoin has recovered roughly 8.7% from the September 15 low near $75K, but price is now approaching an important resistance area. �
Use the Bitcoin +1
Resistance: ~$82K–$83K; above that, ~$83K–$86K.
Support: ~$76K–$78K; stronger support ~$72.5K–$75K.
Market structure: Short-term consolidation after a strong weekly recovery.
Key level: A sustained move above ~$83K would be an important technical development; rejection could bring a pullback toward the support zones. �
Use the Bitcoin
Bottom line: BTC is currently at a decision area—watch the $82K–$83K resista$nce and $76K
{spot}(BTCUSDT)
#BTC $Bitcoin (BTC) — Latest Short Analysis
BTC is around $80.4K–$81.7K today. Recent data shows Bitcoin has recovered roughly 8.7% from the September 15 low near $75K, but price is now approaching an important resistance area. �
Use the Bitcoin +1
Resistance: ~$82K–$83K; above that, ~$83K–$86K.
Support: ~$76K–$78K; stronger support ~$72.5K–$75K.
Market structure: Short-term consolidation after a strong weekly recovery.
Key level: A sustained move above ~$83K would be an important technical development; rejection could bring a pullback toward the support zones. �
Use the Bitcoin
Bottom line: BTC is currently at a decision area—watch the $82K–$83K resista$nce and $76K
BTC is around $80.4K–$81.7K today. Recent data shows Bitcoin has recovered roughly 8.7% from the September 15 low near $75K, but price is now approaching an important resistance area. �
Use the Bitcoin +1
Resistance: ~$82K–$83K; above that, ~$83K–$86K.
Support: ~$76K–$78K; stronger support ~$72.5K–$75K.
Market structure: Short-term consolidation after a strong weekly recovery.
Key level: A sustained move above ~$83K would be an important technical development; rejection could bring a pullback toward the support zones. �
Use the Bitcoin
Bottom line: BTC is currently at a decision area—watch the $82K–$83K resista$nce and $76K
1
110
·
--
Übersetzung ansehen
Understand cryptoWhat is crypto trading?
Crypto trading basically is buying and selling cryptos in an attempt to profit from price changes
For example:
You buy Bitcoin for $100,000.
It goes up to $105,000
You sell
You make a profit of $5,000 per BTC before fees.
If it goes down to $95,000 you would have a loss.
Crypto can be traded 24/7 unlike traditional stock markets.
2. Trading vs investing
These are two different strategies.
Investing
- Typically longer term.
You could have an asset for months or even years.
It focuses on the potential the asset has.
Trading
- Typically short term.
Positions can range from a few minutes to months.
Focuses more on the price action of an asset.
There are many different types of trading strategies such as:
Style
Typical Timeframe
Scalping
Seconds-Minutes
Day trading
Minutes-Hours
Swing trading
Days-Weeks
Position trading
Weeks-Months
3. How a crypto exchange works
They're basically platforms where people buy/sell cryptocurrencies.
You usually create an account, do some form of KYC (Know Your Customer), fund your account, pick a crypto and place an order.
The exchange then looks for someone to take the opposite side of your order.
After which, you can sell the crypto you bought.
Popular exchanges are Coinbase and Kraken.
Because these platforms and their regulations vary per country, make sure to always check if it's legal where you are.
4. Order types
Market order
This is when you tell the exchange you want to buy/sell right away.
It's very straightforward but also important to be aware the actual execution price could be a bit different than what you were expecting to see on your screen.
Limit order
This is when you set a price you're willing to buy/sell at.
For example:
Bitcoin is priced at $100,000.
You put a limit order to buy at $98,000.
The order will only go through if the price meets your criteria.
Stop-loss
A stop-loss can be used to prevent large losses if a price suddenly goes the wrong way.
For example, you buy Bitcoin at say $100 and decide beforehand that you're willing to risk around $5. You could put a stop somewhere around $95.
The crucial part is to know what risk you're willing to take before you open a position and not to panic when the price does go against you.
5. Trading pairs
Cryptos are typically traded against another crypto.
For example:
BTC/USDT
This basically means you're trading Bitcoin against USDT.
If BTC/USDT = $100,000, one Bitcoin roughly equals 100,000 USDT.
Other examples could be ETH/USDT, SOL/USDT, BTC/USD etc.
6. Charts
The first thing many traders learn about is the candlestick chart.
What this chart displays is the Open, High, Low and Close (OHLC) of a candle.
Open - The price at which the candle opened.
High - Highest price of the candle.
Low - Lowest price of the candle.
Close - The price at which the candle closed.
For example, on a 1-hour chart, each candle represents the movement of the price within that 1-hour timeframe.
Timeframes
There are many different timeframes, some traders focus on 1-minute charts while others on 1-day charts.
Other options include: 5-minute, 15-minute, 1-hour, 4-hour, 1-day, 1-week charts.
A big mistake many people make is to get sucked into small timeframes such as 5-minute charts because they can appear very different compared to bigger timeframes.
7. Support and resistance
These are two very common terms in trading.
Support
is a price where buying pressure has traditionally come in, for example, if Bitcoin has repeatedly bounced off $95,000. Traders would consider this area a support. Resistance, on the flip side, is where selling pressure has come in, for example, if Bitcoin has consistently failed to break above $105,000, traders might consider $105,000 an important resistance area. Keep in mind these areas are not always guaranteed "walls", price can very well break through them.
8. Trend
The overall direction in which the market is moving.
Trends are generally categorized into:
Uptrend - Higher highs and higher lows
Example: $90k → $95k → $93k → $100k → $97k → $105k
Downtrend - Lower highs and lower lows
Range - Price is moving sideways, between a value high and value low
It's usually a lot more useful to know the overall trend, rather than getting too caught up in every little candle that appears on your chart.
9. Indicators
Indicators are basically mathematical calculations of the market.
Some common indicators are:
Moving averages
RSI
MACD
Volume
Moving averages
Moving averages (MA) are typically used to smooth out price data. They can be very helpful in identifying trends. Some common MAs are the 20-period, 50-period and 200-period MA.
RSI
RSI stands for Relative Strength Index. It's a momentum oscillator that measures the magnitude of recent price changes on a scale from 0-100. People often refer to RSI levels above 70 as overbought and below 30 as oversold, which is a good reminder that these levels do not always mean the price is ready to reverse.
MACD
MACD is another momentum indicator that is commonly used to measure trends. It basically calculates the difference between two MAs.
Volume
Volume tells you how much trading activity there is on an exchange. Volume can be very important when analysing if a breakout is valid.
10. Fundamental analysis
While technical analysis is focused on how price moves, fundamental analysis is concerned with the value of a crypto/project.
Fundamental analysis is basically looking to answer the question "Is this crypto/project valuable?".
Some questions to ask yourself could be
What problem does the project solve?
Who created it?
Is the team trustworthy?
How many tokens are there?
How are they created?
What is the token used for?
How much money is being locked into the project?
Does the project have real users?
Are there competitors?
What risks come with the project?
Is the token priced reasonably?
This is mostly relevant for smaller cryptos.
Understand crypto
What is crypto trading?
Crypto trading basically is buying and selling cryptos in an attempt to profit from price changes
For example:
You buy Bitcoin for $100,000.
It goes up to $105,000
You sell
You make a profit of $5,000 per BTC before fees.
If it goes down to $95,000 you would have a loss.
Crypto can be traded 24/7 unlike traditional stock markets.
2. Trading vs investing
These are two different strategies.
Investing
- Typically longer term.
You could have an asset for months or even years.
It focuses on the potential the asset has.
Trading
- Typically short term.
Positions can range from a few minutes to months.
Focuses more on the price action of an asset.
There are many different types of trading strategies such as:
Style
Typical Timeframe
Scalping
Seconds-Minutes
Day trading
Minutes-Hours
Swing trading
Days-Weeks
Position trading
Weeks-Months
3. How a crypto exchange works
They're basically platforms where people buy/sell cryptocurrencies.
You usually create an account, do some form of KYC (Know Your Customer), fund your account, pick a crypto and place an order.
The exchange then looks for someone to take the opposite side of your order.
After which, you can sell the crypto you bought.
Popular exchanges are Coinbase and Kraken.
Because these platforms and their regulations vary per country, make sure to always check if it's legal where you are.
4. Order types
Market order
This is when you tell the exchange you want to buy/sell right away.
It's very straightforward but also important to be aware the actual execution price could be a bit different than what you were expecting to see on your screen.
Limit order
This is when you set a price you're willing to buy/sell at.
For example:
Bitcoin is priced at $100,000.
You put a limit order to buy at $98,000.
The order will only go through if the price meets your criteria.
Stop-loss
A stop-loss can be used to prevent large losses if a price suddenly goes the wrong way.
For example, you buy Bitcoin at say $100 and decide beforehand that you're willing to risk around $5. You could put a stop somewhere around $95.
The crucial part is to know what risk you're willing to take before you open a position and not to panic when the price does go against you.
5. Trading pairs
Cryptos are typically traded against another crypto.
For example:
BTC/USDT
This basically means you're trading Bitcoin against USDT.
If BTC/USDT = $100,000, one Bitcoin roughly equals 100,000 USDT.
Other examples could be ETH/USDT, SOL/USDT, BTC/USD etc.
6. Charts
The first thing many traders learn about is the candlestick chart.
What this chart displays is the Open, High, Low and Close (OHLC) of a candle.
Open - The price at which the candle opened.
High - Highest price of the candle.
Low - Lowest price of the candle.
Close - The price at which the candle closed.
For example, on a 1-hour chart, each candle represents the movement of the price within that 1-hour timeframe.
Timeframes
There are many different timeframes, some traders focus on 1-minute charts while others on 1-day charts.
Other options include: 5-minute, 15-minute, 1-hour, 4-hour, 1-day, 1-week charts.
A big mistake many people make is to get sucked into small timeframes such as 5-minute charts because they can appear very different compared to bigger timeframes.
7. Support and resistance
These are two very common terms in trading.
Support
is a price where buying pressure has traditionally come in, for example, if Bitcoin has repeatedly bounced off $95,000. Traders would consider this area a support. Resistance, on the flip side, is where selling pressure has come in, for example, if Bitcoin has consistently failed to break above $105,000, traders might consider $105,000 an important resistance area. Keep in mind these areas are not always guaranteed "walls", price can very well break through them.
8. Trend
The overall direction in which the market is moving.
Trends are generally categorized into:
Uptrend - Higher highs and higher lows
Example: $90k → $95k → $93k → $100k → $97k → $105k
Downtrend - Lower highs and lower lows
Range - Price is moving sideways, between a value high and value low
It's usually a lot more useful to know the overall trend, rather than getting too caught up in every little candle that appears on your chart.
9. Indicators
Indicators are basically mathematical calculations of the market.
Some common indicators are:
Moving averages
RSI
MACD
Volume
Moving averages
Moving averages (MA) are typically used to smooth out price data. They can be very helpful in identifying trends. Some common MAs are the 20-period, 50-period and 200-period MA.
RSI
RSI stands for Relative Strength Index. It's a momentum oscillator that measures the magnitude of recent price changes on a scale from 0-100. People often refer to RSI levels above 70 as overbought and below 30 as oversold, which is a good reminder that these levels do not always mean the price is ready to reverse.
MACD
MACD is another momentum indicator that is commonly used to measure trends. It basically calculates the difference between two MAs.
Volume
Volume tells you how much trading activity there is on an exchange. Volume can be very important when analysing if a breakout is valid.
10. Fundamental analysis
While technical analysis is focused on how price moves, fundamental analysis is concerned with the value of a crypto/project.
Fundamental analysis is basically looking to answer the question "Is this crypto/project valuable?".
Some questions to ask yourself could be
What problem does the project solve?
Who created it?
Is the team trustworthy?
How many tokens are there?
How are they created?
What is the token used for?
How much money is being locked into the project?
Does the project have real users?
Are there competitors?
What risks come with the project?
Is the token priced reasonably?
This is mostly relevant for smaller cryptos.
Crypto trading basically is buying and selling cryptos in an attempt to profit from price changes
For example:
You buy Bitcoin for $100,000.
It goes up to $105,000
You sell
You make a profit of $5,000 per BTC before fees.
If it goes down to $95,000 you would have a loss.
Crypto can be traded 24/7 unlike traditional stock markets.
2. Trading vs investing
These are two different strategies.
Investing
- Typically longer term.
You could have an asset for months or even years.
It focuses on the potential the asset has.
Trading
- Typically short term.
Positions can range from a few minutes to months.
Focuses more on the price action of an asset.
There are many different types of trading strategies such as:
Style
Typical Timeframe
Scalping
Seconds-Minutes
Day trading
Minutes-Hours
Swing trading
Days-Weeks
Position trading
Weeks-Months
3. How a crypto exchange works
They're basically platforms where people buy/sell cryptocurrencies.
You usually create an account, do some form of KYC (Know Your Customer), fund your account, pick a crypto and place an order.
The exchange then looks for someone to take the opposite side of your order.
After which, you can sell the crypto you bought.
Popular exchanges are Coinbase and Kraken.
Because these platforms and their regulations vary per country, make sure to always check if it's legal where you are.
4. Order types
Market order
This is when you tell the exchange you want to buy/sell right away.
It's very straightforward but also important to be aware the actual execution price could be a bit different than what you were expecting to see on your screen.
Limit order
This is when you set a price you're willing to buy/sell at.
For example:
Bitcoin is priced at $100,000.
You put a limit order to buy at $98,000.
The order will only go through if the price meets your criteria.
Stop-loss
A stop-loss can be used to prevent large losses if a price suddenly goes the wrong way.
For example, you buy Bitcoin at say $100 and decide beforehand that you're willing to risk around $5. You could put a stop somewhere around $95.
The crucial part is to know what risk you're willing to take before you open a position and not to panic when the price does go against you.
5. Trading pairs
Cryptos are typically traded against another crypto.
For example:
BTC/USDT
This basically means you're trading Bitcoin against USDT.
If BTC/USDT = $100,000, one Bitcoin roughly equals 100,000 USDT.
Other examples could be ETH/USDT, SOL/USDT, BTC/USD etc.
6. Charts
The first thing many traders learn about is the candlestick chart.
What this chart displays is the Open, High, Low and Close (OHLC) of a candle.
Open - The price at which the candle opened.
High - Highest price of the candle.
Low - Lowest price of the candle.
Close - The price at which the candle closed.
For example, on a 1-hour chart, each candle represents the movement of the price within that 1-hour timeframe.
Timeframes
There are many different timeframes, some traders focus on 1-minute charts while others on 1-day charts.
Other options include: 5-minute, 15-minute, 1-hour, 4-hour, 1-day, 1-week charts.
A big mistake many people make is to get sucked into small timeframes such as 5-minute charts because they can appear very different compared to bigger timeframes.
7. Support and resistance
These are two very common terms in trading.
Support
is a price where buying pressure has traditionally come in, for example, if Bitcoin has repeatedly bounced off $95,000. Traders would consider this area a support. Resistance, on the flip side, is where selling pressure has come in, for example, if Bitcoin has consistently failed to break above $105,000, traders might consider $105,000 an important resistance area. Keep in mind these areas are not always guaranteed "walls", price can very well break through them.
8. Trend
The overall direction in which the market is moving.
Trends are generally categorized into:
Uptrend - Higher highs and higher lows
Example: $90k → $95k → $93k → $100k → $97k → $105k
Downtrend - Lower highs and lower lows
Range - Price is moving sideways, between a value high and value low
It's usually a lot more useful to know the overall trend, rather than getting too caught up in every little candle that appears on your chart.
9. Indicators
Indicators are basically mathematical calculations of the market.
Some common indicators are:
Moving averages
RSI
MACD
Volume
Moving averages
Moving averages (MA) are typically used to smooth out price data. They can be very helpful in identifying trends. Some common MAs are the 20-period, 50-period and 200-period MA.
RSI
RSI stands for Relative Strength Index. It's a momentum oscillator that measures the magnitude of recent price changes on a scale from 0-100. People often refer to RSI levels above 70 as overbought and below 30 as oversold, which is a good reminder that these levels do not always mean the price is ready to reverse.
MACD
MACD is another momentum indicator that is commonly used to measure trends. It basically calculates the difference between two MAs.
Volume
Volume tells you how much trading activity there is on an exchange. Volume can be very important when analysing if a breakout is valid.
10. Fundamental analysis
While technical analysis is focused on how price moves, fundamental analysis is concerned with the value of a crypto/project.
Fundamental analysis is basically looking to answer the question "Is this crypto/project valuable?".
Some questions to ask yourself could be
What problem does the project solve?
Who created it?
Is the team trustworthy?
How many tokens are there?
How are they created?
What is the token used for?
How much money is being locked into the project?
Does the project have real users?
Are there competitors?
What risks come with the project?
Is the token priced reasonably?
This is mostly relevant for smaller cryptos.
1
159
Anmelden und weiter Inhalte entdecken
Krypto-Nutzer weltweit auf Binance Square kennenlernen
⚡️ Bleib in Sachen Krypto stets am Puls.
💬 Die weltgrößte Kryptobörse vertraut darauf.
👍 Erhalte verlässliche Einblicke von verifizierten Creators.
E-Mail-Adresse/Telefonnummer
Trendthemen
SaylorHintsStrategyBitcoinBuy
2.2M Aufrufe
11,781 Kommentare
#SaylorHintsStrategyBitcoinBuy
Michael Saylor sendet erneut positive Signale zur Bitcoin-Strategie.
Doch neueste Daten zeigen, dass die Strategie in den letzten Wochen noch keinen Bitcoin gekauft hat. Per 13. September 2026 hält das Unternehmen weiterhin 845.050 BTC sowie rund 6,4 Mrd. USD in USD-basierten Vermögenswerten.
Statt BTC zu kaufen, allokiert die Strategie etwa 139 Mio. USD, um bevorzugte Aktien der STRC zurückzukaufen.
Was bedeutet das für den Markt?
🔹 Strategy hält weiterhin an seinem langfristigen Vertrauen in Bitcoin fest
🔹 Die USD-Reserven bieten Spielraum für den nächsten BTC-Kauf
🔹 Neue Käufe können ein bullischer Katalysator für die institutionelle Stimmung sein
🔹 Doch ein Hinweis ist nicht dasselbe wie ein bestätigter Kauf
Für den Moment muss der Markt zwischen Gerüchten über Akkumulation und offiziellen Einreichungen unterscheiden.
Warten Sie auf die Bestätigung – kaufen Sie nicht nur wegen einer Schlagzeile.
#Bitcoin #BTC #Strategy #MichaelSaylor
$BTC
XaliCoin
·1 Likes
·220 Aufrufe
BOJRaisesRatesTo31YearHigh
199,466 Aufrufe
2,903 Kommentare
BuffettStepsDownAsBerkshireChairman
96,821 Aufrufe
1,525 Kommentare