

Muhammad uzair 786
8 Beiträge

Muhammad uzair 786
Melden
Nutzer blockieren
my name is Muhammad Uzair and i am not a terrorist
Trade eröffnen
Gelegenheitstrader
4.9 Jahre
7 Following
20 Follower
20 Like gegeben
Beiträge
Portfolio
Übersetzung ansehen
$BTC $BNB $ETH $USDC $USDT
$BTC $BNB $ETH $USDC $USDT
7
Strategischer Ausblick & Szenarien
Bärisches / Bullisches Szenario: Ein entschließender täglicher Schlusskurs über dem unmittelbaren Widerstand, begleitet von hohen Volumensignalen, deutet auf einen Ausbruch hin zu den nächsten psychologischen Kurszielen.
Bärisches / Retest-Szenario: Scheitert der Durchbruch über den oberen Widerstand, könnte es zu einem gesunden Rücksetzer in Richtung wichtiger Unterstützungszonen kommen, um die Liquidität der Käufer vor dem nächsten großen Move zu testen.#$Ethereum (ETH) Technische & Marktanalyse
1. Marktstimmung & Kerntreiber
Netzwerkaktivität & Nutzen: Ethereum bleibt die führende Plattform für Smart Contracts und treibt maßgebliche Volumina in DeFi (Dezentrales Finanzwesen), Layer-2-Scaling-Lösungen (Arbitrum, Optimism, Base) sowie tokenisierte reale Vermögenswerte (RWAs) an.
Staking & Angebotsdynamik: Ein erheblicher Teil des im Umlauf befindlichen ETH ist in Staking-Verträgen gebunden. Die Post-Merge-Tokenomics (Burn-Mechanismus via EIP-1559) gleichen die gesamte Angebotsausgabe weiterhin aus, abhängig von Netzwerkauslastung und Gasnutzung.
Institutionelle Adoption: Das Vorhandensein von Spot-$Ethereum-ETFs schafft einen kontinuierlichen Kanal für institutionelle Zuflüsse und stabilisiert die langfristige Kapitaltiefe im Vergleich zu rein vom Retail getriebenen Zyklen.
2. Technische Analyse – Aufschlüsselung
Wichtige technische Indikatoren
Gleitende Durchschnitte (50-Tage & 200-Tage-EMA):
Ein Halten oberhalb der 200-Tage-EMA zeigt einen anhaltend bullischen Makrotrend.
Ein Crossover, bei dem die 50-Tage-EMA über der 200-Tage-EMA bleibt, bestätigt einen Aufwärtsimpuls.
RSI (Relative Strength Index – 14-Perioden):
Über 70: Überkauftes Gebiet; ein kurzfristiger Rücksetzer oder eine Konsolidierung ist möglich.
40–60-Bereich: Neutrale Zone; begünstigt die Fortsetzung des bestehenden Trends.
Unter 30: Überverkauft; potenzielle Kaufgelegenheit.
MACD (Moving Average Convergence Divergence):
Ausschau nach bullischen Crossover über der Signallinie, um den Einstiegsmomentum zu bestätigen.
#Ethirium #ETH🔥🔥🔥🔥🔥🔥
Strategischer Ausblick & Szenarien
Bärisches / Bullisches Szenario: Ein entschließender täglicher Schlusskurs über dem unmittelbaren Widerstand, begleitet von hohen Volumensignalen, deutet auf einen Ausbruch hin zu den nächsten psychologischen Kurszielen.
Bärisches / Retest-Szenario: Scheitert der Durchbruch über den oberen Widerstand, könnte es zu einem gesunden Rücksetzer in Richtung wichtiger Unterstützungszonen kommen, um die Liquidität der Käufer vor dem nächsten großen Move zu testen.#$Ethereum (ETH) Technische & Marktanalyse
1. Marktstimmung & Kerntreiber
Netzwerkaktivität & Nutzen: Ethereum bleibt die führende Plattform für Smart Contracts und treibt maßgebliche Volumina in DeFi (Dezentrales Finanzwesen), Layer-2-Scaling-Lösungen (Arbitrum, Optimism, Base) sowie tokenisierte reale Vermögenswerte (RWAs) an.
Staking & Angebotsdynamik: Ein erheblicher Teil des im Umlauf befindlichen ETH ist in Staking-Verträgen gebunden. Die Post-Merge-Tokenomics (Burn-Mechanismus via EIP-1559) gleichen die gesamte Angebotsausgabe weiterhin aus, abhängig von Netzwerkauslastung und Gasnutzung.
Institutionelle Adoption: Das Vorhandensein von Spot-$Ethereum-ETFs schafft einen kontinuierlichen Kanal für institutionelle Zuflüsse und stabilisiert die langfristige Kapitaltiefe im Vergleich zu rein vom Retail getriebenen Zyklen.
2. Technische Analyse – Aufschlüsselung
Wichtige technische Indikatoren
Gleitende Durchschnitte (50-Tage & 200-Tage-EMA):
Ein Halten oberhalb der 200-Tage-EMA zeigt einen anhaltend bullischen Makrotrend.
Ein Crossover, bei dem die 50-Tage-EMA über der 200-Tage-EMA bleibt, bestätigt einen Aufwärtsimpuls.
RSI (Relative Strength Index – 14-Perioden):
Über 70: Überkauftes Gebiet; ein kurzfristiger Rücksetzer oder eine Konsolidierung ist möglich.
40–60-Bereich: Neutrale Zone; begünstigt die Fortsetzung des bestehenden Trends.
Unter 30: Überverkauft; potenzielle Kaufgelegenheit.
MACD (Moving Average Convergence Divergence):
Ausschau nach bullischen Crossover über der Signallinie, um den Einstiegsmomentum zu bestätigen.
#Ethirium #ETH🔥🔥🔥🔥🔥🔥
Bärisches / Bullisches Szenario: Ein entschließender täglicher Schlusskurs über dem unmittelbaren Widerstand, begleitet von hohen Volumensignalen, deutet auf einen Ausbruch hin zu den nächsten psychologischen Kurszielen.
Bärisches / Retest-Szenario: Scheitert der Durchbruch über den oberen Widerstand, könnte es zu einem gesunden Rücksetzer in Richtung wichtiger Unterstützungszonen kommen, um die Liquidität der Käufer vor dem nächsten großen Move zu testen.#$Ethereum (ETH) Technische & Marktanalyse
1. Marktstimmung & Kerntreiber
Netzwerkaktivität & Nutzen: Ethereum bleibt die führende Plattform für Smart Contracts und treibt maßgebliche Volumina in DeFi (Dezentrales Finanzwesen), Layer-2-Scaling-Lösungen (Arbitrum, Optimism, Base) sowie tokenisierte reale Vermögenswerte (RWAs) an.
Staking & Angebotsdynamik: Ein erheblicher Teil des im Umlauf befindlichen ETH ist in Staking-Verträgen gebunden. Die Post-Merge-Tokenomics (Burn-Mechanismus via EIP-1559) gleichen die gesamte Angebotsausgabe weiterhin aus, abhängig von Netzwerkauslastung und Gasnutzung.
Institutionelle Adoption: Das Vorhandensein von Spot-$Ethereum-ETFs schafft einen kontinuierlichen Kanal für institutionelle Zuflüsse und stabilisiert die langfristige Kapitaltiefe im Vergleich zu rein vom Retail getriebenen Zyklen.
2. Technische Analyse – Aufschlüsselung
Wichtige technische Indikatoren
Gleitende Durchschnitte (50-Tage & 200-Tage-EMA):
Ein Halten oberhalb der 200-Tage-EMA zeigt einen anhaltend bullischen Makrotrend.
Ein Crossover, bei dem die 50-Tage-EMA über der 200-Tage-EMA bleibt, bestätigt einen Aufwärtsimpuls.
RSI (Relative Strength Index – 14-Perioden):
Über 70: Überkauftes Gebiet; ein kurzfristiger Rücksetzer oder eine Konsolidierung ist möglich.
40–60-Bereich: Neutrale Zone; begünstigt die Fortsetzung des bestehenden Trends.
Unter 30: Überverkauft; potenzielle Kaufgelegenheit.
MACD (Moving Average Convergence Divergence):
Ausschau nach bullischen Crossover über der Signallinie, um den Einstiegsmomentum zu bestätigen.
#Ethirium #ETH🔥🔥🔥🔥🔥🔥
69
Artikel
Übersetzung ansehen
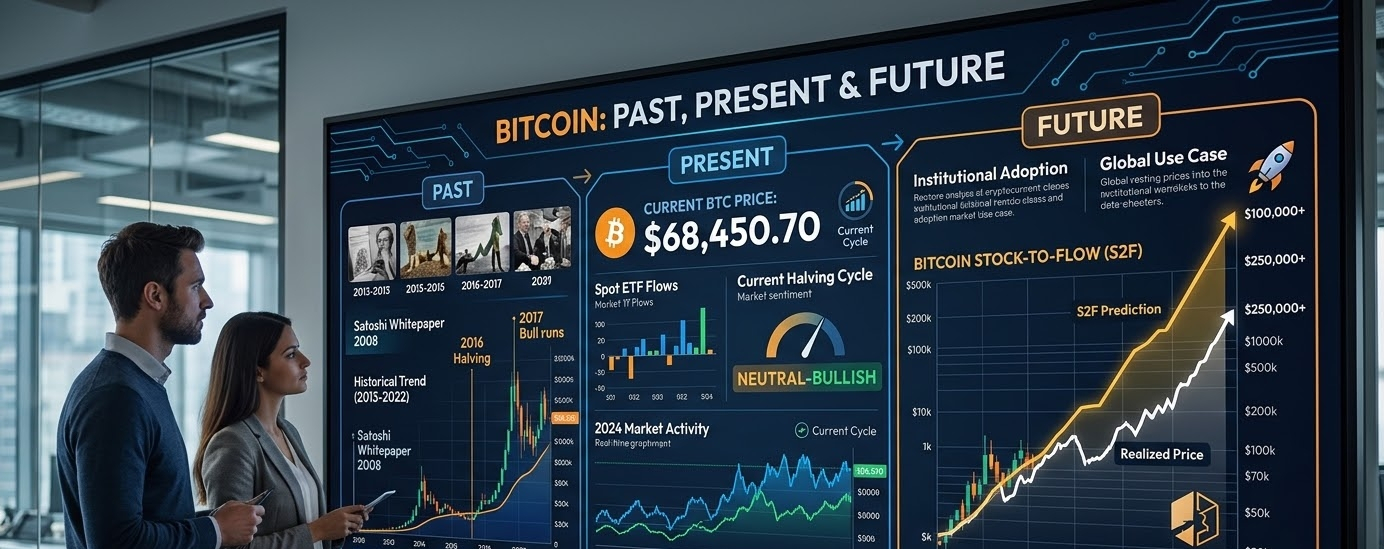
$Bitcoin Past Present and Future Analysis1. Past Analysis
2009 – 2013: $Bitcoin started at a fraction of a cent and crossed $1,000 for the first time in 2013.
2017 & 2021 Bull Runs: $Bitcoin peaked near $20,000 in 2017 and set an all-time high of approximately $69,000 during the 2021 bull run.
2024 (Halving & ETFs): The fourth $Bitcoin Halving occurred in April 2024. Following the approval of Spot $Bitcoin ETFs, $BTC hit a new high above $73,000 in March 2024.
2. Present Analysis
Current Price: $Bitcoin is currently trading in the range of $83,000 – $85,000.
Market Situation: Continuous institutional inflows and ETF demand are driving market strength.
Key Levels: The $82,000 – $83,000 zone serves as key support, while $85,000 – $86,000 acts as immediate resistance.
3. Future Analysis
Short-Term: Historically, $Bitcoin reaches its cycle peak 12 to 18 months following a halving event. Analysts expect $BTC to test and cross the psychological $100,000 mark during this period.
Long-Term (2028 & Beyond): Following the next halving in 2028 and growing global institutional adoption, $Bitcoin has the potential to target $150,000 to $250,000+.
Risks: Macroeconomic conditions (inflation, interest rates) and regulatory developments remain key risk factors influencing price action.
Bitcoin Trend and Future Projection Chart
Below is the $Bitcoin price history and Stock-to-Flow model chart, illustrating how supply reductions after each halving have historically driven significant price appreciation:
Note: The crypto market is highly volatile. Always do your own research (DYOR) before making any investment decisions.
#BTC
$Bitcoin Past Present and Future Analysis
1. Past Analysis
2009 – 2013: $Bitcoin started at a fraction of a cent and crossed $1,000 for the first time in 2013.
2017 & 2021 Bull Runs: $Bitcoin peaked near $20,000 in 2017 and set an all-time high of approximately $69,000 during the 2021 bull run.
2024 (Halving & ETFs): The fourth $Bitcoin Halving occurred in April 2024. Following the approval of Spot $Bitcoin ETFs, $BTC hit a new high above $73,000 in March 2024.
2. Present Analysis
Current Price: $Bitcoin is currently trading in the range of $83,000 – $85,000.
Market Situation: Continuous institutional inflows and ETF demand are driving market strength.
Key Levels: The $82,000 – $83,000 zone serves as key support, while $85,000 – $86,000 acts as immediate resistance.
3. Future Analysis
Short-Term: Historically, $Bitcoin reaches its cycle peak 12 to 18 months following a halving event. Analysts expect $BTC to test and cross the psychological $100,000 mark during this period.
Long-Term (2028 & Beyond): Following the next halving in 2028 and growing global institutional adoption, $Bitcoin has the potential to target $150,000 to $250,000+.
Risks: Macroeconomic conditions (inflation, interest rates) and regulatory developments remain key risk factors influencing price action.
Bitcoin Trend and Future Projection Chart
Below is the $Bitcoin price history and Stock-to-Flow model chart, illustrating how supply reductions after each halving have historically driven significant price appreciation:
Note: The crypto market is highly volatile. Always do your own research (DYOR) before making any investment decisions.
#BTC
2009 – 2013: $Bitcoin started at a fraction of a cent and crossed $1,000 for the first time in 2013.
2017 & 2021 Bull Runs: $Bitcoin peaked near $20,000 in 2017 and set an all-time high of approximately $69,000 during the 2021 bull run.
2024 (Halving & ETFs): The fourth $Bitcoin Halving occurred in April 2024. Following the approval of Spot $Bitcoin ETFs, $BTC hit a new high above $73,000 in March 2024.
2. Present Analysis
Current Price: $Bitcoin is currently trading in the range of $83,000 – $85,000.
Market Situation: Continuous institutional inflows and ETF demand are driving market strength.
Key Levels: The $82,000 – $83,000 zone serves as key support, while $85,000 – $86,000 acts as immediate resistance.
3. Future Analysis
Short-Term: Historically, $Bitcoin reaches its cycle peak 12 to 18 months following a halving event. Analysts expect $BTC to test and cross the psychological $100,000 mark during this period.
Long-Term (2028 & Beyond): Following the next halving in 2028 and growing global institutional adoption, $Bitcoin has the potential to target $150,000 to $250,000+.
Risks: Macroeconomic conditions (inflation, interest rates) and regulatory developments remain key risk factors influencing price action.
Bitcoin Trend and Future Projection Chart
Below is the $Bitcoin price history and Stock-to-Flow model chart, illustrating how supply reductions after each halving have historically driven significant price appreciation:
Note: The crypto market is highly volatile. Always do your own research (DYOR) before making any investment decisions.
#BTC
79
Übersetzung ansehen
Title: Bitcoin (BTC) Analysis: Current Market Status and Future Outlook
Bitcoin (BTC) is once again taking center stage in the global financial market. Following the 2024 Bitcoin Halving and the approval of Spot ETFs, the asset experienced significant price momentum, and in 2026, it continues to show resilience and consolidation.
1. Current Market Status
Currently, Bitcoin is consolidating in the $78,000 – $79,000 range after recently testing the $82,000 resistance level. Key market drivers include:
Institutional Inflows: Continuous capital inflows through Bitcoin ETFs are providing strong structural support to the market.
Macroeconomic Pressure: US inflation figures (CPI data) and interest rate decisions by the Federal Reserve have introduced short-term market volatility.
Key Support & Resistance Levels:
Support: $77,000 – $78,000
Resistance: $80,000 – $82,000
2. Future Outlook & Technical Projections
Looking ahead, analysts point toward both short-term targets and strong long-term fundamentals:
Short-Term Outlook: If Bitcoin successfully breaks and holds above the $80,000 barrier, it could trigger a renewed bullish continuation wave toward higher liquidity pools.
Long-Term Outlook: Driven by its fixed supply cap (21 million coins) and expanding global adoption, demand for Bitcoin remains fundamentally strong. Many financial analysts continue to reinforce its status as digital gold.
3. Key Takeaways for Traders
Macro Indicators: Keep a close eye on global macroeconomic signals and inflation metrics, as these can trigger temporary pullbacks.
Risk Management: Due to potential price volatility, practice strict risk management and avoid using excessive leverage on Binance Futures.
Title: Bitcoin (BTC) Analysis: Current Market Status and Future Outlook
Bitcoin (BTC) is once again taking center stage in the global financial market. Following the 2024 Bitcoin Halving and the approval of Spot ETFs, the asset experienced significant price momentum, and in 2026, it continues to show resilience and consolidation.
1. Current Market Status
Currently, Bitcoin is consolidating in the $78,000 – $79,000 range after recently testing the $82,000 resistance level. Key market drivers include:
Institutional Inflows: Continuous capital inflows through Bitcoin ETFs are providing strong structural support to the market.
Macroeconomic Pressure: US inflation figures (CPI data) and interest rate decisions by the Federal Reserve have introduced short-term market volatility.
Key Support & Resistance Levels:
Support: $77,000 – $78,000
Resistance: $80,000 – $82,000
2. Future Outlook & Technical Projections
Looking ahead, analysts point toward both short-term targets and strong long-term fundamentals:
Short-Term Outlook: If Bitcoin successfully breaks and holds above the $80,000 barrier, it could trigger a renewed bullish continuation wave toward higher liquidity pools.
Long-Term Outlook: Driven by its fixed supply cap (21 million coins) and expanding global adoption, demand for Bitcoin remains fundamentally strong. Many financial analysts continue to reinforce its status as digital gold.
3. Key Takeaways for Traders
Macro Indicators: Keep a close eye on global macroeconomic signals and inflation metrics, as these can trigger temporary pullbacks.
Risk Management: Due to potential price volatility, practice strict risk management and avoid using excessive leverage on Binance Futures.
Bitcoin (BTC) is once again taking center stage in the global financial market. Following the 2024 Bitcoin Halving and the approval of Spot ETFs, the asset experienced significant price momentum, and in 2026, it continues to show resilience and consolidation.
1. Current Market Status
Currently, Bitcoin is consolidating in the $78,000 – $79,000 range after recently testing the $82,000 resistance level. Key market drivers include:
Institutional Inflows: Continuous capital inflows through Bitcoin ETFs are providing strong structural support to the market.
Macroeconomic Pressure: US inflation figures (CPI data) and interest rate decisions by the Federal Reserve have introduced short-term market volatility.
Key Support & Resistance Levels:
Support: $77,000 – $78,000
Resistance: $80,000 – $82,000
2. Future Outlook & Technical Projections
Looking ahead, analysts point toward both short-term targets and strong long-term fundamentals:
Short-Term Outlook: If Bitcoin successfully breaks and holds above the $80,000 barrier, it could trigger a renewed bullish continuation wave toward higher liquidity pools.
Long-Term Outlook: Driven by its fixed supply cap (21 million coins) and expanding global adoption, demand for Bitcoin remains fundamentally strong. Many financial analysts continue to reinforce its status as digital gold.
3. Key Takeaways for Traders
Macro Indicators: Keep a close eye on global macroeconomic signals and inflation metrics, as these can trigger temporary pullbacks.
Risk Management: Due to potential price volatility, practice strict risk management and avoid using excessive leverage on Binance Futures.
53
Übersetzung ansehen
#2025withBinance Start your crypto story with the @Binance Year in Review and share your highlights! #2025withBinance.
👉 Sign up with my link and get 100 USD rewards! https://www.binance.com/year-in-review/2025-with-binance?ref=294012516
#2025withBinance Start your crypto story with the @Binance Year in Review and share your highlights! #2025withBinance.
👉 Sign up with my link and get 100 USD rewards! https://www.binance.com/year-in-review/2025-with-binance?ref=294012516
👉 Sign up with my link and get 100 USD rewards! https://www.binance.com/year-in-review/2025-with-binance?ref=294012516
11
11
Anmelden und weiter Inhalte entdecken
Krypto-Nutzer weltweit auf Binance Square kennenlernen
⚡️ Bleib in Sachen Krypto stets am Puls.
💬 Die weltgrößte Kryptobörse vertraut darauf.
👍 Erhalte verlässliche Einblicke von verifizierten Creators.
E-Mail-Adresse/Telefonnummer
Trendthemen
BitcoinClears$85200
6,344 Aufrufe
167 Kommentare
Wir haben die Bewegung bekommen, und $BTC steht genau dort, wo wir vorher die Daten hatten. So sieht echte Geduld für einen Trade aus.
Die Daten kamen gemischt rein, aber mit ein paar wichtigen Zahlen. ADP Non-Farm Employment Change lag bei 90K gegenüber 73K Prognose, während Core PCE bei 0,2% gegenüber den erwarteten 0,3% lag. Das finale BIP war ebenfalls stärker bei 2,2% gegenüber 1,5% Prognose, während Personal Spending bei 0,9% gegenüber den erwarteten 0,8% lag. Gleichzeitig verfehlte Personal Income mit 0,2% gegenüber 0,5% Prognose.
BTC ist zunächst auf 85.600 $ gestiegen und ist jetzt wieder dort, wo es hingehört. Ich schaue immer noch in Richtung der unteren Bereiche bei 82.759 $ und der 80.000 $-Liquidität, weil die übergeordnete Liquidität erledigt und abgehakt ist.
Wir hatten während der Daten eine Live-Session, und in dieser Session haben wir den Markt bei 83.800 $ gesehen, dann bei 85.600 $ und anschließend wieder in Richtung 83.000 $ – und wir sind trotzdem nicht in einen Trade eingestiegen.
So sieht Geduld aus.
Wir können keinen Einstieg erzwingen, wenn der Markt keine klare Richtung hat. Der gleiche Bereich ist weiterhin im Fokus, und wir warten darauf, dass der Markt uns das Setup gibt.
Lasst mich wissen, Jungs: Wie war die Session? Und sollten wir mehr reguläre Sessions mit unseren geschätzten Mitgliedern machen, damit wir ordentliche Diskussionen über den Markt führen können?
#BitcoinClears$85200 #AltcoinSeasonIndexHoldsAbove60For5Days #USADPAdds90000JobsInSeptember #BitcoinSlipsBelow$84000 #SECToClarifyOnChainFundraisingRules
Crypto_LUX
·24 Likes
·12.5k Aufrufe
AltcoinSeasonIndexHoldsAbove60For5Days
35,569 Aufrufe
950 Kommentare
USADPAdds90000JobsInSeptember
15,885 Aufrufe
538 Kommentare