
Nadia Carolan FU2b
37 Beiträge

Nadia Carolan FU2b
25 Following
32 Follower
63 Like gegeben
Beiträge
Alle
Zitierungen
Videos
Übersetzung ansehen
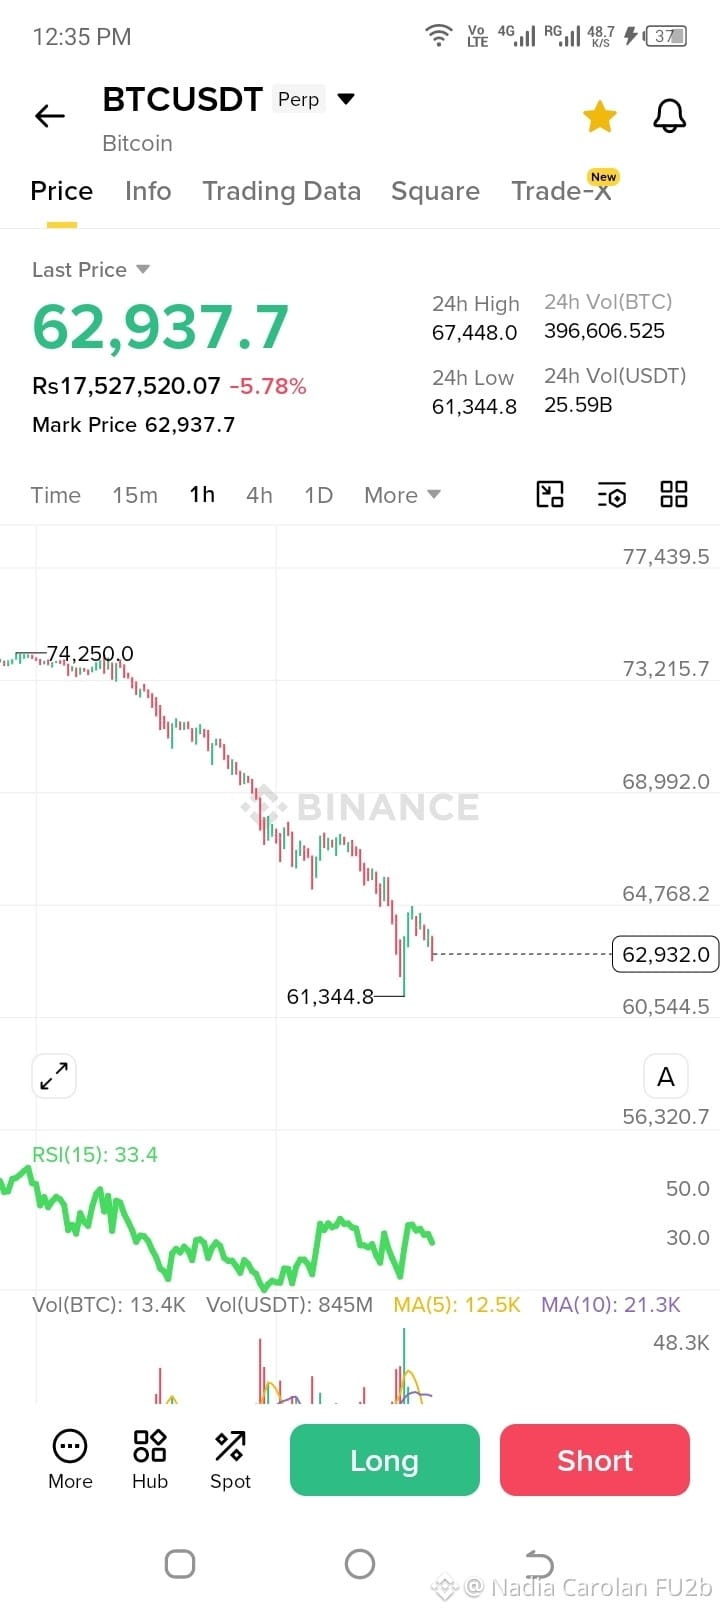
Market Structure
The trend is clearly bearish.
Price fell from around 74,250 to 61,344, creating a sequence of lower highs and lower lows.
The current bounce to ~62,900 looks more like a relief rally than a confirmed trend reversal.
RSI Analysis
RSI(15) is around 33–34.
That's close to oversold territory but not showing strong bullish momentum yet.
In strong downtrends, RSI can stay below 40 for a long time, so RSI alone is not a buy signal.
Key Levels
Support
61,300–61,500 (recent low)
If this breaks, next psychological zone is around 60,000
Resistance
64,700–65,000 (nearest resistance visible on chart)
68,900–69,000 (major resistance)
Bulls need to reclaim 65k first before talking about a larger recovery.
Trading Scenarios
Bullish case
Hold above 61.3k support.
Break and close above 65k on the 1H chart.
Target zone: 68.9k.
Bearish case
Rejection near 64k–65k.
Breakdown below 61.3k.
Could trigger another leg down toward 60k or lower.
My Read
At this moment I would classify it as bearish with a short-term oversold bounce. The chart does not yet show a trend reversal. Buyers need a strong break above the recent lower-high area to change the structure. General support/resistance analysis follows standard technical-analysis principles. �
Investopedia
If you tell me:
your entry price,
whether you're in a Long or Short,
and your leverage,
I can map out specific stop-loss and take-profit levels from this chart.$BTC
The trend is clearly bearish.
Price fell from around 74,250 to 61,344, creating a sequence of lower highs and lower lows.
The current bounce to ~62,900 looks more like a relief rally than a confirmed trend reversal.
RSI Analysis
RSI(15) is around 33–34.
That's close to oversold territory but not showing strong bullish momentum yet.
In strong downtrends, RSI can stay below 40 for a long time, so RSI alone is not a buy signal.
Key Levels
Support
61,300–61,500 (recent low)
If this breaks, next psychological zone is around 60,000
Resistance
64,700–65,000 (nearest resistance visible on chart)
68,900–69,000 (major resistance)
Bulls need to reclaim 65k first before talking about a larger recovery.
Trading Scenarios
Bullish case
Hold above 61.3k support.
Break and close above 65k on the 1H chart.
Target zone: 68.9k.
Bearish case
Rejection near 64k–65k.
Breakdown below 61.3k.
Could trigger another leg down toward 60k or lower.
My Read
At this moment I would classify it as bearish with a short-term oversold bounce. The chart does not yet show a trend reversal. Buyers need a strong break above the recent lower-high area to change the structure. General support/resistance analysis follows standard technical-analysis principles. �
Investopedia
If you tell me:
your entry price,
whether you're in a Long or Short,
and your leverage,
I can map out specific stop-loss and take-profit levels from this chart.$BTC
Übersetzung ansehen
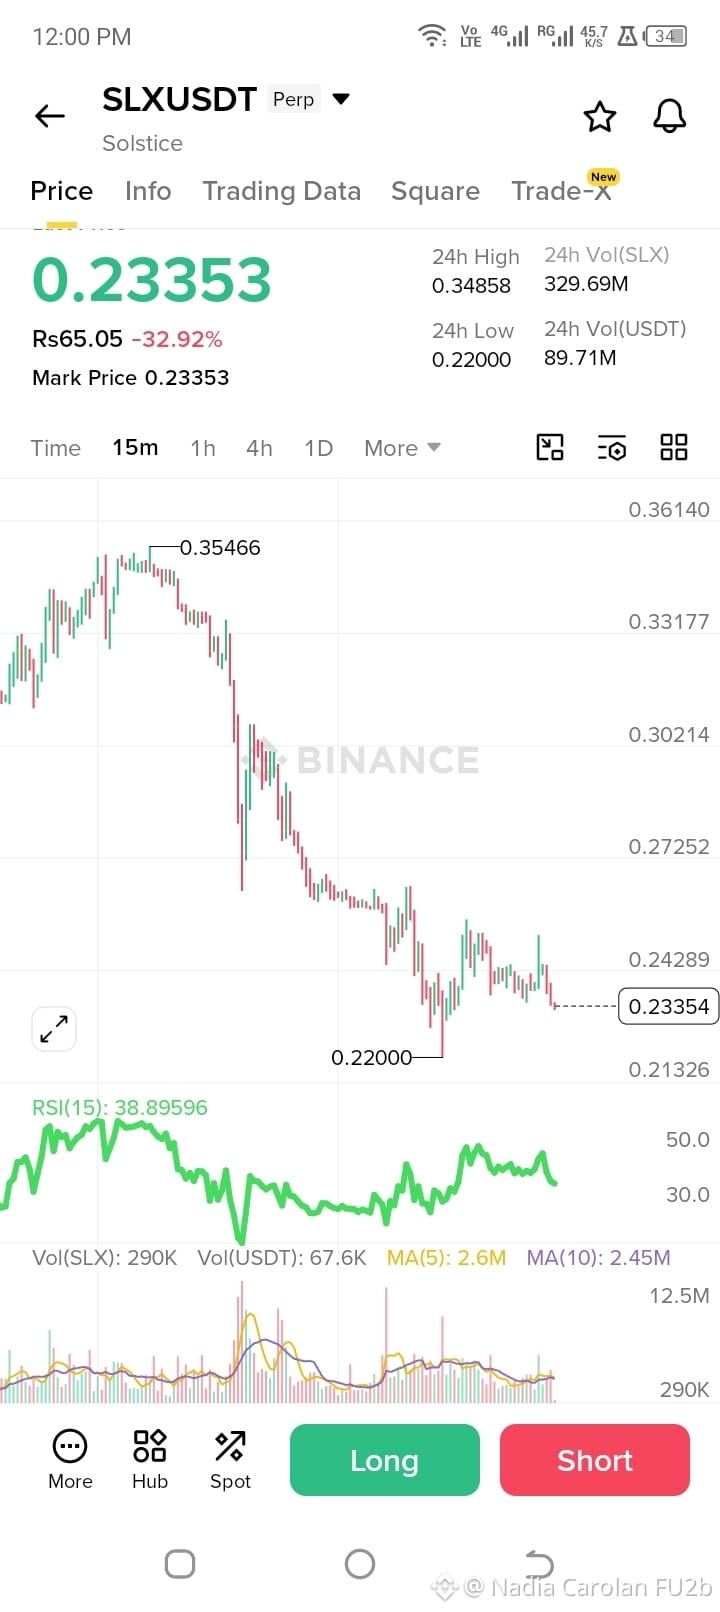
Looking only at this 15-minute chart (not financial advice):
What I see
Strong downtrend: Price fell from around 0.35 to 0.23, creating lower highs and lower lows.
No clear reversal yet: The recent bounce attempts are weak and sellers keep pushing price back down.
RSI around 39: Not extremely oversold. It suggests bearish momentum is still present, though selling pressure is not as intense as during the initial dump.
Volume has cooled: After the large selloff, volume decreased, which often means the market is waiting for the next catalyst.
Key levels
Support: ~0.2200 (the recent low)
Resistance: ~0.245–0.250
Stronger resistance higher up around 0.27–0.30
Bullish scenario
If price can reclaim and hold above 0.245–0.25 with increasing volume, it could attempt a relief rally toward 0.27+.
Bearish scenario
If 0.22 breaks convincingly, the trend remains bearish and another leg down becomes likely.
My read
Right now I'd classify this as bearish-to-neutral, not bullish. Catching a falling knife in a chart like this is risky because there is no confirmed trend reversal yet. For a long position, many traders would wait for:
A higher low to form.
A break of a recent swing high.
Volume increasing on green candles.
If you're already in a position, tell me:
Your entry price
Whether you're long or short
Your risk tolerance $SLX
What I see
Strong downtrend: Price fell from around 0.35 to 0.23, creating lower highs and lower lows.
No clear reversal yet: The recent bounce attempts are weak and sellers keep pushing price back down.
RSI around 39: Not extremely oversold. It suggests bearish momentum is still present, though selling pressure is not as intense as during the initial dump.
Volume has cooled: After the large selloff, volume decreased, which often means the market is waiting for the next catalyst.
Key levels
Support: ~0.2200 (the recent low)
Resistance: ~0.245–0.250
Stronger resistance higher up around 0.27–0.30
Bullish scenario
If price can reclaim and hold above 0.245–0.25 with increasing volume, it could attempt a relief rally toward 0.27+.
Bearish scenario
If 0.22 breaks convincingly, the trend remains bearish and another leg down becomes likely.
My read
Right now I'd classify this as bearish-to-neutral, not bullish. Catching a falling knife in a chart like this is risky because there is no confirmed trend reversal yet. For a long position, many traders would wait for:
A higher low to form.
A break of a recent swing high.
Volume increasing on green candles.
If you're already in a position, tell me:
Your entry price
Whether you're long or short
Your risk tolerance $SLX
Übersetzung ansehen
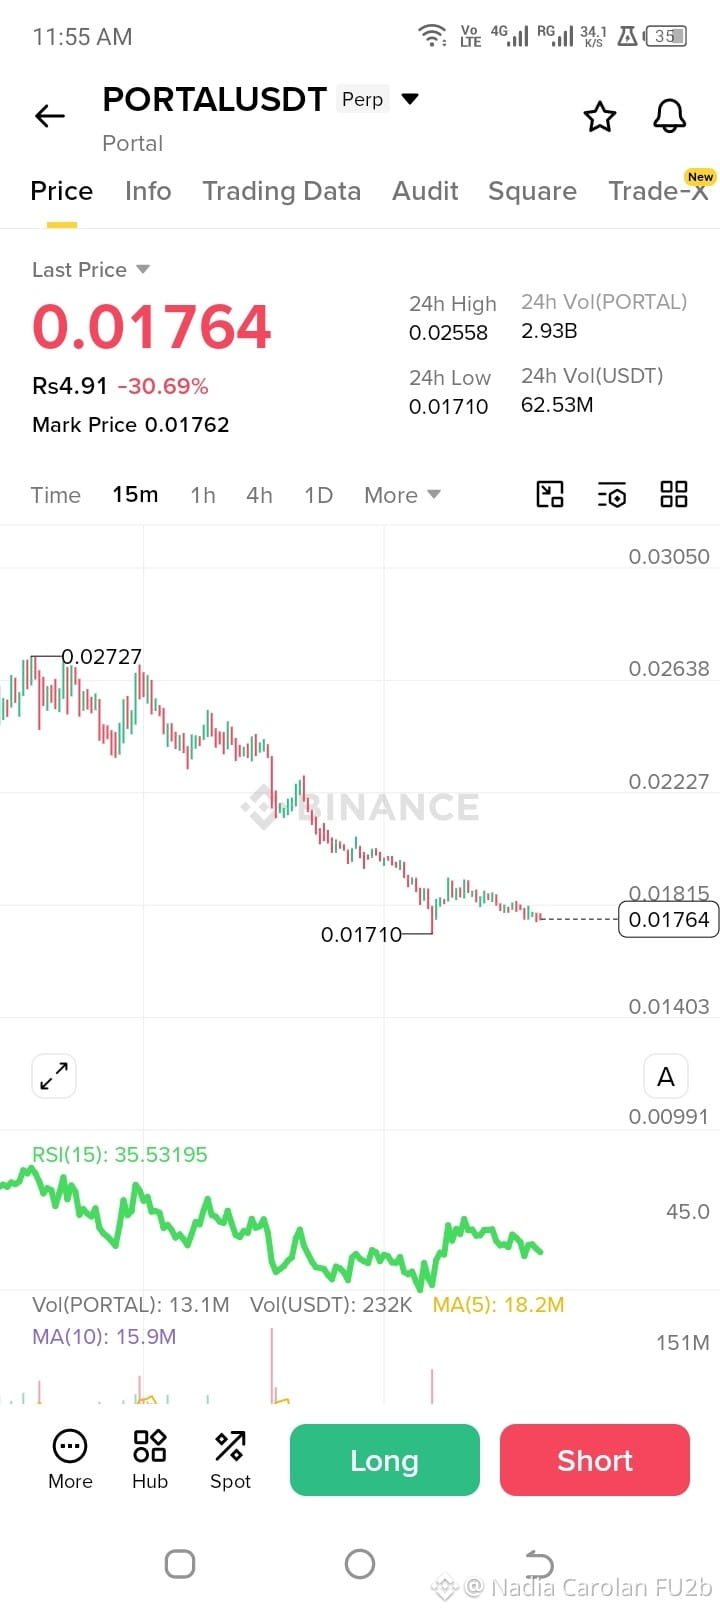
From the screenshot alone, I would not open a long position here.
What the chart shows
15-minute timeframe.
Strong downtrend: price fell from about 0.027 → 0.017.
Lower highs and lower lows are still forming.
RSI around 35, which is weak but not oversold enough to signal a strong reversal.
Price is trading very close to the daily low (0.01710), showing sellers remain in control.
Technical bias
📉 Short bias > Long bias
Bearish scenario
If price breaks below 0.01710, the next move could extend lower.
Trend-following traders generally prefer shorts until a clear reversal appears.
Bullish scenario
For a safer long, I'd want to see:
Price reclaim 0.01815 and hold above it.
Higher volume on green candles.
RSI moving back above 50.
Key levels
Support: 0.01710
Resistance: 0.01815
Stronger resistance: 0.02227
Risk warning
PORTAL has been extremely volatile and has experienced very large declines from its historical highs. News and project developments have created sharp moves in both directions, making futures positions especially risky. �
CoinMarketCap +1
My chart reading:
Current setup: Short = higher probability
Long = wait for confirmation above 0.01815
If you're trading Binance Perpetuals, tell me:
Your entry price,
Leverage (5x, 10x, 20x, etc.),
Account size,
and I can help identify a reasonable stop-loss and target based on risk management.$PORTAL
What the chart shows
15-minute timeframe.
Strong downtrend: price fell from about 0.027 → 0.017.
Lower highs and lower lows are still forming.
RSI around 35, which is weak but not oversold enough to signal a strong reversal.
Price is trading very close to the daily low (0.01710), showing sellers remain in control.
Technical bias
📉 Short bias > Long bias
Bearish scenario
If price breaks below 0.01710, the next move could extend lower.
Trend-following traders generally prefer shorts until a clear reversal appears.
Bullish scenario
For a safer long, I'd want to see:
Price reclaim 0.01815 and hold above it.
Higher volume on green candles.
RSI moving back above 50.
Key levels
Support: 0.01710
Resistance: 0.01815
Stronger resistance: 0.02227
Risk warning
PORTAL has been extremely volatile and has experienced very large declines from its historical highs. News and project developments have created sharp moves in both directions, making futures positions especially risky. �
CoinMarketCap +1
My chart reading:
Current setup: Short = higher probability
Long = wait for confirmation above 0.01815
If you're trading Binance Perpetuals, tell me:
Your entry price,
Leverage (5x, 10x, 20x, etc.),
Account size,
and I can help identify a reasonable stop-loss and target based on risk management.$PORTAL
$SIREN
Einige aktuelle Marktdatenquellen zeigen:
SIREN hat sehr große Preisschwankungen und Volatilität erlebt.
Das Handelsvolumen hat zeitweise Zehntausende von Millionen USDT pro Tag erreicht.
Der Token ist seit 2025 für Spot- und Futures-Trading an mehreren Börsen gelistet. �
KOMBI.ID +2
Ein paar Dinge, die du vor einer Investition überprüfen solltest:
Projektgrundlagen – Was macht der SIREN-Token eigentlich? Wer steckt hinter dem Team?
Vertragsadresse – Überprüfe, ob du den richtigen Token und nicht einen Nachahmer-Token anschaust.
Liquidität und Börsenunterstützung – Höhere Liquidität bedeutet in der Regel einfacheres Kaufen und Verkaufen.
Risiko – Die verfügbaren Daten deuten auf eine signifikante Preisvolatilität hin, daher könnte es sich um ein hochriskantes Asset handeln. �
TradingView +1
Wenn du darüber nachdenkst, es zu kaufen, kann ich helfen, Folgendes zu analysieren:
die Zweckbestimmung des Projekts,
Tokenomics,
den aktuellen Preistrend,
ob es legitim aussieht,
oder die Risiken im Vergleich zum potenziellen Aufwärtspotenzial.
Sag mir einfach, ob du nach dem SIREN-Krypto-Token, einem SIRENUSDT-Futures-Kontrakt fragst, oder schick mir die Börse/link, die du dir anschaust.
Einige aktuelle Marktdatenquellen zeigen:
SIREN hat sehr große Preisschwankungen und Volatilität erlebt.
Das Handelsvolumen hat zeitweise Zehntausende von Millionen USDT pro Tag erreicht.
Der Token ist seit 2025 für Spot- und Futures-Trading an mehreren Börsen gelistet. �
KOMBI.ID +2
Ein paar Dinge, die du vor einer Investition überprüfen solltest:
Projektgrundlagen – Was macht der SIREN-Token eigentlich? Wer steckt hinter dem Team?
Vertragsadresse – Überprüfe, ob du den richtigen Token und nicht einen Nachahmer-Token anschaust.
Liquidität und Börsenunterstützung – Höhere Liquidität bedeutet in der Regel einfacheres Kaufen und Verkaufen.
Risiko – Die verfügbaren Daten deuten auf eine signifikante Preisvolatilität hin, daher könnte es sich um ein hochriskantes Asset handeln. �
TradingView +1
Wenn du darüber nachdenkst, es zu kaufen, kann ich helfen, Folgendes zu analysieren:
die Zweckbestimmung des Projekts,
Tokenomics,
den aktuellen Preistrend,
ob es legitim aussieht,
oder die Risiken im Vergleich zum potenziellen Aufwärtspotenzial.
Sag mir einfach, ob du nach dem SIREN-Krypto-Token, einem SIRENUSDT-Futures-Kontrakt fragst, oder schick mir die Börse/link, die du dir anschaust.
Übersetzung ansehen
$OPN If by OPNUSDT you mean the Binance pair for OPN (Opinion) / USDT, it is still a relatively new and highly volatile token, so technical analysis should be treated with extra caution. �
followin.io +1
Current Technical View
Based on recent market data:
Price has been trading around the $0.17–$0.25 area recently. �
Market Masters +1
Daily RSI has been reported near 68, indicating bullish momentum but approaching overbought territory. �
Reddit
On shorter timeframes, RSI has reached very high levels (above 90 in one signal report), suggesting the possibility of pullbacks after sharp rallies. �
Reddit
Open interest has been declining slightly, which can indicate reduced speculative pressure after earlier excitement. �
Market Masters
Key Levels to Watch
A recent signal report identified:
Resistance: ~$0.266
Support: ~$0.109
A break above resistance with strong volume could signal continuation higher, while losing support would weaken the bullish structure. �
Reddit
Momentum Assessment
Bullish factors
Daily MACD bullish crossover ("golden cross") reported.
Strong trading interest since exchange listings.
High volume spikes can fuel momentum moves. �
Reddit +1
Bearish factors
Very high volatility typical of newly listed tokens.
Sharp rallies have been followed by profit-taking.
Limited historical price data makes long-term technical analysis less reliable. �
Hyukee Binance Guide +1
Trading Plan Example
Bullish scenario: Daily close above resistance (~0.266) with increasing volume.
Neutral scenario: Consolidation between support and resistance.
Bearish scenario: Breakdown below support (~0.109), which could trigger further selling pressure. �
Reddit +1
If you want a more precise technical analysis, send:
The timeframe (15m, 1h, 4h, or 1D),
A screenshot of the Binance chart,
and I can analyze support/resistance, RSI, MACD, trend structure, and possible entry/exit zones in detail.
followin.io +1
Current Technical View
Based on recent market data:
Price has been trading around the $0.17–$0.25 area recently. �
Market Masters +1
Daily RSI has been reported near 68, indicating bullish momentum but approaching overbought territory. �
On shorter timeframes, RSI has reached very high levels (above 90 in one signal report), suggesting the possibility of pullbacks after sharp rallies. �
Open interest has been declining slightly, which can indicate reduced speculative pressure after earlier excitement. �
Market Masters
Key Levels to Watch
A recent signal report identified:
Resistance: ~$0.266
Support: ~$0.109
A break above resistance with strong volume could signal continuation higher, while losing support would weaken the bullish structure. �
Momentum Assessment
Bullish factors
Daily MACD bullish crossover ("golden cross") reported.
Strong trading interest since exchange listings.
High volume spikes can fuel momentum moves. �
Reddit +1
Bearish factors
Very high volatility typical of newly listed tokens.
Sharp rallies have been followed by profit-taking.
Limited historical price data makes long-term technical analysis less reliable. �
Hyukee Binance Guide +1
Trading Plan Example
Bullish scenario: Daily close above resistance (~0.266) with increasing volume.
Neutral scenario: Consolidation between support and resistance.
Bearish scenario: Breakdown below support (~0.109), which could trigger further selling pressure. �
Reddit +1
If you want a more precise technical analysis, send:
The timeframe (15m, 1h, 4h, or 1D),
A screenshot of the Binance chart,
and I can analyze support/resistance, RSI, MACD, trend structure, and possible entry/exit zones in detail.
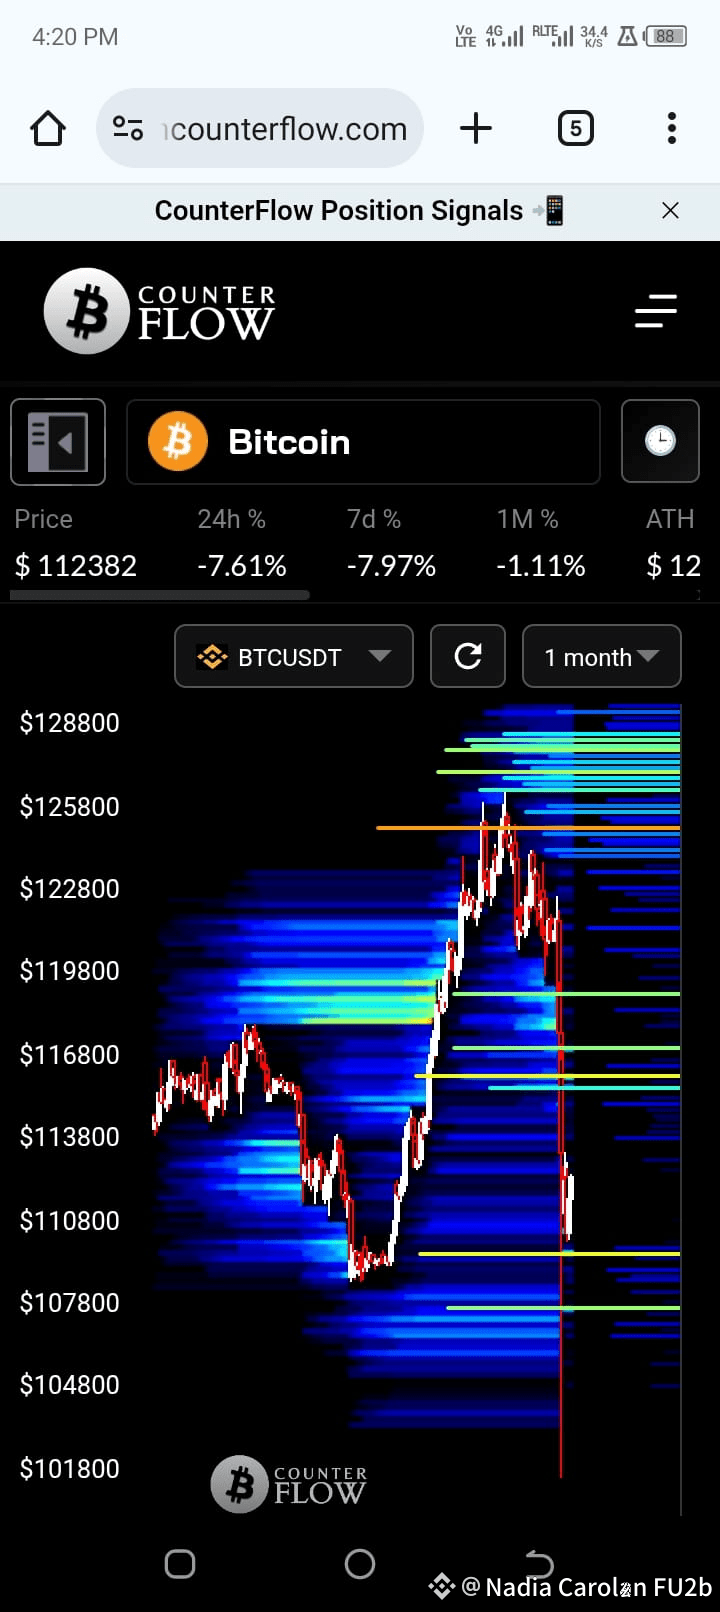
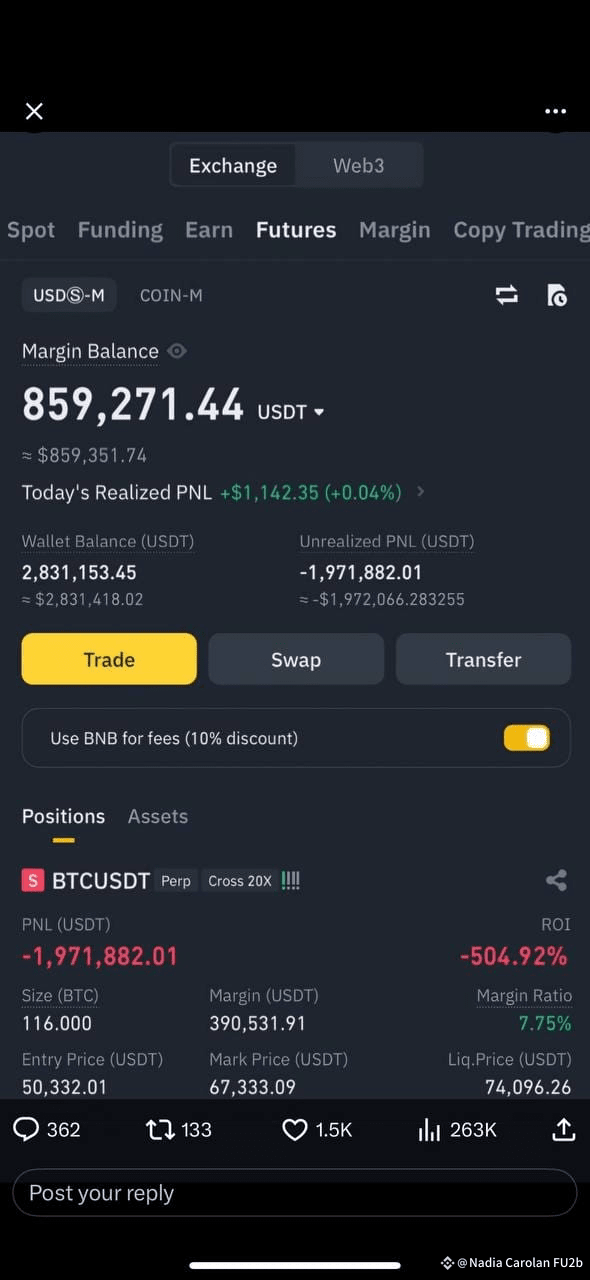
$ORDER ajeeb bat ha Yar jab b main buy kart hu Thu neechy jata ha jab sell karta hu Thu upar jata ha .....accha khasa Zindagi chal Raha tha itrading NY tantion bana dia yar
#TrumpVsMusk Die Roadmap sieht aus wie „Melt-up → Klippensprung → Phönix.“ Hedge den Hopium:
• $BTC 110 K möglich, aber beobachte DXY & Miner-Angebot.
• Wenn die Fed in die Schäumung schneidet, ist es ein Liquiditätsabstoß, nicht ein Boden.
• Rezession ≠ Marktzusammenbruch—Stagflation kann den Bären aufhalten.
Bereite Bargeld, Staatsanleihen und trockenes Pulver für das Reload 2026 vor. 🚦🛡️ #BTC #ETH #bnb
• $BTC 110 K möglich, aber beobachte DXY & Miner-Angebot.
• Wenn die Fed in die Schäumung schneidet, ist es ein Liquiditätsabstoß, nicht ein Boden.
• Rezession ≠ Marktzusammenbruch—Stagflation kann den Bären aufhalten.
Bereite Bargeld, Staatsanleihen und trockenes Pulver für das Reload 2026 vor. 🚦🛡️ #BTC #ETH #bnb
$SAHARA Durchbruch kommt ALLZEIT-HOCH, konzentrieren Sie sich nur auf den Goldmarkt, der #btc öffnet. Und der gesamte Kryptowährungsmarkt ist bullish, warten Sie einfach noch 6 Stunden.
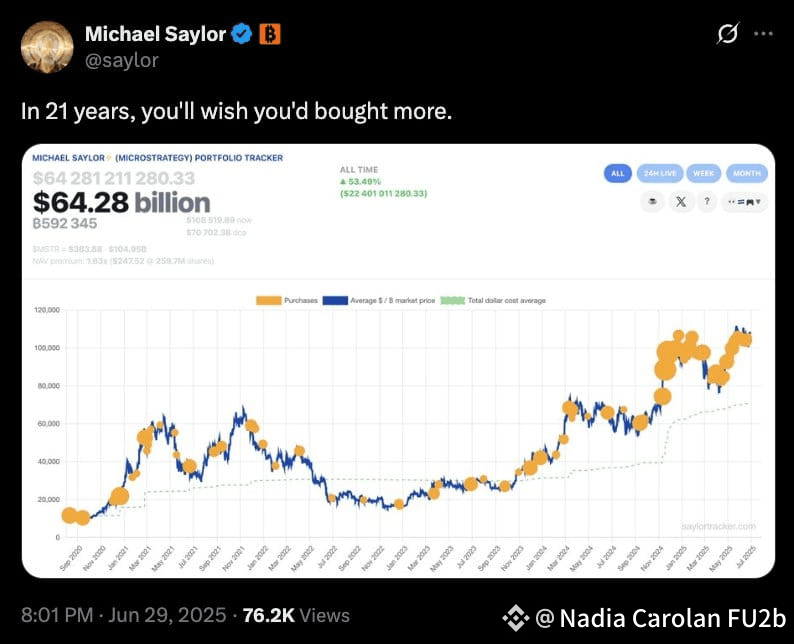
Die erste Kerze seit etwa fünf Tagen, die anscheinend die Absicht hat, Liquidität auf der Oberseite zu erfassen.
Aber ignoriere nicht die Tatsache, dass die großen Märkte geschlossen sind, da es Sonntag ist, und all dies könnte retraced werden, also, es sei denn, du hast eine klare Meinung zum Chart, während du im Hinterkopf behältst, dass es das Wochenende ist, würde ich vorschlagen, an der Seitenlinie zu bleiben.
#Crytpo #StrategyBTCPurchase #trading
Aber ignoriere nicht die Tatsache, dass die großen Märkte geschlossen sind, da es Sonntag ist, und all dies könnte retraced werden, also, es sei denn, du hast eine klare Meinung zum Chart, während du im Hinterkopf behältst, dass es das Wochenende ist, würde ich vorschlagen, an der Seitenlinie zu bleiben.
#Crytpo #StrategyBTCPurchase #trading
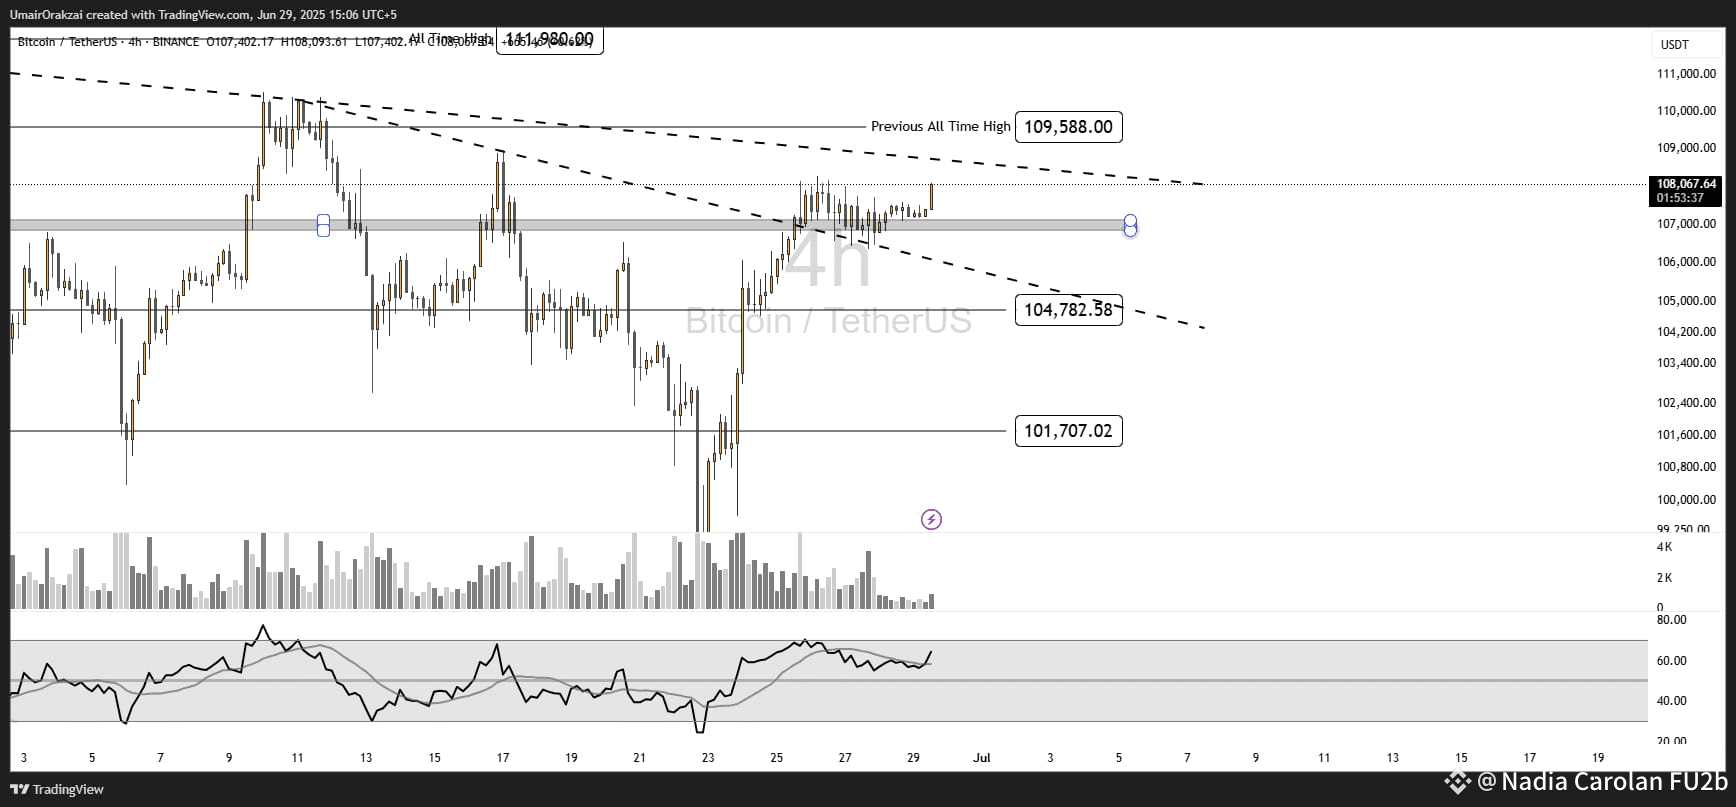
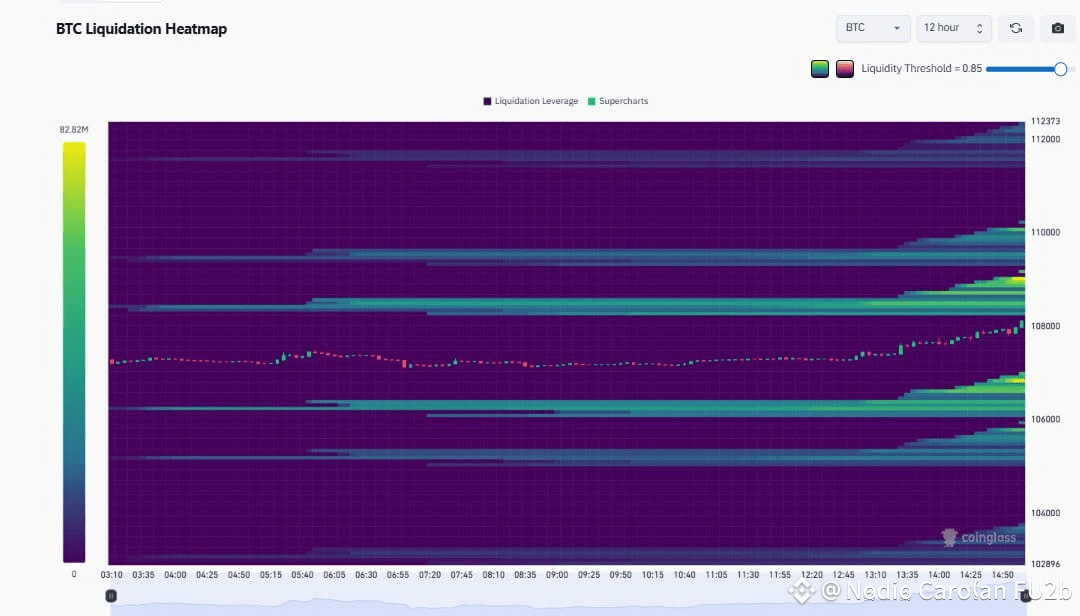
#StrategyBTCPurchase Die Liquidationsdaten deuten darauf hin, dass es bei etwa 108,4k über 300 Millionen Dollar an Short-Positionen gibt.
Wenn dieser Bereich umgedreht wird und nicht mit Gegenaufträgen konfrontiert wird, könnte der Preis nach dem Antippen dieses Bereichs einen starken Anstieg erfahren.
Bleib jedoch resilient.
Wenn dieser Bereich umgedreht wird und nicht mit Gegenaufträgen konfrontiert wird, könnte der Preis nach dem Antippen dieses Bereichs einen starken Anstieg erfahren.
Bleib jedoch resilient.
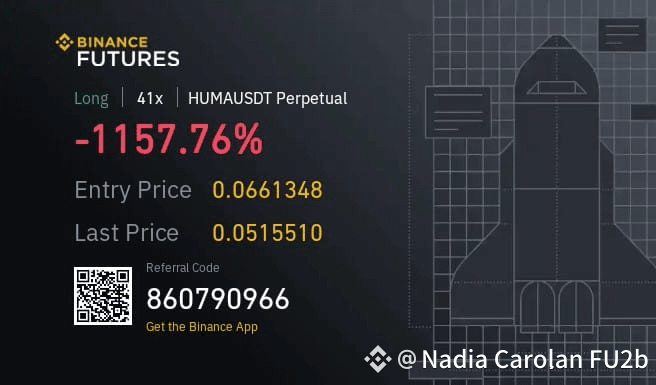
$HUMA yai bc Münze jab Sy Liste Howa ha Sirf nach unten hi ja Raha sala bc...mira dimag kharab kardia buht wait kia upar Jany k Lea laikn jata hi NH sala
Coinbase entfernt

riddickt
·
--
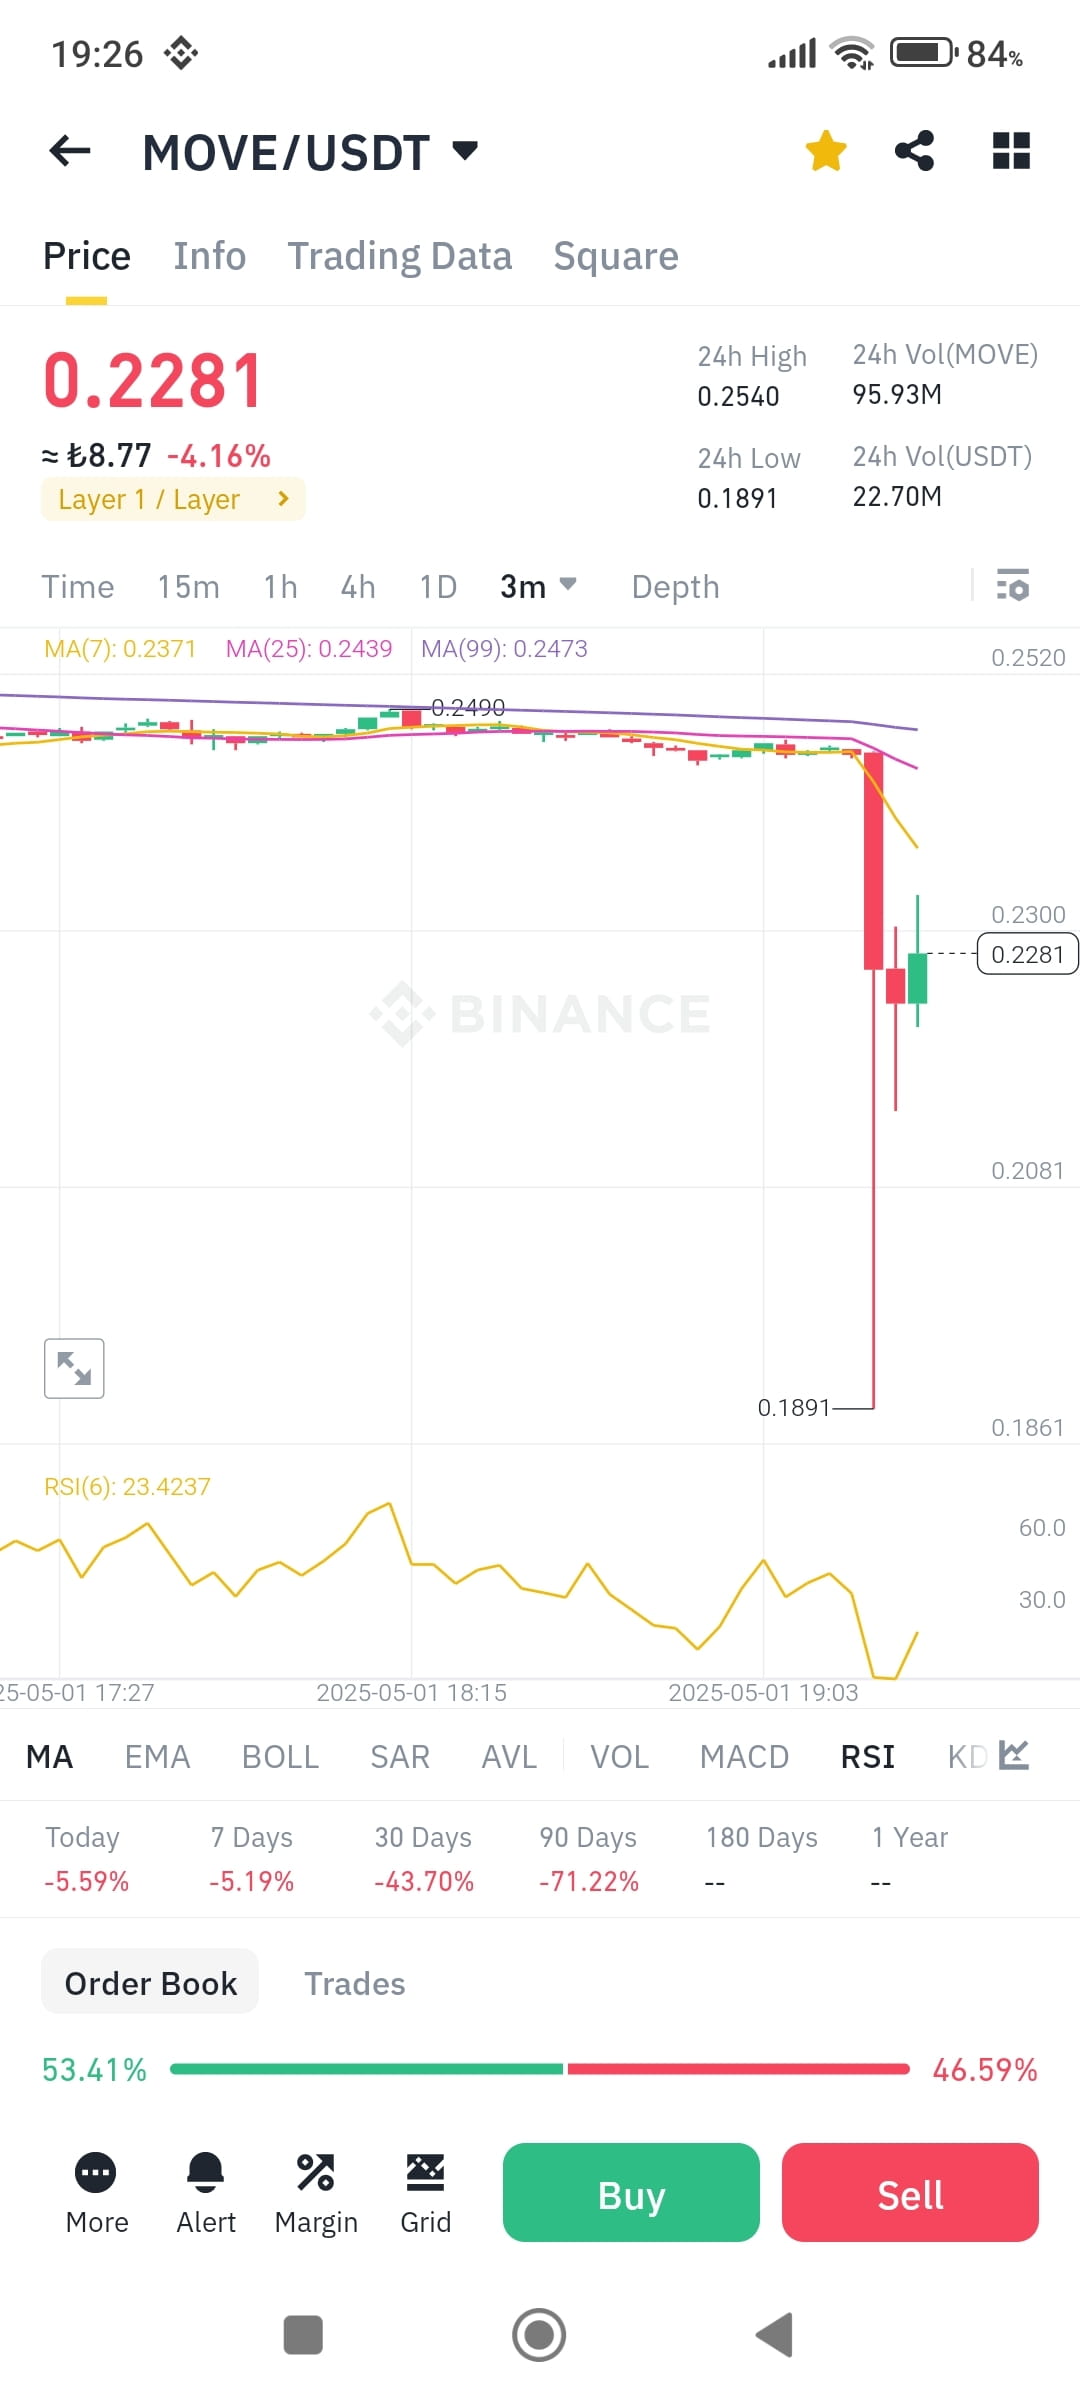
$MOVE wird aus dem Handel genommen?
Anmelden und weiter Inhalte entdecken