
eiyuu
29 Beiträge

eiyuu
Melden
Nutzer blockieren
Crypto, markets & macro — explained in plain English. Daily moves, decoded. X: @Sugar0971. Not financial advice.
Trade eröffnen

NEAR Halter
Regelmäßiger Trader
3.8 Jahre
92 Following
65 Follower
26 Like gegeben
Beiträge
Portfolio
·
--
$SKYAI $BTC
+41 % an einem Tag – und es gibt keine Ankündigung als Auslöser. Hier erfährst du, was tatsächlich dahintersteckt.
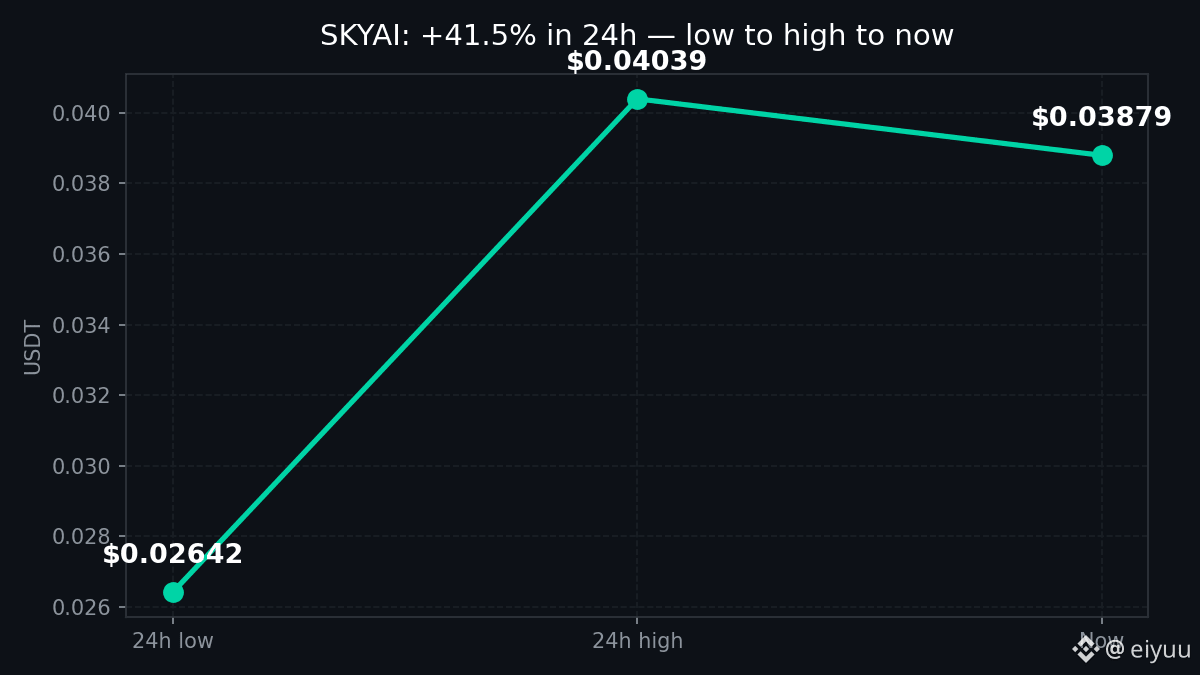
$SKYAI schoss heute von einem Tief bei 0,0264 $ auf ein Hoch bei 0,0404 $, liegt jetzt bei etwa 0,0388 $ und verzeichnete ein Perp-Volumen von 76,8 Mio. $. Das passierte, während $BTC sich noch erholte – eine Bewegung dieser einzelnen Coin, kein Anstieg des Gesamtmarkts.
Warum also? Drei Gründe, alle mechanischer Natur:
1. Von Perps angeheizter Short Squeeze. Das Open Interest sprang um etwa 58 %, nachdem der Kurs die Marke von 0,035 $ durchbrochen hatte. Erst nach dem Ausbruch kam Hebel hinzu, nicht davor. Beim 09:15-UTC-Candle schnellte das Volumen auf das 78-Fache des Normalwerts. Das ist Momentum, das weiterem Momentum hinterherjagt.
2. Dünnes Orderbuch. Bei einem so kleinen Orderbuch können ein paar Millionen an Perp-Volumen den Kurs um mehr als 20 % bewegen. Die Bewegung ist real, aber der Treibstoff ist Hebel, nicht Spot-Käufe.
3. Der Tag-Effekt. Sobald der Token die Liste der Tagesgewinner anführte, wurde er in jedem Feed und Trading-Call-Kanal verstärkt. Die sozialen Medien folgten dem Candle – sie haben ihn nicht ausgelöst.
Worum es geht: SkyAI entwickelt Datentools für KI-Agenten auf der BNB Chain (MCP Hub, Datenmarktplatz). Die KI- und Meme-Erzählung gibt Tradern eine Story, die sie weitererzählen können. Doch es gibt keinen bestätigten Katalysator – weder ein Listing noch eine Partnerschaft oder ein Upgrade –, der den heutigen Anstieg erklärt. Und verwechsle das nicht mit den Nasdaq-SKYA-Schlagzeilen; das ist ein völlig anderer Vermögenswert.
Marken: Hält die Marke von 0,035 $, beginnen Long-Positionen liquidiert zu werden. Ein Durchbruch über 0,039–0,040 $ eröffnet den Weg zu 0,043–0,044 $. Die Funding-Rate liegt mit etwa 0,012 % pro 4 Stunden noch niedrig – die Positionierung ist überfüllt, aber noch nicht euphorisch.
Ist das Treibstoff oder eine Zeitbombe?
Keine Finanzberatung.
#SKYAI #AI #BNB #Altcoins #Krypto
$SKYAI $BTC
+41 % an einem Tag – und es gibt keine Ankündigung als Auslöser. Hier erfährst du, was tatsächlich dahintersteckt.
$SKYAI schoss heute von einem Tief bei 0,0264 $ auf ein Hoch bei 0,0404 $, liegt jetzt bei etwa 0,0388 $ und verzeichnete ein Perp-Volumen von 76,8 Mio. $. Das passierte, während $BTC sich noch erholte – eine Bewegung dieser einzelnen Coin, kein Anstieg des Gesamtmarkts.
Warum also? Drei Gründe, alle mechanischer Natur:
1. Von Perps angeheizter Short Squeeze. Das Open Interest sprang um etwa 58 %, nachdem der Kurs die Marke von 0,035 $ durchbrochen hatte. Erst nach dem Ausbruch kam Hebel hinzu, nicht davor. Beim 09:15-UTC-Candle schnellte das Volumen auf das 78-Fache des Normalwerts. Das ist Momentum, das weiterem Momentum hinterherjagt.
2. Dünnes Orderbuch. Bei einem so kleinen Orderbuch können ein paar Millionen an Perp-Volumen den Kurs um mehr als 20 % bewegen. Die Bewegung ist real, aber der Treibstoff ist Hebel, nicht Spot-Käufe.
3. Der Tag-Effekt. Sobald der Token die Liste der Tagesgewinner anführte, wurde er in jedem Feed und Trading-Call-Kanal verstärkt. Die sozialen Medien folgten dem Candle – sie haben ihn nicht ausgelöst.
Worum es geht: SkyAI entwickelt Datentools für KI-Agenten auf der BNB Chain (MCP Hub, Datenmarktplatz). Die KI- und Meme-Erzählung gibt Tradern eine Story, die sie weitererzählen können. Doch es gibt keinen bestätigten Katalysator – weder ein Listing noch eine Partnerschaft oder ein Upgrade –, der den heutigen Anstieg erklärt. Und verwechsle das nicht mit den Nasdaq-SKYA-Schlagzeilen; das ist ein völlig anderer Vermögenswert.
Marken: Hält die Marke von 0,035 $, beginnen Long-Positionen liquidiert zu werden. Ein Durchbruch über 0,039–0,040 $ eröffnet den Weg zu 0,043–0,044 $. Die Funding-Rate liegt mit etwa 0,012 % pro 4 Stunden noch niedrig – die Positionierung ist überfüllt, aber noch nicht euphorisch.
Ist das Treibstoff oder eine Zeitbombe?
Keine Finanzberatung.
#SKYAI #AI #BNB #Altcoins #Krypto
+41 % an einem Tag – und es gibt keine Ankündigung als Auslöser. Hier erfährst du, was tatsächlich dahintersteckt.
$SKYAI schoss heute von einem Tief bei 0,0264 $ auf ein Hoch bei 0,0404 $, liegt jetzt bei etwa 0,0388 $ und verzeichnete ein Perp-Volumen von 76,8 Mio. $. Das passierte, während $BTC sich noch erholte – eine Bewegung dieser einzelnen Coin, kein Anstieg des Gesamtmarkts.
Warum also? Drei Gründe, alle mechanischer Natur:
1. Von Perps angeheizter Short Squeeze. Das Open Interest sprang um etwa 58 %, nachdem der Kurs die Marke von 0,035 $ durchbrochen hatte. Erst nach dem Ausbruch kam Hebel hinzu, nicht davor. Beim 09:15-UTC-Candle schnellte das Volumen auf das 78-Fache des Normalwerts. Das ist Momentum, das weiterem Momentum hinterherjagt.
2. Dünnes Orderbuch. Bei einem so kleinen Orderbuch können ein paar Millionen an Perp-Volumen den Kurs um mehr als 20 % bewegen. Die Bewegung ist real, aber der Treibstoff ist Hebel, nicht Spot-Käufe.
3. Der Tag-Effekt. Sobald der Token die Liste der Tagesgewinner anführte, wurde er in jedem Feed und Trading-Call-Kanal verstärkt. Die sozialen Medien folgten dem Candle – sie haben ihn nicht ausgelöst.
Worum es geht: SkyAI entwickelt Datentools für KI-Agenten auf der BNB Chain (MCP Hub, Datenmarktplatz). Die KI- und Meme-Erzählung gibt Tradern eine Story, die sie weitererzählen können. Doch es gibt keinen bestätigten Katalysator – weder ein Listing noch eine Partnerschaft oder ein Upgrade –, der den heutigen Anstieg erklärt. Und verwechsle das nicht mit den Nasdaq-SKYA-Schlagzeilen; das ist ein völlig anderer Vermögenswert.
Marken: Hält die Marke von 0,035 $, beginnen Long-Positionen liquidiert zu werden. Ein Durchbruch über 0,039–0,040 $ eröffnet den Weg zu 0,043–0,044 $. Die Funding-Rate liegt mit etwa 0,012 % pro 4 Stunden noch niedrig – die Positionierung ist überfüllt, aber noch nicht euphorisch.
Ist das Treibstoff oder eine Zeitbombe?
Keine Finanzberatung.
#SKYAI #AI #BNB #Altcoins #Krypto
1
216
·
--
Übersetzung ansehen
$ETH $BNB — Bitcoin just staged one of the wildest rebounds of the year.
BTC crashed to ~$55,100 overnight — its lowest since September 2024 — then bounced 8%+ to reclaim $60,000. It is now trading ~$60,200, up 2.2% in 24h.
$ETH is leading the bounce at ~$1,685 (+3.8%), after dipping to ~$1,540. $BNB is holding ~$549 (+1.7%).
What drove it:
1. A brutal leverage flush — ~$2.4B in futures positions liquidated in 24h (CoinGlass), mostly longs. Once the forced selling cleared, buyers stepped in fast.
2. The selloff started in US stocks, not crypto: AI valuations cracked, Nvidia fell ~23% on the week, Nasdaq had its worst week since March 2020, and spot BTC ETFs saw $582M of outflows on Thursday. Fear & Greed is at 11 — extreme fear.
What to watch today: can BTC hold $60,000 into the Asia open? $55,000 is now the line in the sand below, $62,000 the first real resistance above. ETF flows on Monday will tell us if institutions are buying this dip or still selling.
Is this the bottom, or just a dead-cat bounce before another leg down?
Not financial advice.
#Bitcoin #Ethereum #BNB #Crypto #CryptoMarket
$ETH $BNB — Bitcoin just staged one of the wildest rebounds of the year.
BTC crashed to ~$55,100 overnight — its lowest since September 2024 — then bounced 8%+ to reclaim $60,000. It is now trading ~$60,200, up 2.2% in 24h.
$ETH is leading the bounce at ~$1,685 (+3.8%), after dipping to ~$1,540. $BNB is holding ~$549 (+1.7%).
What drove it:
1. A brutal leverage flush — ~$2.4B in futures positions liquidated in 24h (CoinGlass), mostly longs. Once the forced selling cleared, buyers stepped in fast.
2. The selloff started in US stocks, not crypto: AI valuations cracked, Nvidia fell ~23% on the week, Nasdaq had its worst week since March 2020, and spot BTC ETFs saw $582M of outflows on Thursday. Fear & Greed is at 11 — extreme fear.
What to watch today: can BTC hold $60,000 into the Asia open? $55,000 is now the line in the sand below, $62,000 the first real resistance above. ETF flows on Monday will tell us if institutions are buying this dip or still selling.
Is this the bottom, or just a dead-cat bounce before another leg down?
Not financial advice.
#Bitcoin #Ethereum #BNB #Crypto #CryptoMarket
BTC crashed to ~$55,100 overnight — its lowest since September 2024 — then bounced 8%+ to reclaim $60,000. It is now trading ~$60,200, up 2.2% in 24h.
$ETH is leading the bounce at ~$1,685 (+3.8%), after dipping to ~$1,540. $BNB is holding ~$549 (+1.7%).
What drove it:
1. A brutal leverage flush — ~$2.4B in futures positions liquidated in 24h (CoinGlass), mostly longs. Once the forced selling cleared, buyers stepped in fast.
2. The selloff started in US stocks, not crypto: AI valuations cracked, Nvidia fell ~23% on the week, Nasdaq had its worst week since March 2020, and spot BTC ETFs saw $582M of outflows on Thursday. Fear & Greed is at 11 — extreme fear.
What to watch today: can BTC hold $60,000 into the Asia open? $55,000 is now the line in the sand below, $62,000 the first real resistance above. ETF flows on Monday will tell us if institutions are buying this dip or still selling.
Is this the bottom, or just a dead-cat bounce before another leg down?
Not financial advice.
#Bitcoin #Ethereum #BNB #Crypto #CryptoMarket
1
127
·
--
Artikel
Übersetzung ansehen
$BTC just crashed below $56,000 — its lowest price since September 2024.$BTC just crashed below $56,000 — its lowest price since September 2024.
And this time, it's not just crypto. The entire global risk trade is unwinding at once.
Here's what's actually happening, in plain English. 👇
THE DAMAGE SO FAR
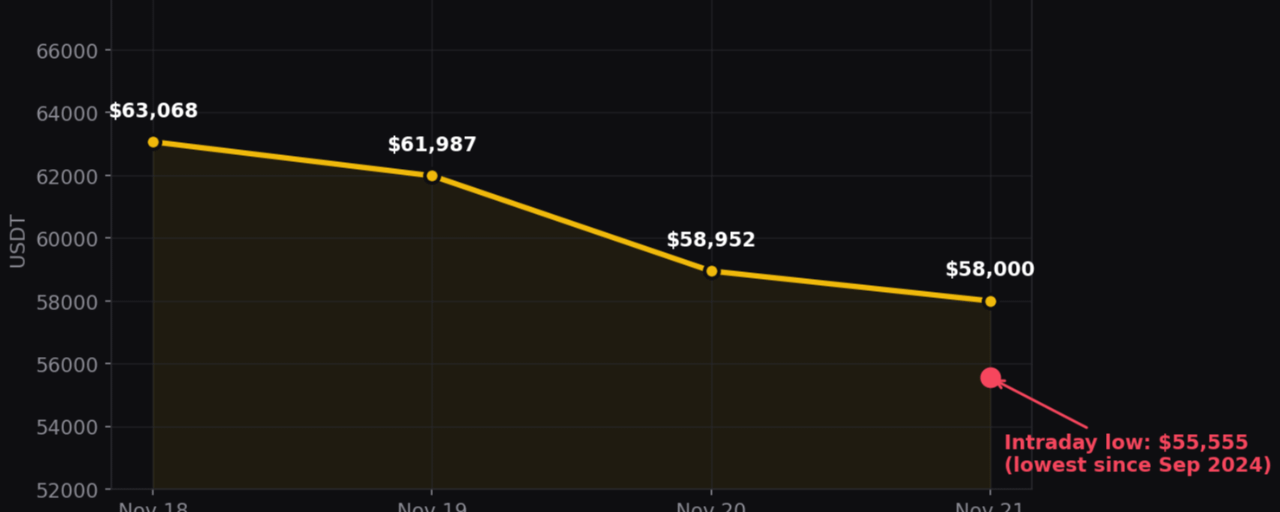
Bitcoin fell to ~$55,500 intraday on Saturday before bouncing toward $58,000. That's -14% in a week and roughly -30% in a month.
It's not alone:
• $ETH ~$1,640 (-6% in 24h)
• $BNB ~$525 (-8%)
• $XRP ~$0.89
• Total crypto market cap: ~$2 trillion, down ~5% in a day
• Fear & Greed Index: single digits. Extreme fear.
Bitcoin is down 28% this quarter alone, after peaking above $126,000 in October.
So what broke?
5 FORCES HITTING AT ONCE
1. The Fed turned hawkish again
October CPI came in hot at +0.4% month-on-month. Fed Governor Waller is now arguing for a half-point rate hike in December, warning a smaller move would damage the Fed's credibility. Markets now price a December hike as near-certainty. Decision day: December 9.
Higher rates are poison for assets that pay no yield. That's Bitcoin.
2. The AI trade is unwinding
The Nasdaq wiped out its entire 2026 gain this week. Nvidia fell 23% in a week — its worst since 2008 — down to $135. The Dow dropped 1,000 points in a day. Wall Street lost roughly $7 trillion in market value this week.
When stocks de-risk this hard, crypto doesn't get to sit it out.
3. The ETFs flipped to sellers
The spot Bitcoin ETFs that drove two years of buying have turned into sellers. Another $152.7M flowed out in the latest session. BlackRock's IBIT saw a record $541.1M single-day outflow on November 19. Year-to-date ETF outflows now exceed $3 billion.
4. $2.4 billion in liquidations
In 24 hours, $2.4B+ of leveraged positions were wiped out — 90% of them longs. Bitcoin futures alone: over $1B. Ether: $545M. The single largest liquidation was a $51.7M Bitcoin long.
Forced selling feeds forced selling. That's how a dip becomes a crash.
5. The overhang nobody wants to talk about
The $6.34B Binance hack on October 29 — the largest crypto theft on record — is still hanging over sentiment. Add a stronger dollar, the yen near 159.6 with a Bank of Japan hike expected in December (threatening the cheap yen funding behind leveraged trades), and a US midterm result that has markets doubting friendlier crypto rules.
BULL CASE vs BEAR CASE
Bull case: extreme fear plus forced selling is historically where local bottoms form. If the Fed surprises dovish on December 9, risk snaps back fast. The bounce from $55.5K to $58K already shows buyers stepping in.
Bear case: if the Fed hikes AND the Bank of Japan follows, the deleveraging has further to run. $55K is the line to watch — below it, the next cluster of stops sits waiting.
WHAT I'M WATCHING NEXT
• December 9 — Fed decision
• Bank of Japan meeting, later in December
• MSCI index changes at the end of November
• ETF flows — do outflows slow, or accelerate?
One more thing: this is the first real test of the "Bitcoin as a hedge" story in a while — and so far, it's failing it. When inflation worries rose, Bitcoin fell anyway.
What do you think — is this the bottom, or just the first leg down? 👇
$BTC $ETH $BNB
#Bitcoin #Crypto #Macro #BinanceSquare
Not financial advice. Just explaining what's moving the market.
$BTC just crashed below $56,000 — its lowest price since September 2024.
$BTC just crashed below $56,000 — its lowest price since September 2024.
And this time, it's not just crypto. The entire global risk trade is unwinding at once.
Here's what's actually happening, in plain English. 👇
THE DAMAGE SO FAR
Bitcoin fell to ~$55,500 intraday on Saturday before bouncing toward $58,000. That's -14% in a week and roughly -30% in a month.
It's not alone:
• $ETH ~$1,640 (-6% in 24h)
• $BNB ~$525 (-8%)
• $XRP ~$0.89
• Total crypto market cap: ~$2 trillion, down ~5% in a day
• Fear & Greed Index: single digits. Extreme fear.
Bitcoin is down 28% this quarter alone, after peaking above $126,000 in October.
So what broke?
5 FORCES HITTING AT ONCE
1. The Fed turned hawkish again
October CPI came in hot at +0.4% month-on-month. Fed Governor Waller is now arguing for a half-point rate hike in December, warning a smaller move would damage the Fed's credibility. Markets now price a December hike as near-certainty. Decision day: December 9.
Higher rates are poison for assets that pay no yield. That's Bitcoin.
2. The AI trade is unwinding
The Nasdaq wiped out its entire 2026 gain this week. Nvidia fell 23% in a week — its worst since 2008 — down to $135. The Dow dropped 1,000 points in a day. Wall Street lost roughly $7 trillion in market value this week.
When stocks de-risk this hard, crypto doesn't get to sit it out.
3. The ETFs flipped to sellers
The spot Bitcoin ETFs that drove two years of buying have turned into sellers. Another $152.7M flowed out in the latest session. BlackRock's IBIT saw a record $541.1M single-day outflow on November 19. Year-to-date ETF outflows now exceed $3 billion.
4. $2.4 billion in liquidations
In 24 hours, $2.4B+ of leveraged positions were wiped out — 90% of them longs. Bitcoin futures alone: over $1B. Ether: $545M. The single largest liquidation was a $51.7M Bitcoin long.
Forced selling feeds forced selling. That's how a dip becomes a crash.
5. The overhang nobody wants to talk about
The $6.34B Binance hack on October 29 — the largest crypto theft on record — is still hanging over sentiment. Add a stronger dollar, the yen near 159.6 with a Bank of Japan hike expected in December (threatening the cheap yen funding behind leveraged trades), and a US midterm result that has markets doubting friendlier crypto rules.
BULL CASE vs BEAR CASE
Bull case: extreme fear plus forced selling is historically where local bottoms form. If the Fed surprises dovish on December 9, risk snaps back fast. The bounce from $55.5K to $58K already shows buyers stepping in.
Bear case: if the Fed hikes AND the Bank of Japan follows, the deleveraging has further to run. $55K is the line to watch — below it, the next cluster of stops sits waiting.
WHAT I'M WATCHING NEXT
• December 9 — Fed decision
• Bank of Japan meeting, later in December
• MSCI index changes at the end of November
• ETF flows — do outflows slow, or accelerate?
One more thing: this is the first real test of the "Bitcoin as a hedge" story in a while — and so far, it's failing it. When inflation worries rose, Bitcoin fell anyway.
What do you think — is this the bottom, or just the first leg down? 👇
$BTC $ETH $BNB
#Bitcoin #Crypto #Macro #BinanceSquare
Not financial advice. Just explaining what's moving the market.
And this time, it's not just crypto. The entire global risk trade is unwinding at once.
Here's what's actually happening, in plain English. 👇
THE DAMAGE SO FAR
Bitcoin fell to ~$55,500 intraday on Saturday before bouncing toward $58,000. That's -14% in a week and roughly -30% in a month.
It's not alone:
• $ETH ~$1,640 (-6% in 24h)
• $BNB ~$525 (-8%)
• $XRP ~$0.89
• Total crypto market cap: ~$2 trillion, down ~5% in a day
• Fear & Greed Index: single digits. Extreme fear.
Bitcoin is down 28% this quarter alone, after peaking above $126,000 in October.
So what broke?
5 FORCES HITTING AT ONCE
1. The Fed turned hawkish again
October CPI came in hot at +0.4% month-on-month. Fed Governor Waller is now arguing for a half-point rate hike in December, warning a smaller move would damage the Fed's credibility. Markets now price a December hike as near-certainty. Decision day: December 9.
Higher rates are poison for assets that pay no yield. That's Bitcoin.
2. The AI trade is unwinding
The Nasdaq wiped out its entire 2026 gain this week. Nvidia fell 23% in a week — its worst since 2008 — down to $135. The Dow dropped 1,000 points in a day. Wall Street lost roughly $7 trillion in market value this week.
When stocks de-risk this hard, crypto doesn't get to sit it out.
3. The ETFs flipped to sellers
The spot Bitcoin ETFs that drove two years of buying have turned into sellers. Another $152.7M flowed out in the latest session. BlackRock's IBIT saw a record $541.1M single-day outflow on November 19. Year-to-date ETF outflows now exceed $3 billion.
4. $2.4 billion in liquidations
In 24 hours, $2.4B+ of leveraged positions were wiped out — 90% of them longs. Bitcoin futures alone: over $1B. Ether: $545M. The single largest liquidation was a $51.7M Bitcoin long.
Forced selling feeds forced selling. That's how a dip becomes a crash.
5. The overhang nobody wants to talk about
The $6.34B Binance hack on October 29 — the largest crypto theft on record — is still hanging over sentiment. Add a stronger dollar, the yen near 159.6 with a Bank of Japan hike expected in December (threatening the cheap yen funding behind leveraged trades), and a US midterm result that has markets doubting friendlier crypto rules.
BULL CASE vs BEAR CASE
Bull case: extreme fear plus forced selling is historically where local bottoms form. If the Fed surprises dovish on December 9, risk snaps back fast. The bounce from $55.5K to $58K already shows buyers stepping in.
Bear case: if the Fed hikes AND the Bank of Japan follows, the deleveraging has further to run. $55K is the line to watch — below it, the next cluster of stops sits waiting.
WHAT I'M WATCHING NEXT
• December 9 — Fed decision
• Bank of Japan meeting, later in December
• MSCI index changes at the end of November
• ETF flows — do outflows slow, or accelerate?
One more thing: this is the first real test of the "Bitcoin as a hedge" story in a while — and so far, it's failing it. When inflation worries rose, Bitcoin fell anyway.
What do you think — is this the bottom, or just the first leg down? 👇
$BTC $ETH $BNB
#Bitcoin #Crypto #Macro #BinanceSquare
Not financial advice. Just explaining what's moving the market.
1
176
·
--
Übersetzung ansehen
chào buổi sáng aeDự đoán xem hôm nay $near lên 5.5 được không nào
$NEAR
chào buổi sáng ae
Dự đoán xem hôm nay $near lên 5.5 được không nào
$NEAR
$NEAR
1
256
Anmelden und weiter Inhalte entdecken
Krypto-Nutzer weltweit auf Binance Square kennenlernen
⚡️ Bleib in Sachen Krypto stets am Puls.
💬 Die weltgrößte Kryptobörse vertraut darauf.
👍 Erhalte verlässliche Einblicke von verifizierten Creators.
E-Mail-Adresse/Telefonnummer
Trendthemen
BTCReboundsAbove$60KAmidWhaleDipBuying
3,848 Aufrufe
43 Kommentare
Abraxas Capital und andere Großanleger kaufen den BTC-Kursrückgang, während Bitcoin kurzzeitig wieder 60.000 US-Dollar erreicht
Binance News
·12 Likes
·11.1k Aufrufe
NvidiaLoses$2.7TrillionInMonthAndAHalf
42,024 Aufrufe
201 Kommentare
GlobalStocksFaceLongestLosingStreakSince2023
388,631 Aufrufe
2,549 Kommentare