

Nasim Sultani
18 Beiträge

Nasim Sultani
Melden
Nutzer blockieren
Trade eröffnen
Gelegenheitstrader
2.2 Jahre
62 Following
48 Follower
51 Like gegeben
Beiträge
Portfolio
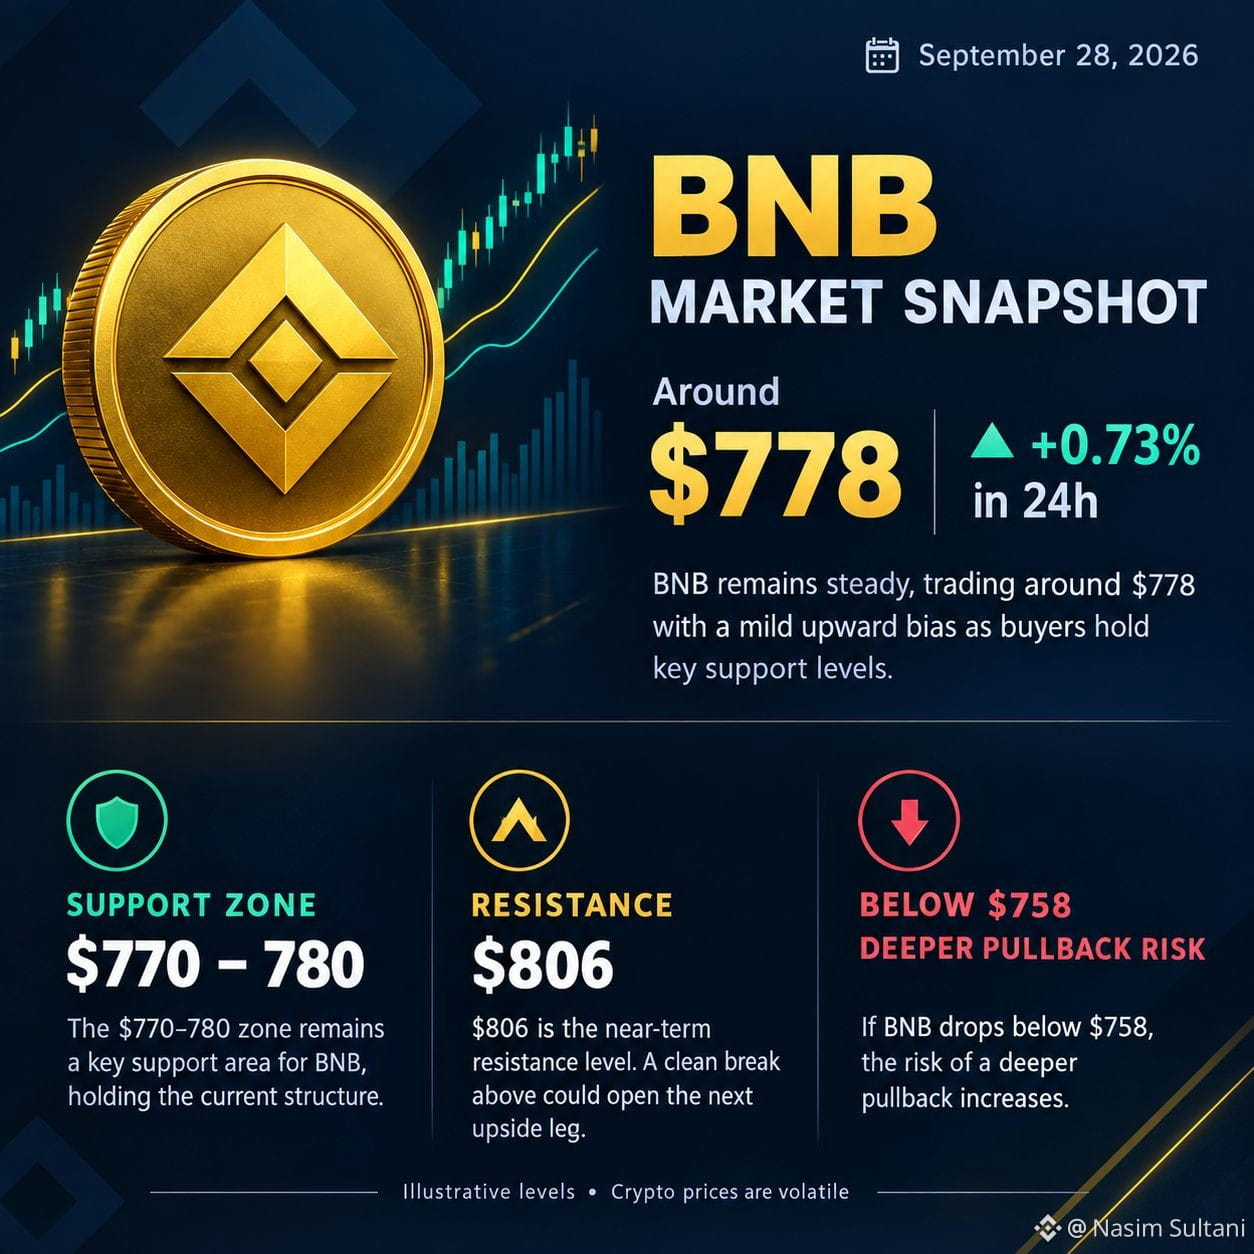
📊 #BNB Neueste Marktanalyse
#BNB : ~$772
Neueste veröffentlichte Marktschau; die Preise schwanken.
Markttrend: In der kurzen Frist neutral bis leicht bärisch.
Unterstützung: $770 – $760
Widerstand: $785 – $806
Bullishes Szenario: Ein anhaltender Ausbruch über $806 könnte den Aufwärtsimpuls verstärken.
Bärisches Szenario: Ein Bruch unter $758 könnte den Abwärtsdruck erhöhen.
Zusammenfassung: BNB zeigt kurzfristige Volatilität. Beobachte, ob Käufer den Bereich um $770 verteidigen. Krypto-Preise können sich schnell ändern, daher sind diese Niveaus nicht garantiert.
Quelle: BitgetCEO bestätigt$388MGestohlen bei Hack$NVDAB BTC fällt unter $83000
📊 #BNB Neueste Marktanalyse
#BNB : ~$772
Neueste veröffentlichte Marktschau; die Preise schwanken.
Markttrend: In der kurzen Frist neutral bis leicht bärisch.
Unterstützung: $770 – $760
Widerstand: $785 – $806
Bullishes Szenario: Ein anhaltender Ausbruch über $806 könnte den Aufwärtsimpuls verstärken.
Bärisches Szenario: Ein Bruch unter $758 könnte den Abwärtsdruck erhöhen.
Zusammenfassung: BNB zeigt kurzfristige Volatilität. Beobachte, ob Käufer den Bereich um $770 verteidigen. Krypto-Preise können sich schnell ändern, daher sind diese Niveaus nicht garantiert.
Quelle: BitgetCEO bestätigt$388MGestohlen bei Hack$NVDAB BTC fällt unter $83000
#BNB : ~$772
Neueste veröffentlichte Marktschau; die Preise schwanken.
Markttrend: In der kurzen Frist neutral bis leicht bärisch.
Unterstützung: $770 – $760
Widerstand: $785 – $806
Bullishes Szenario: Ein anhaltender Ausbruch über $806 könnte den Aufwärtsimpuls verstärken.
Bärisches Szenario: Ein Bruch unter $758 könnte den Abwärtsdruck erhöhen.
Zusammenfassung: BNB zeigt kurzfristige Volatilität. Beobachte, ob Käufer den Bereich um $770 verteidigen. Krypto-Preise können sich schnell ändern, daher sind diese Niveaus nicht garantiert.
Quelle: BitgetCEO bestätigt$388MGestohlen bei Hack$NVDAB BTC fällt unter $83000
57
Übersetzung ansehen
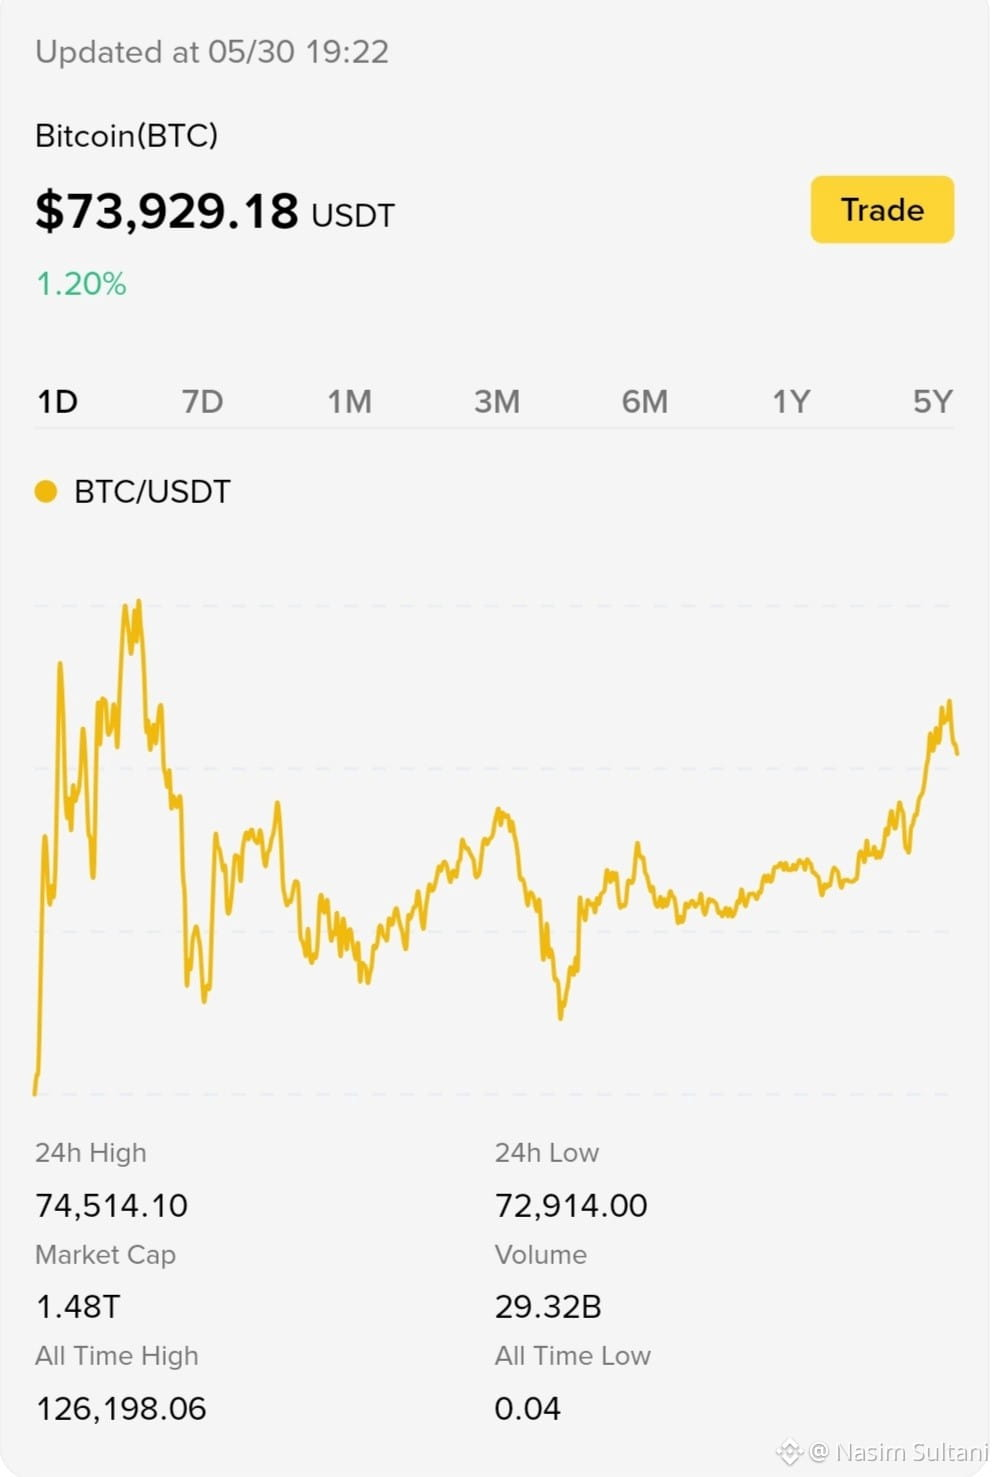
#BTC market update (BTC/USDT) — as of 2026-05-30 14:52 UTC
Current price: $73,929.18
24h change: +1.16% (24h open $73,084.00)
24h range: $72,914.00 → $74,514.10
24h volume: 14,403.70 BTC (≈ $1.06B USDT)
What do you want next?
Set a #BTC price alert (e.g., above $75,000 or below $72,500)
Quick update for ETH/BNB/SOL too
Place a spot buy/sell on BTC
$BTC $ETH
#BTC market update (BTC/USDT) — as of 2026-05-30 14:52 UTC
Current price: $73,929.18
24h change: +1.16% (24h open $73,084.00)
24h range: $72,914.00 → $74,514.10
24h volume: 14,403.70 BTC (≈ $1.06B USDT)
What do you want next?
Set a #BTC price alert (e.g., above $75,000 or below $72,500)
Quick update for ETH/BNB/SOL too
Place a spot buy/sell on BTC
$BTC $ETH
Current price: $73,929.18
24h change: +1.16% (24h open $73,084.00)
24h range: $72,914.00 → $74,514.10
24h volume: 14,403.70 BTC (≈ $1.06B USDT)
What do you want next?
Set a #BTC price alert (e.g., above $75,000 or below $72,500)
Quick update for ETH/BNB/SOL too
Place a spot buy/sell on BTC
$BTC $ETH
75
Hier ist eine kurze, aktuelle DASH-(Krypto)-Analyse – technisch, fundamental und im Marktkontext:
Markt & Kursentwicklung
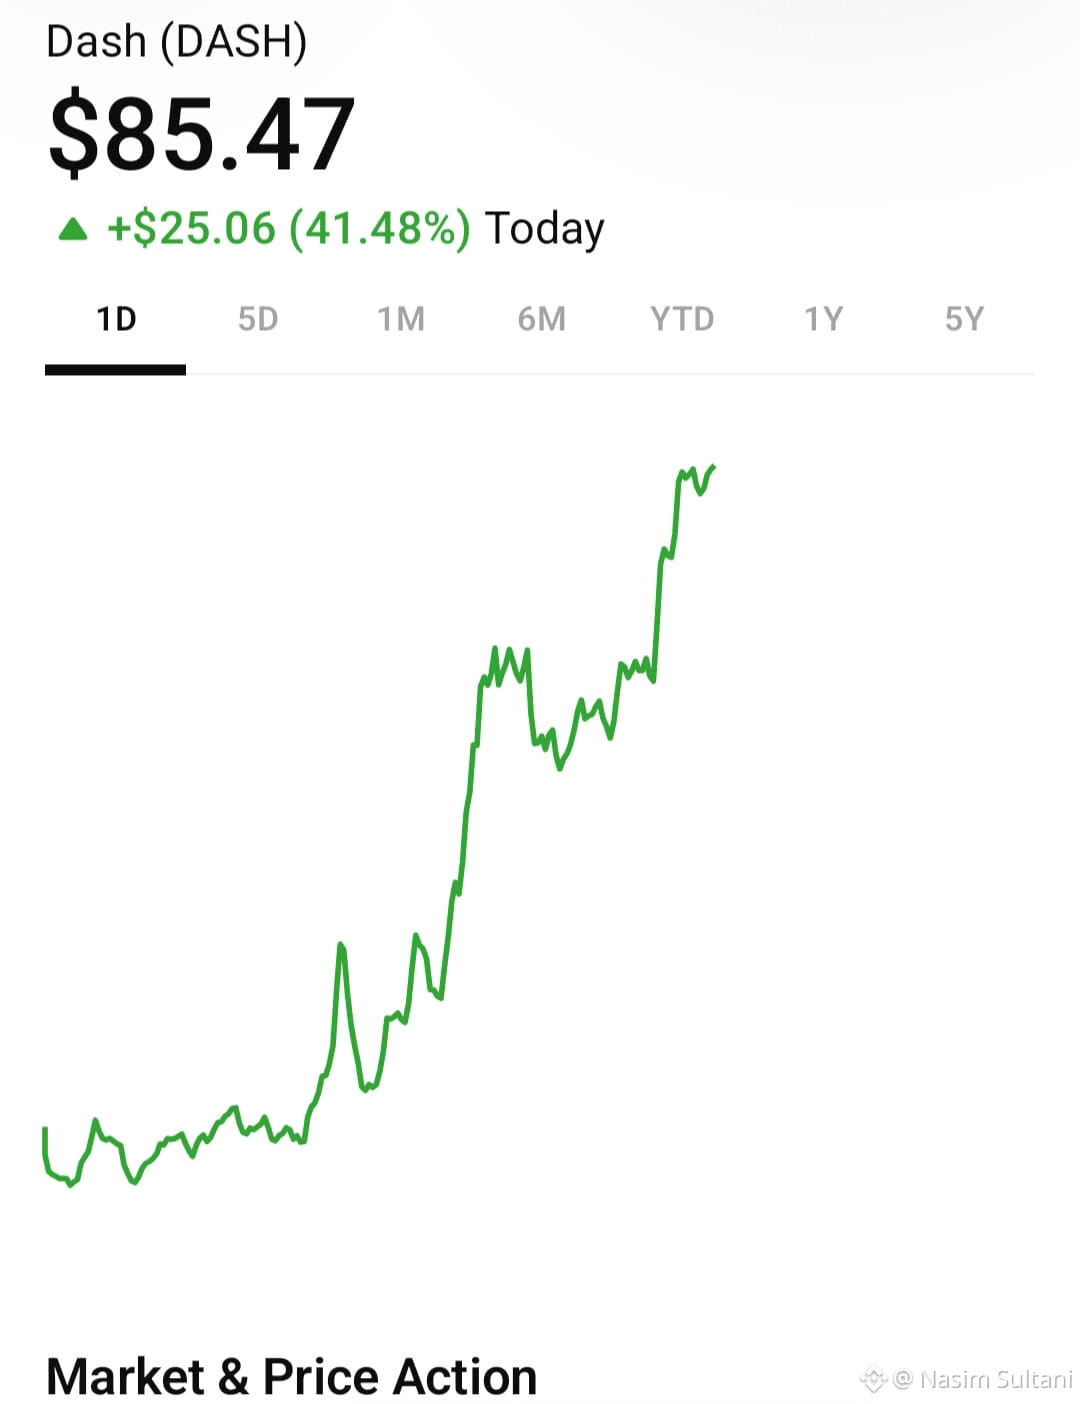
$DASH hat erneut bullische Dynamik gezeigt, mit starken Intraday- und Mehr-Tage-Rallys, da Privatsphäre-Coins bei allgemeiner Krypto-Volatilität wieder stärkeres Interesse von Investoren finden.
Volumen-Sprünge (z. B. etwa 900 % Zunahme) deuten auf liquide-getriebene Bewegungen hin, nicht auf isolierte Kursbewegungen.
Schlüsselniveaus: Ein Durchbrechen und Halten über ehemaligen Widerstand nahe bei 48–50 $ wirkt nun als Unterstützung; die Wiedereroberung von 68–70 $+ würde den übergeordneten Aufwärtstrend aufrechterhalten.
Technische Signale
Momentum-Indikatoren (wie RSI und EMAs) zeigen bullische Ausrichtung, aber kurzfristig überkaufte Zustände können Rücksetzer oder Konsolidierung auslösen.
Analysten weisen auf Konstellationen hin, die frühere ausgedehnte Rallys aus früheren Zyklen nachahmen könnten, falls Volumen und Trendstruktur anhalten.
Fundamentale Treiber
Die Nachfrage nach Privatsphäre-Assets bleibt eine starke Erzählung, da Händler Alternativen suchen, bedingt durch regulatorische Verschiebungen und Kapitalflucht in diskrete Netzwerke.
Zusammenarbeit mit erweiterten Fiat-Ein- und -Ausgängen (z. B. mit Alchemy Pay) und Plattform-Upgrades (Evolution-Smart-Verträge, Cross-Chain-Funktionen) erhöhen die praktische Nutzung.
On-Chain-Daten deuten auf Walfang und Verschiebung der Versorgung hin, was den kurzfristigen Verkaufsdruck reduzieren kann.
Risiken im Auge behalten
Regulatorische Gegenwind – insbesondere drohende EU- und andere gerichtliche Sanktionen gegen Privatsphäre-Coins – könnten die Zugänglichkeit auf großen Börsen einschränken und die Liquidität mindern.
Überkaufte technische Zustände und Gewinnmitnahme können kurzfristige Rücksetzer auslösen, selbst innerhalb eines größeren Aufwärtstrends.
Ausblick – Zusammenfassung
Bullischer Szenario: Anhaltende Trendstärke, solides Volumen und allgemeine Altcoin-/Risiko-orientierte Stimmung könnten DASH über wichtige Widerstände treiben und höhere Bereiche erreichen, die in langfristigen Prognosen angezeigt wurden.
Bärensches Szenario: Nicht-Halten der Schlüsselunterstützungen oder ungünstige regulatorische Entwicklungen könnten die jüngsten Gewinne rückgängig machen und zu tieferen Korrekturen führen.
*(Keine Finanzberatung – tun Sie Ihre eigene Recherche.)*
$ETH $SOL #BTC100kNext?
Hier ist eine kurze, aktuelle DASH-(Krypto)-Analyse – technisch, fundamental und im Marktkontext:
Markt & Kursentwicklung
$DASH hat erneut bullische Dynamik gezeigt, mit starken Intraday- und Mehr-Tage-Rallys, da Privatsphäre-Coins bei allgemeiner Krypto-Volatilität wieder stärkeres Interesse von Investoren finden.
Volumen-Sprünge (z. B. etwa 900 % Zunahme) deuten auf liquide-getriebene Bewegungen hin, nicht auf isolierte Kursbewegungen.
Schlüsselniveaus: Ein Durchbrechen und Halten über ehemaligen Widerstand nahe bei 48–50 $ wirkt nun als Unterstützung; die Wiedereroberung von 68–70 $+ würde den übergeordneten Aufwärtstrend aufrechterhalten.
Technische Signale
Momentum-Indikatoren (wie RSI und EMAs) zeigen bullische Ausrichtung, aber kurzfristig überkaufte Zustände können Rücksetzer oder Konsolidierung auslösen.
Analysten weisen auf Konstellationen hin, die frühere ausgedehnte Rallys aus früheren Zyklen nachahmen könnten, falls Volumen und Trendstruktur anhalten.
Fundamentale Treiber
Die Nachfrage nach Privatsphäre-Assets bleibt eine starke Erzählung, da Händler Alternativen suchen, bedingt durch regulatorische Verschiebungen und Kapitalflucht in diskrete Netzwerke.
Zusammenarbeit mit erweiterten Fiat-Ein- und -Ausgängen (z. B. mit Alchemy Pay) und Plattform-Upgrades (Evolution-Smart-Verträge, Cross-Chain-Funktionen) erhöhen die praktische Nutzung.
On-Chain-Daten deuten auf Walfang und Verschiebung der Versorgung hin, was den kurzfristigen Verkaufsdruck reduzieren kann.
Risiken im Auge behalten
Regulatorische Gegenwind – insbesondere drohende EU- und andere gerichtliche Sanktionen gegen Privatsphäre-Coins – könnten die Zugänglichkeit auf großen Börsen einschränken und die Liquidität mindern.
Überkaufte technische Zustände und Gewinnmitnahme können kurzfristige Rücksetzer auslösen, selbst innerhalb eines größeren Aufwärtstrends.
Ausblick – Zusammenfassung
Bullischer Szenario: Anhaltende Trendstärke, solides Volumen und allgemeine Altcoin-/Risiko-orientierte Stimmung könnten DASH über wichtige Widerstände treiben und höhere Bereiche erreichen, die in langfristigen Prognosen angezeigt wurden.
Bärensches Szenario: Nicht-Halten der Schlüsselunterstützungen oder ungünstige regulatorische Entwicklungen könnten die jüngsten Gewinne rückgängig machen und zu tieferen Korrekturen führen.
*(Keine Finanzberatung – tun Sie Ihre eigene Recherche.)*
$ETH $SOL #BTC100kNext?
Markt & Kursentwicklung
$DASH hat erneut bullische Dynamik gezeigt, mit starken Intraday- und Mehr-Tage-Rallys, da Privatsphäre-Coins bei allgemeiner Krypto-Volatilität wieder stärkeres Interesse von Investoren finden.
Volumen-Sprünge (z. B. etwa 900 % Zunahme) deuten auf liquide-getriebene Bewegungen hin, nicht auf isolierte Kursbewegungen.
Schlüsselniveaus: Ein Durchbrechen und Halten über ehemaligen Widerstand nahe bei 48–50 $ wirkt nun als Unterstützung; die Wiedereroberung von 68–70 $+ würde den übergeordneten Aufwärtstrend aufrechterhalten.
Technische Signale
Momentum-Indikatoren (wie RSI und EMAs) zeigen bullische Ausrichtung, aber kurzfristig überkaufte Zustände können Rücksetzer oder Konsolidierung auslösen.
Analysten weisen auf Konstellationen hin, die frühere ausgedehnte Rallys aus früheren Zyklen nachahmen könnten, falls Volumen und Trendstruktur anhalten.
Fundamentale Treiber
Die Nachfrage nach Privatsphäre-Assets bleibt eine starke Erzählung, da Händler Alternativen suchen, bedingt durch regulatorische Verschiebungen und Kapitalflucht in diskrete Netzwerke.
Zusammenarbeit mit erweiterten Fiat-Ein- und -Ausgängen (z. B. mit Alchemy Pay) und Plattform-Upgrades (Evolution-Smart-Verträge, Cross-Chain-Funktionen) erhöhen die praktische Nutzung.
On-Chain-Daten deuten auf Walfang und Verschiebung der Versorgung hin, was den kurzfristigen Verkaufsdruck reduzieren kann.
Risiken im Auge behalten
Regulatorische Gegenwind – insbesondere drohende EU- und andere gerichtliche Sanktionen gegen Privatsphäre-Coins – könnten die Zugänglichkeit auf großen Börsen einschränken und die Liquidität mindern.
Überkaufte technische Zustände und Gewinnmitnahme können kurzfristige Rücksetzer auslösen, selbst innerhalb eines größeren Aufwärtstrends.
Ausblick – Zusammenfassung
Bullischer Szenario: Anhaltende Trendstärke, solides Volumen und allgemeine Altcoin-/Risiko-orientierte Stimmung könnten DASH über wichtige Widerstände treiben und höhere Bereiche erreichen, die in langfristigen Prognosen angezeigt wurden.
Bärensches Szenario: Nicht-Halten der Schlüsselunterstützungen oder ungünstige regulatorische Entwicklungen könnten die jüngsten Gewinne rückgängig machen und zu tieferen Korrekturen führen.
*(Keine Finanzberatung – tun Sie Ihre eigene Recherche.)*
$ETH $SOL #BTC100kNext?
130
Übersetzung ansehen
$ZKP $ – Short Latest Analysis (Technical View)
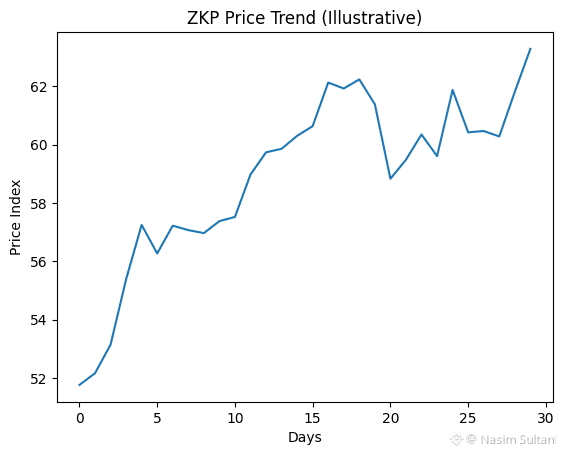
ZKP is currently showing moderate bullish momentum after a period of consolidation. Price action suggests buyers are gradually gaining control, with higher lows forming on the short-term chart.
Key Points:
📈 Trend: Short-term trend is slightly bullish, indicating potential continuation if volume increases.
🔄 Momentum: Momentum indicators suggest stabilization after recent pullbacks.
🧱 Support: Strong support zone below current price is holding well.
🚀 Resistance: A nearby resistance level could trigger short-term profit-taking if not broken.
Outlook: If ZKP holds above its support and breaks resistance with volume, a further upside move is possible. Failure to hold support may lead to another consolidation phase.
⚠️ Note: The chart shown is illustrative for technical understanding, not live market data. Always manage risk and confirm with real-time charts before trading.
$BTC $ETH #BinanceHODLerBREV
$ZKP $ – Short Latest Analysis (Technical View)
ZKP is currently showing moderate bullish momentum after a period of consolidation. Price action suggests buyers are gradually gaining control, with higher lows forming on the short-term chart.
Key Points:
📈 Trend: Short-term trend is slightly bullish, indicating potential continuation if volume increases.
🔄 Momentum: Momentum indicators suggest stabilization after recent pullbacks.
🧱 Support: Strong support zone below current price is holding well.
🚀 Resistance: A nearby resistance level could trigger short-term profit-taking if not broken.
Outlook: If ZKP holds above its support and breaks resistance with volume, a further upside move is possible. Failure to hold support may lead to another consolidation phase.
⚠️ Note: The chart shown is illustrative for technical understanding, not live market data. Always manage risk and confirm with real-time charts before trading.
$BTC $ETH #BinanceHODLerBREV
ZKP is currently showing moderate bullish momentum after a period of consolidation. Price action suggests buyers are gradually gaining control, with higher lows forming on the short-term chart.
Key Points:
📈 Trend: Short-term trend is slightly bullish, indicating potential continuation if volume increases.
🔄 Momentum: Momentum indicators suggest stabilization after recent pullbacks.
🧱 Support: Strong support zone below current price is holding well.
🚀 Resistance: A nearby resistance level could trigger short-term profit-taking if not broken.
Outlook: If ZKP holds above its support and breaks resistance with volume, a further upside move is possible. Failure to hold support may lead to another consolidation phase.
⚠️ Note: The chart shown is illustrative for technical understanding, not live market data. Always manage risk and confirm with real-time charts before trading.
$BTC $ETH #BinanceHODLerBREV
78
Übersetzung ansehen
BTCHere’s a fresh short Bitcoin (BTC) analysis — current as of Wednesday, January 14, 2026:
BTC Price (Live): ~ $96,858 USD and in a volatile push upward today.
📈 Market Summary
Bullish Factors
Bitcoin recently climbed above ~$95,000, driven by optimism over pending U.S. regulatory clarity, especially around the Digital Asset Market Clarity Act under Senate review, which markets are pricing as supportive for crypto.
Macro conditions (softer U.S. inflation and geopolitical tensions) are boosting Bitcoin’s appeal as a safe-haven asset.
Forecasts suggest a base case targeting $98,000–$105,000 in January and even upside near ~$110,000 if resistance breaks and institutional buying continues.
Bearish/Neutral Factors
Price remains significantly below the October 2025 all-time high (~$126,000), with volatility still high and investor sentiment cautious.
Short-term pullbacks have occurred when macro or policy news weighs on risk assets.
Technical ranges show BTC consolidating inside a wide $80k–$96k channel, waiting for trend confirmation.
🔑 Key Technical Levels
Support: ~$90,000 psychological support; deeper at ~$85,000-$80,000 if volatility returns.
Resistance: ~$96,500-$98,000 near short-term ceiling, then psychological $100,000 mark.
Break above these levels with strong volume could trigger broader upside.
📊 Trader Sentiment
Market is still “consolidative,” meaning BTC is in sideways price action, not yet confirming a strong trend.
Institutional activity (ETF flows and corporate holders) continues to influence price direction and volatility.
🧠 Short Term View (Next Weeks)
Moderate Bullish: BTC likely to oscillate higher toward $98k–$105k if macro tailwinds persist and resistance clears.
Risk Scenario: Failure to hold $90k support could re-open $85k range and trigger deeper corrective pressure.
Summary: Bitcoin is attempting a recovery from late-2025 consolidation, fueled by regulatory optimism and macro factors. The near-term outlook is cautiously bullish if it can sustain above key resistance levels, but volatility and macro events still pose risks. 🚀📉
(Prices & analysis reflect real-time market and news trends as of Jan 14, 2026.)
Would you like a simple price prediction chart image or a concise entry/exit strategy guide for BTC traders?
#BTC100kNext? $BNB $ETH
BTC
Here’s a fresh short Bitcoin (BTC) analysis — current as of Wednesday, January 14, 2026:
BTC Price (Live): ~ $96,858 USD and in a volatile push upward today.
📈 Market Summary
Bullish Factors
Bitcoin recently climbed above ~$95,000, driven by optimism over pending U.S. regulatory clarity, especially around the Digital Asset Market Clarity Act under Senate review, which markets are pricing as supportive for crypto.
Macro conditions (softer U.S. inflation and geopolitical tensions) are boosting Bitcoin’s appeal as a safe-haven asset.
Forecasts suggest a base case targeting $98,000–$105,000 in January and even upside near ~$110,000 if resistance breaks and institutional buying continues.
Bearish/Neutral Factors
Price remains significantly below the October 2025 all-time high (~$126,000), with volatility still high and investor sentiment cautious.
Short-term pullbacks have occurred when macro or policy news weighs on risk assets.
Technical ranges show BTC consolidating inside a wide $80k–$96k channel, waiting for trend confirmation.
🔑 Key Technical Levels
Support: ~$90,000 psychological support; deeper at ~$85,000-$80,000 if volatility returns.
Resistance: ~$96,500-$98,000 near short-term ceiling, then psychological $100,000 mark.
Break above these levels with strong volume could trigger broader upside.
📊 Trader Sentiment
Market is still “consolidative,” meaning BTC is in sideways price action, not yet confirming a strong trend.
Institutional activity (ETF flows and corporate holders) continues to influence price direction and volatility.
🧠 Short Term View (Next Weeks)
Moderate Bullish: BTC likely to oscillate higher toward $98k–$105k if macro tailwinds persist and resistance clears.
Risk Scenario: Failure to hold $90k support could re-open $85k range and trigger deeper corrective pressure.
Summary: Bitcoin is attempting a recovery from late-2025 consolidation, fueled by regulatory optimism and macro factors. The near-term outlook is cautiously bullish if it can sustain above key resistance levels, but volatility and macro events still pose risks. 🚀📉
(Prices & analysis reflect real-time market and news trends as of Jan 14, 2026.)
Would you like a simple price prediction chart image or a concise entry/exit strategy guide for BTC traders?
#BTC100kNext? $BNB $ETH
BTC Price (Live): ~ $96,858 USD and in a volatile push upward today.
📈 Market Summary
Bullish Factors
Bitcoin recently climbed above ~$95,000, driven by optimism over pending U.S. regulatory clarity, especially around the Digital Asset Market Clarity Act under Senate review, which markets are pricing as supportive for crypto.
Macro conditions (softer U.S. inflation and geopolitical tensions) are boosting Bitcoin’s appeal as a safe-haven asset.
Forecasts suggest a base case targeting $98,000–$105,000 in January and even upside near ~$110,000 if resistance breaks and institutional buying continues.
Bearish/Neutral Factors
Price remains significantly below the October 2025 all-time high (~$126,000), with volatility still high and investor sentiment cautious.
Short-term pullbacks have occurred when macro or policy news weighs on risk assets.
Technical ranges show BTC consolidating inside a wide $80k–$96k channel, waiting for trend confirmation.
🔑 Key Technical Levels
Support: ~$90,000 psychological support; deeper at ~$85,000-$80,000 if volatility returns.
Resistance: ~$96,500-$98,000 near short-term ceiling, then psychological $100,000 mark.
Break above these levels with strong volume could trigger broader upside.
📊 Trader Sentiment
Market is still “consolidative,” meaning BTC is in sideways price action, not yet confirming a strong trend.
Institutional activity (ETF flows and corporate holders) continues to influence price direction and volatility.
🧠 Short Term View (Next Weeks)
Moderate Bullish: BTC likely to oscillate higher toward $98k–$105k if macro tailwinds persist and resistance clears.
Risk Scenario: Failure to hold $90k support could re-open $85k range and trigger deeper corrective pressure.
Summary: Bitcoin is attempting a recovery from late-2025 consolidation, fueled by regulatory optimism and macro factors. The near-term outlook is cautiously bullish if it can sustain above key resistance levels, but volatility and macro events still pose risks. 🚀📉
(Prices & analysis reflect real-time market and news trends as of Jan 14, 2026.)
Would you like a simple price prediction chart image or a concise entry/exit strategy guide for BTC traders?
#BTC100kNext? $BNB $ETH
11
Übersetzung ansehen
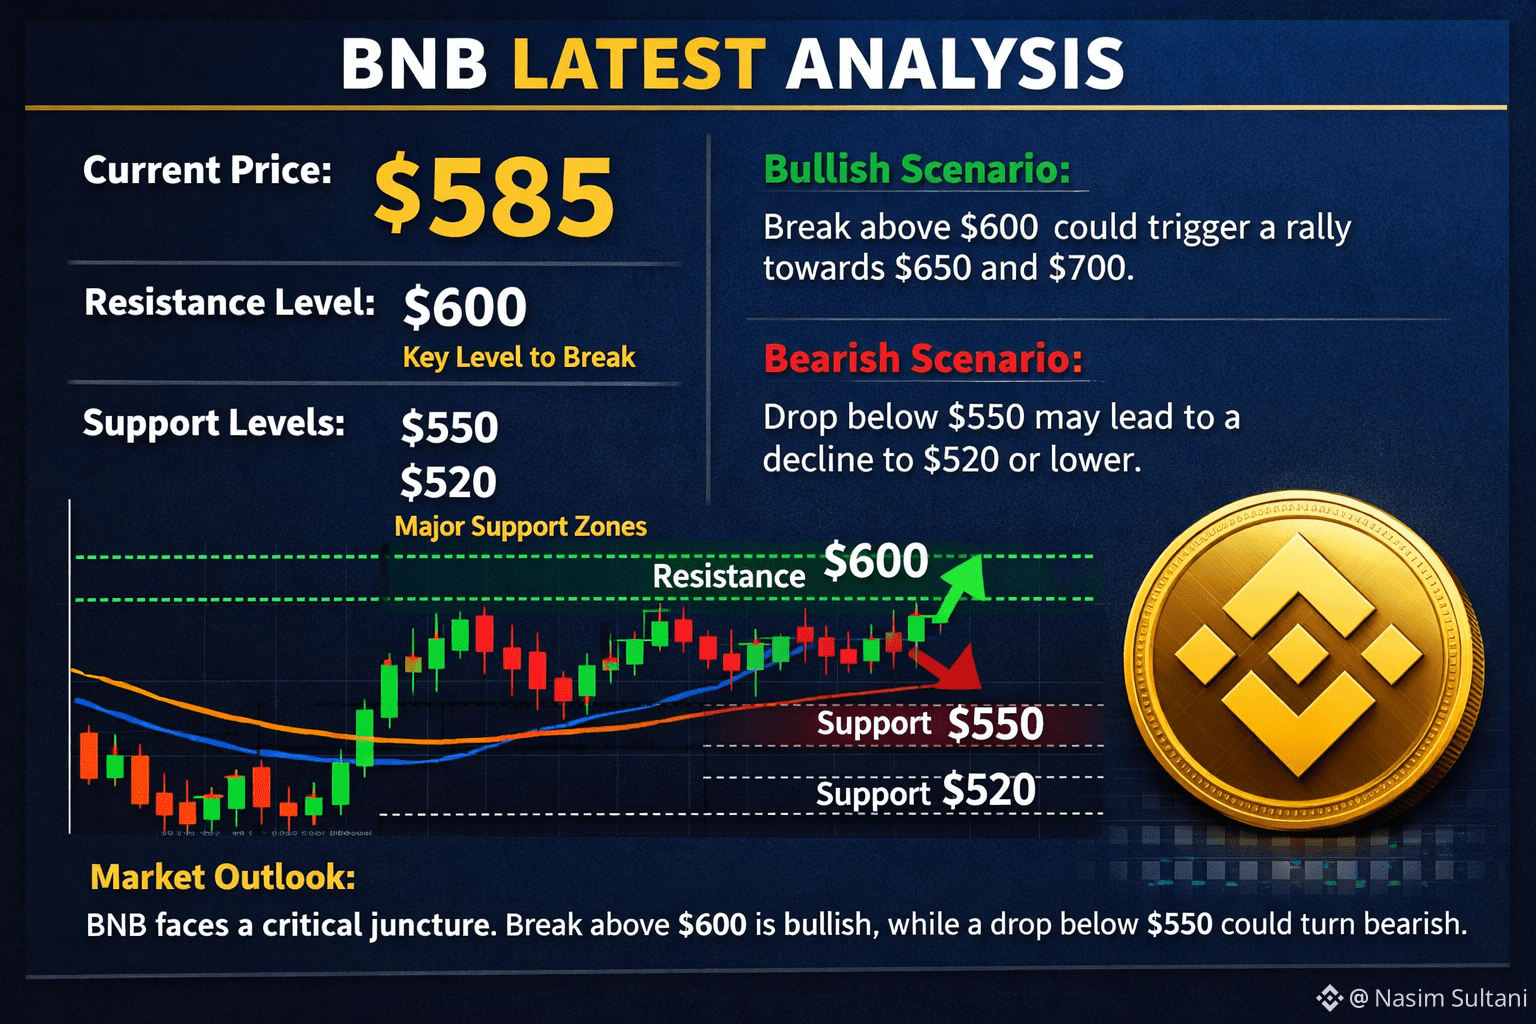
Here’s a quick, up-to-date Binance Coin (BNB) price analysis:
📊 Market Snapshot
$BNB is trading around the $900+ level, showing relative stability near key resistance zones. Price action suggests a mix of consolidation and potential breakout conditions.
📈 Short-Term Technical Outlook
Several analysts see bullish momentum building with targets around $950–$1,050 if BNB holds above short-term support levels.
Neutral to slightly bullish indicators (RSI) point to room for upward movement if buying volume increases.
📉 Risks & Weaknesses
Key resistance near current highs could act as a barrier unless broken decisively.
On-chain metrics have shown declines in BNB Chain activity and DEX volume, which could weigh on sentiment if the trend worsens.
📊 Broader Perspective
BNB’s deflationary tokenomics (burns) and integration into Binance’s ecosystem support longer-term value.
Strategists have even suggested multi-year upside to $2,700+ under optimistic institutional adoption scenarios.
📌 Key Levels to Watch
Support: Around current consolidation zone (~$880–$900)
Resistance: $950–$1,000 breakout zone
Bullish trigger: Clear daily close above resistance zone
(This is not financial advice — always do your own research before trading.)
Would you like me to include a simple annotated chart showing these price levels?
$BNB $SOL #StrategyBTCPurchase
Here’s a quick, up-to-date Binance Coin (BNB) price analysis:
📊 Market Snapshot
$BNB is trading around the $900+ level, showing relative stability near key resistance zones. Price action suggests a mix of consolidation and potential breakout conditions.
📈 Short-Term Technical Outlook
Several analysts see bullish momentum building with targets around $950–$1,050 if BNB holds above short-term support levels.
Neutral to slightly bullish indicators (RSI) point to room for upward movement if buying volume increases.
📉 Risks & Weaknesses
Key resistance near current highs could act as a barrier unless broken decisively.
On-chain metrics have shown declines in BNB Chain activity and DEX volume, which could weigh on sentiment if the trend worsens.
📊 Broader Perspective
BNB’s deflationary tokenomics (burns) and integration into Binance’s ecosystem support longer-term value.
Strategists have even suggested multi-year upside to $2,700+ under optimistic institutional adoption scenarios.
📌 Key Levels to Watch
Support: Around current consolidation zone (~$880–$900)
Resistance: $950–$1,000 breakout zone
Bullish trigger: Clear daily close above resistance zone
(This is not financial advice — always do your own research before trading.)
Would you like me to include a simple annotated chart showing these price levels?
$BNB $SOL #StrategyBTCPurchase
📊 Market Snapshot
$BNB is trading around the $900+ level, showing relative stability near key resistance zones. Price action suggests a mix of consolidation and potential breakout conditions.
📈 Short-Term Technical Outlook
Several analysts see bullish momentum building with targets around $950–$1,050 if BNB holds above short-term support levels.
Neutral to slightly bullish indicators (RSI) point to room for upward movement if buying volume increases.
📉 Risks & Weaknesses
Key resistance near current highs could act as a barrier unless broken decisively.
On-chain metrics have shown declines in BNB Chain activity and DEX volume, which could weigh on sentiment if the trend worsens.
📊 Broader Perspective
BNB’s deflationary tokenomics (burns) and integration into Binance’s ecosystem support longer-term value.
Strategists have even suggested multi-year upside to $2,700+ under optimistic institutional adoption scenarios.
📌 Key Levels to Watch
Support: Around current consolidation zone (~$880–$900)
Resistance: $950–$1,000 breakout zone
Bullish trigger: Clear daily close above resistance zone
(This is not financial advice — always do your own research before trading.)
Would you like me to include a simple annotated chart showing these price levels?
$BNB $SOL #StrategyBTCPurchase
4
Übersetzung ansehen
Here’s a short, up-to-date Bitcoin analysis with the latest price snapshot and key market context👇
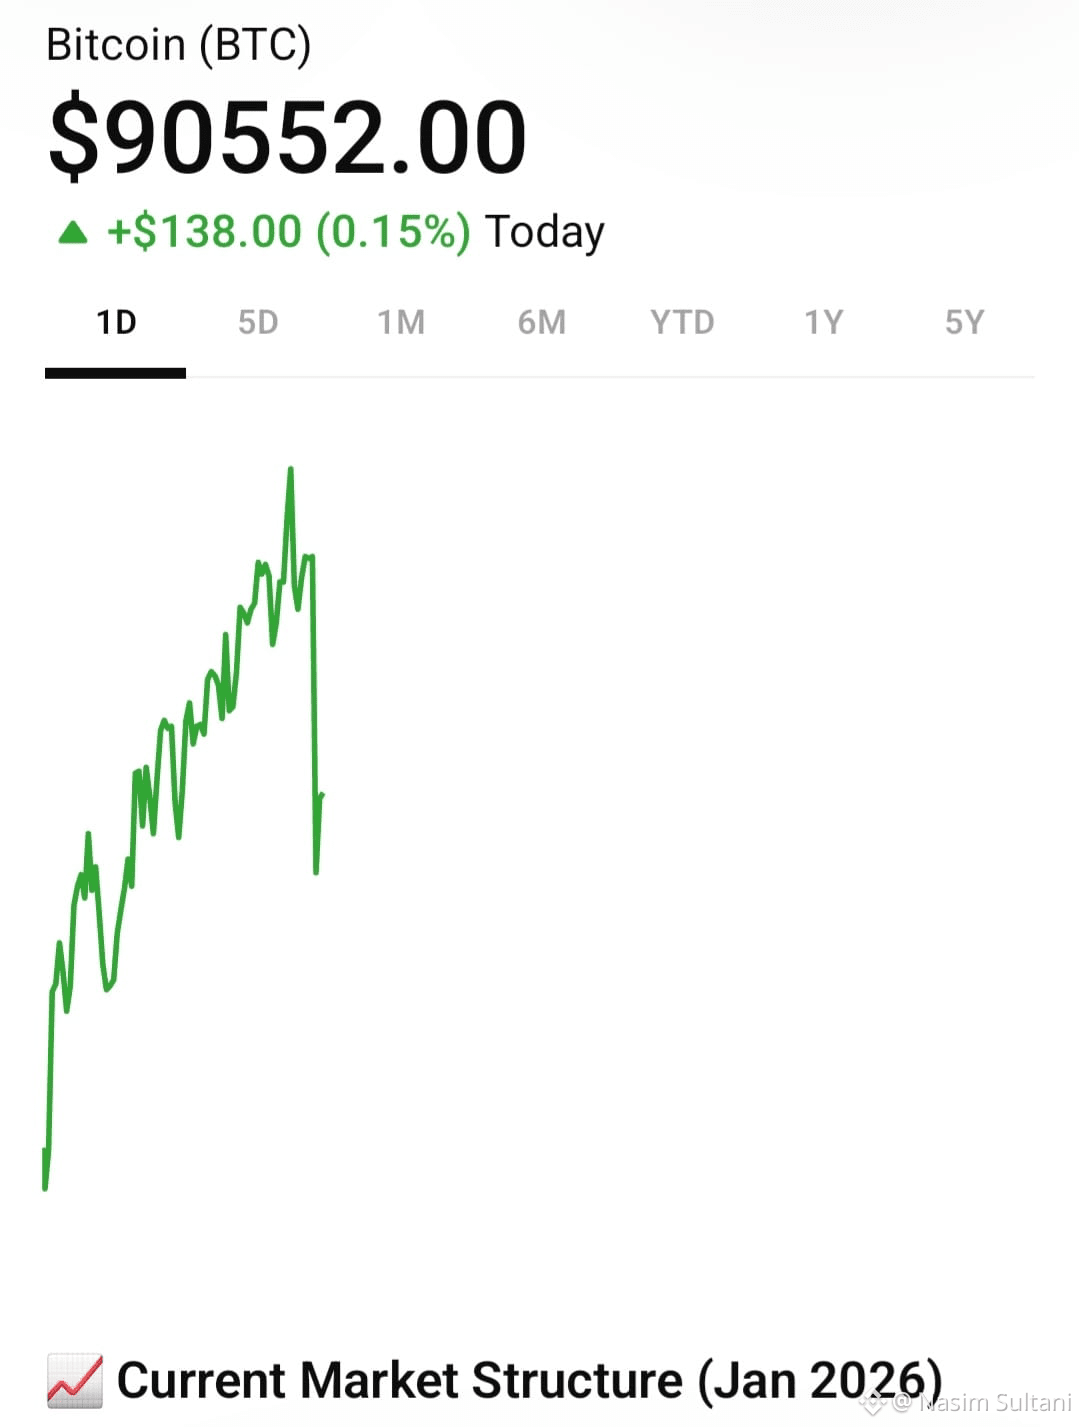
📈 Current Market Structure (Jan 2026)
$BTC is trading near $90k, showing consolidation rather than a clear trend breakout.
Recent price action has formed a tight range around $88k–$92k, with a more modest drawdown than past cycles — possibly indicating stronger support levels.
🔍 Short-Term Signals
Bitcoin has been consolidating near $90k, with bulls needing momentum to reclaim higher levels like $100k–$105k.
Some on-chain and technical setups suggest a breakout could be forming if volatility increases.
📊 Medium / Long-Term Views
Analysts remain divided, with targets ranging from continued short-term sideways action to very bullish longer-term forecasts (e.g., $150k–$200k+ in 2026).
Macro sentiment around institutional adoption and technical conditions could keep BTC supported even amid wider market pressure.
🔥 Bullish Factors
Broader forecasts and institutional interest still paint long-run growth potential.
Relative mild drawdown vs historical cycles suggests resilience.
🛑 Bearish / Cautionary Notes
Price remains below recent all-time highs (~$126k), and resistance levels are still ahead.
Consolidation and lower volatility can delay trend continuation.
If you want a visual chart or deeper technical levels, just tell me what format or details you prefer! 📊📉
$BTC $ETH
Here’s a short, up-to-date Bitcoin analysis with the latest price snapshot and key market context👇
📈 Current Market Structure (Jan 2026)
$BTC is trading near $90k, showing consolidation rather than a clear trend breakout.
Recent price action has formed a tight range around $88k–$92k, with a more modest drawdown than past cycles — possibly indicating stronger support levels.
🔍 Short-Term Signals
Bitcoin has been consolidating near $90k, with bulls needing momentum to reclaim higher levels like $100k–$105k.
Some on-chain and technical setups suggest a breakout could be forming if volatility increases.
📊 Medium / Long-Term Views
Analysts remain divided, with targets ranging from continued short-term sideways action to very bullish longer-term forecasts (e.g., $150k–$200k+ in 2026).
Macro sentiment around institutional adoption and technical conditions could keep BTC supported even amid wider market pressure.
🔥 Bullish Factors
Broader forecasts and institutional interest still paint long-run growth potential.
Relative mild drawdown vs historical cycles suggests resilience.
🛑 Bearish / Cautionary Notes
Price remains below recent all-time highs (~$126k), and resistance levels are still ahead.
Consolidation and lower volatility can delay trend continuation.
If you want a visual chart or deeper technical levels, just tell me what format or details you prefer! 📊📉
$BTC $ETH
📈 Current Market Structure (Jan 2026)
$BTC is trading near $90k, showing consolidation rather than a clear trend breakout.
Recent price action has formed a tight range around $88k–$92k, with a more modest drawdown than past cycles — possibly indicating stronger support levels.
🔍 Short-Term Signals
Bitcoin has been consolidating near $90k, with bulls needing momentum to reclaim higher levels like $100k–$105k.
Some on-chain and technical setups suggest a breakout could be forming if volatility increases.
📊 Medium / Long-Term Views
Analysts remain divided, with targets ranging from continued short-term sideways action to very bullish longer-term forecasts (e.g., $150k–$200k+ in 2026).
Macro sentiment around institutional adoption and technical conditions could keep BTC supported even amid wider market pressure.
🔥 Bullish Factors
Broader forecasts and institutional interest still paint long-run growth potential.
Relative mild drawdown vs historical cycles suggests resilience.
🛑 Bearish / Cautionary Notes
Price remains below recent all-time highs (~$126k), and resistance levels are still ahead.
Consolidation and lower volatility can delay trend continuation.
If you want a visual chart or deeper technical levels, just tell me what format or details you prefer! 📊📉
$BTC $ETH
1
Übersetzung ansehen
SOL (Solana) – Latest Short Analysis
Trend: 📈 Short-term bullish bias
$SOL continues to show strength with higher highs and higher lows on the daily timeframe. Momentum remains positive as buyers defend key support zones.
Key Levels:
Support: $95 – $100
Resistance: $115 – $125
A clean break above resistance could open the door for a stronger continuation move.
Indicators:
RSI: Near the bullish zone, showing healthy momentum (not yet overbought).
Moving Averages: Price is holding above short- and mid-term MAs, signaling trend support.
Outlook:
As long as SOL holds above the $95–$100 support area, the outlook remains bullish. A rejection at resistance may lead to short consolidation before the next move.
Simple Price View (Picture):
Price 125 | ╭─╮ 120 | ╭───╯ ╰───╮ 115 | ╭───╯ ╰─ Resistance 110 | ╭─╯ 105 |╭╯ 100 |╯─────────────── Support └──────────────────────── Time
$SOL $ETH #BTCVSGOLD
SOL (Solana) – Latest Short Analysis
Trend: 📈 Short-term bullish bias
$SOL continues to show strength with higher highs and higher lows on the daily timeframe. Momentum remains positive as buyers defend key support zones.
Key Levels:
Support: $95 – $100
Resistance: $115 – $125
A clean break above resistance could open the door for a stronger continuation move.
Indicators:
RSI: Near the bullish zone, showing healthy momentum (not yet overbought).
Moving Averages: Price is holding above short- and mid-term MAs, signaling trend support.
Outlook:
As long as SOL holds above the $95–$100 support area, the outlook remains bullish. A rejection at resistance may lead to short consolidation before the next move.
Simple Price View (Picture):
Price 125 | ╭─╮ 120 | ╭───╯ ╰───╮ 115 | ╭───╯ ╰─ Resistance 110 | ╭─╯ 105 |╭╯ 100 |╯─────────────── Support └──────────────────────── Time
$SOL $ETH #BTCVSGOLD
Trend: 📈 Short-term bullish bias
$SOL continues to show strength with higher highs and higher lows on the daily timeframe. Momentum remains positive as buyers defend key support zones.
Key Levels:
Support: $95 – $100
Resistance: $115 – $125
A clean break above resistance could open the door for a stronger continuation move.
Indicators:
RSI: Near the bullish zone, showing healthy momentum (not yet overbought).
Moving Averages: Price is holding above short- and mid-term MAs, signaling trend support.
Outlook:
As long as SOL holds above the $95–$100 support area, the outlook remains bullish. A rejection at resistance may lead to short consolidation before the next move.
Simple Price View (Picture):
Price 125 | ╭─╮ 120 | ╭───╯ ╰───╮ 115 | ╭───╯ ╰─ Resistance 110 | ╭─╯ 105 |╭╯ 100 |╯─────────────── Support └──────────────────────── Time
$SOL $ETH #BTCVSGOLD
5
Übersetzung ansehen
BNB (Binance Coin) – Short Latest Analysis
$BNB $BTC is currently showing a stable-to-bullish structure on the short-term timeframe. Price action remains above key support zones, indicating that buyers are still defending the trend. Momentum has slightly cooled after recent moves, suggesting a possible consolidation phase before the next direction is confirmed.
Key Points:
🔹 Trend: Short-term bullish, medium-term neutral
🔹 Support: Strong demand near recent pullback levels
🔹 Resistance: Previous highs acting as a short-term barrier
🔹 Outlook: If volume increases, BNB may attempt another upside move; otherwise, sideways movement is likely
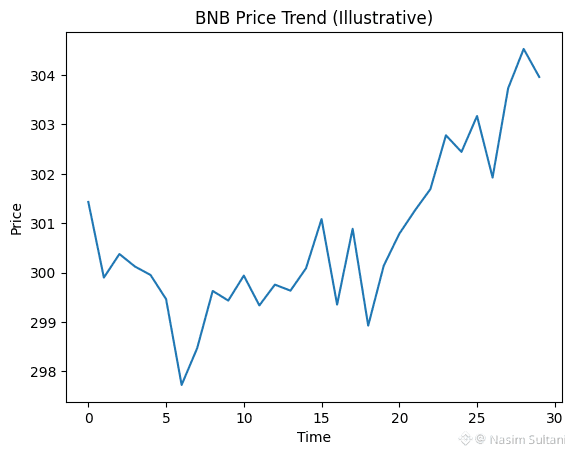
📌 The chart above is an illustrative trend to visualize recent market behavior, not exact price data.
If you want, I can also provide support & resistance levels, scalp/short-term signals, or a daily vs weekly outlook.
#BTCVSGOLD $BNB
BNB (Binance Coin) – Short Latest Analysis
$BNB $BTC is currently showing a stable-to-bullish structure on the short-term timeframe. Price action remains above key support zones, indicating that buyers are still defending the trend. Momentum has slightly cooled after recent moves, suggesting a possible consolidation phase before the next direction is confirmed.
Key Points:
🔹 Trend: Short-term bullish, medium-term neutral
🔹 Support: Strong demand near recent pullback levels
🔹 Resistance: Previous highs acting as a short-term barrier
🔹 Outlook: If volume increases, BNB may attempt another upside move; otherwise, sideways movement is likely
📌 The chart above is an illustrative trend to visualize recent market behavior, not exact price data.
If you want, I can also provide support & resistance levels, scalp/short-term signals, or a daily vs weekly outlook.
#BTCVSGOLD $BNB
$BNB $BTC is currently showing a stable-to-bullish structure on the short-term timeframe. Price action remains above key support zones, indicating that buyers are still defending the trend. Momentum has slightly cooled after recent moves, suggesting a possible consolidation phase before the next direction is confirmed.
Key Points:
🔹 Trend: Short-term bullish, medium-term neutral
🔹 Support: Strong demand near recent pullback levels
🔹 Resistance: Previous highs acting as a short-term barrier
🔹 Outlook: If volume increases, BNB may attempt another upside move; otherwise, sideways movement is likely
📌 The chart above is an illustrative trend to visualize recent market behavior, not exact price data.
If you want, I can also provide support & resistance levels, scalp/short-term signals, or a daily vs weekly outlook.
#BTCVSGOLD $BNB
11
Übersetzung ansehen
Here’s a short, up-to-date Bitcoin analysis with a chart image (latest market outlook for early January 2026):
📊 Bitcoin Latest Market Analysis (January 2026)
Current Price & Action
$BTC Bitcoin is trading near $90,000–$92,000, recovering from late-2025 corrections as 2026 begins.
Recent gains have lifted BTC above key psychological and technical levels, but broader trend uncertainty remains.
Technical Outlook
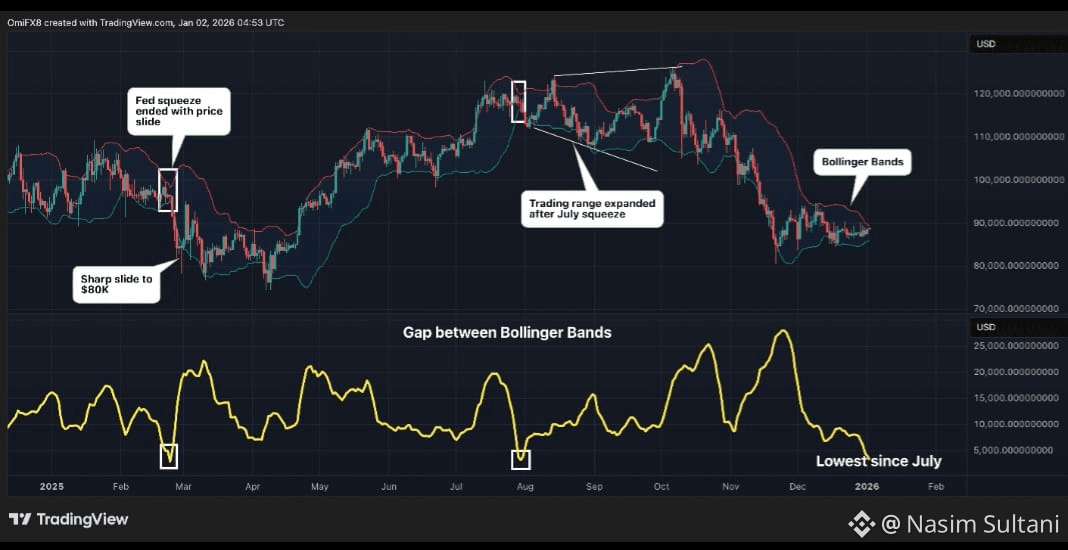
BTC’s volatility bands have compressed, often a precursor to strong price swings — meaning we could see increased movement soon.
Short-term technical levels show resistance ~$96,000–$100,000 and critical support at $85,000 — holding support is key for bulls.
Bullish Scenario ✔ Analysts and models project targets from $110,000 up to $150,000-$250,000 in 2026 based on continued ETF flows and institutional demand.
✔ Some forecasts even see BTC setting new all-time highs if adoption trends accelerate.
Bearish Risks ⚠ A break below the $85,000 support region could open deeper corrections — some analysts even warn of potential tests near $37,000 in extended bear scenarios.
Macro & Market Factors
Institutional interest, ETF inflows, and U.S. regulatory clarity continue shaping sentiment — typically bullish when inflows remain strong.
However, macroeconomic conditions (interest rates, equities, and risk-asset appetite) still influence BTC’s correlation with traditional markets.
🔎 Summary:
Bitcoin has started 2026 with consolidation and moderate gains after a pullback. Technical indicators suggest a potential breakout zone ahead, with short-term resistance around $96K–$100K. Analyst forecasts vary, but many see upside toward $110K+ if support holds and institutional demand continues — while deeper corrections remain possible if key support fails.
*This is an informational analysis, not financial advice. Always do your own research before making investments.*
#BinanceHODLerBREV $ETH
Here’s a short, up-to-date Bitcoin analysis with a chart image (latest market outlook for early January 2026):
📊 Bitcoin Latest Market Analysis (January 2026)
Current Price & Action
$BTC Bitcoin is trading near $90,000–$92,000, recovering from late-2025 corrections as 2026 begins.
Recent gains have lifted BTC above key psychological and technical levels, but broader trend uncertainty remains.
Technical Outlook
BTC’s volatility bands have compressed, often a precursor to strong price swings — meaning we could see increased movement soon.
Short-term technical levels show resistance ~$96,000–$100,000 and critical support at $85,000 — holding support is key for bulls.
Bullish Scenario ✔ Analysts and models project targets from $110,000 up to $150,000-$250,000 in 2026 based on continued ETF flows and institutional demand.
✔ Some forecasts even see BTC setting new all-time highs if adoption trends accelerate.
Bearish Risks ⚠ A break below the $85,000 support region could open deeper corrections — some analysts even warn of potential tests near $37,000 in extended bear scenarios.
Macro & Market Factors
Institutional interest, ETF inflows, and U.S. regulatory clarity continue shaping sentiment — typically bullish when inflows remain strong.
However, macroeconomic conditions (interest rates, equities, and risk-asset appetite) still influence BTC’s correlation with traditional markets.
🔎 Summary:
Bitcoin has started 2026 with consolidation and moderate gains after a pullback. Technical indicators suggest a potential breakout zone ahead, with short-term resistance around $96K–$100K. Analyst forecasts vary, but many see upside toward $110K+ if support holds and institutional demand continues — while deeper corrections remain possible if key support fails.
*This is an informational analysis, not financial advice. Always do your own research before making investments.*
#BinanceHODLerBREV $ETH
📊 Bitcoin Latest Market Analysis (January 2026)
Current Price & Action
$BTC Bitcoin is trading near $90,000–$92,000, recovering from late-2025 corrections as 2026 begins.
Recent gains have lifted BTC above key psychological and technical levels, but broader trend uncertainty remains.
Technical Outlook
BTC’s volatility bands have compressed, often a precursor to strong price swings — meaning we could see increased movement soon.
Short-term technical levels show resistance ~$96,000–$100,000 and critical support at $85,000 — holding support is key for bulls.
Bullish Scenario ✔ Analysts and models project targets from $110,000 up to $150,000-$250,000 in 2026 based on continued ETF flows and institutional demand.
✔ Some forecasts even see BTC setting new all-time highs if adoption trends accelerate.
Bearish Risks ⚠ A break below the $85,000 support region could open deeper corrections — some analysts even warn of potential tests near $37,000 in extended bear scenarios.
Macro & Market Factors
Institutional interest, ETF inflows, and U.S. regulatory clarity continue shaping sentiment — typically bullish when inflows remain strong.
However, macroeconomic conditions (interest rates, equities, and risk-asset appetite) still influence BTC’s correlation with traditional markets.
🔎 Summary:
Bitcoin has started 2026 with consolidation and moderate gains after a pullback. Technical indicators suggest a potential breakout zone ahead, with short-term resistance around $96K–$100K. Analyst forecasts vary, but many see upside toward $110K+ if support holds and institutional demand continues — while deeper corrections remain possible if key support fails.
*This is an informational analysis, not financial advice. Always do your own research before making investments.*
#BinanceHODLerBREV $ETH
1
20
Übersetzung ansehen
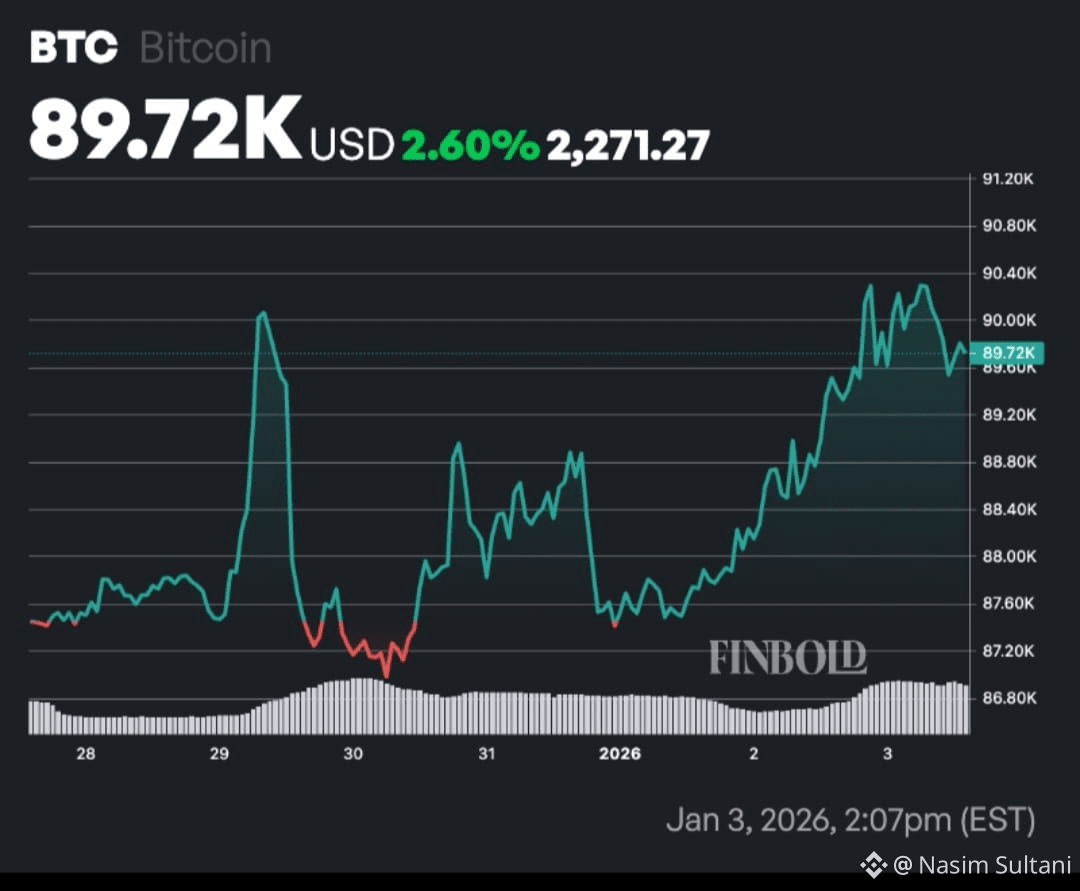
Here’s a short, up-to-date Bitcoin analysis with a current price snapshot and a picture to illustrate the trend:
📊 Market Overview (Early January 2026)
• Current price trend: $BTC Bitcoin is trading near ~$91k after reclaiming strong support levels following late-2025 correction.
• Volatility compression suggests a potential breakout window soon — history shows similar compression often precedes major moves.
• Broader structure shows hesitation rather than clear directional conviction, pointing to range-bound trading for now.
📈 Bullish Factors
• Short-term technical analysis points to a breakout above ~$96k resistance as the key to resuming bullish momentum.
• Institutional demand and ETF inflows remain strong catalysts that could support price growth through 2026.
• Some analysts see upside targets from $110k to $170k+ later in the year if macro tailwinds persist.
📉 Risks & Uncertainties
• Macro factors like Federal Reserve policy, inflation, or liquidity shifts could create selling pressure or dampen risk appetite.
• Market participants remain cautious, with mixed probability for big breakout vs. consolidation.
🧠 Summary
$BTC Bitcoin’s price structure in early 2026 is showing consolidation after a corrective phase, with a neutral-to-slightly-bullish bias if key resistance breaks. Institutional flows and halving effects support longer-term bullish scenarios, but macro risks and volatility mean the path may still be choppy.
If you want, I can break this down into a trading plan (with entry/exit levels and risk management) for short-term or long-term strategies.
#BTC90kChristmas $BTC
Here’s a short, up-to-date Bitcoin analysis with a current price snapshot and a picture to illustrate the trend:
📊 Market Overview (Early January 2026)
• Current price trend: $BTC Bitcoin is trading near ~$91k after reclaiming strong support levels following late-2025 correction.
• Volatility compression suggests a potential breakout window soon — history shows similar compression often precedes major moves.
• Broader structure shows hesitation rather than clear directional conviction, pointing to range-bound trading for now.
📈 Bullish Factors
• Short-term technical analysis points to a breakout above ~$96k resistance as the key to resuming bullish momentum.
• Institutional demand and ETF inflows remain strong catalysts that could support price growth through 2026.
• Some analysts see upside targets from $110k to $170k+ later in the year if macro tailwinds persist.
📉 Risks & Uncertainties
• Macro factors like Federal Reserve policy, inflation, or liquidity shifts could create selling pressure or dampen risk appetite.
• Market participants remain cautious, with mixed probability for big breakout vs. consolidation.
🧠 Summary
$BTC Bitcoin’s price structure in early 2026 is showing consolidation after a corrective phase, with a neutral-to-slightly-bullish bias if key resistance breaks. Institutional flows and halving effects support longer-term bullish scenarios, but macro risks and volatility mean the path may still be choppy.
If you want, I can break this down into a trading plan (with entry/exit levels and risk management) for short-term or long-term strategies.
#BTC90kChristmas $BTC
📊 Market Overview (Early January 2026)
• Current price trend: $BTC Bitcoin is trading near ~$91k after reclaiming strong support levels following late-2025 correction.
• Volatility compression suggests a potential breakout window soon — history shows similar compression often precedes major moves.
• Broader structure shows hesitation rather than clear directional conviction, pointing to range-bound trading for now.
📈 Bullish Factors
• Short-term technical analysis points to a breakout above ~$96k resistance as the key to resuming bullish momentum.
• Institutional demand and ETF inflows remain strong catalysts that could support price growth through 2026.
• Some analysts see upside targets from $110k to $170k+ later in the year if macro tailwinds persist.
📉 Risks & Uncertainties
• Macro factors like Federal Reserve policy, inflation, or liquidity shifts could create selling pressure or dampen risk appetite.
• Market participants remain cautious, with mixed probability for big breakout vs. consolidation.
🧠 Summary
$BTC Bitcoin’s price structure in early 2026 is showing consolidation after a corrective phase, with a neutral-to-slightly-bullish bias if key resistance breaks. Institutional flows and halving effects support longer-term bullish scenarios, but macro risks and volatility mean the path may still be choppy.
If you want, I can break this down into a trading plan (with entry/exit levels and risk management) for short-term or long-term strategies.
#BTC90kChristmas $BTC
2
8
Übersetzung ansehen
Here’s a short latest analysis of the Kyrgyz national stablecoin KGST, focused on the major recent developments — with a picture to illustrate the story:
📊 KGST Latest Analysis — Dec 30, 2025
1. Major Milestone — Binance Listing
$KGST T, a stablecoin backed 1:1 by the Kyrgyz som, was listed on Binance’s Spot market on December 24, 2025, making it the first stablecoin from the Commonwealth of Independent States (CIS) to debut on a global crypto exchange. This gives KGST global liquidity and access to Binance’s large trader base.
2. Price Behavior & Stability
KGST’s trading pattern remains relatively stable — as expected for a fiat-pegged coin. Recent data shows the peg holding closely to the som’s value with minimal deviations from the target rate. This indicates the peg mechanism is working and that the coin is currently used more for liquidity and payments rather than speculation.
3. Strategic Impact for Kyrgyzstan
Analysts see KGST as part of a broader strategy to modernize the country’s payment systems, boost financial inclusion via mobile wallets, and reduce dependence on foreign stablecoins like USDT or USDC. Listing on Binance also enhances Kyrgyzstan’s presence in the global crypto market.
4. What to Watch Next
Liquidity Depth: Continued tight spreads and solid trading volumes would signal strong market commitment.
Use Cases: Adoption in remittances and merchant payments could define real-world success.
Regulation & Oversight: Maintaining reserves transparently will be key to trust and long-term growth.
Summary: KGST’s Binance debut marks a significant step for sovereign digital currencies, expanding Kyrgyzstan’s financial infrastructure and positioning KGST as a model for emerging-market stablecoins — though real-world adoption beyond trading remains a key future milestone.
If you want, I can also provide a concise KGST price outlook or performance chart — just let me know!
$BNB $BTC #WriteToEarnUpgrade
Here’s a short latest analysis of the Kyrgyz national stablecoin KGST, focused on the major recent developments — with a picture to illustrate the story:
📊 KGST Latest Analysis — Dec 30, 2025
1. Major Milestone — Binance Listing
$KGST T, a stablecoin backed 1:1 by the Kyrgyz som, was listed on Binance’s Spot market on December 24, 2025, making it the first stablecoin from the Commonwealth of Independent States (CIS) to debut on a global crypto exchange. This gives KGST global liquidity and access to Binance’s large trader base.
2. Price Behavior & Stability
KGST’s trading pattern remains relatively stable — as expected for a fiat-pegged coin. Recent data shows the peg holding closely to the som’s value with minimal deviations from the target rate. This indicates the peg mechanism is working and that the coin is currently used more for liquidity and payments rather than speculation.
3. Strategic Impact for Kyrgyzstan
Analysts see KGST as part of a broader strategy to modernize the country’s payment systems, boost financial inclusion via mobile wallets, and reduce dependence on foreign stablecoins like USDT or USDC. Listing on Binance also enhances Kyrgyzstan’s presence in the global crypto market.
4. What to Watch Next
Liquidity Depth: Continued tight spreads and solid trading volumes would signal strong market commitment.
Use Cases: Adoption in remittances and merchant payments could define real-world success.
Regulation & Oversight: Maintaining reserves transparently will be key to trust and long-term growth.
Summary: KGST’s Binance debut marks a significant step for sovereign digital currencies, expanding Kyrgyzstan’s financial infrastructure and positioning KGST as a model for emerging-market stablecoins — though real-world adoption beyond trading remains a key future milestone.
If you want, I can also provide a concise KGST price outlook or performance chart — just let me know!
$BNB $BTC #WriteToEarnUpgrade
📊 KGST Latest Analysis — Dec 30, 2025
1. Major Milestone — Binance Listing
$KGST T, a stablecoin backed 1:1 by the Kyrgyz som, was listed on Binance’s Spot market on December 24, 2025, making it the first stablecoin from the Commonwealth of Independent States (CIS) to debut on a global crypto exchange. This gives KGST global liquidity and access to Binance’s large trader base.
2. Price Behavior & Stability
KGST’s trading pattern remains relatively stable — as expected for a fiat-pegged coin. Recent data shows the peg holding closely to the som’s value with minimal deviations from the target rate. This indicates the peg mechanism is working and that the coin is currently used more for liquidity and payments rather than speculation.
3. Strategic Impact for Kyrgyzstan
Analysts see KGST as part of a broader strategy to modernize the country’s payment systems, boost financial inclusion via mobile wallets, and reduce dependence on foreign stablecoins like USDT or USDC. Listing on Binance also enhances Kyrgyzstan’s presence in the global crypto market.
4. What to Watch Next
Liquidity Depth: Continued tight spreads and solid trading volumes would signal strong market commitment.
Use Cases: Adoption in remittances and merchant payments could define real-world success.
Regulation & Oversight: Maintaining reserves transparently will be key to trust and long-term growth.
Summary: KGST’s Binance debut marks a significant step for sovereign digital currencies, expanding Kyrgyzstan’s financial infrastructure and positioning KGST as a model for emerging-market stablecoins — though real-world adoption beyond trading remains a key future milestone.
If you want, I can also provide a concise KGST price outlook or performance chart — just let me know!
$BNB $BTC #WriteToEarnUpgrade

6
253
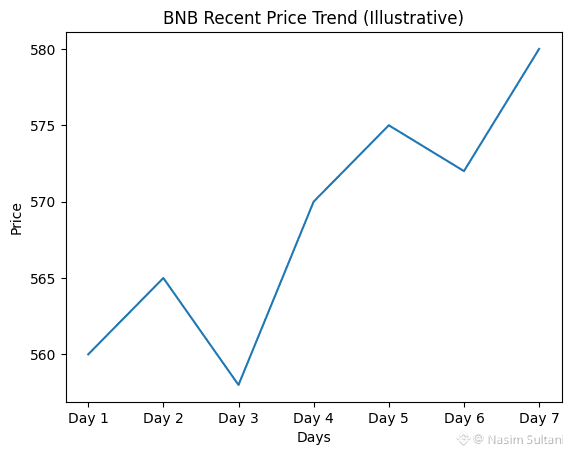
BNB (Binance Coin) – Kurze neueste Analyse
$BNB BNB zeigt kurzfristig eine stetige bullische Dynamik. Die Preisbewegung deutet darauf hin, dass Käufer allmählich die Kontrolle übernehmen, unterstützt durch höhere Tiefs und eine verbesserte Marktstimmung rund um das Binance-Ökosystem.
Schlüssel Punkte:
📈 Trend: Mild bis moderat bullische Fortsetzung
🔑 Unterstützung: Jüngste Rückgänge werden schnell gekauft, was eine starke Nachfrage zeigt
🚀 Widerstand: Ein Ausbruch über das jüngste Hoch könnte die Tür für weiteres Aufwärtspotenzial öffnen
📊 Ausblick: Solange BNB über seiner kurzfristigen Unterstützungszone bleibt, bleibt die bullische Tendenz gültig
Das obige Diagramm zeigt einen kürzlichen Aufwärtstrend in der Preisbewegung von BNB (illustriert), was die verbesserte Stärke und das Vertrauen der Käufer widerspiegelt.
Wenn Sie möchten, kann ich auch:
Unterstützungs- & Widerstandsniveaus hinzufügen
Eine sehr kurze Version für soziale Medien schreiben
Nächste eine Bitcoin- oder ETH-Analyse durchführen
#BTC90kChristmas $BNB $SOL
BNB (Binance Coin) – Kurze neueste Analyse
$BNB BNB zeigt kurzfristig eine stetige bullische Dynamik. Die Preisbewegung deutet darauf hin, dass Käufer allmählich die Kontrolle übernehmen, unterstützt durch höhere Tiefs und eine verbesserte Marktstimmung rund um das Binance-Ökosystem.
Schlüssel Punkte:
📈 Trend: Mild bis moderat bullische Fortsetzung
🔑 Unterstützung: Jüngste Rückgänge werden schnell gekauft, was eine starke Nachfrage zeigt
🚀 Widerstand: Ein Ausbruch über das jüngste Hoch könnte die Tür für weiteres Aufwärtspotenzial öffnen
📊 Ausblick: Solange BNB über seiner kurzfristigen Unterstützungszone bleibt, bleibt die bullische Tendenz gültig
Das obige Diagramm zeigt einen kürzlichen Aufwärtstrend in der Preisbewegung von BNB (illustriert), was die verbesserte Stärke und das Vertrauen der Käufer widerspiegelt.
Wenn Sie möchten, kann ich auch:
Unterstützungs- & Widerstandsniveaus hinzufügen
Eine sehr kurze Version für soziale Medien schreiben
Nächste eine Bitcoin- oder ETH-Analyse durchführen
#BTC90kChristmas $BNB $SOL
$BNB BNB zeigt kurzfristig eine stetige bullische Dynamik. Die Preisbewegung deutet darauf hin, dass Käufer allmählich die Kontrolle übernehmen, unterstützt durch höhere Tiefs und eine verbesserte Marktstimmung rund um das Binance-Ökosystem.
Schlüssel Punkte:
📈 Trend: Mild bis moderat bullische Fortsetzung
🔑 Unterstützung: Jüngste Rückgänge werden schnell gekauft, was eine starke Nachfrage zeigt
🚀 Widerstand: Ein Ausbruch über das jüngste Hoch könnte die Tür für weiteres Aufwärtspotenzial öffnen
📊 Ausblick: Solange BNB über seiner kurzfristigen Unterstützungszone bleibt, bleibt die bullische Tendenz gültig
Das obige Diagramm zeigt einen kürzlichen Aufwärtstrend in der Preisbewegung von BNB (illustriert), was die verbesserte Stärke und das Vertrauen der Käufer widerspiegelt.
Wenn Sie möchten, kann ich auch:
Unterstützungs- & Widerstandsniveaus hinzufügen
Eine sehr kurze Version für soziale Medien schreiben
Nächste eine Bitcoin- oder ETH-Analyse durchführen
#BTC90kChristmas $BNB $SOL
3
4
Übersetzung ansehen
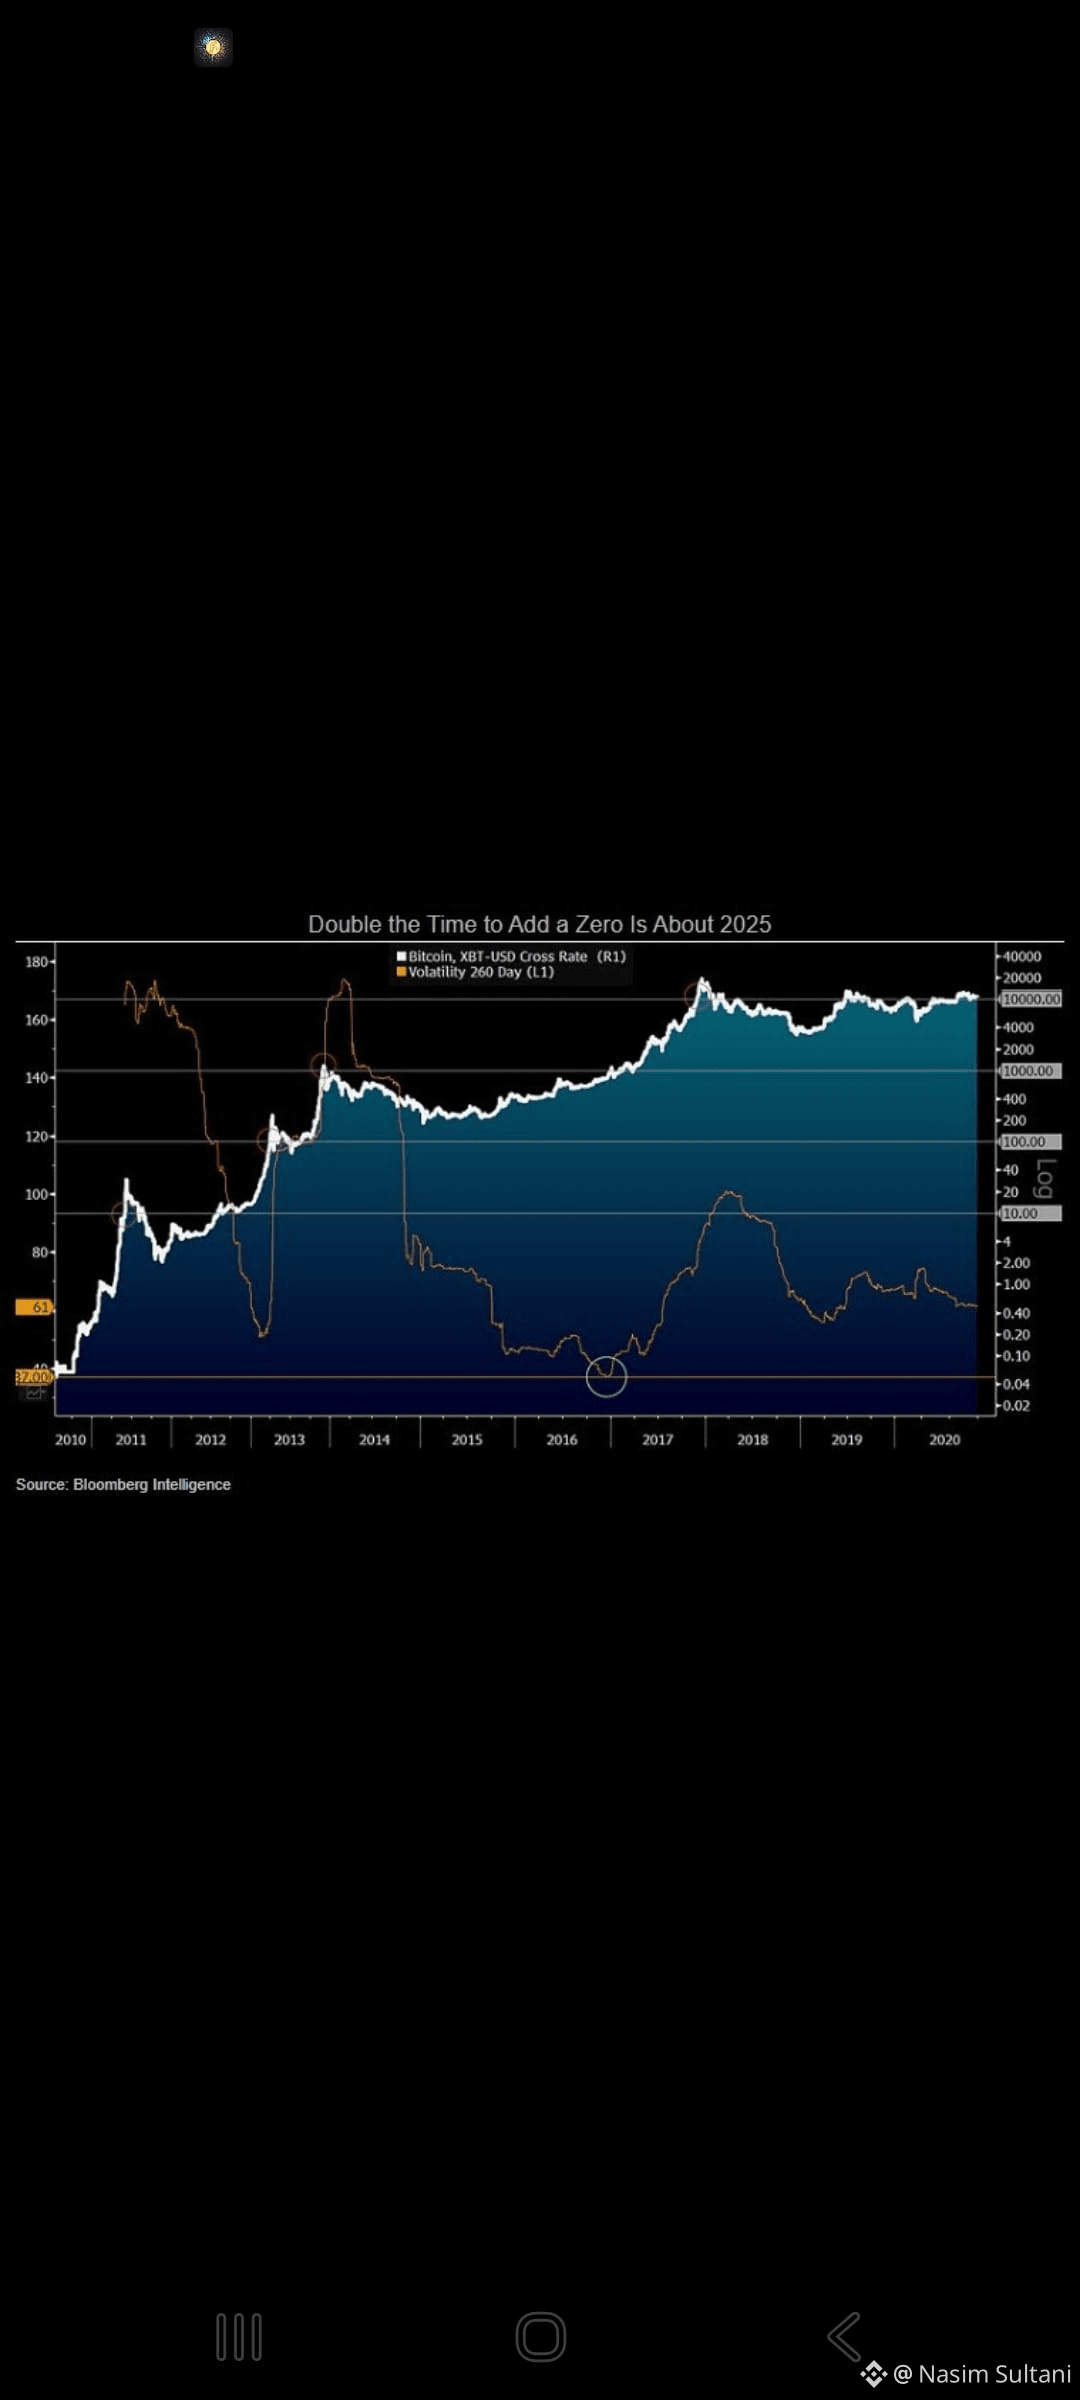
Here’s a short latest Bitcoin analysis (as of December 26, 2025):
📌 Current Price & Market Behavior
$BTC is trading sideways around ~$88,000–$90,000, showing consolidation after recent volatility. This range-bound action reflects thin holiday liquidity and cautious sentiment among traders.
• The market has lacked strong directional catalysts lately, with ETF outflows and limited institutional buying keeping BTC in a tight $85K–$90K range.
🔍 Technical Signals
• Analysts see this consolidation as potentially a base-building phase ahead of renewed volatility in early 2026 once liquidity returns.
• Key support sits near $85,000–$86,000, while breaking above $90,000–$94,000 would open the door toward further upside momentum.
📈 Bullish Case
• Some forecasts suggest a recovery toward $96,000–$100,000+ if technical momentum and ETF flows improve.
• Broader macro strength in assets like gold could help BTC rally if investors seek alternatives to cash.
📉 Bearish Considerations
• Previous strong cycles often saw significant corrections after peaks — one analysis even warned of deeper drawdowns if support breaks.
• Traders remain wary due to weak volume and holiday-thinned markets.
🔮 Outlook
Short term: Consolidation with cautious breakout watch.
Medium term (early 2026): Possible breakout if liquidity returns and macro catalysts align.
Long term: Analysts differ wildly, with some bullish forecasts into 2026–2027 and others more cautious.
🔁 Bitcoin remains a volatile and sentiment-driven asset — always consider risk management when trading or investing.
Would you like a simple price chart or a concise forecast table (bullish / bearish key levels)?
#BTCVSGOLD $BTC $BNB
Here’s a short latest Bitcoin analysis (as of December 26, 2025):
📌 Current Price & Market Behavior
$BTC is trading sideways around ~$88,000–$90,000, showing consolidation after recent volatility. This range-bound action reflects thin holiday liquidity and cautious sentiment among traders.
• The market has lacked strong directional catalysts lately, with ETF outflows and limited institutional buying keeping BTC in a tight $85K–$90K range.
🔍 Technical Signals
• Analysts see this consolidation as potentially a base-building phase ahead of renewed volatility in early 2026 once liquidity returns.
• Key support sits near $85,000–$86,000, while breaking above $90,000–$94,000 would open the door toward further upside momentum.
📈 Bullish Case
• Some forecasts suggest a recovery toward $96,000–$100,000+ if technical momentum and ETF flows improve.
• Broader macro strength in assets like gold could help BTC rally if investors seek alternatives to cash.
📉 Bearish Considerations
• Previous strong cycles often saw significant corrections after peaks — one analysis even warned of deeper drawdowns if support breaks.
• Traders remain wary due to weak volume and holiday-thinned markets.
🔮 Outlook
Short term: Consolidation with cautious breakout watch.
Medium term (early 2026): Possible breakout if liquidity returns and macro catalysts align.
Long term: Analysts differ wildly, with some bullish forecasts into 2026–2027 and others more cautious.
🔁 Bitcoin remains a volatile and sentiment-driven asset — always consider risk management when trading or investing.
Would you like a simple price chart or a concise forecast table (bullish / bearish key levels)?
#BTCVSGOLD $BTC $BNB
📌 Current Price & Market Behavior
$BTC is trading sideways around ~$88,000–$90,000, showing consolidation after recent volatility. This range-bound action reflects thin holiday liquidity and cautious sentiment among traders.
• The market has lacked strong directional catalysts lately, with ETF outflows and limited institutional buying keeping BTC in a tight $85K–$90K range.
🔍 Technical Signals
• Analysts see this consolidation as potentially a base-building phase ahead of renewed volatility in early 2026 once liquidity returns.
• Key support sits near $85,000–$86,000, while breaking above $90,000–$94,000 would open the door toward further upside momentum.
📈 Bullish Case
• Some forecasts suggest a recovery toward $96,000–$100,000+ if technical momentum and ETF flows improve.
• Broader macro strength in assets like gold could help BTC rally if investors seek alternatives to cash.
📉 Bearish Considerations
• Previous strong cycles often saw significant corrections after peaks — one analysis even warned of deeper drawdowns if support breaks.
• Traders remain wary due to weak volume and holiday-thinned markets.
🔮 Outlook
Short term: Consolidation with cautious breakout watch.
Medium term (early 2026): Possible breakout if liquidity returns and macro catalysts align.
Long term: Analysts differ wildly, with some bullish forecasts into 2026–2027 and others more cautious.
🔁 Bitcoin remains a volatile and sentiment-driven asset — always consider risk management when trading or investing.
Would you like a simple price chart or a concise forecast table (bullish / bearish key levels)?
#BTCVSGOLD $BTC $BNB
3
3
Übersetzung ansehen
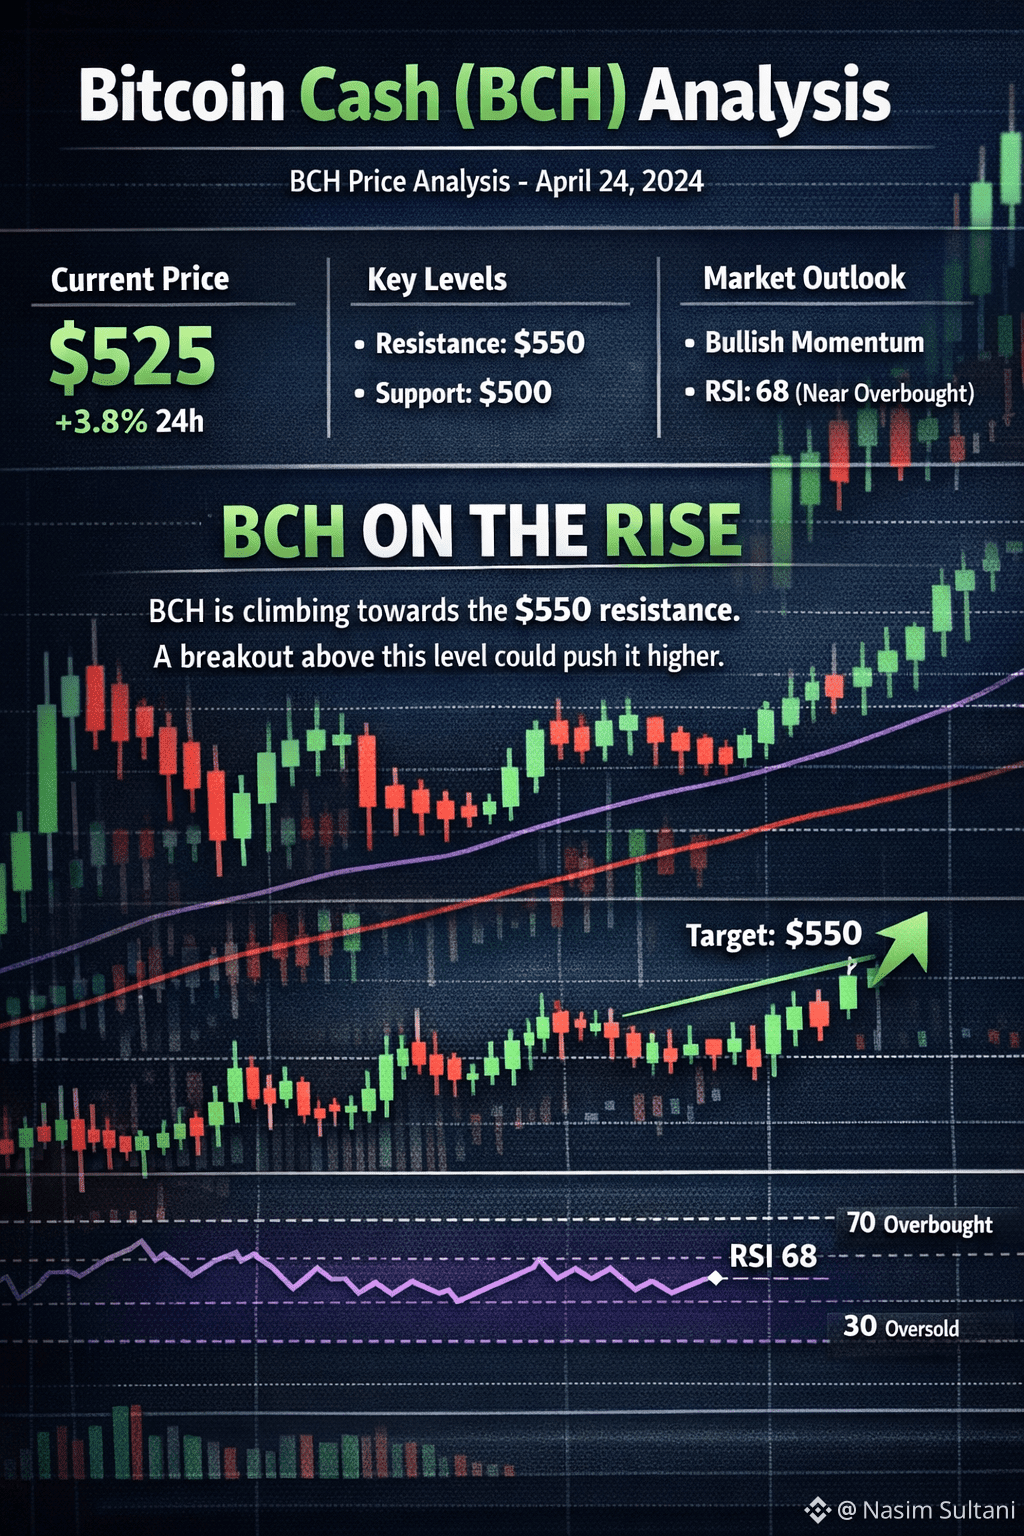
$BTC #Bitcoin Cash (BCH) – Short Latest Analysis
Bitcoin Cash (BCH) is currently showing stable consolidation after its recent move, with price action trading in a narrow range. This behavior suggests the market is deciding its next direction.
Trend: Neutral to slightly bullish as long as BCH holds above key support levels.
Momentum: Volume has cooled down, indicating reduced short-term volatility.
Resistance: A breakout above recent highs could trigger renewed buying interest.
Support: Strong buying interest is visible near recent pullback zones.
Outlook:
If overall crypto market sentiment remains positive, BCH may attempt a bullish continuation. However, failure to break resistance could result in sideways movement in the short term.
⚠️ Always manage risk and confirm with volume and market conditions before trading.
If you want, I can also add an analysis image or chart 📊
$BTC #Bitcoin Cash (BCH) – Short Latest Analysis
Bitcoin Cash (BCH) is currently showing stable consolidation after its recent move, with price action trading in a narrow range. This behavior suggests the market is deciding its next direction.
Trend: Neutral to slightly bullish as long as BCH holds above key support levels.
Momentum: Volume has cooled down, indicating reduced short-term volatility.
Resistance: A breakout above recent highs could trigger renewed buying interest.
Support: Strong buying interest is visible near recent pullback zones.
Outlook:
If overall crypto market sentiment remains positive, BCH may attempt a bullish continuation. However, failure to break resistance could result in sideways movement in the short term.
⚠️ Always manage risk and confirm with volume and market conditions before trading.
If you want, I can also add an analysis image or chart 📊
Bitcoin Cash (BCH) is currently showing stable consolidation after its recent move, with price action trading in a narrow range. This behavior suggests the market is deciding its next direction.
Trend: Neutral to slightly bullish as long as BCH holds above key support levels.
Momentum: Volume has cooled down, indicating reduced short-term volatility.
Resistance: A breakout above recent highs could trigger renewed buying interest.
Support: Strong buying interest is visible near recent pullback zones.
Outlook:
If overall crypto market sentiment remains positive, BCH may attempt a bullish continuation. However, failure to break resistance could result in sideways movement in the short term.
⚠️ Always manage risk and confirm with volume and market conditions before trading.
If you want, I can also add an analysis image or chart 📊
4
12
Übersetzung ansehen
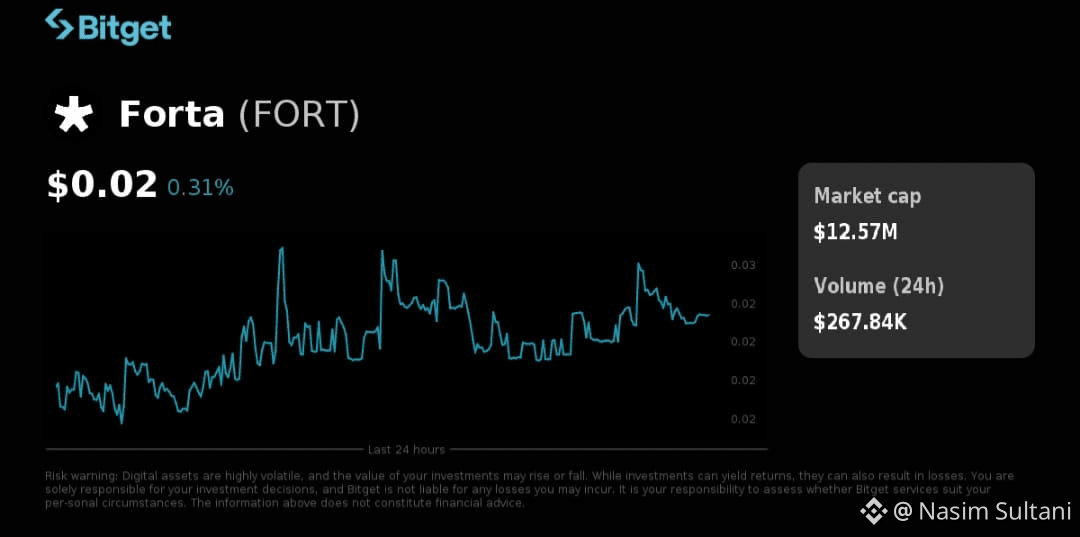
Here’s a short latest analysis on Forta (FORT) — including a current price snapshot and key trends:
📊 Forta (FORT) Current Market Overview
Price Trend: FORT has been trending lower recently, with prices around the $0.024 level and below key moving averages, signaling weak short-term momentum.
Market Sentiment: Broader crypto sentiment remains cautious with a high Bitcoin dominance, reducing capital flow into smaller altcoins like FORT.
Volume & Liquidity: Trading volume has dropped significantly in recent sessions, indicating lower market participation.
🔎 Bullish Factors
✅ Real-time on-chain security role: Forta’s network is used for threat detection and exploit alerts, and integrations with chains (e.g., Celo, injective rollups) continue to validate its utility.
✅ Institutional infrastructure potential: Forta is positioning itself as part of essential blockchain security infrastructure, which may support utility demand.
📉 Bearish / Risk Factors
❌ Technical resistance: FORT trading below its 7-day and 30-day SMAs suggests sellers are dominant.
❌ Altcoin downturn: Broader market risk-off conditions keep capital in Bitcoin and safer assets.
❌ Token supply pressure: Large unlocks from early holders could increase sell pressure if not balanced by strong demand.
🧠 Short-Term Watch Levels
📌 Support: Around key levels like $0.021-$0.022 – break below could lead to further declines.
📌 Resistance: A close above $0.025 would be a first sign of relief (short-term).
Summary: Forta’s security narrative and ecosystem integrations remain its core strengths, but price action is bearish amid weak market conditions and technical pressures. A turnaround likely needs either broader altcoin strength or new adoption catalysts.
💡 Note: This isn’t financial advice — always do your own research before trading.
Here’s a short latest analysis on Forta (FORT) — including a current price snapshot and key trends:
📊 Forta (FORT) Current Market Overview
Price Trend: FORT has been trending lower recently, with prices around the $0.024 level and below key moving averages, signaling weak short-term momentum.
Market Sentiment: Broader crypto sentiment remains cautious with a high Bitcoin dominance, reducing capital flow into smaller altcoins like FORT.
Volume & Liquidity: Trading volume has dropped significantly in recent sessions, indicating lower market participation.
🔎 Bullish Factors
✅ Real-time on-chain security role: Forta’s network is used for threat detection and exploit alerts, and integrations with chains (e.g., Celo, injective rollups) continue to validate its utility.
✅ Institutional infrastructure potential: Forta is positioning itself as part of essential blockchain security infrastructure, which may support utility demand.
📉 Bearish / Risk Factors
❌ Technical resistance: FORT trading below its 7-day and 30-day SMAs suggests sellers are dominant.
❌ Altcoin downturn: Broader market risk-off conditions keep capital in Bitcoin and safer assets.
❌ Token supply pressure: Large unlocks from early holders could increase sell pressure if not balanced by strong demand.
🧠 Short-Term Watch Levels
📌 Support: Around key levels like $0.021-$0.022 – break below could lead to further declines.
📌 Resistance: A close above $0.025 would be a first sign of relief (short-term).
Summary: Forta’s security narrative and ecosystem integrations remain its core strengths, but price action is bearish amid weak market conditions and technical pressures. A turnaround likely needs either broader altcoin strength or new adoption catalysts.
💡 Note: This isn’t financial advice — always do your own research before trading.
📊 Forta (FORT) Current Market Overview
Price Trend: FORT has been trending lower recently, with prices around the $0.024 level and below key moving averages, signaling weak short-term momentum.
Market Sentiment: Broader crypto sentiment remains cautious with a high Bitcoin dominance, reducing capital flow into smaller altcoins like FORT.
Volume & Liquidity: Trading volume has dropped significantly in recent sessions, indicating lower market participation.
🔎 Bullish Factors
✅ Real-time on-chain security role: Forta’s network is used for threat detection and exploit alerts, and integrations with chains (e.g., Celo, injective rollups) continue to validate its utility.
✅ Institutional infrastructure potential: Forta is positioning itself as part of essential blockchain security infrastructure, which may support utility demand.
📉 Bearish / Risk Factors
❌ Technical resistance: FORT trading below its 7-day and 30-day SMAs suggests sellers are dominant.
❌ Altcoin downturn: Broader market risk-off conditions keep capital in Bitcoin and safer assets.
❌ Token supply pressure: Large unlocks from early holders could increase sell pressure if not balanced by strong demand.
🧠 Short-Term Watch Levels
📌 Support: Around key levels like $0.021-$0.022 – break below could lead to further declines.
📌 Resistance: A close above $0.025 would be a first sign of relief (short-term).
Summary: Forta’s security narrative and ecosystem integrations remain its core strengths, but price action is bearish amid weak market conditions and technical pressures. A turnaround likely needs either broader altcoin strength or new adoption catalysts.
💡 Note: This isn’t financial advice — always do your own research before trading.
11
11
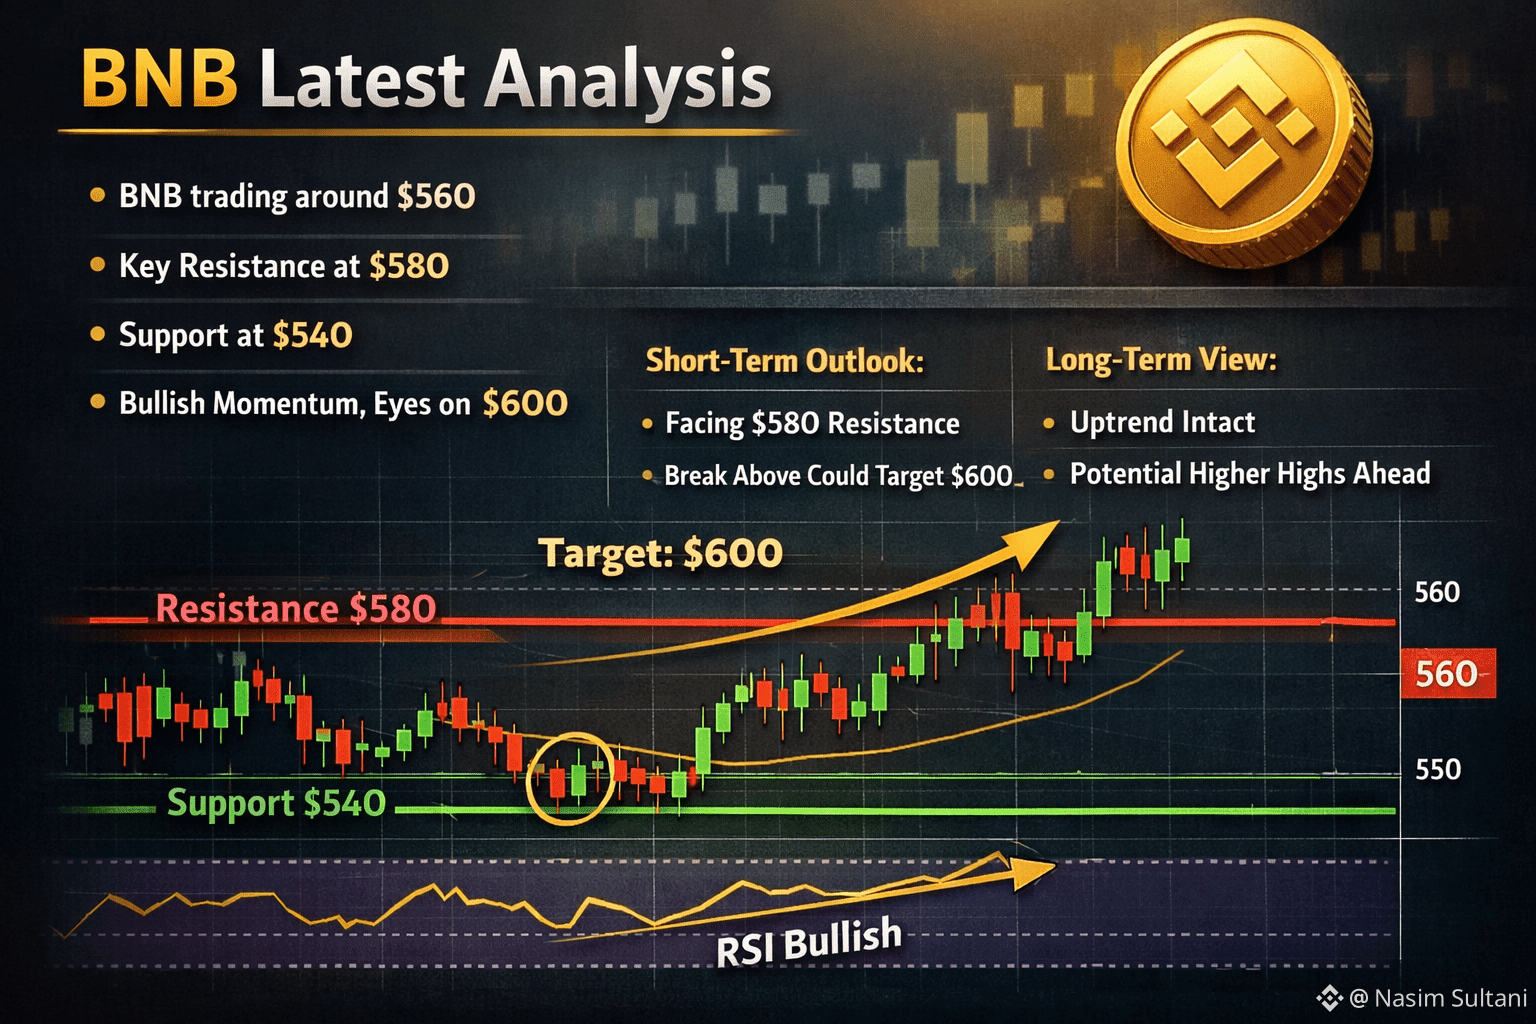
Hier ist eine kurze und aktuelle Marktanalyse für Bitcoin (BTC):
📊 Aktueller Preis & Struktur
$BNB BTC wird ruhig nahe ~$87.000–$88.000 gehandelt, Stand 25. Dezember, und zeigt eine Konsolidierung nach den jüngsten Schwankungen. Die Liquidität ist aufgrund der Feiertagssession niedrig.
• Die Marktentwicklung bleibt vorsichtig, da Zuflüsse/Ausflüsse in Spot-ETFs und makroökonomische Dynamiken (wie die Stärke des Goldes) aggressive Bewegungen dämpfen.
📈 Technische Perspektive
• Unterstützungszonen: BTC hält sich über der wichtigen Unterstützung in der Mitte des $80K-Bereichs — eine Basis für potenzielle Rückschläge.
• Widerstandsniveaus: Der kurzfristige Widerstand liegt nahe den vorherigen Reaktionshochs knapp über dem aktuellen Preisbereich. Ein sauberer Ausbruch darüber könnte das Momentum bullish wenden.
📌 Marktsentiment
• Investoren beobachten makroökonomische Signale genau — Rückgänge bei der ETF-Nachfrage und allgemeine Vorsicht bei risikobehafteten Anlagen belasten BTC.
• Saisonale Feiertagsvolatilität und dünnerer Handel könnten weiterhin dazu führen, dass die Preisbewegung in einem seitwärts bis leicht bullishen Bereich bleibt, es sei denn, ein Katalysator tritt auf.
💡 Zusammenfassung (Kurzfristig)
Neutral–leicht bullish Konsolidierung — BTC bildet eine Basis um die aktuellen Niveaus, wobei das Upside von Ausbrüchen über den nahegelegenen Widerstand und erneuerter institutioneller Nachfrage abhängt.
Wenn Sie möchten, kann ich ein einfaches Preisdiagramm-Bild hinzufügen, um diese Analyse zu begleiten!
#BNBChainEcosystemRally #BinanceAlphaAlert
Hier ist eine kurze und aktuelle Marktanalyse für Bitcoin (BTC):
📊 Aktueller Preis & Struktur
$BNB BTC wird ruhig nahe ~$87.000–$88.000 gehandelt, Stand 25. Dezember, und zeigt eine Konsolidierung nach den jüngsten Schwankungen. Die Liquidität ist aufgrund der Feiertagssession niedrig.
• Die Marktentwicklung bleibt vorsichtig, da Zuflüsse/Ausflüsse in Spot-ETFs und makroökonomische Dynamiken (wie die Stärke des Goldes) aggressive Bewegungen dämpfen.
📈 Technische Perspektive
• Unterstützungszonen: BTC hält sich über der wichtigen Unterstützung in der Mitte des $80K-Bereichs — eine Basis für potenzielle Rückschläge.
• Widerstandsniveaus: Der kurzfristige Widerstand liegt nahe den vorherigen Reaktionshochs knapp über dem aktuellen Preisbereich. Ein sauberer Ausbruch darüber könnte das Momentum bullish wenden.
📌 Marktsentiment
• Investoren beobachten makroökonomische Signale genau — Rückgänge bei der ETF-Nachfrage und allgemeine Vorsicht bei risikobehafteten Anlagen belasten BTC.
• Saisonale Feiertagsvolatilität und dünnerer Handel könnten weiterhin dazu führen, dass die Preisbewegung in einem seitwärts bis leicht bullishen Bereich bleibt, es sei denn, ein Katalysator tritt auf.
💡 Zusammenfassung (Kurzfristig)
Neutral–leicht bullish Konsolidierung — BTC bildet eine Basis um die aktuellen Niveaus, wobei das Upside von Ausbrüchen über den nahegelegenen Widerstand und erneuerter institutioneller Nachfrage abhängt.
Wenn Sie möchten, kann ich ein einfaches Preisdiagramm-Bild hinzufügen, um diese Analyse zu begleiten!
#BNBChainEcosystemRally #BinanceAlphaAlert
📊 Aktueller Preis & Struktur
$BNB BTC wird ruhig nahe ~$87.000–$88.000 gehandelt, Stand 25. Dezember, und zeigt eine Konsolidierung nach den jüngsten Schwankungen. Die Liquidität ist aufgrund der Feiertagssession niedrig.
• Die Marktentwicklung bleibt vorsichtig, da Zuflüsse/Ausflüsse in Spot-ETFs und makroökonomische Dynamiken (wie die Stärke des Goldes) aggressive Bewegungen dämpfen.
📈 Technische Perspektive
• Unterstützungszonen: BTC hält sich über der wichtigen Unterstützung in der Mitte des $80K-Bereichs — eine Basis für potenzielle Rückschläge.
• Widerstandsniveaus: Der kurzfristige Widerstand liegt nahe den vorherigen Reaktionshochs knapp über dem aktuellen Preisbereich. Ein sauberer Ausbruch darüber könnte das Momentum bullish wenden.
📌 Marktsentiment
• Investoren beobachten makroökonomische Signale genau — Rückgänge bei der ETF-Nachfrage und allgemeine Vorsicht bei risikobehafteten Anlagen belasten BTC.
• Saisonale Feiertagsvolatilität und dünnerer Handel könnten weiterhin dazu führen, dass die Preisbewegung in einem seitwärts bis leicht bullishen Bereich bleibt, es sei denn, ein Katalysator tritt auf.
💡 Zusammenfassung (Kurzfristig)
Neutral–leicht bullish Konsolidierung — BTC bildet eine Basis um die aktuellen Niveaus, wobei das Upside von Ausbrüchen über den nahegelegenen Widerstand und erneuerter institutioneller Nachfrage abhängt.
Wenn Sie möchten, kann ich ein einfaches Preisdiagramm-Bild hinzufügen, um diese Analyse zu begleiten!
#BNBChainEcosystemRally #BinanceAlphaAlert
8
14
Übersetzung ansehen
Here’s a short, up-to-date Bitcoin market analysis with a current price snapshot:
📊 Bitcoin Market Overview (Dec 25, 2025)
Price Action & Sentiment
$BTC is trading in a range roughly mid-$80k to low-$90k amid thin holiday liquidity and cautious sentiment. Traders are watching how ETF flows and options expiries influence volatility.
The broader crypto market has shown downside pressure recently, with a short-term market cap pullback and elevated fear metrics.
Some analysts see price consolidating under key resistance with the possibility of breakouts if bullish momentum returns.
Technical Outlook
Resistance zones: Around the low-$90k range — a barrier that Bitcoin has tested repeatedly this month.
Support levels: Strong bids in the $80k–$83k area, acting as a floor for downside moves.
Mixed signals from technical indicators suggest short-term swings with both upside and downside scenarios possible.
Price Predictions
Some forecasts point to near-term strength toward ~ $92k–$95k if resistance breaks and volatility eases.
Longer-term year-end targets from analysts and institutions vary widely, with some bullish forecasts above six figures and others more cautious.
Key Drivers to Watch
ETF flows and institutional demand — inflows or outflows greatly affect liquidity and trend direction.
Macro conditions (rate decisions, equities sentiment) — these help shape risk appetite across crypto markets.
Whale behavior — significant selling or accumulation by large holders can shift momentum.
Short Summary:
Bitcoin remains in a consolidation phase near mid-$80k to low-$90k with mixed signals. Bullish breakouts could push towards higher levels if liquidity picks up, while downside stays possible if selling pressure increases.
Would you like a trading strategy overview (support/resistance + entry/exit levels)?
#BitcoinETFMajorInflows #GoldPriceRecordHigh
Here’s a short, up-to-date Bitcoin market analysis with a current price snapshot:
📊 Bitcoin Market Overview (Dec 25, 2025)
Price Action & Sentiment
$BTC is trading in a range roughly mid-$80k to low-$90k amid thin holiday liquidity and cautious sentiment. Traders are watching how ETF flows and options expiries influence volatility.
The broader crypto market has shown downside pressure recently, with a short-term market cap pullback and elevated fear metrics.
Some analysts see price consolidating under key resistance with the possibility of breakouts if bullish momentum returns.
Technical Outlook
Resistance zones: Around the low-$90k range — a barrier that Bitcoin has tested repeatedly this month.
Support levels: Strong bids in the $80k–$83k area, acting as a floor for downside moves.
Mixed signals from technical indicators suggest short-term swings with both upside and downside scenarios possible.
Price Predictions
Some forecasts point to near-term strength toward ~ $92k–$95k if resistance breaks and volatility eases.
Longer-term year-end targets from analysts and institutions vary widely, with some bullish forecasts above six figures and others more cautious.
Key Drivers to Watch
ETF flows and institutional demand — inflows or outflows greatly affect liquidity and trend direction.
Macro conditions (rate decisions, equities sentiment) — these help shape risk appetite across crypto markets.
Whale behavior — significant selling or accumulation by large holders can shift momentum.
Short Summary:
Bitcoin remains in a consolidation phase near mid-$80k to low-$90k with mixed signals. Bullish breakouts could push towards higher levels if liquidity picks up, while downside stays possible if selling pressure increases.
Would you like a trading strategy overview (support/resistance + entry/exit levels)?
#BitcoinETFMajorInflows #GoldPriceRecordHigh
📊 Bitcoin Market Overview (Dec 25, 2025)
Price Action & Sentiment
$BTC is trading in a range roughly mid-$80k to low-$90k amid thin holiday liquidity and cautious sentiment. Traders are watching how ETF flows and options expiries influence volatility.
The broader crypto market has shown downside pressure recently, with a short-term market cap pullback and elevated fear metrics.
Some analysts see price consolidating under key resistance with the possibility of breakouts if bullish momentum returns.
Technical Outlook
Resistance zones: Around the low-$90k range — a barrier that Bitcoin has tested repeatedly this month.
Support levels: Strong bids in the $80k–$83k area, acting as a floor for downside moves.
Mixed signals from technical indicators suggest short-term swings with both upside and downside scenarios possible.
Price Predictions
Some forecasts point to near-term strength toward ~ $92k–$95k if resistance breaks and volatility eases.
Longer-term year-end targets from analysts and institutions vary widely, with some bullish forecasts above six figures and others more cautious.
Key Drivers to Watch
ETF flows and institutional demand — inflows or outflows greatly affect liquidity and trend direction.
Macro conditions (rate decisions, equities sentiment) — these help shape risk appetite across crypto markets.
Whale behavior — significant selling or accumulation by large holders can shift momentum.
Short Summary:
Bitcoin remains in a consolidation phase near mid-$80k to low-$90k with mixed signals. Bullish breakouts could push towards higher levels if liquidity picks up, while downside stays possible if selling pressure increases.
Would you like a trading strategy overview (support/resistance + entry/exit levels)?
#BitcoinETFMajorInflows #GoldPriceRecordHigh
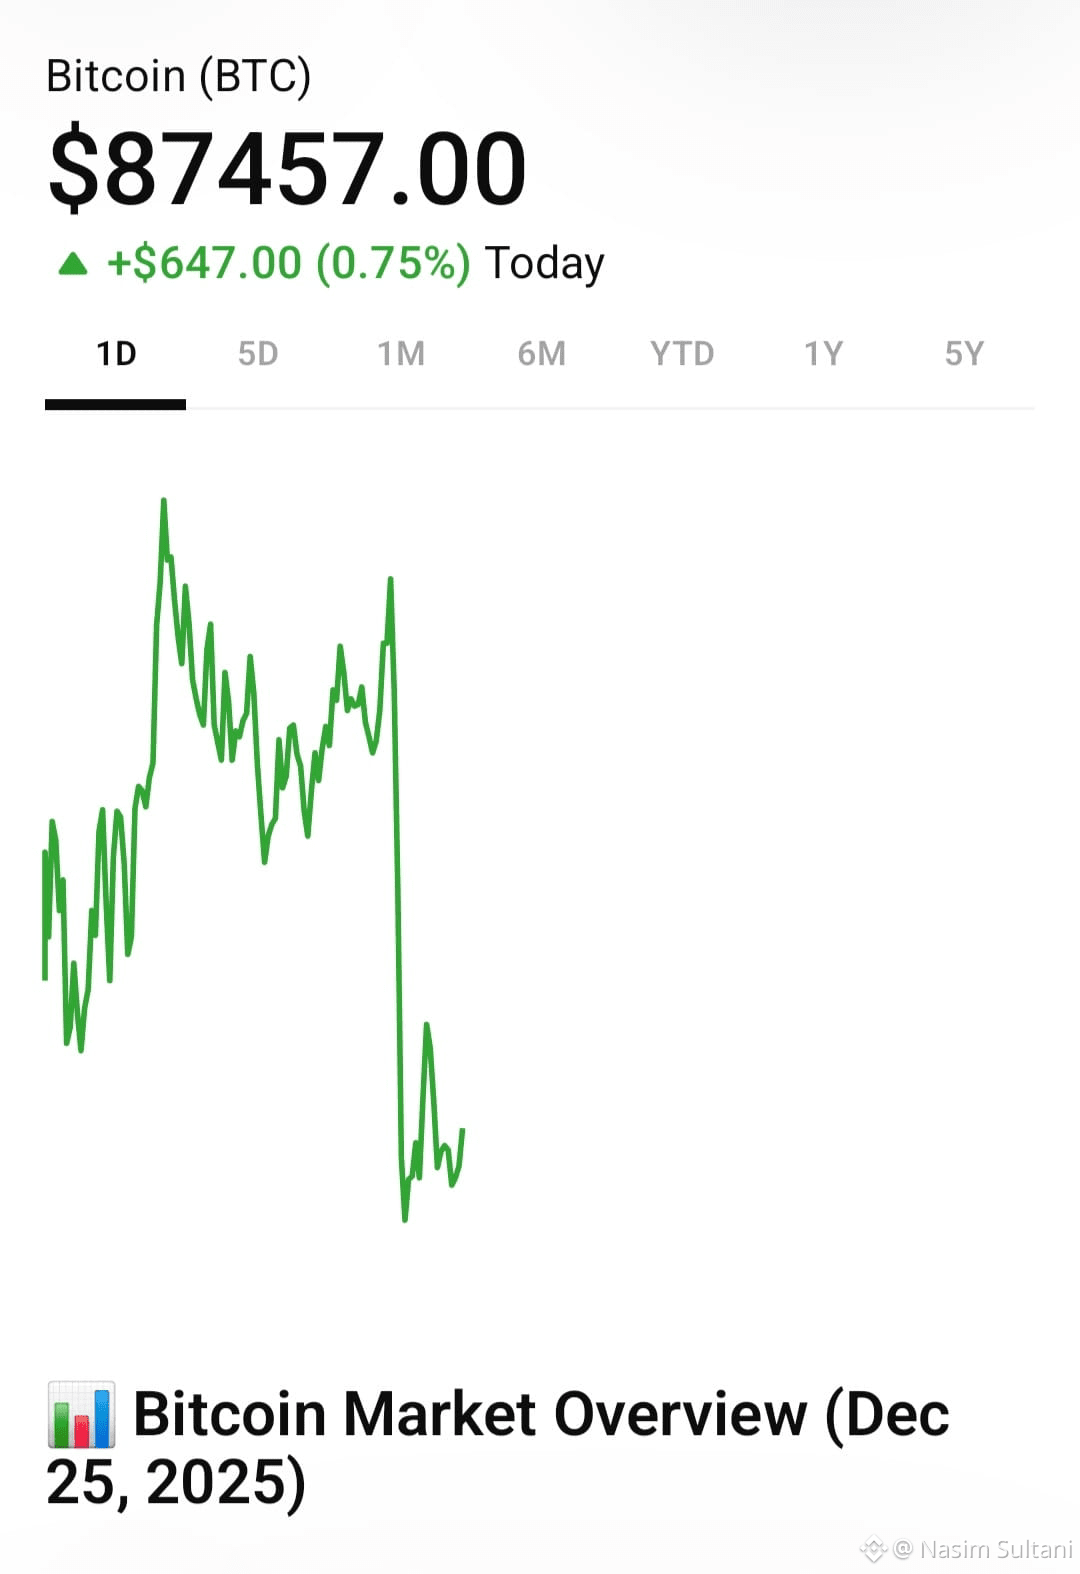
13
20
Anmelden und weiter Inhalte entdecken
Krypto-Nutzer weltweit auf Binance Square kennenlernen
⚡️ Bleib in Sachen Krypto stets am Puls.
💬 Die weltgrößte Kryptobörse vertraut darauf.
👍 Erhalte verlässliche Einblicke von verifizierten Creators.
E-Mail-Adresse/Telefonnummer