

SHINY SARA ROBIN
14.4k Beiträge

SHINY SARA ROBIN
Melden
Nutzer blockieren
" sucess is a best way for revenge "
495 Following
3.1K+ Follower
2.3K+ Like gegeben
Beiträge
Alle
Zitierungen
Videos
Live
·
--
Bullisch
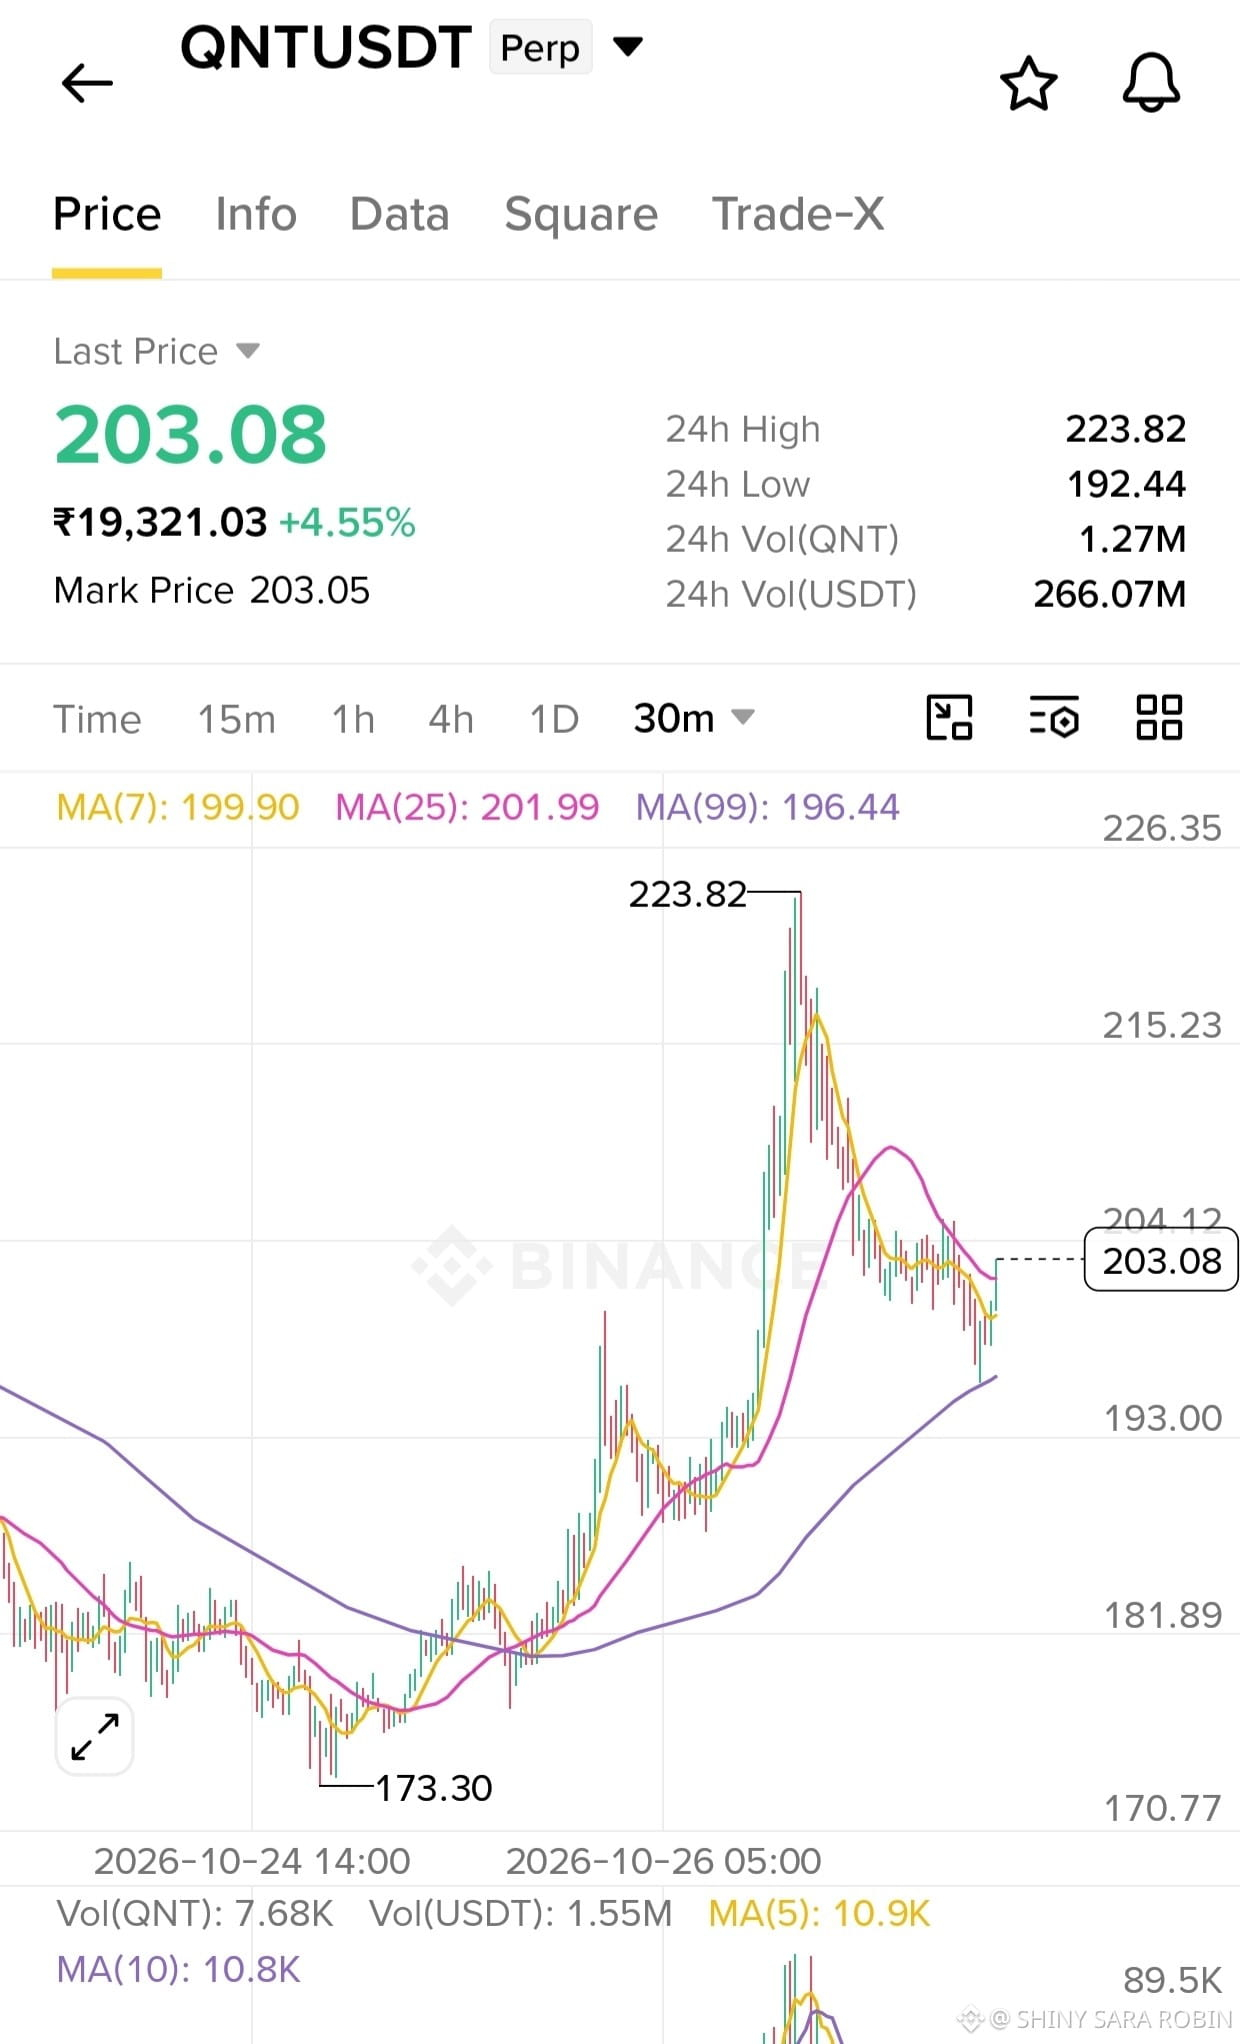
QNT/USDT LONG
Einstiegszone: 200.50 – 204.00 USDT
Stop-Loss (SL): 194.00 USDT
TP1: 212.00 USDT
TP2: 220.00 USDT
TP3: 230.00 USDT
QNT wird laut den neuesten verfügbaren Marktdaten bei etwa 203–204 $ gehandelt. Der übergeordnete Trend bleibt bullisch, doch der Kurs hat zuletzt starke Schwankungen zwischen etwa 178 und 224 $ gezeigt. Für weitere Kursanstiege müssen die Widerstände bei 212 und 220 überwunden werden.
$QNT
{future}(QNTUSDT)
QNT/USDT LONG
Einstiegszone: 200.50 – 204.00 USDT
Stop-Loss (SL): 194.00 USDT
TP1: 212.00 USDT
TP2: 220.00 USDT
TP3: 230.00 USDT
QNT wird laut den neuesten verfügbaren Marktdaten bei etwa 203–204 $ gehandelt. Der übergeordnete Trend bleibt bullisch, doch der Kurs hat zuletzt starke Schwankungen zwischen etwa 178 und 224 $ gezeigt. Für weitere Kursanstiege müssen die Widerstände bei 212 und 220 überwunden werden.
$QNT
6
·
--
Bullisch
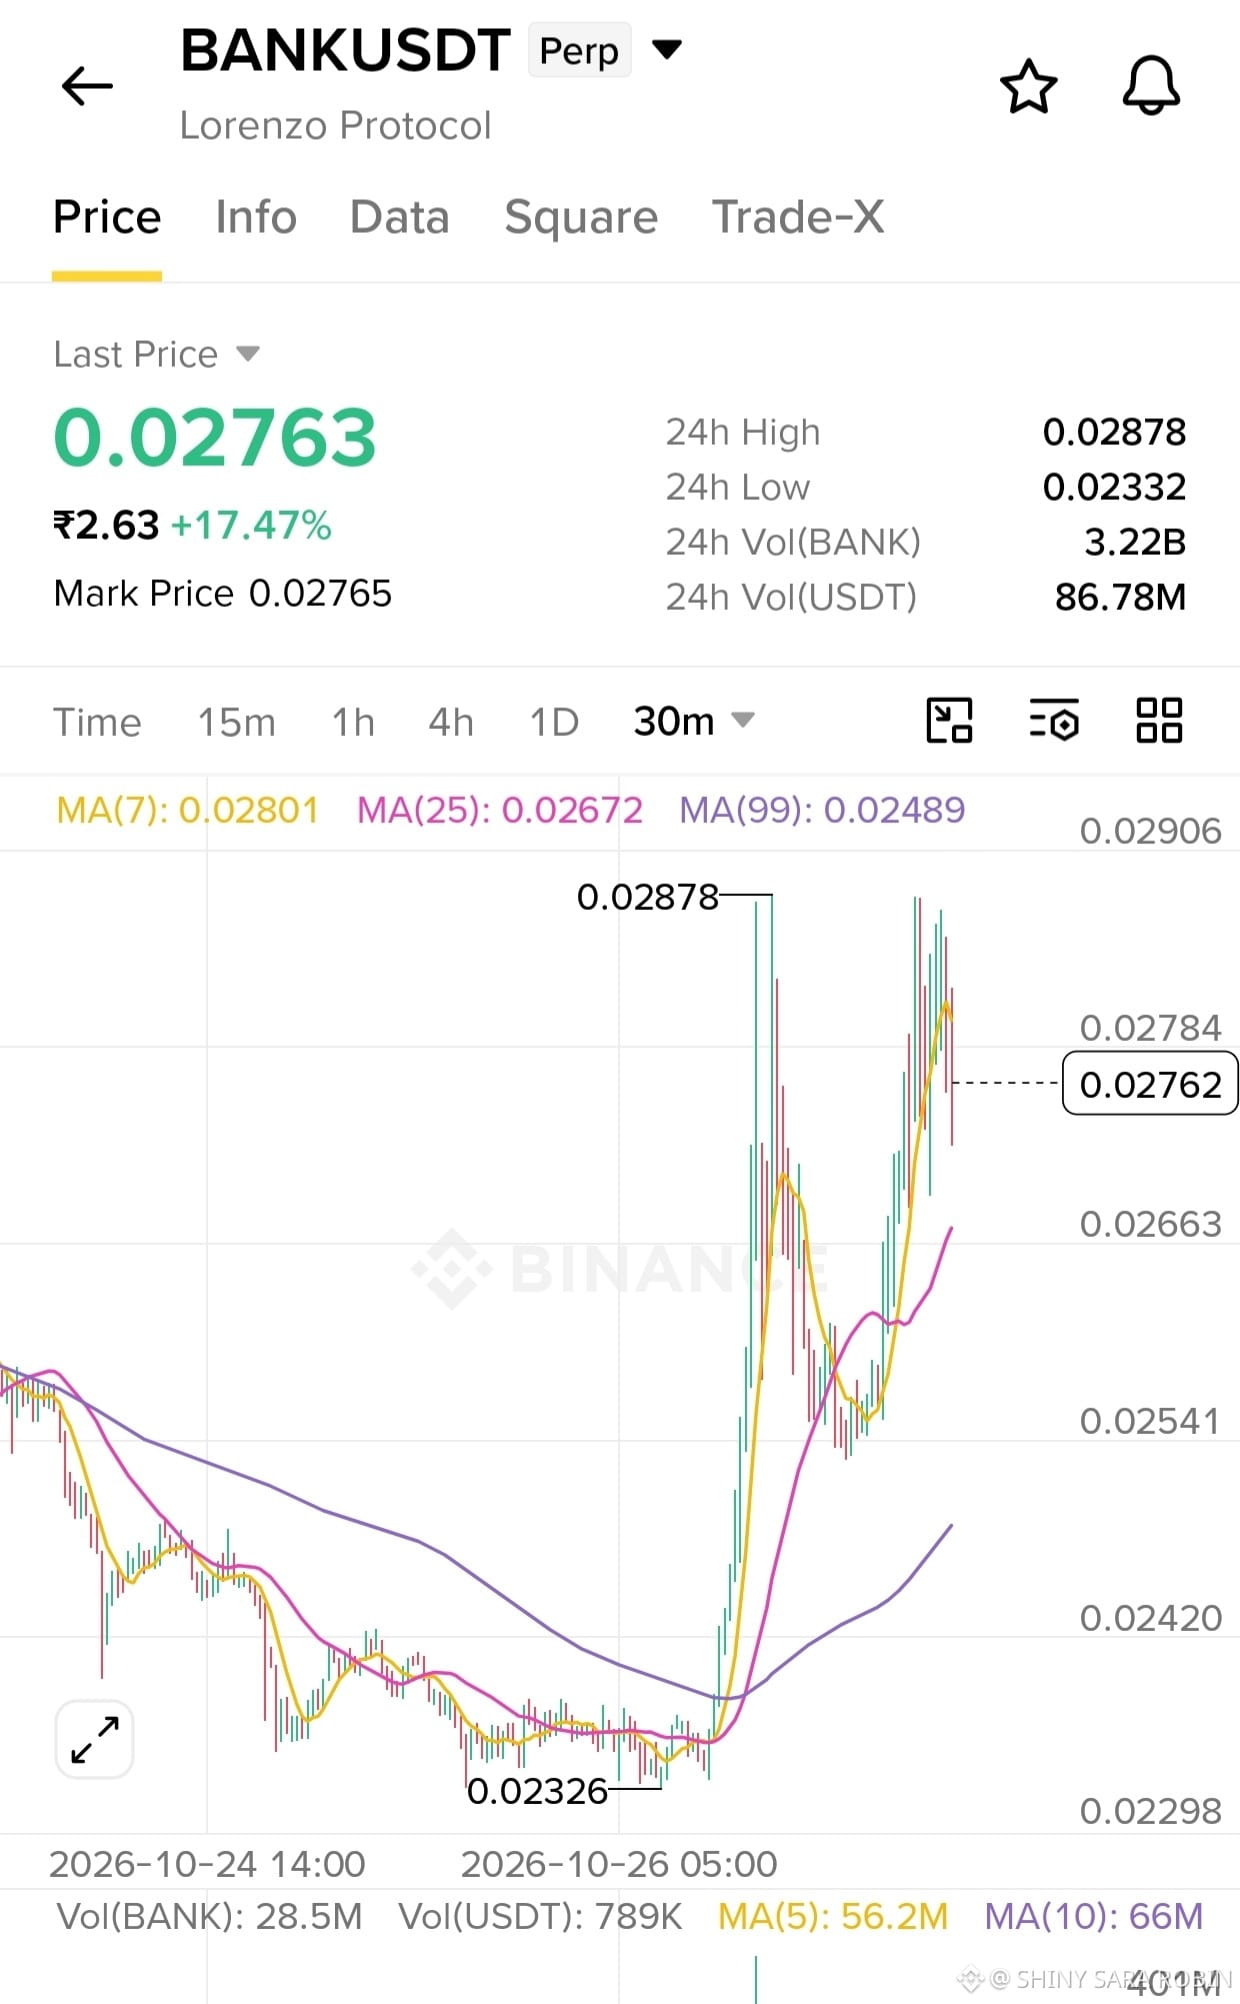
BANK/USDT LONG
Einstiegszone: 0,02650 – 0,02700
Stop-Loss (SL): 0,02530
Gewinnziel 1: 0,02800
Gewinnziel 2: 0,02880
Gewinnziel 3: 0,03000
BANK wird bei etwa 0,02763 gehandelt und liegt innerhalb von 24 Stunden rund 17,47 % im Plus. Der Kurs erholte sich deutlich vom Tief bei 0,02326 und stieg über den MA25 bei 0,02672 und den MA99 bei 0,02489. Dies deutet darauf hin, dass die Käufer kurzfristig wieder die Kontrolle übernommen haben.
$BANK
{future}(BANKUSDT)
BANK/USDT LONG
Einstiegszone: 0,02650 – 0,02700
Stop-Loss (SL): 0,02530
Gewinnziel 1: 0,02800
Gewinnziel 2: 0,02880
Gewinnziel 3: 0,03000
BANK wird bei etwa 0,02763 gehandelt und liegt innerhalb von 24 Stunden rund 17,47 % im Plus. Der Kurs erholte sich deutlich vom Tief bei 0,02326 und stieg über den MA25 bei 0,02672 und den MA99 bei 0,02489. Dies deutet darauf hin, dass die Käufer kurzfristig wieder die Kontrolle übernommen haben.
$BANK
8
·
--
Bullisch
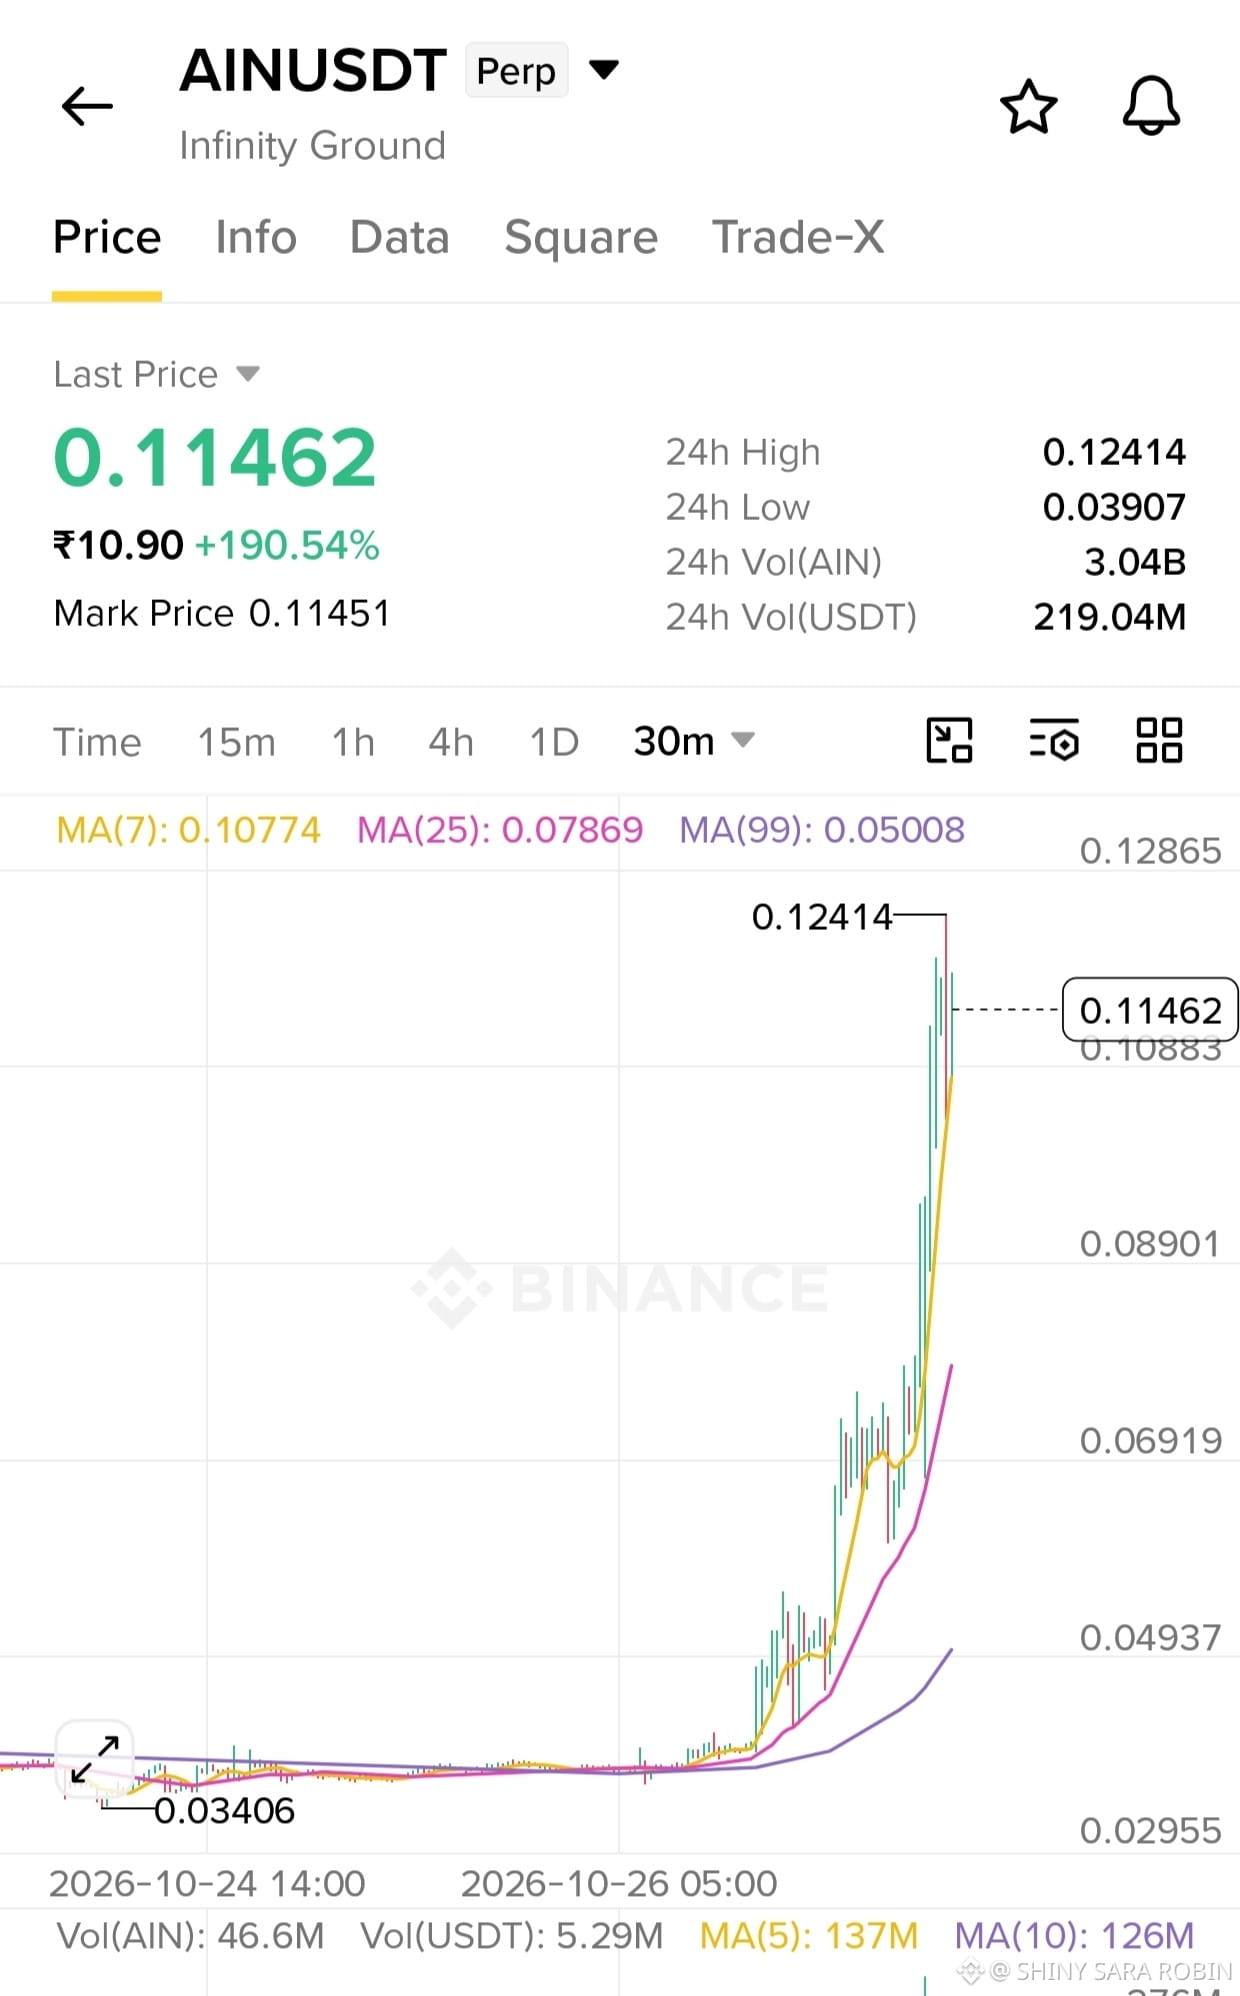
AIN/USDT LONG
Einstiegszone: 0.10650 – 0.10900
Stop-Loss (SL): 0.10100
Kursziel 1: 0.11600
Kursziel 2: 0.12100
Kursziel 3: 0.12800
AIN ist innerhalb von 24 Stunden um etwa 190 % gestiegen und kletterte ausgehend vom Bereich um 0.03 auf ein Hoch von 0.12414. Der Kurs liegt derzeit bei 0.11462 und damit über allen drei gleitenden Durchschnitten (MA7: 0.10774, MA25: 0.07869, MA99: 0.05008), was auf eine starke Aufwärtsdynamik hindeutet.
$AIN
{future}(AINUSDT)
AIN/USDT LONG
Einstiegszone: 0.10650 – 0.10900
Stop-Loss (SL): 0.10100
Kursziel 1: 0.11600
Kursziel 2: 0.12100
Kursziel 3: 0.12800
AIN ist innerhalb von 24 Stunden um etwa 190 % gestiegen und kletterte ausgehend vom Bereich um 0.03 auf ein Hoch von 0.12414. Der Kurs liegt derzeit bei 0.11462 und damit über allen drei gleitenden Durchschnitten (MA7: 0.10774, MA25: 0.07869, MA99: 0.05008), was auf eine starke Aufwärtsdynamik hindeutet.
$AIN
10
·
--
Bullisch
Übersetzung ansehen
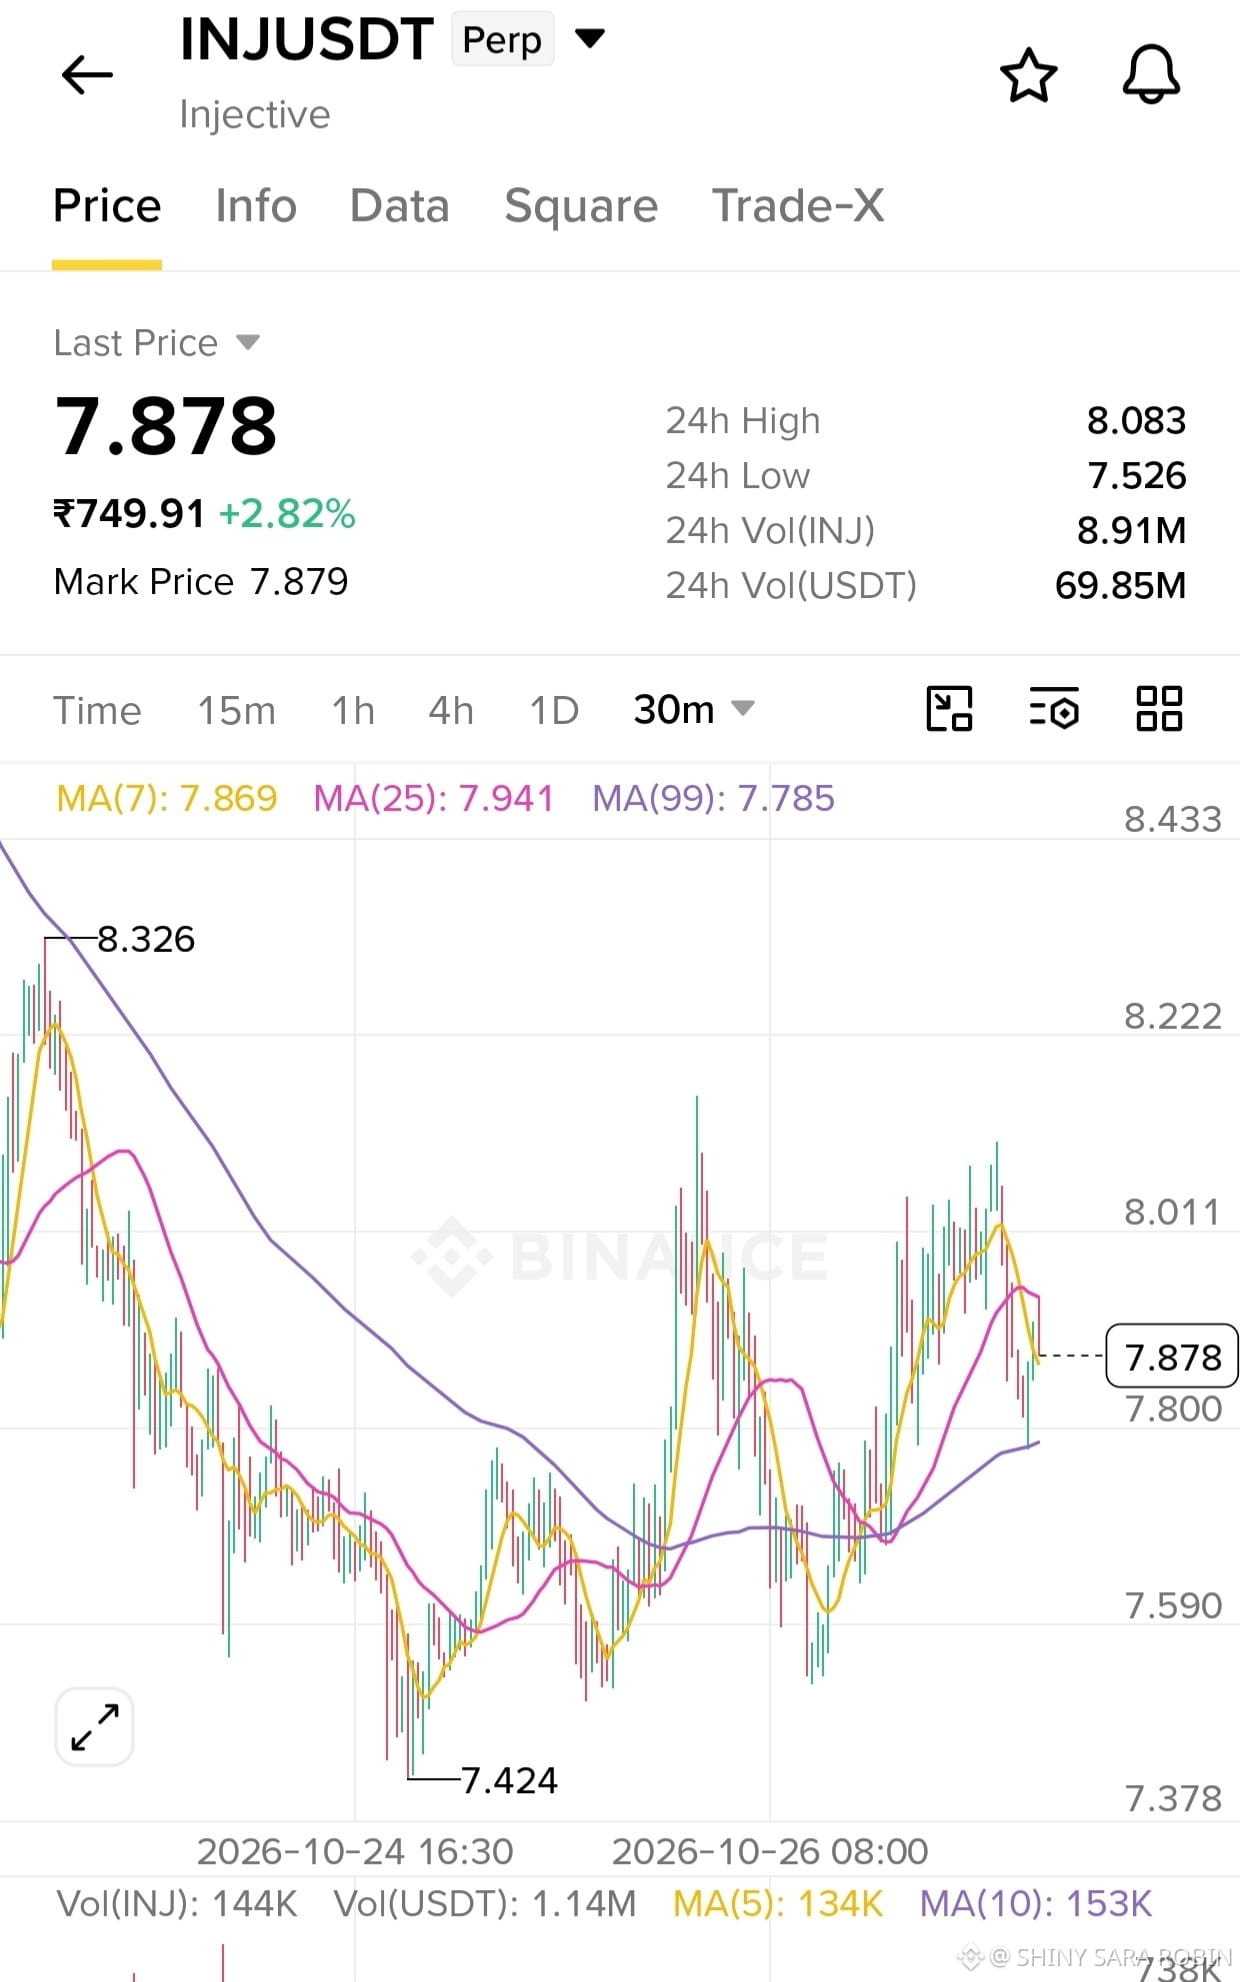
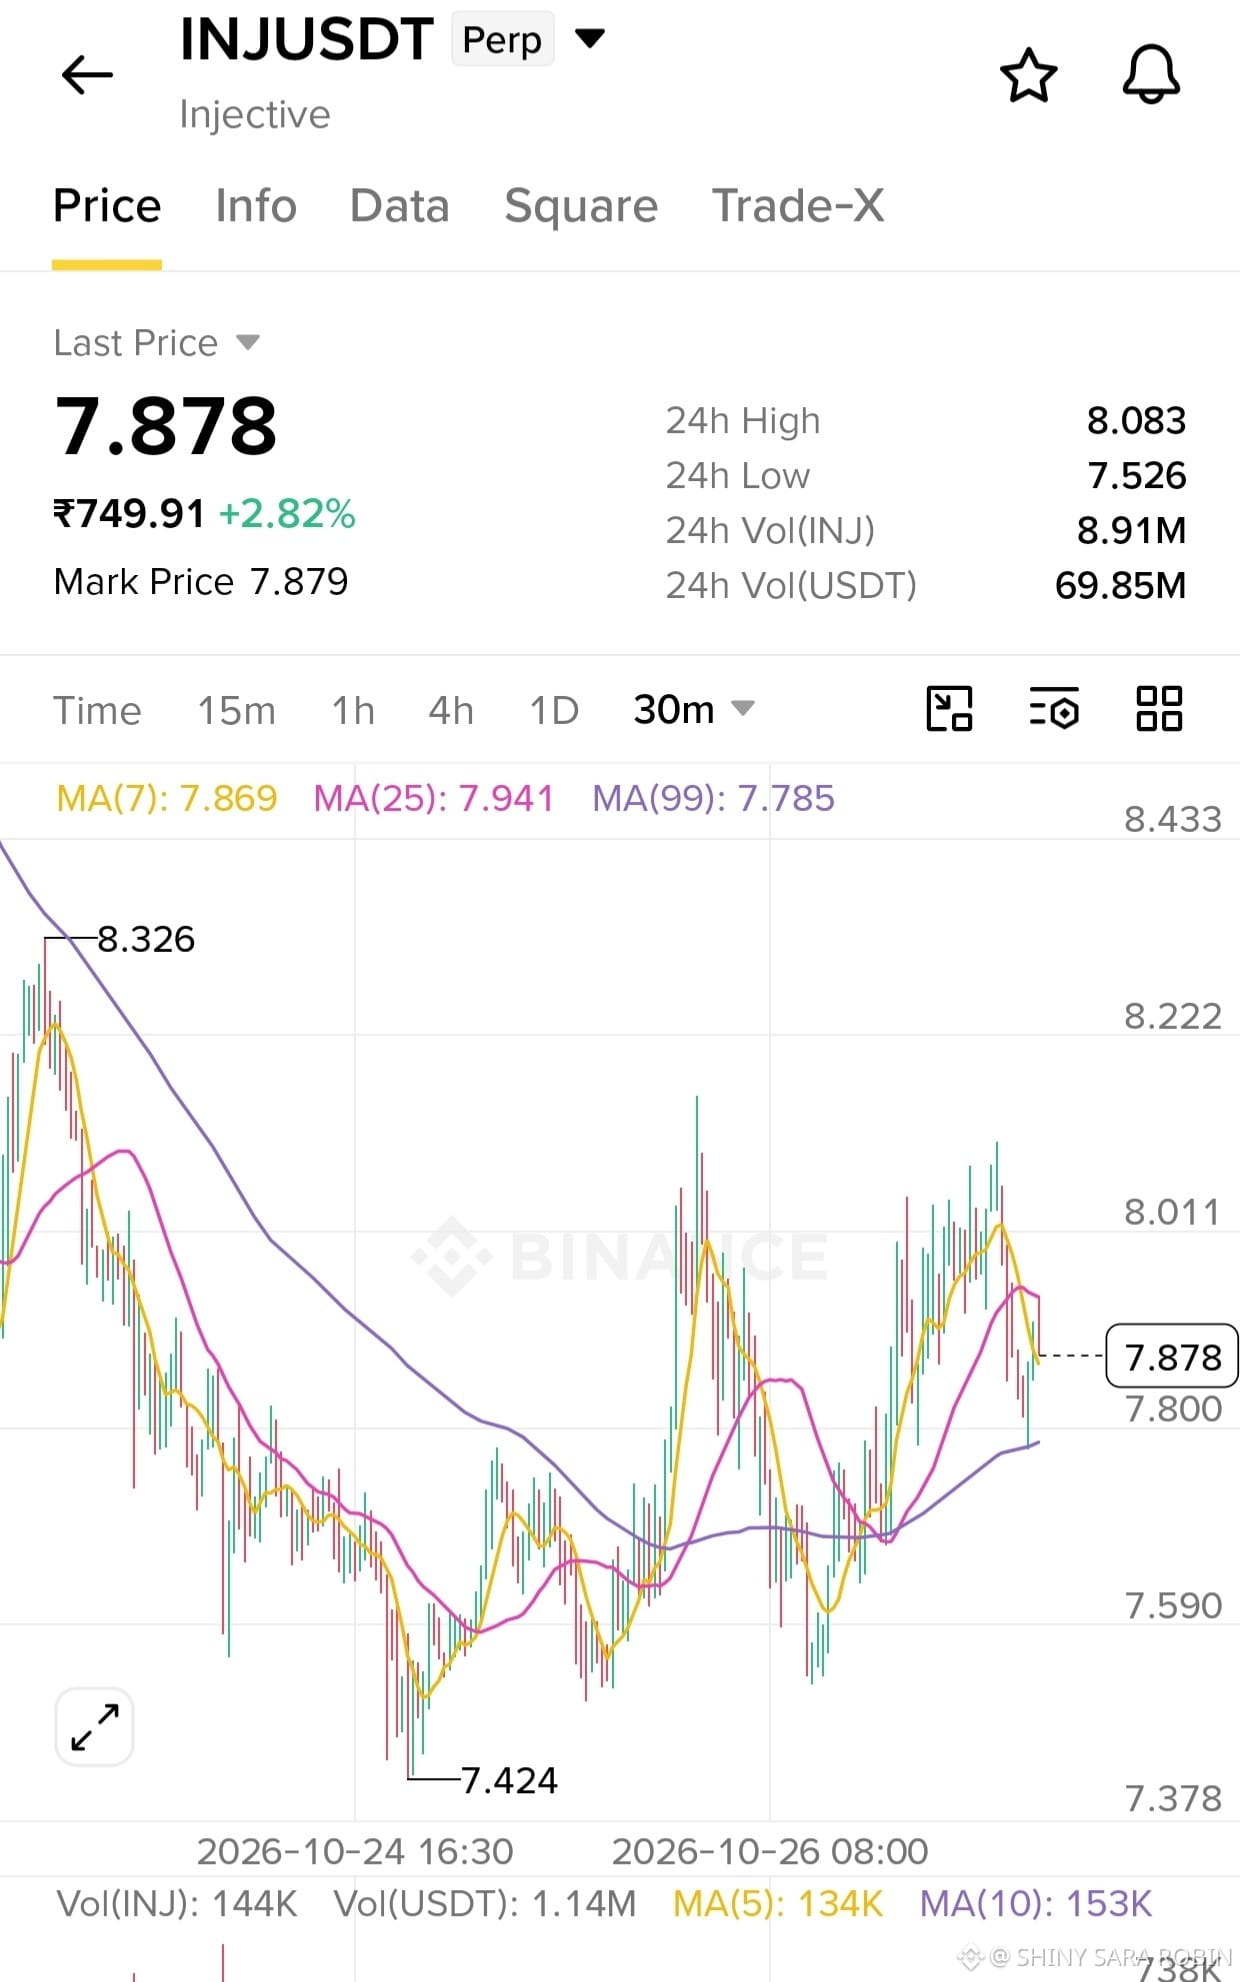
😂 INJ/USDT: The Comeback Kid Is Fighting With Its Own Moving Averages! 🚀📉
INJ is trading around $7.878, up 2.82%, and trying to convince the market that its comeback is real! After falling from $8.326 to $7.424, INJ has started recovering, but the journey isn't exactly smooth. 😅
The price is holding above the MA(99) near $7.785, which gives bulls some hope. However, the MA(25) around $7.941 is acting like a strict security guard refusing to let the price pass. 🛂😂
What's next? 👀
If INJ breaks above $7.94 and holds that level with strong volume, the next challenges could be $8.00, $8.08, and potentially $8.25. But if it loses support around $7.78, sellers could take control again.
For now, INJ is standing at the door of recovery, knocking loudly but still waiting to be let in! 🔔🔥
Remember: Confirmation first, FOMO later. The market doesn't pay us for guessing! 💰
#İNJ #injective #CryptoMarket #Binance #CryptoTrading
8
·
--
Bullisch
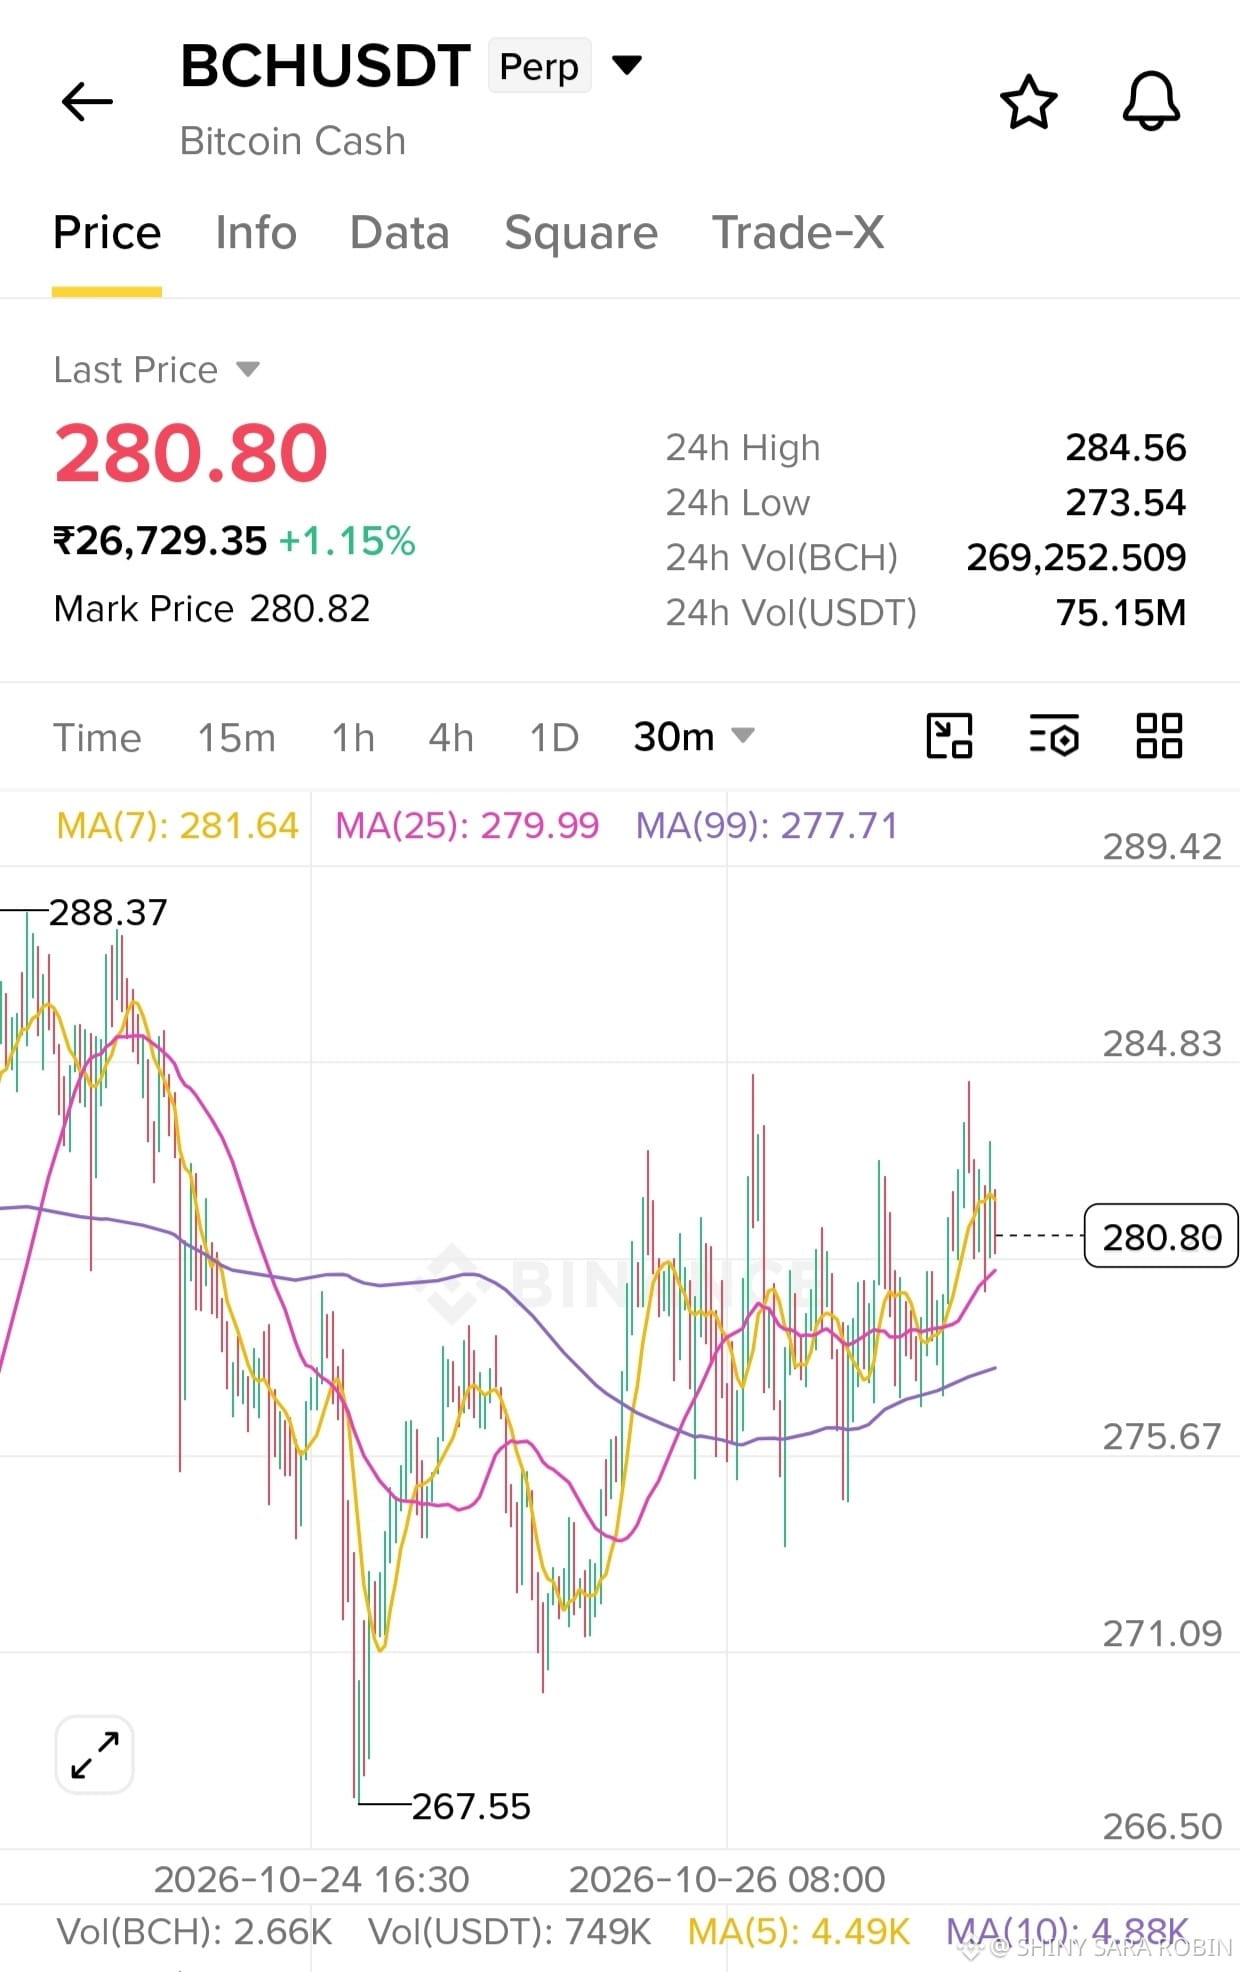
BCH/USDT LONG (max. 10x)
Einstieg: 279.50 – 280.50
TP1: 282.00
TP2: 284.50
TP3: 287.00
Stop-Loss: 277.00
BCH hält sich über dem MA(25) bei 279.99 und dem MA(99) bei 277.71, was auf eine kurzfristige Erholung hindeutet. Der Widerstand liegt bei etwa 284.50, nahe dem jüngsten Hoch. Ein erfolgreicher Halt über 279.50 würde das Long-Setup stützen.
$BCH
{future}(BCHUSDT)
BCH/USDT LONG (max. 10x)
Einstieg: 279.50 – 280.50
TP1: 282.00
TP2: 284.50
TP3: 287.00
Stop-Loss: 277.00
BCH hält sich über dem MA(25) bei 279.99 und dem MA(99) bei 277.71, was auf eine kurzfristige Erholung hindeutet. Der Widerstand liegt bei etwa 284.50, nahe dem jüngsten Hoch. Ein erfolgreicher Halt über 279.50 würde das Long-Setup stützen.
$BCH
6
Übersetzung ansehen
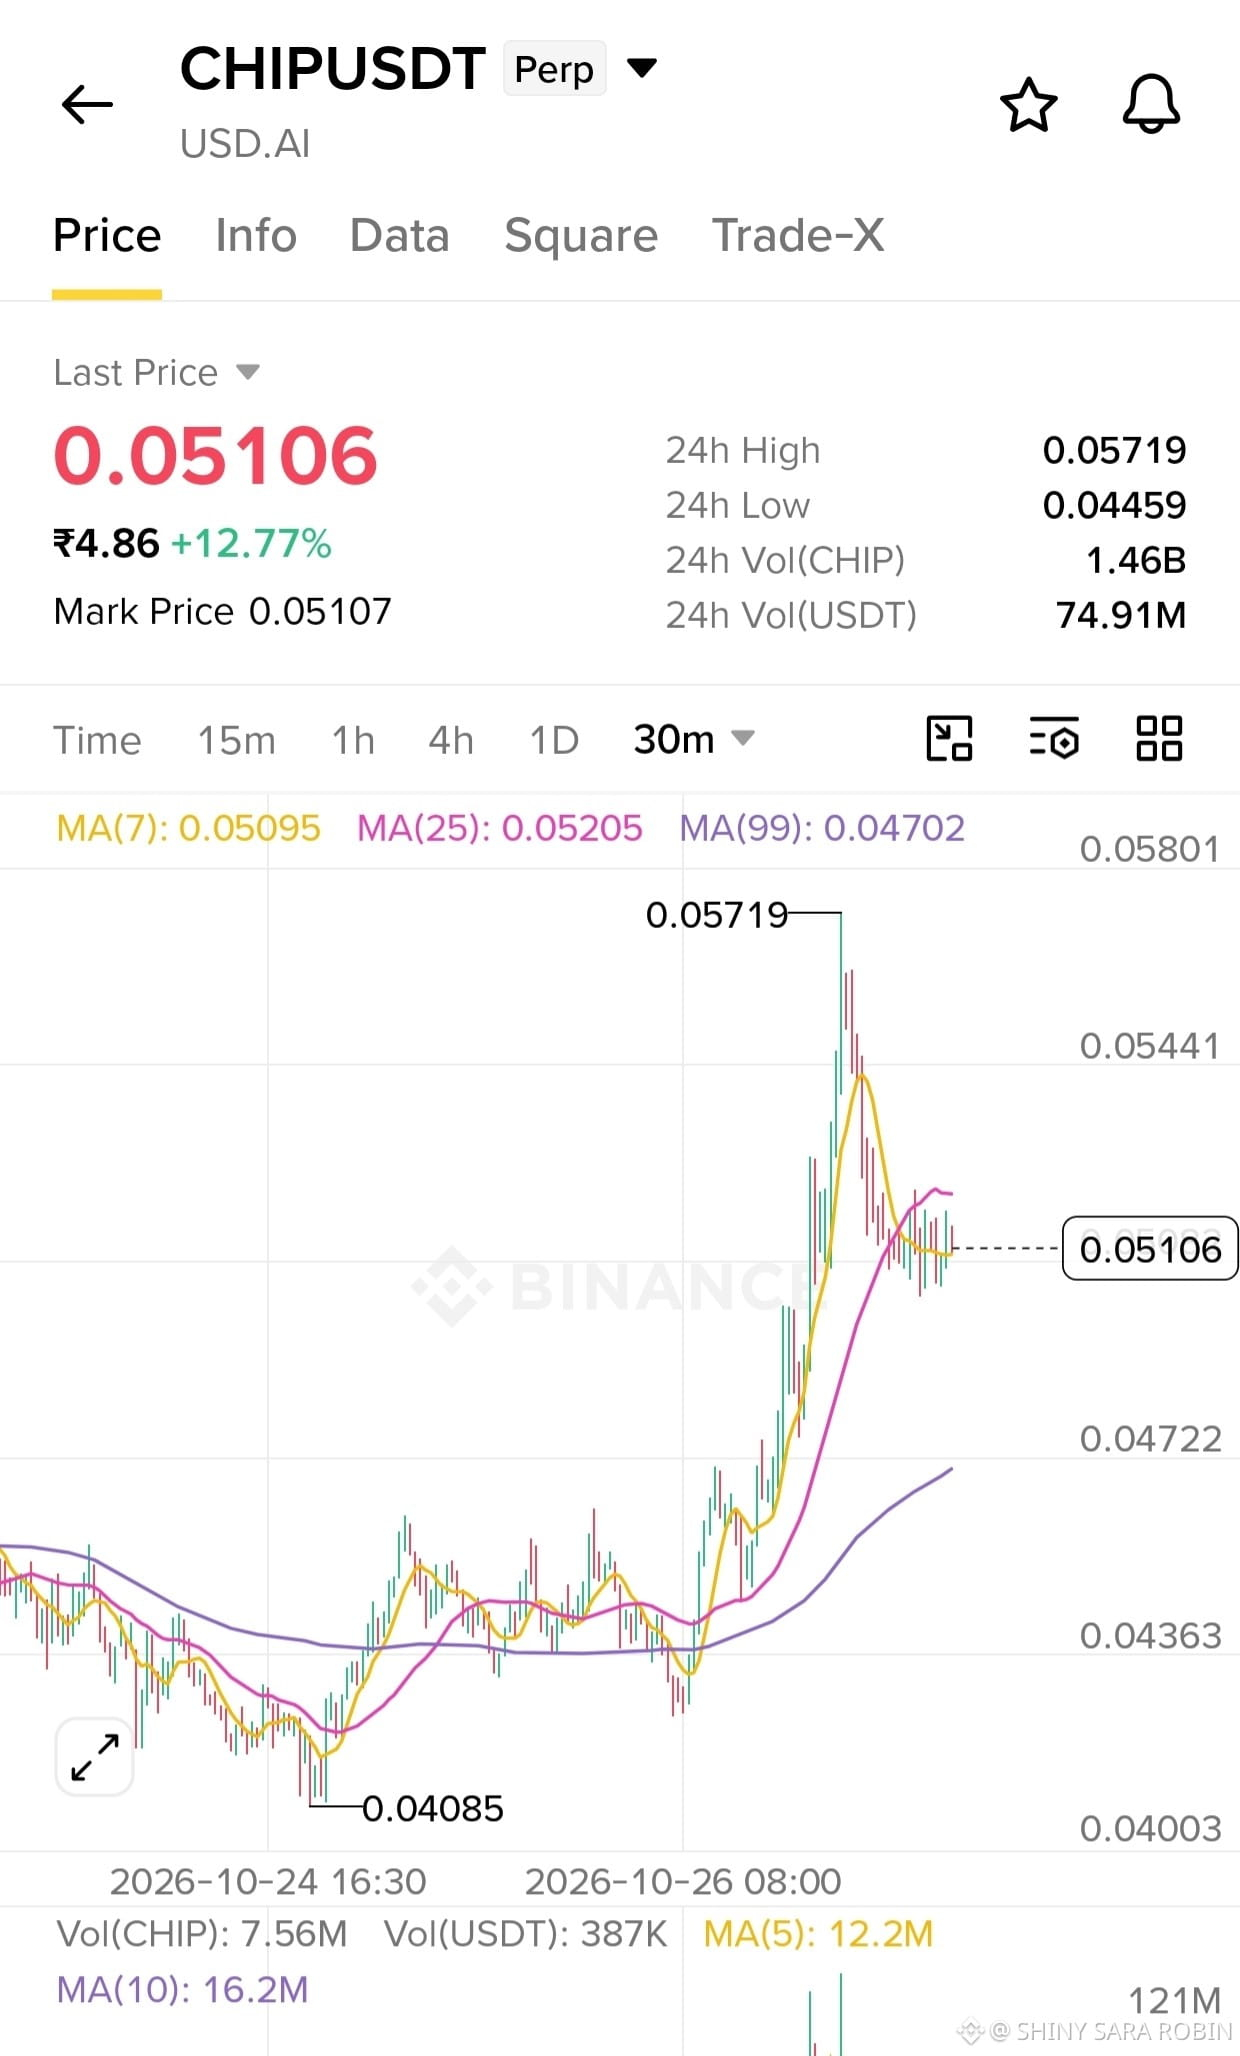
CHIP/USDT LONG (Max 5x)
Entry: 0.05000 – 0.05060
TP1: 0.05200
TP2: 0.05400
TP3: 0.05600
Stop-Loss: 0.04880
CHIP surged to 0.05719 and is now consolidating around 0.05106. The trend remains supported by MA(99) at 0.04702, but resistance near 0.05205 needs to be reclaimed. Avoid chasing the pump; wait for a confirmed recovery.
$CHIP
{future}(CHIPUSDT)
CHIP/USDT LONG (Max 5x)
Entry: 0.05000 – 0.05060
TP1: 0.05200
TP2: 0.05400
TP3: 0.05600
Stop-Loss: 0.04880
CHIP surged to 0.05719 and is now consolidating around 0.05106. The trend remains supported by MA(99) at 0.04702, but resistance near 0.05205 needs to be reclaimed. Avoid chasing the pump; wait for a confirmed recovery.
$CHIP
5
Übersetzung ansehen
INJ/USDT LONG (Max 10x)
Entry: 7.820 – 7.880
TP1: 7.980
TP2: 8.080
TP3: 8.250
Stop-Loss: 7.720
INJ is recovering above MA(99) at 7.785, but resistance near MA(25) at 7.941 remains. A breakout and retest above 7.94 would support further upside. Wait for confirmation before entering.
$INJ
{future}(INJUSDT)
INJ/USDT LONG (Max 10x)
Entry: 7.820 – 7.880
TP1: 7.980
TP2: 8.080
TP3: 8.250
Stop-Loss: 7.720
INJ is recovering above MA(99) at 7.785, but resistance near MA(25) at 7.941 remains. A breakout and retest above 7.94 would support further upside. Wait for confirmation before entering.
$INJ
Entry: 7.820 – 7.880
TP1: 7.980
TP2: 8.080
TP3: 8.250
Stop-Loss: 7.720
INJ is recovering above MA(99) at 7.785, but resistance near MA(25) at 7.941 remains. A breakout and retest above 7.94 would support further upside. Wait for confirmation before entering.
$INJ
16
·
--
Bullisch
Übersetzung ansehen
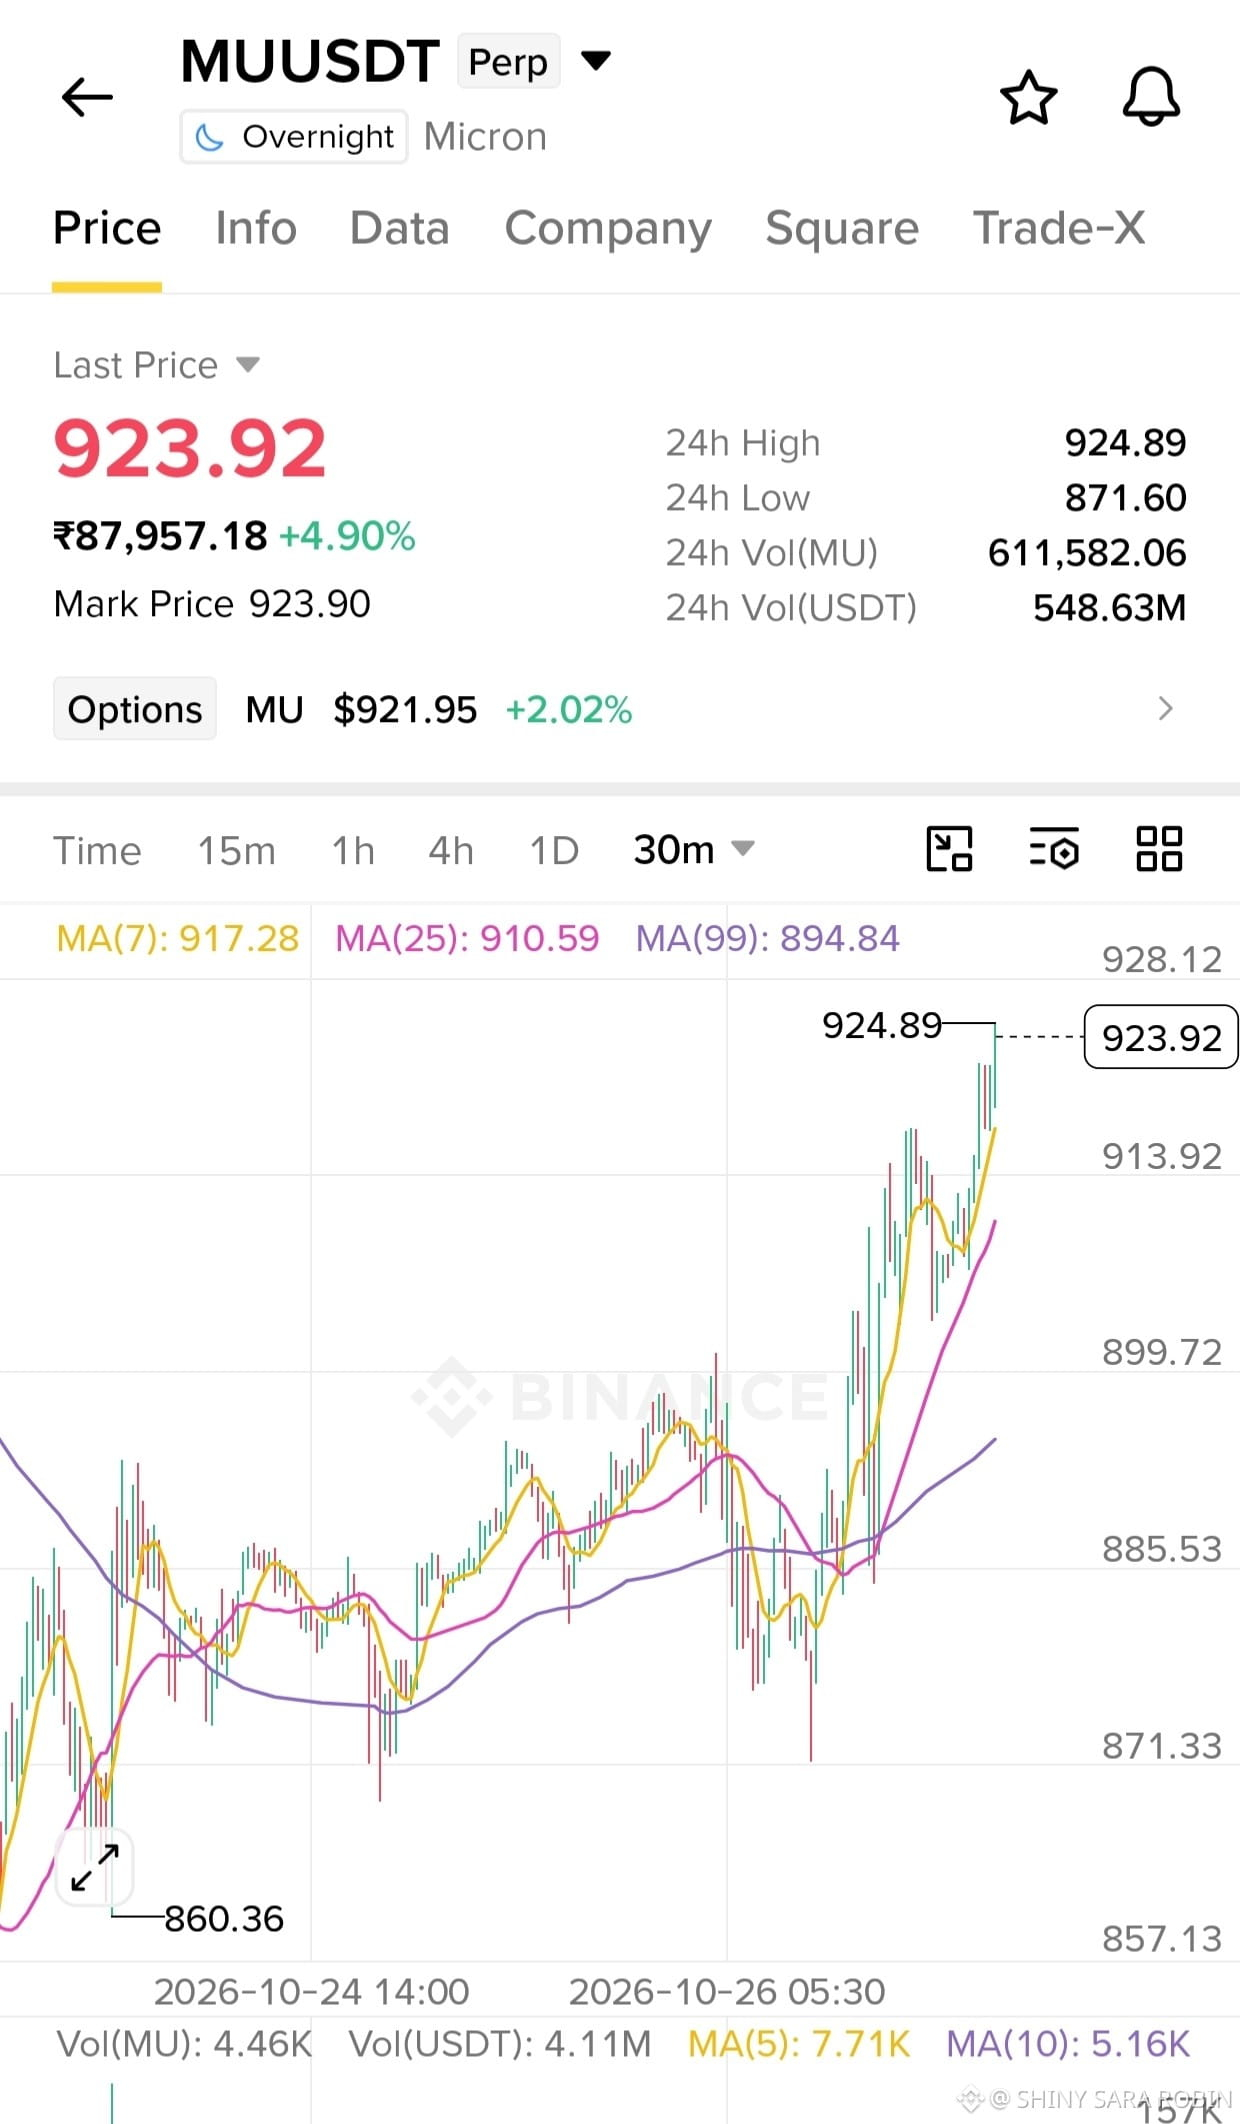
$MU/USDT LONG
Entry: 890 – 905
SL: 870
TP1: 928
TP2: 950
TP3: 980
MU is showing a recovery attempt, with recent market data indicating buying activity after a pullback. The 928 area is the first resistance to watch. If buyers break through this level and hold it as support, price could move toward 950 and 980. A pullback toward the entry zone may offer a better opportunity than chasing a sudden move.
$MU
{future}(MUUSDT)
$MU /USDT LONG
Entry: 890 – 905
SL: 870
TP1: 928
TP2: 950
TP3: 980
MU is showing a recovery attempt, with recent market data indicating buying activity after a pullback. The 928 area is the first resistance to watch. If buyers break through this level and hold it as support, price could move toward 950 and 980. A pullback toward the entry zone may offer a better opportunity than chasing a sudden move.
$MU
40
·
--
Bullisch
Übersetzung ansehen
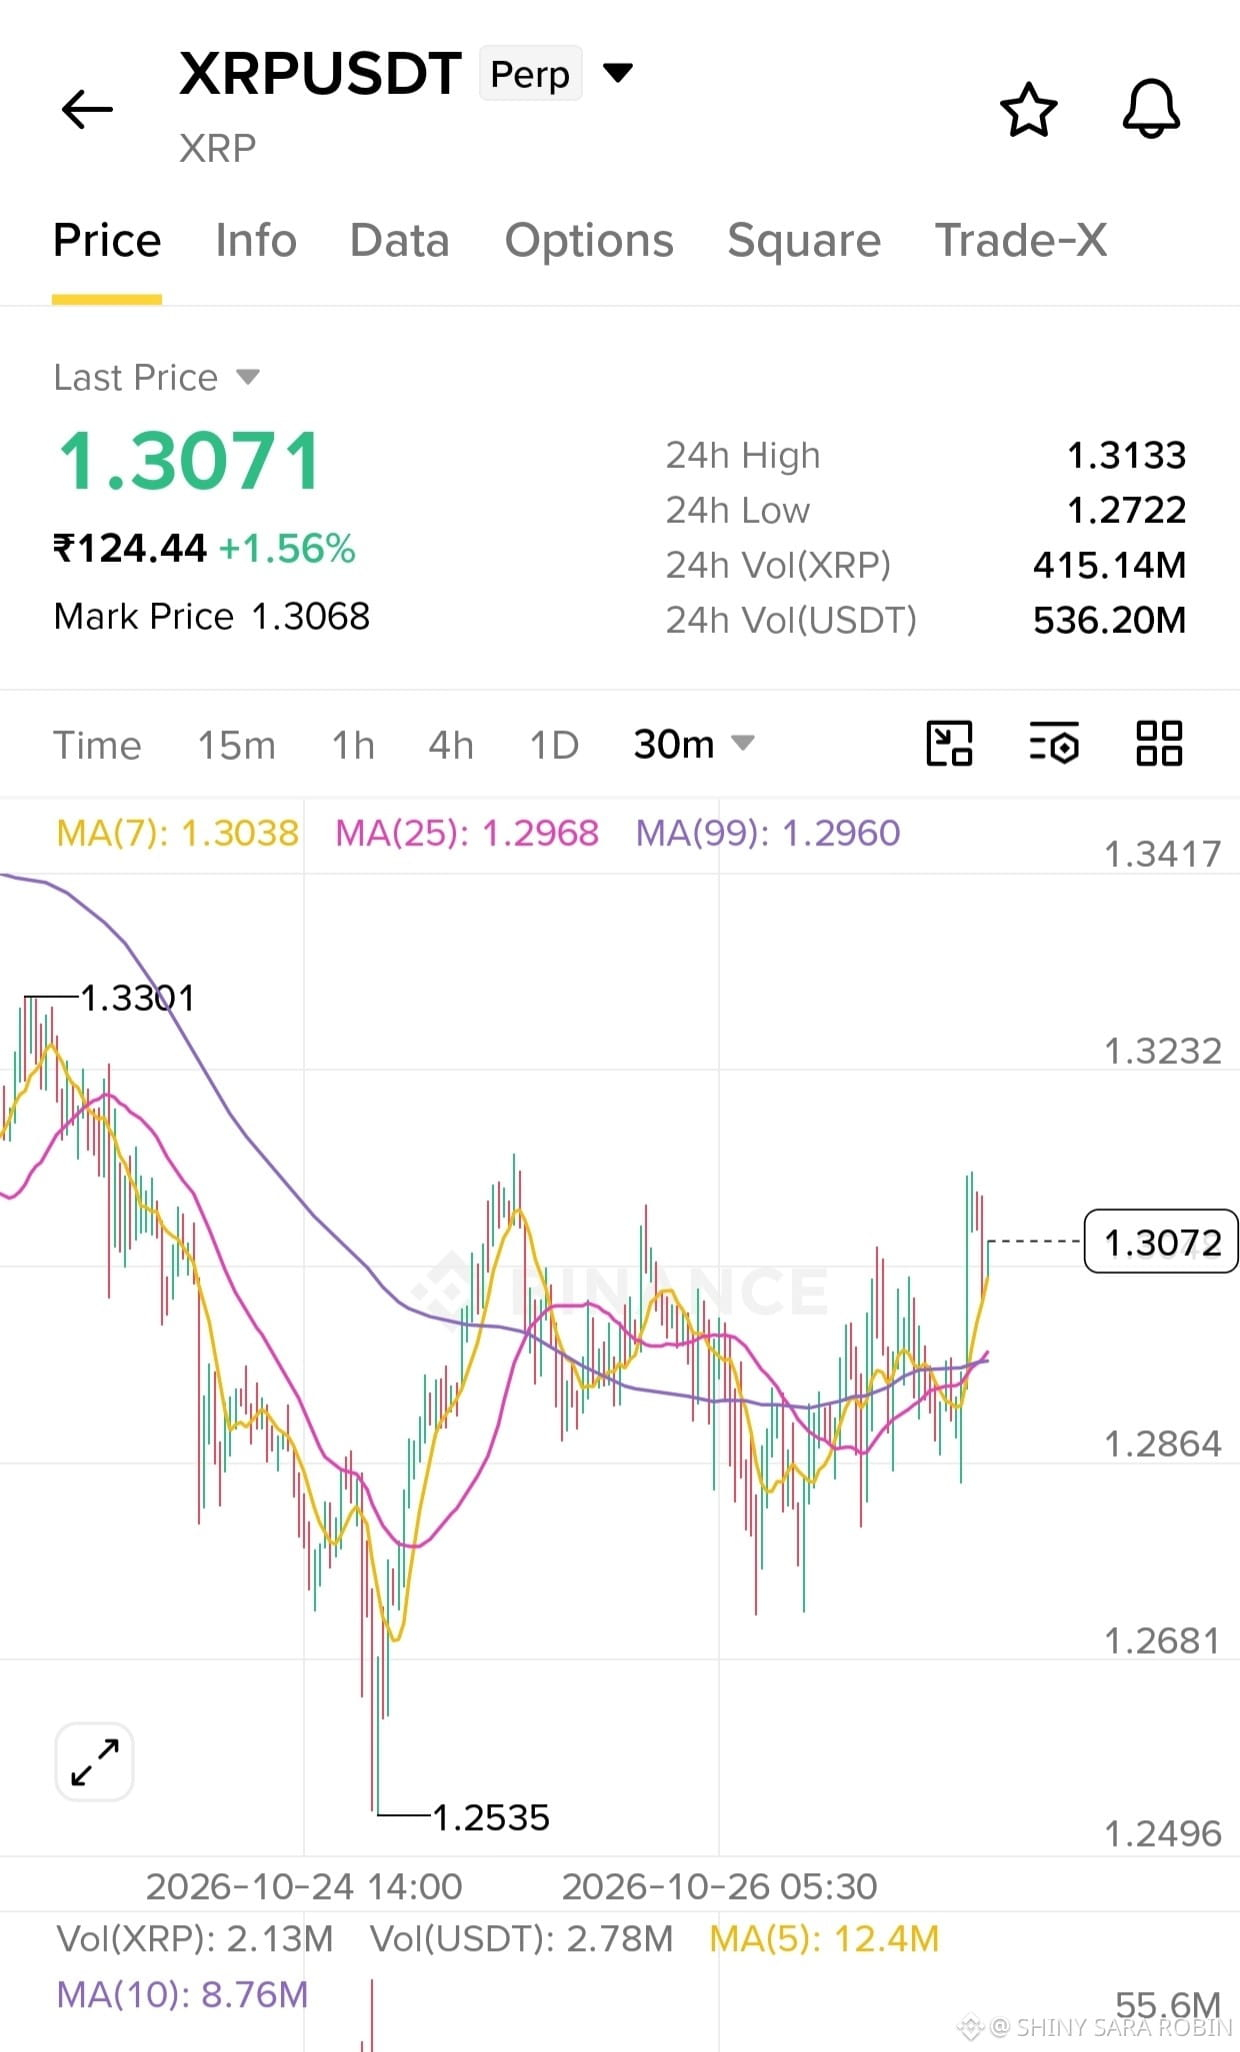
$XRP/USDT LONG
Entry: 1.2980 – 1.3030
SL: 1.2860
TP1: 1.3130
TP2: 1.3230
TP3: 1.3300
XRP is showing signs of recovery and trading above the short-term moving averages. Buyers are attempting to push toward 1.3130 resistance. A breakout and successful retest could open the way to higher targets. If support fails, the bullish setup becomes invalid.
$XRP
{future}(XRPUSDT)
$XRP /USDT LONG
Entry: 1.2980 – 1.3030
SL: 1.2860
TP1: 1.3130
TP2: 1.3230
TP3: 1.3300
XRP is showing signs of recovery and trading above the short-term moving averages. Buyers are attempting to push toward 1.3130 resistance. A breakout and successful retest could open the way to higher targets. If support fails, the bullish setup becomes invalid.
$XRP
8
·
--
Bullisch
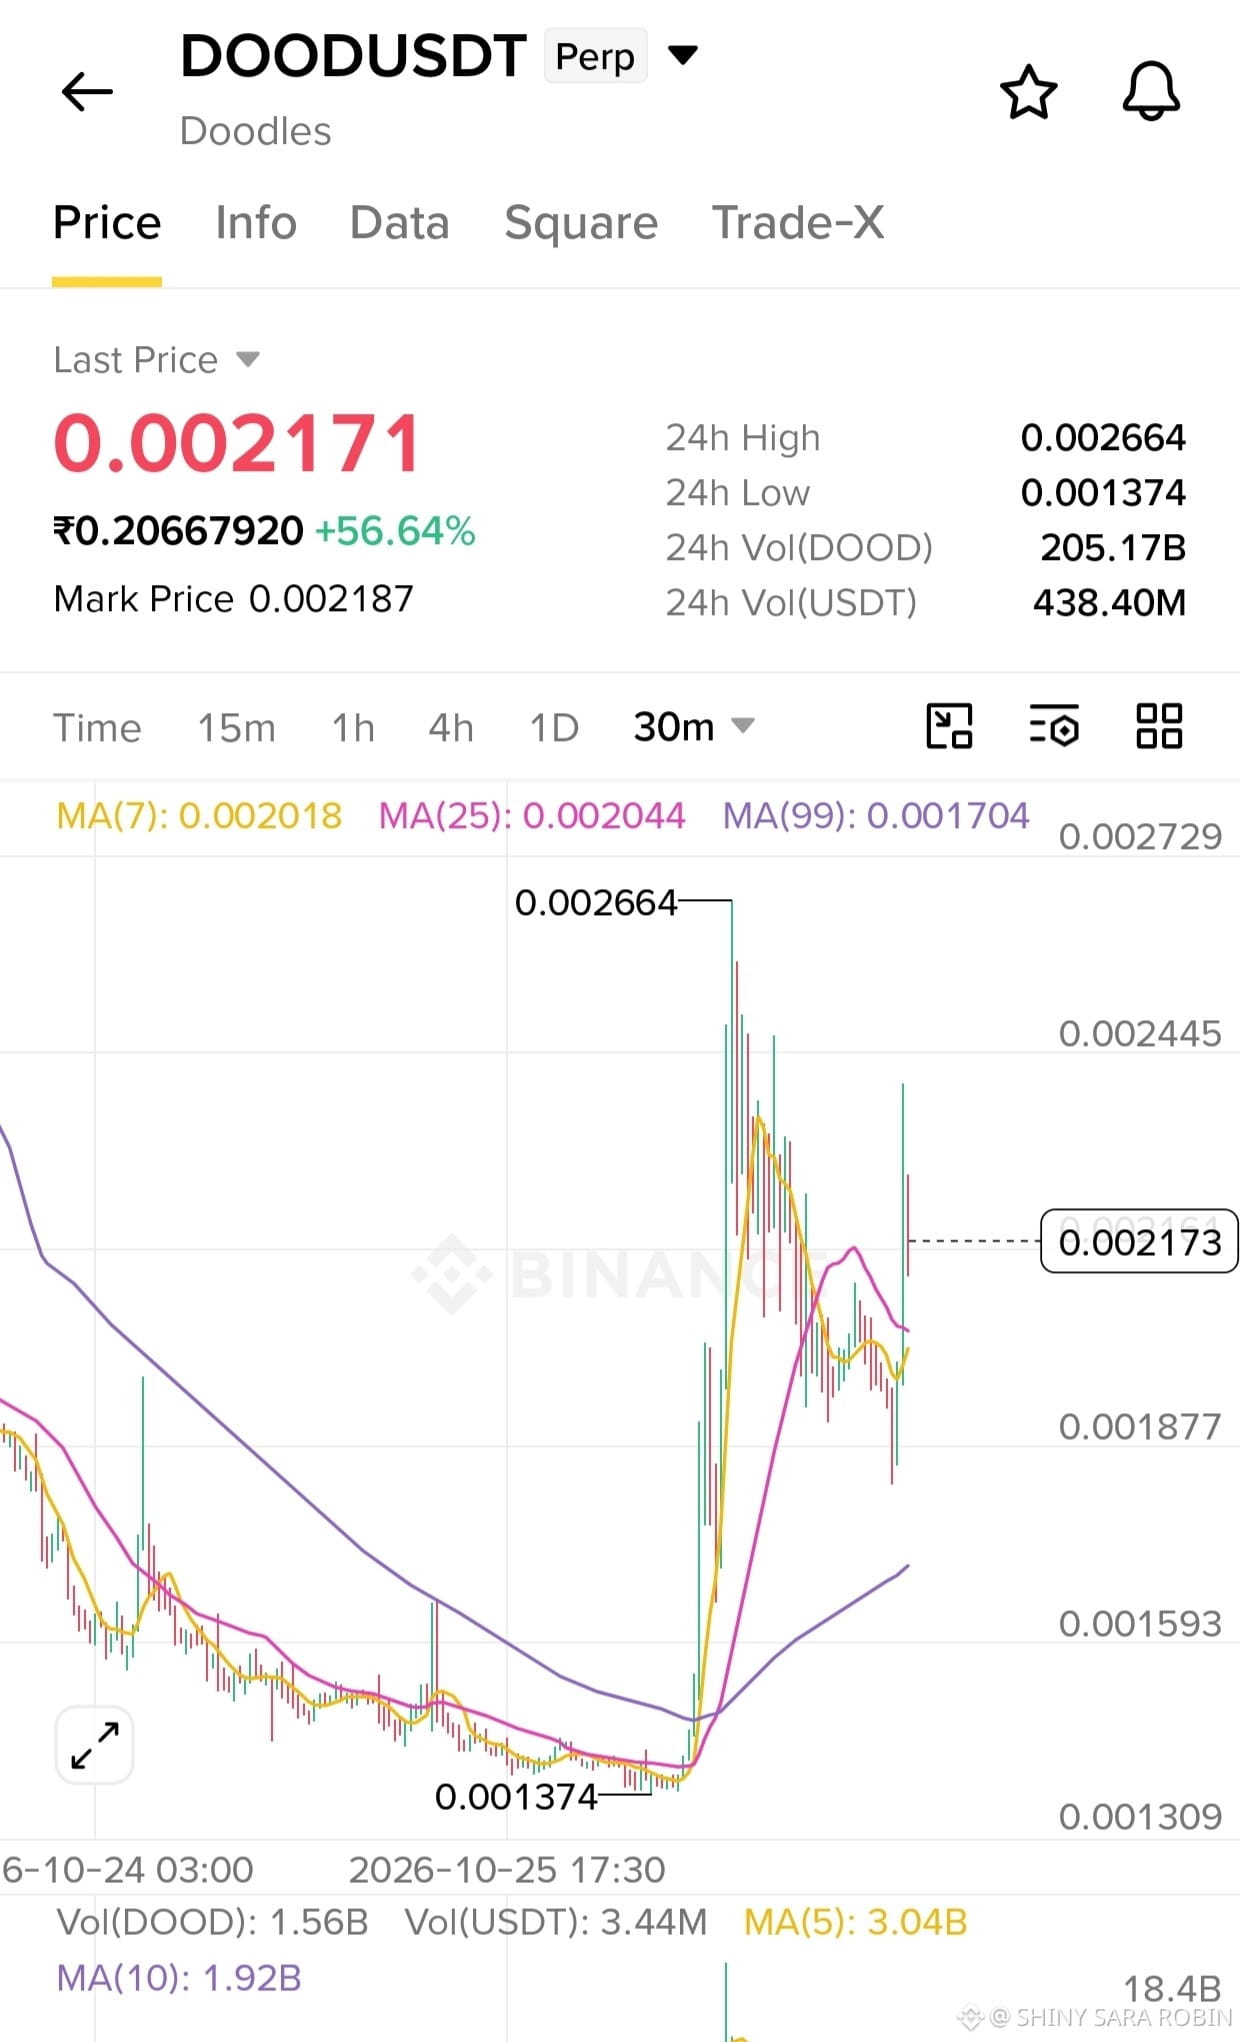
$DOOD/USDT LONG
Einstieg: 0.002050 – 0.002120
SL: 0.001940
TP1: 0.002250
TP2: 0.002440
TP3: 0.002650
DOOD zeigt nach einem kräftigen Pump eine starke Aufwärtsdynamik. Der Kurs hält sich über den wichtigen gleitenden Durchschnitten, doch die Volatilität ist hoch und ein Rücksetzer ist möglich.
Ein erfolgreicher Retest der Einstiegszone könnte den Kurs in Richtung der nächsten Widerstandsniveaus treiben. Laufe dem Pump nicht hinterher und warte auf eine Bestätigung.
$DOOD
{future}(DOODUSDT)
$DOOD /USDT LONG
Einstieg: 0.002050 – 0.002120
SL: 0.001940
TP1: 0.002250
TP2: 0.002440
TP3: 0.002650
DOOD zeigt nach einem kräftigen Pump eine starke Aufwärtsdynamik. Der Kurs hält sich über den wichtigen gleitenden Durchschnitten, doch die Volatilität ist hoch und ein Rücksetzer ist möglich.
Ein erfolgreicher Retest der Einstiegszone könnte den Kurs in Richtung der nächsten Widerstandsniveaus treiben. Laufe dem Pump nicht hinterher und warte auf eine Bestätigung.
$DOOD
9
·
--
Bullisch
Übersetzung ansehen
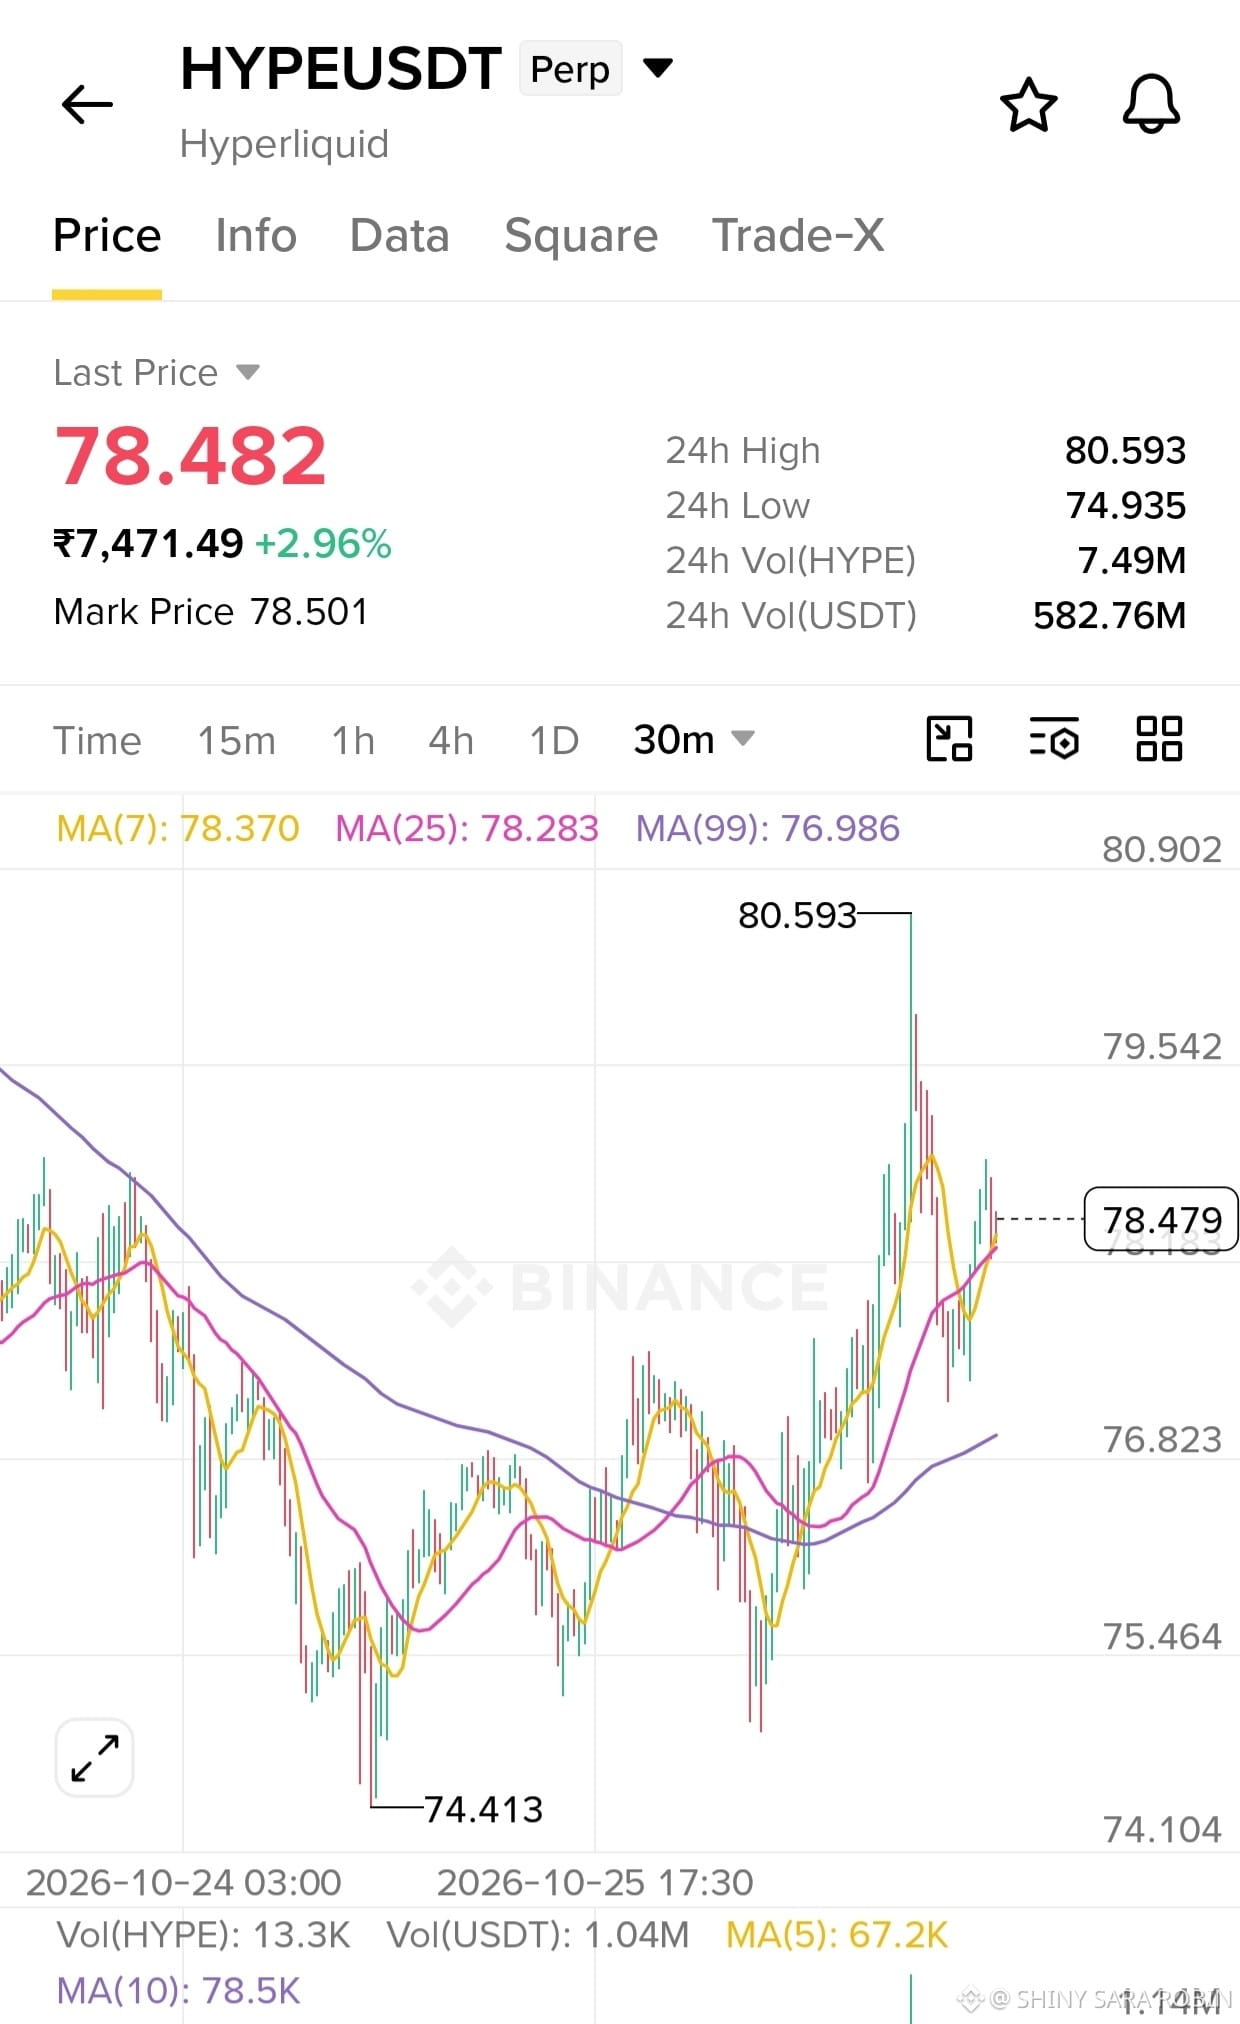
$HYPE/USDT LONG
Entry: 77.80–78.30
SL: 76.90
TP1: 79.50
TP2: 80.60
TP3: 82.00
HYPE is recovering after reaching a recent high of 80.593 and is trading around 78.48. Price is above all three moving averages, suggesting that buyers still have short-term control. Resistance lies near 79.54–80.59. A successful breakout could create room for another move upward, while a break below 76.90 would weaken the bullish setup.
$HYPE
{future}(HYPEUSDT)
$HYPE /USDT LONG
Entry: 77.80–78.30
SL: 76.90
TP1: 79.50
TP2: 80.60
TP3: 82.00
HYPE is recovering after reaching a recent high of 80.593 and is trading around 78.48. Price is above all three moving averages, suggesting that buyers still have short-term control. Resistance lies near 79.54–80.59. A successful breakout could create room for another move upward, while a break below 76.90 would weaken the bullish setup.
$HYPE
9
·
--
Bullisch
Übersetzung ansehen
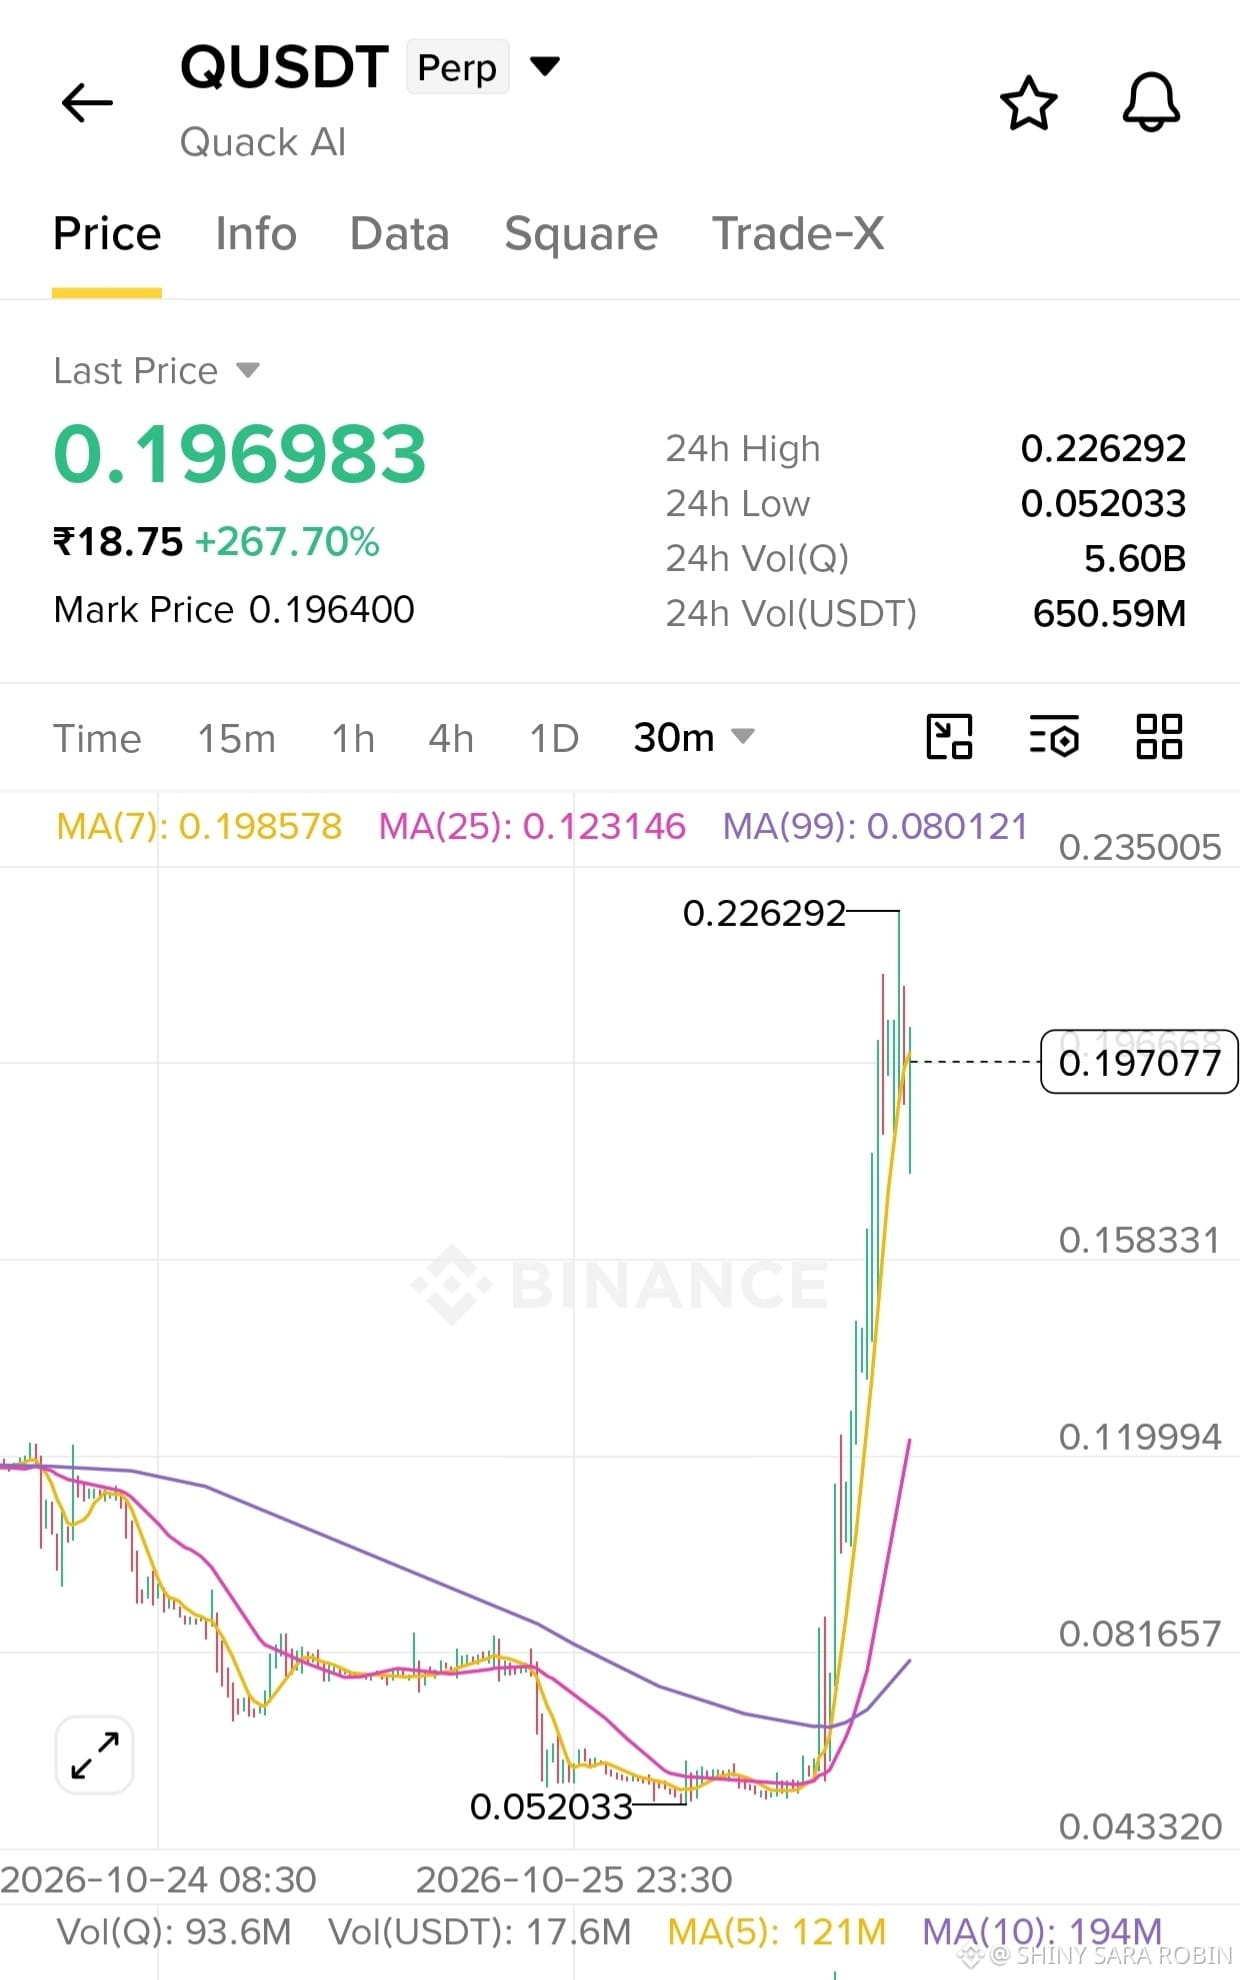
$Q/USDT LONG
Entry: 0.180–0.192
SL: 0.168
TP1: 0.210
TP2: 0.226
TP3: 0.245
Q has surged dramatically, gaining more than 267% in 24 hours and reaching a high of 0.226292. The trend is strongly bullish, but the huge price expansion also increases the risk of a sudden correction. A pullback that holds the entry zone could offer another upside opportunity. Avoid chasing the spike; if price loses 0.168, this setup is invalidated.
$Q
{future}(QUSDT)
$Q /USDT LONG
Entry: 0.180–0.192
SL: 0.168
TP1: 0.210
TP2: 0.226
TP3: 0.245
Q has surged dramatically, gaining more than 267% in 24 hours and reaching a high of 0.226292. The trend is strongly bullish, but the huge price expansion also increases the risk of a sudden correction. A pullback that holds the entry zone could offer another upside opportunity. Avoid chasing the spike; if price loses 0.168, this setup is invalidated.
$Q
13
·
--
Bullisch
Übersetzung ansehen
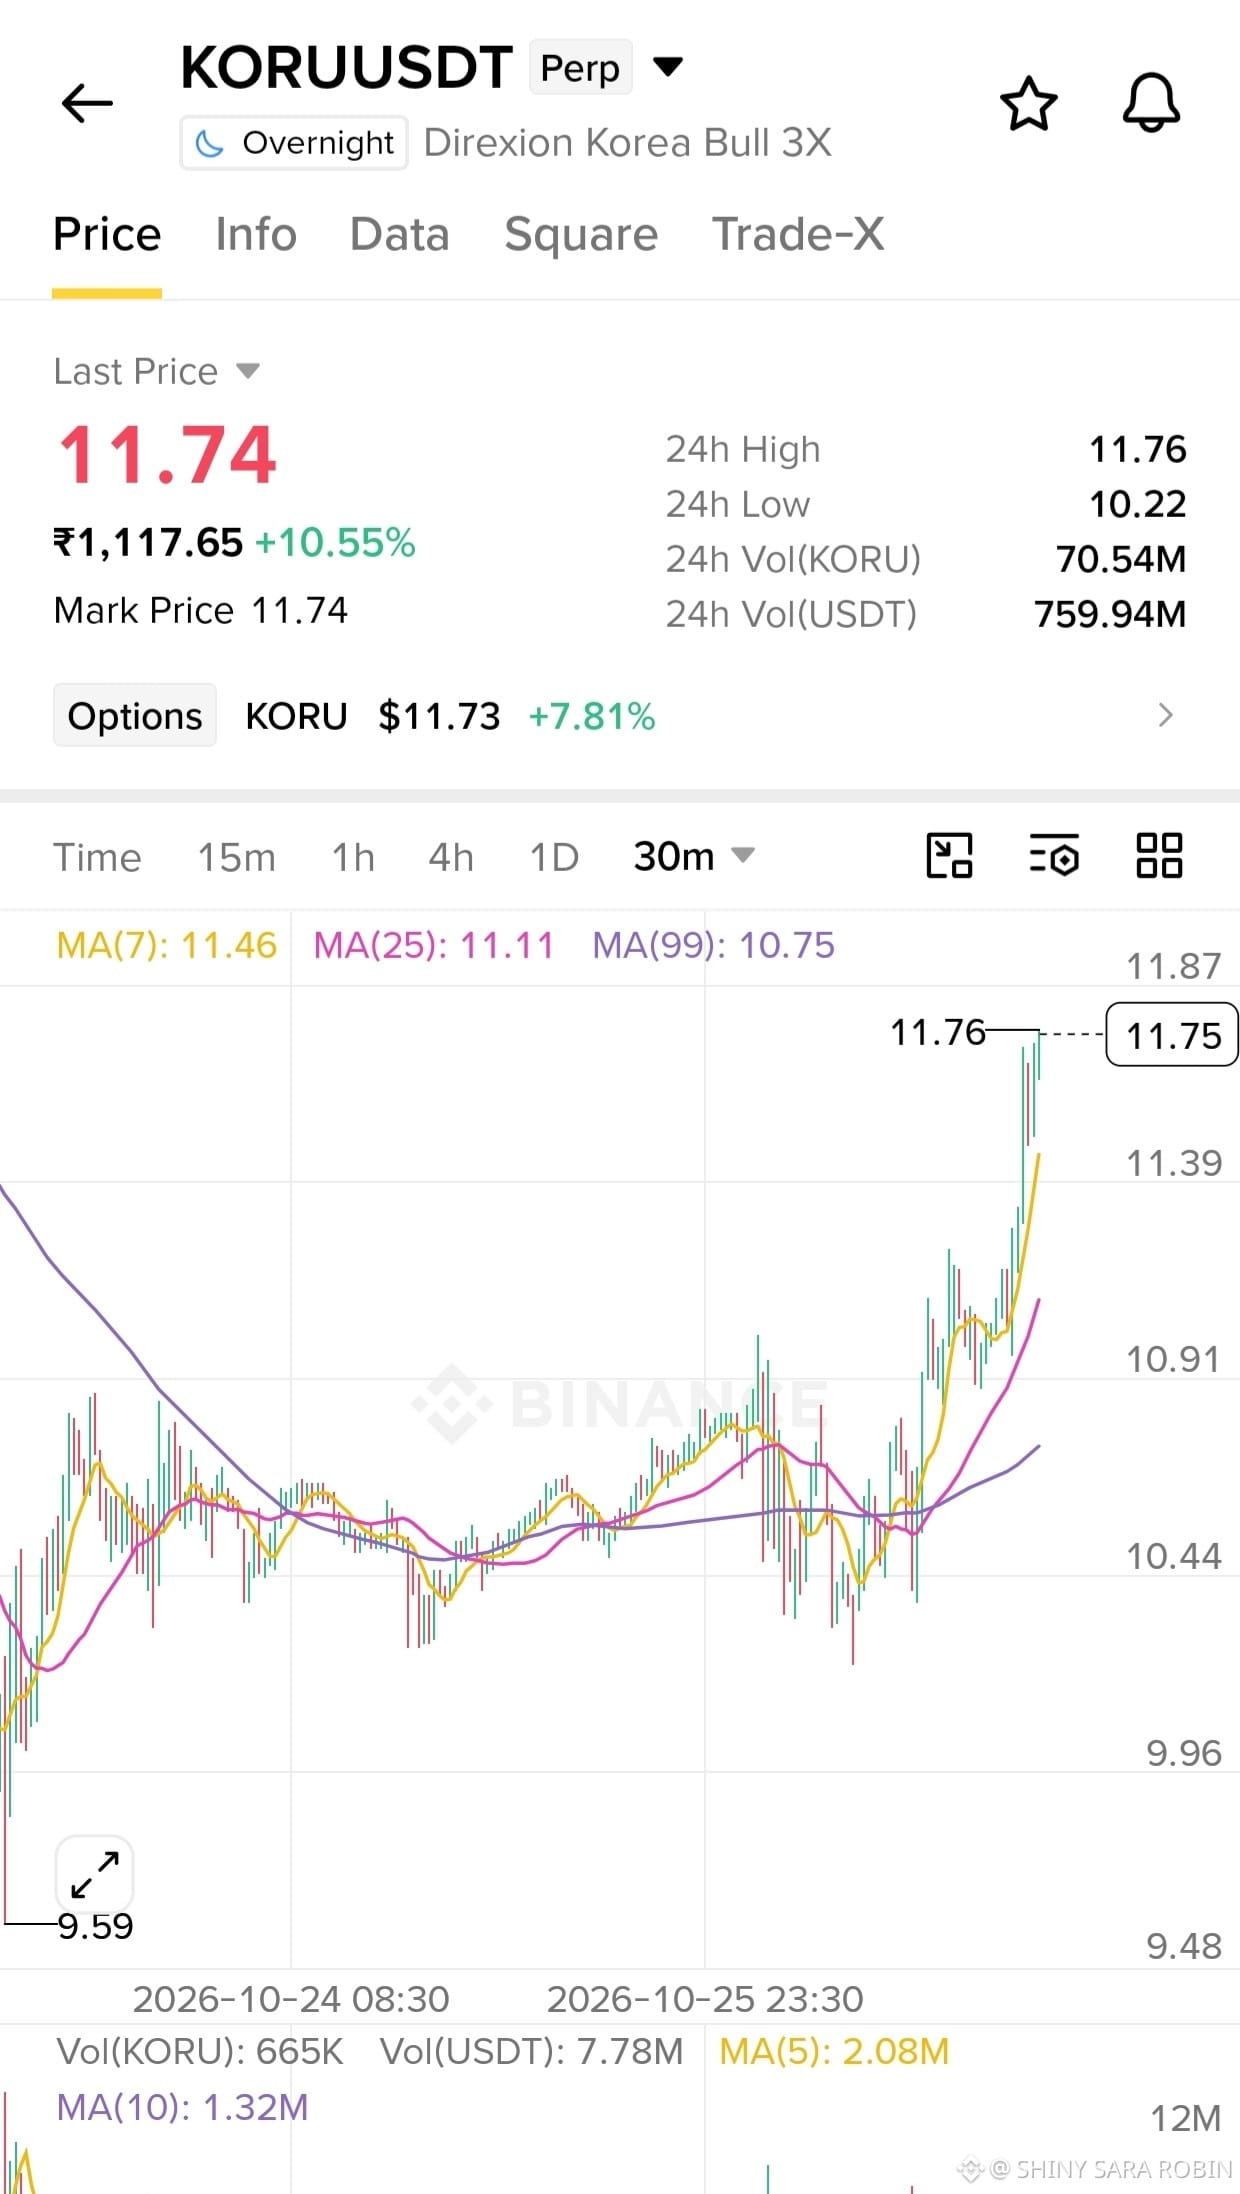
$KORU/USDT LONG
Entry: 11.45–11.60
SL: 11.20
TP1: 11.76
TP2: 12.00
TP3: 12.30
KORU is displaying strong upside momentum after a 10.55% daily gain. Price is above MA(7), MA(25), and MA(99), supporting a bullish trend. The immediate resistance is around 11.76. A clean breakout could attract further buying, but a rejection may lead to a pullback. Wait for confirmation instead of entering after the sharp move.
$KORU
{future}(KORUUSDT)
$KORU /USDT LONG
Entry: 11.45–11.60
SL: 11.20
TP1: 11.76
TP2: 12.00
TP3: 12.30
KORU is displaying strong upside momentum after a 10.55% daily gain. Price is above MA(7), MA(25), and MA(99), supporting a bullish trend. The immediate resistance is around 11.76. A clean breakout could attract further buying, but a rejection may lead to a pullback. Wait for confirmation instead of entering after the sharp move.
$KORU
9
·
--
Bullisch
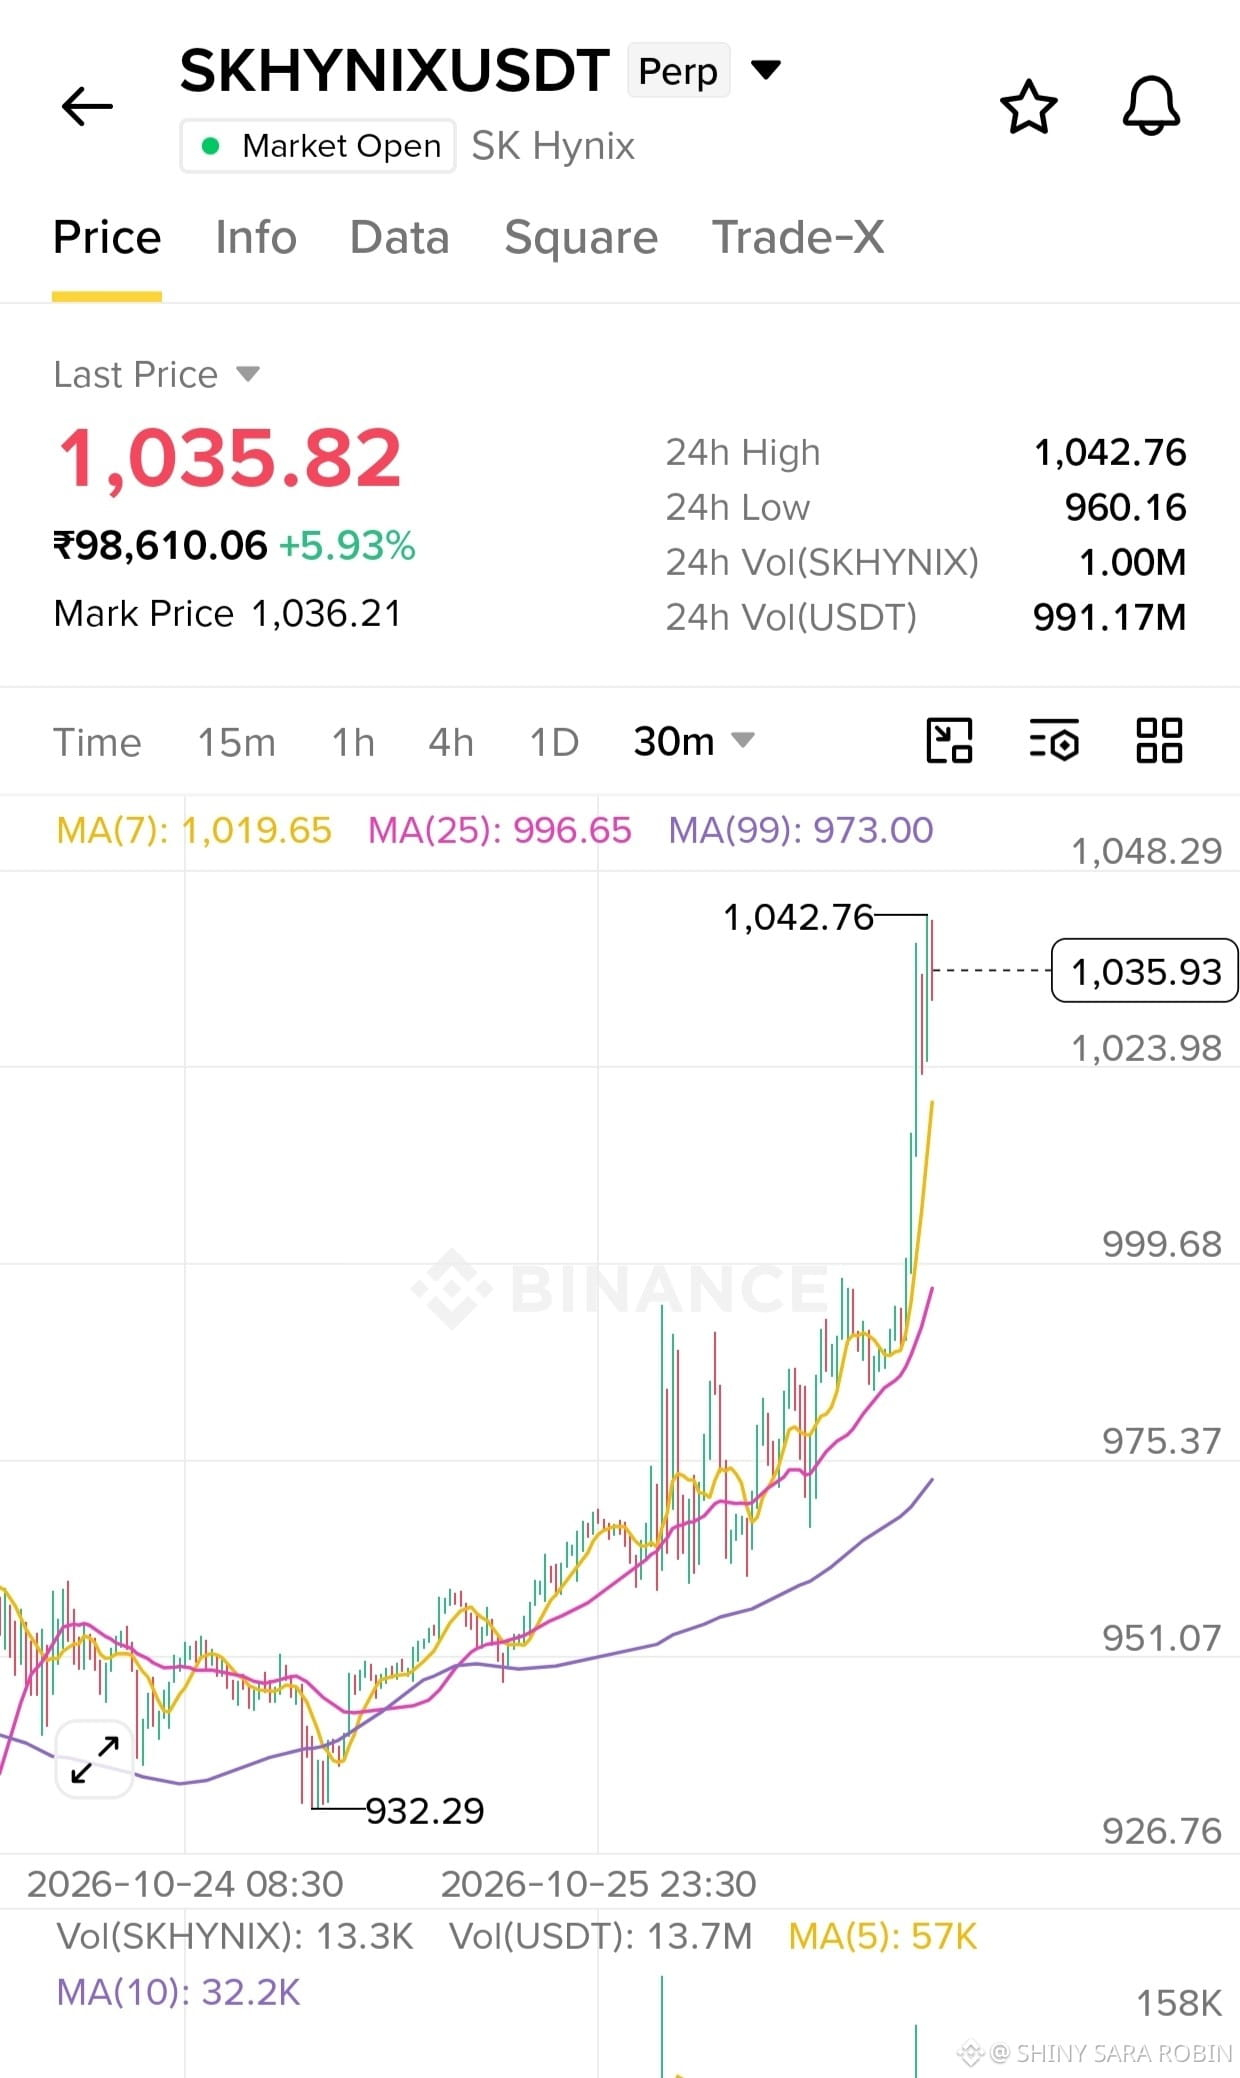
$SKHYNIX/USDT LONG
Einstieg: 1,025–1,034
SL: 1,008
TP1: 1,043
TP2: 1,055
TP3: 1,070
SKHYNIX zeigt nach einem starken Ausbruch eine ausgeprägte Aufwärtsdynamik. Der Kurs liegt bei etwa 1,035.82 und alle drei gleitenden Durchschnitte zeigen nach oben. Der Widerstand liegt bei etwa 1,042–1,043. Ein bestätigter Ausbruch könnte den Kurs in Richtung 1,055 und 1,070 treiben. Vermeide es, der Rally hinterherzulaufen – ein Einstieg nach einem Rücksetzer ist sicherer.
$SKHYNIX
{future}(SKHYNIXUSDT)
$SKHYNIX /USDT LONG
Einstieg: 1,025–1,034
SL: 1,008
TP1: 1,043
TP2: 1,055
TP3: 1,070
SKHYNIX zeigt nach einem starken Ausbruch eine ausgeprägte Aufwärtsdynamik. Der Kurs liegt bei etwa 1,035.82 und alle drei gleitenden Durchschnitte zeigen nach oben. Der Widerstand liegt bei etwa 1,042–1,043. Ein bestätigter Ausbruch könnte den Kurs in Richtung 1,055 und 1,070 treiben. Vermeide es, der Rally hinterherzulaufen – ein Einstieg nach einem Rücksetzer ist sicherer.
$SKHYNIX
32
·
--
Bullisch
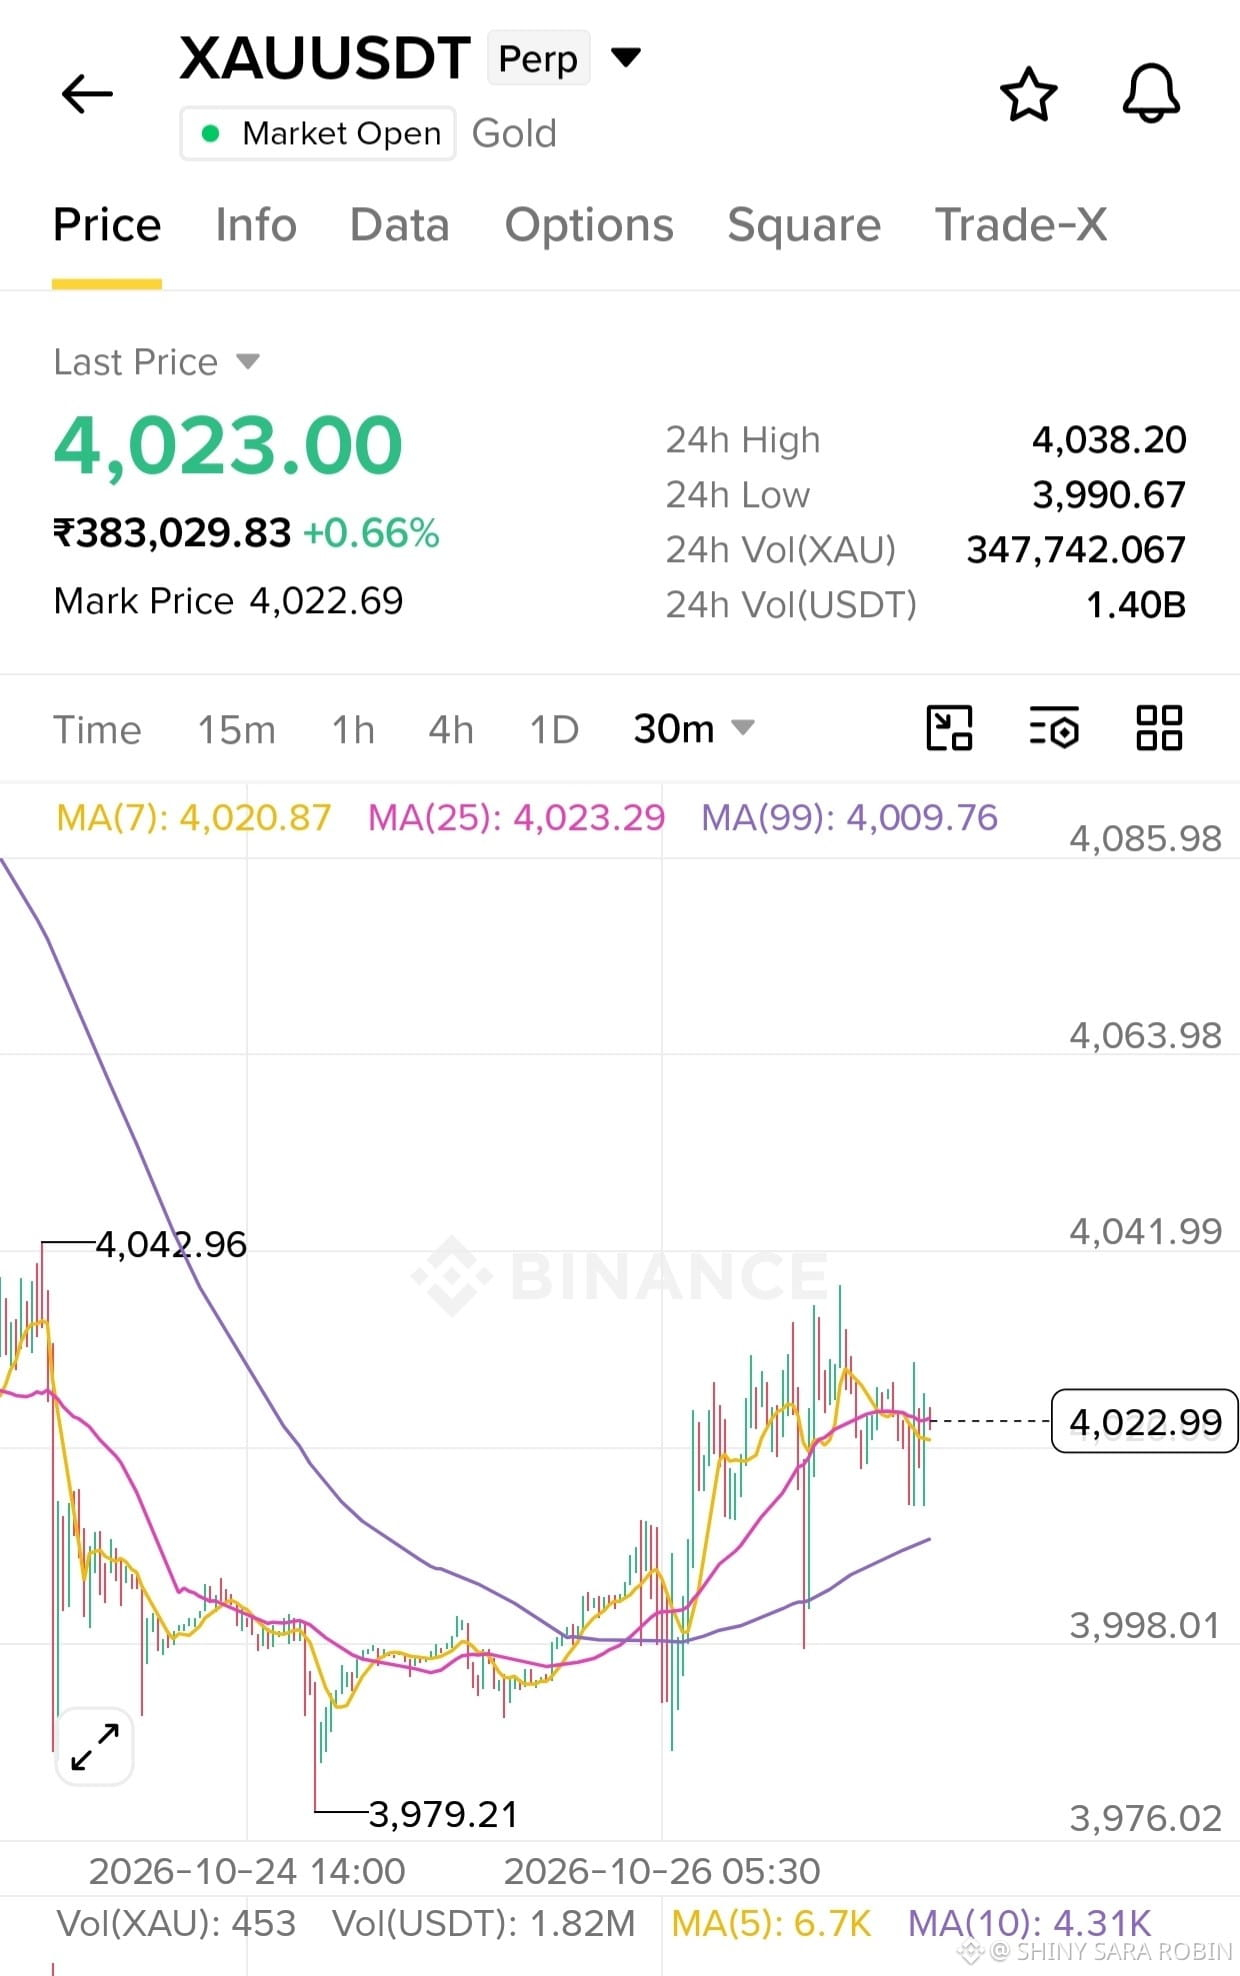
$XAU/USDT LONG
Einstieg: 4,012–4,020
SL: 3,996
TP1: 4,032
TP2: 4,043
TP3: 4,060
Gold hat sich vom Bereich um 3,979 erholt und wird über dem MA(99) gehandelt, was auf eine mögliche Fortsetzung der Aufwärtsbewegung hindeutet. Der Kurs konsolidiert jedoch um 4,023. Daher müssen die Käufer zunächst den nahegelegenen Widerstand zurückerobern, bevor es weiter nach oben gehen kann. Ein Rückgang unter 3,996 macht dieses Setup ungültig.
$XAU
{future}(XAUUSDT)
$XAU /USDT LONG
Einstieg: 4,012–4,020
SL: 3,996
TP1: 4,032
TP2: 4,043
TP3: 4,060
Gold hat sich vom Bereich um 3,979 erholt und wird über dem MA(99) gehandelt, was auf eine mögliche Fortsetzung der Aufwärtsbewegung hindeutet. Der Kurs konsolidiert jedoch um 4,023. Daher müssen die Käufer zunächst den nahegelegenen Widerstand zurückerobern, bevor es weiter nach oben gehen kann. Ein Rückgang unter 3,996 macht dieses Setup ungültig.
$XAU
30
·
--
Bullisch
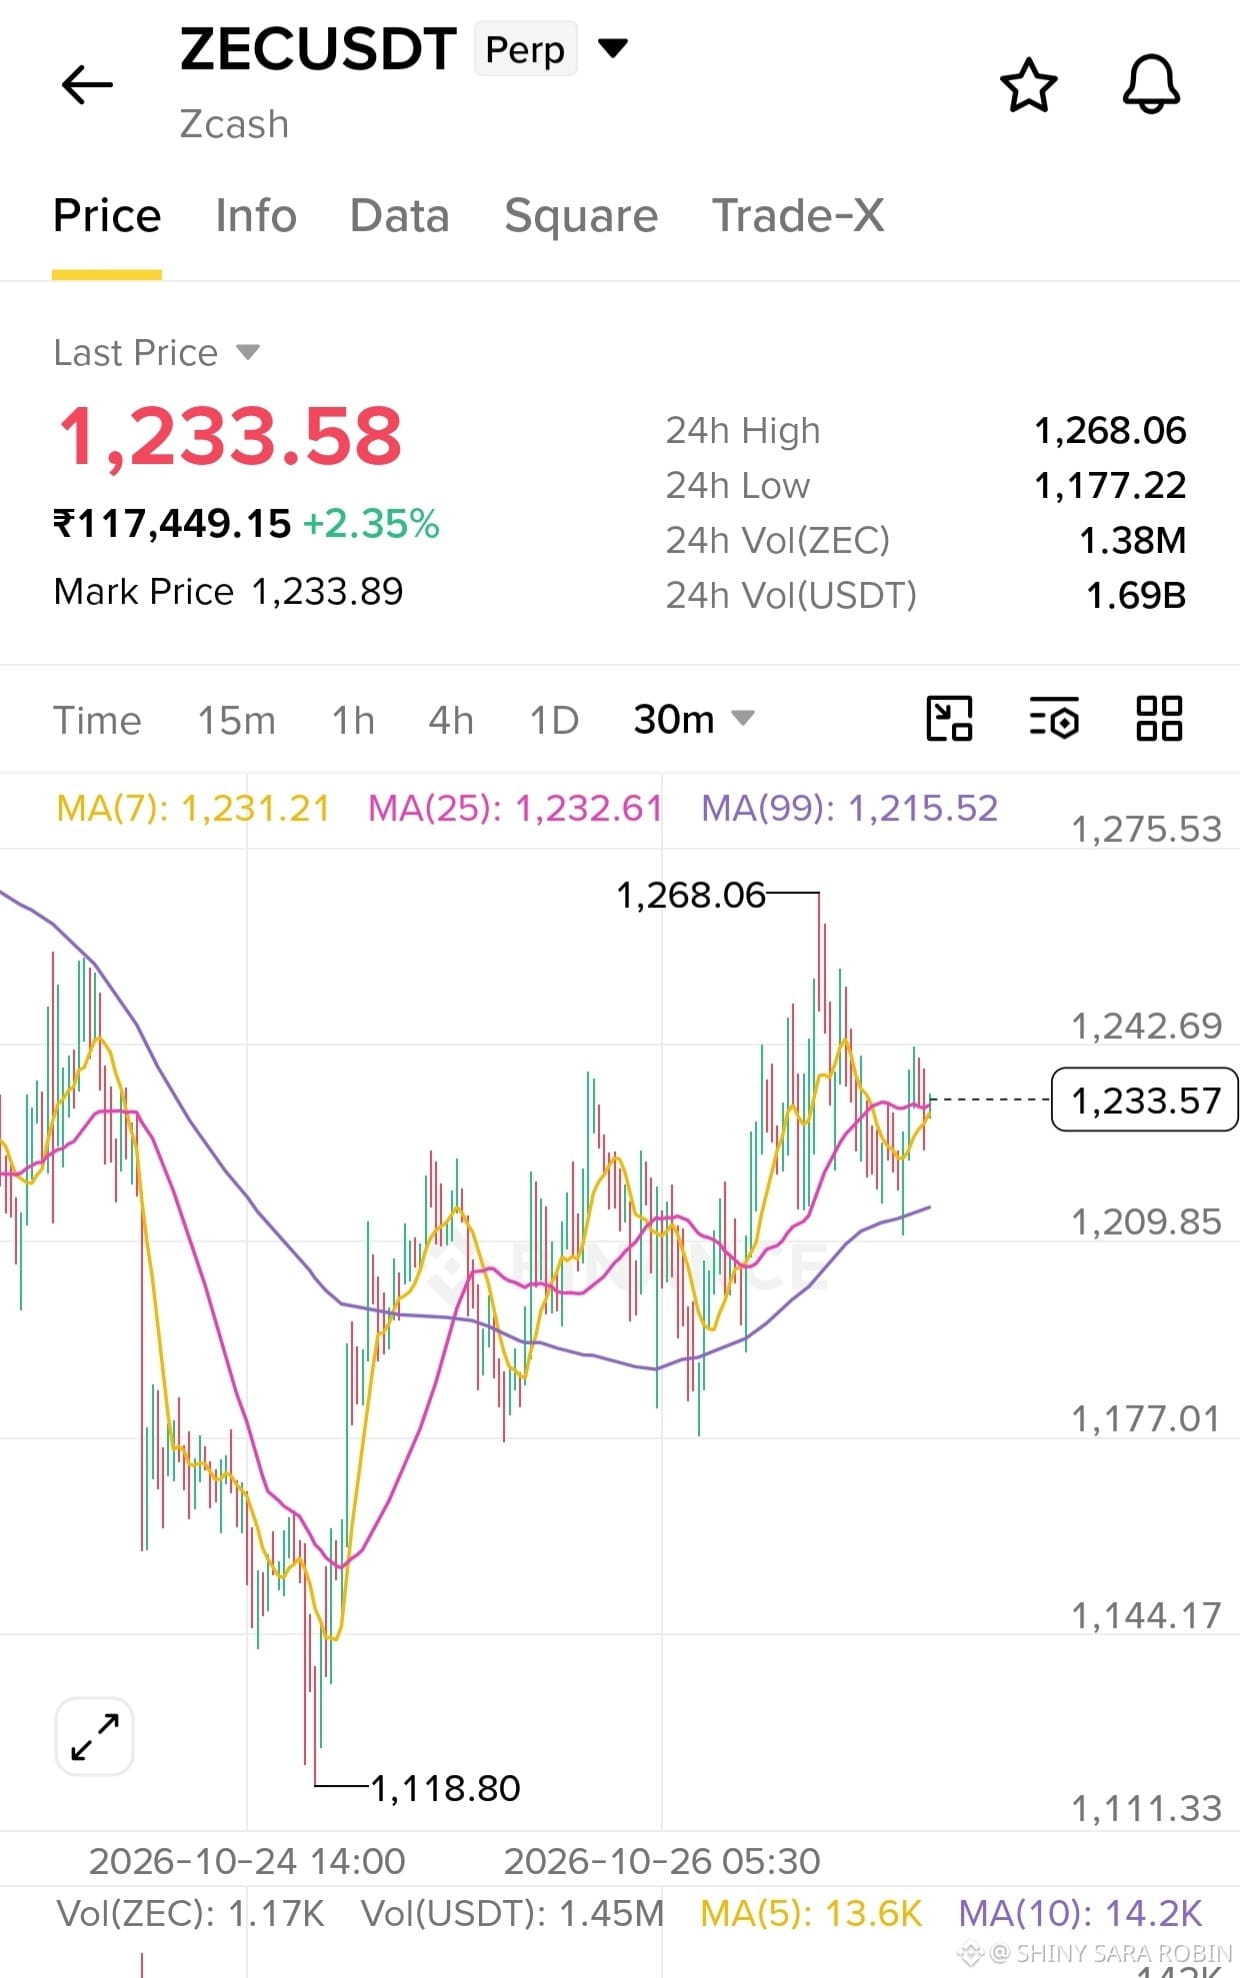
$ZEC/USDT LONG
Einstieg: 1,225–1,235
SL: 1,208
TP1: 1,243
TP2: 1,255
TP3: 1,268
ZEC konsolidiert, nachdem sich der Kurs kräftig von seinem jüngsten Tief erholt hat. Der Kurs bewegt sich um die kurzfristigen gleitenden Durchschnitte und liegt weiterhin über MA(99), sodass ein Erholungsszenario intakt bleibt. Ein Anstieg über 1,243 könnte weitere Käufe anziehen; 1,268 stellt einen wichtigen Widerstand dar.
$ZEC
{future}(ZECUSDT)
$ZEC /USDT LONG
Einstieg: 1,225–1,235
SL: 1,208
TP1: 1,243
TP2: 1,255
TP3: 1,268
ZEC konsolidiert, nachdem sich der Kurs kräftig von seinem jüngsten Tief erholt hat. Der Kurs bewegt sich um die kurzfristigen gleitenden Durchschnitte und liegt weiterhin über MA(99), sodass ein Erholungsszenario intakt bleibt. Ein Anstieg über 1,243 könnte weitere Käufe anziehen; 1,268 stellt einen wichtigen Widerstand dar.
$ZEC
56
·
--
Bullisch
Übersetzung ansehen
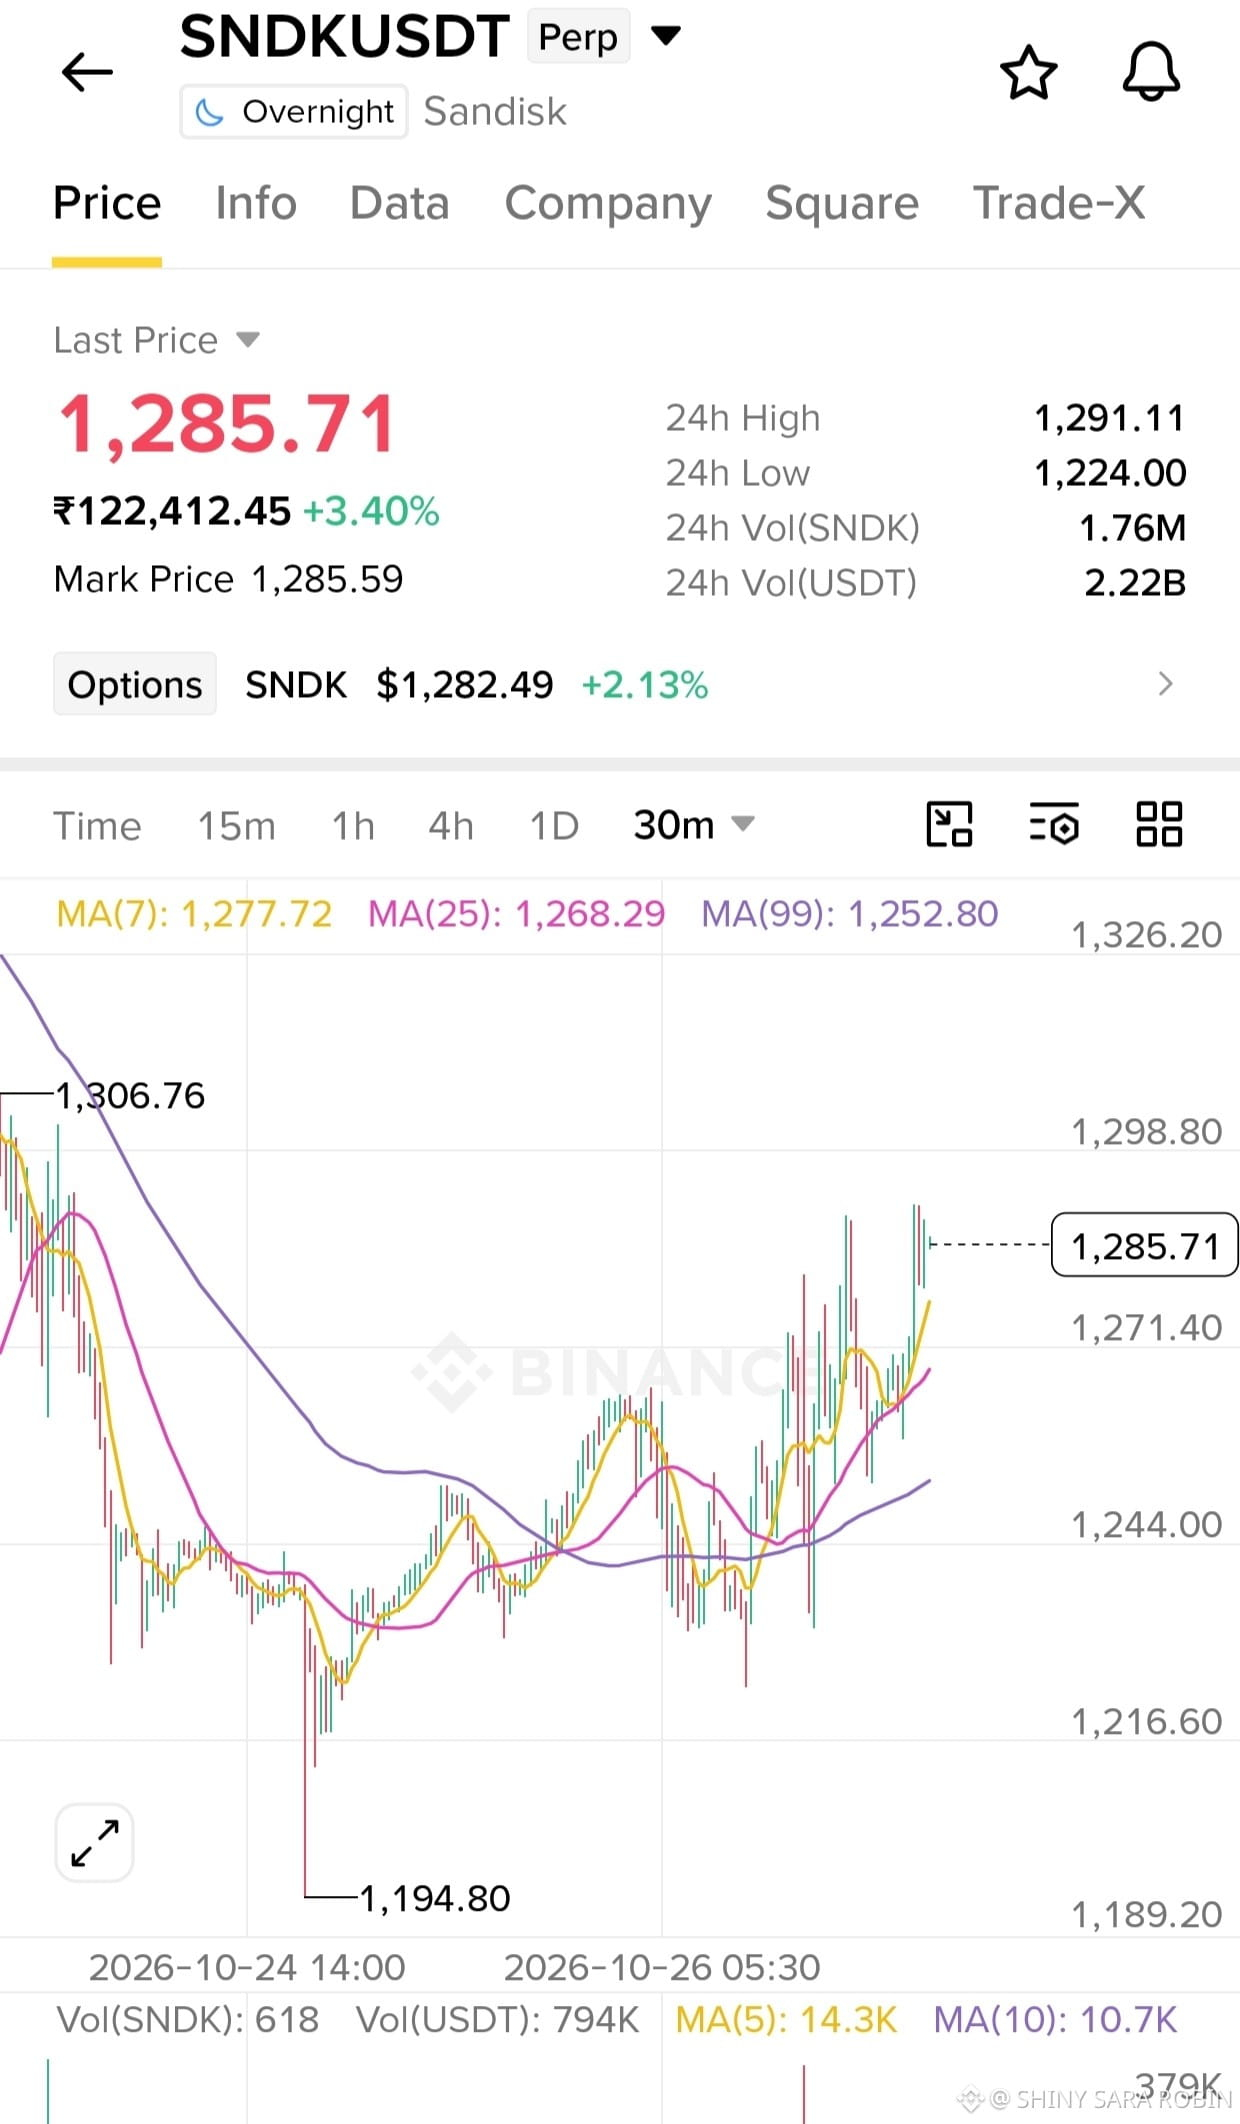
$SNDK/USDT LONG
Entry: 1,272–1,282
SL: 1,254
TP1: 1,298
TP2: 1,310
TP3: 1,326
SNDK is holding above its MA(7), MA(25), and MA(99), showing a bullish short-term structure. Buyers are pushing toward resistance around 1,291–1,307. A breakout could extend the rally, while a drop below 1,254 weakens the setup.
$SNDK
{future}(SNDKUSDT)
$SNDK /USDT LONG
Entry: 1,272–1,282
SL: 1,254
TP1: 1,298
TP2: 1,310
TP3: 1,326
SNDK is holding above its MA(7), MA(25), and MA(99), showing a bullish short-term structure. Buyers are pushing toward resistance around 1,291–1,307. A breakout could extend the rally, while a drop below 1,254 weakens the setup.
$SNDK
Entry: 1,272–1,282
SL: 1,254
TP1: 1,298
TP2: 1,310
TP3: 1,326
SNDK is holding above its MA(7), MA(25), and MA(99), showing a bullish short-term structure. Buyers are pushing toward resistance around 1,291–1,307. A breakout could extend the rally, while a drop below 1,254 weakens the setup.
$SNDK
53
·
--
Bullisch
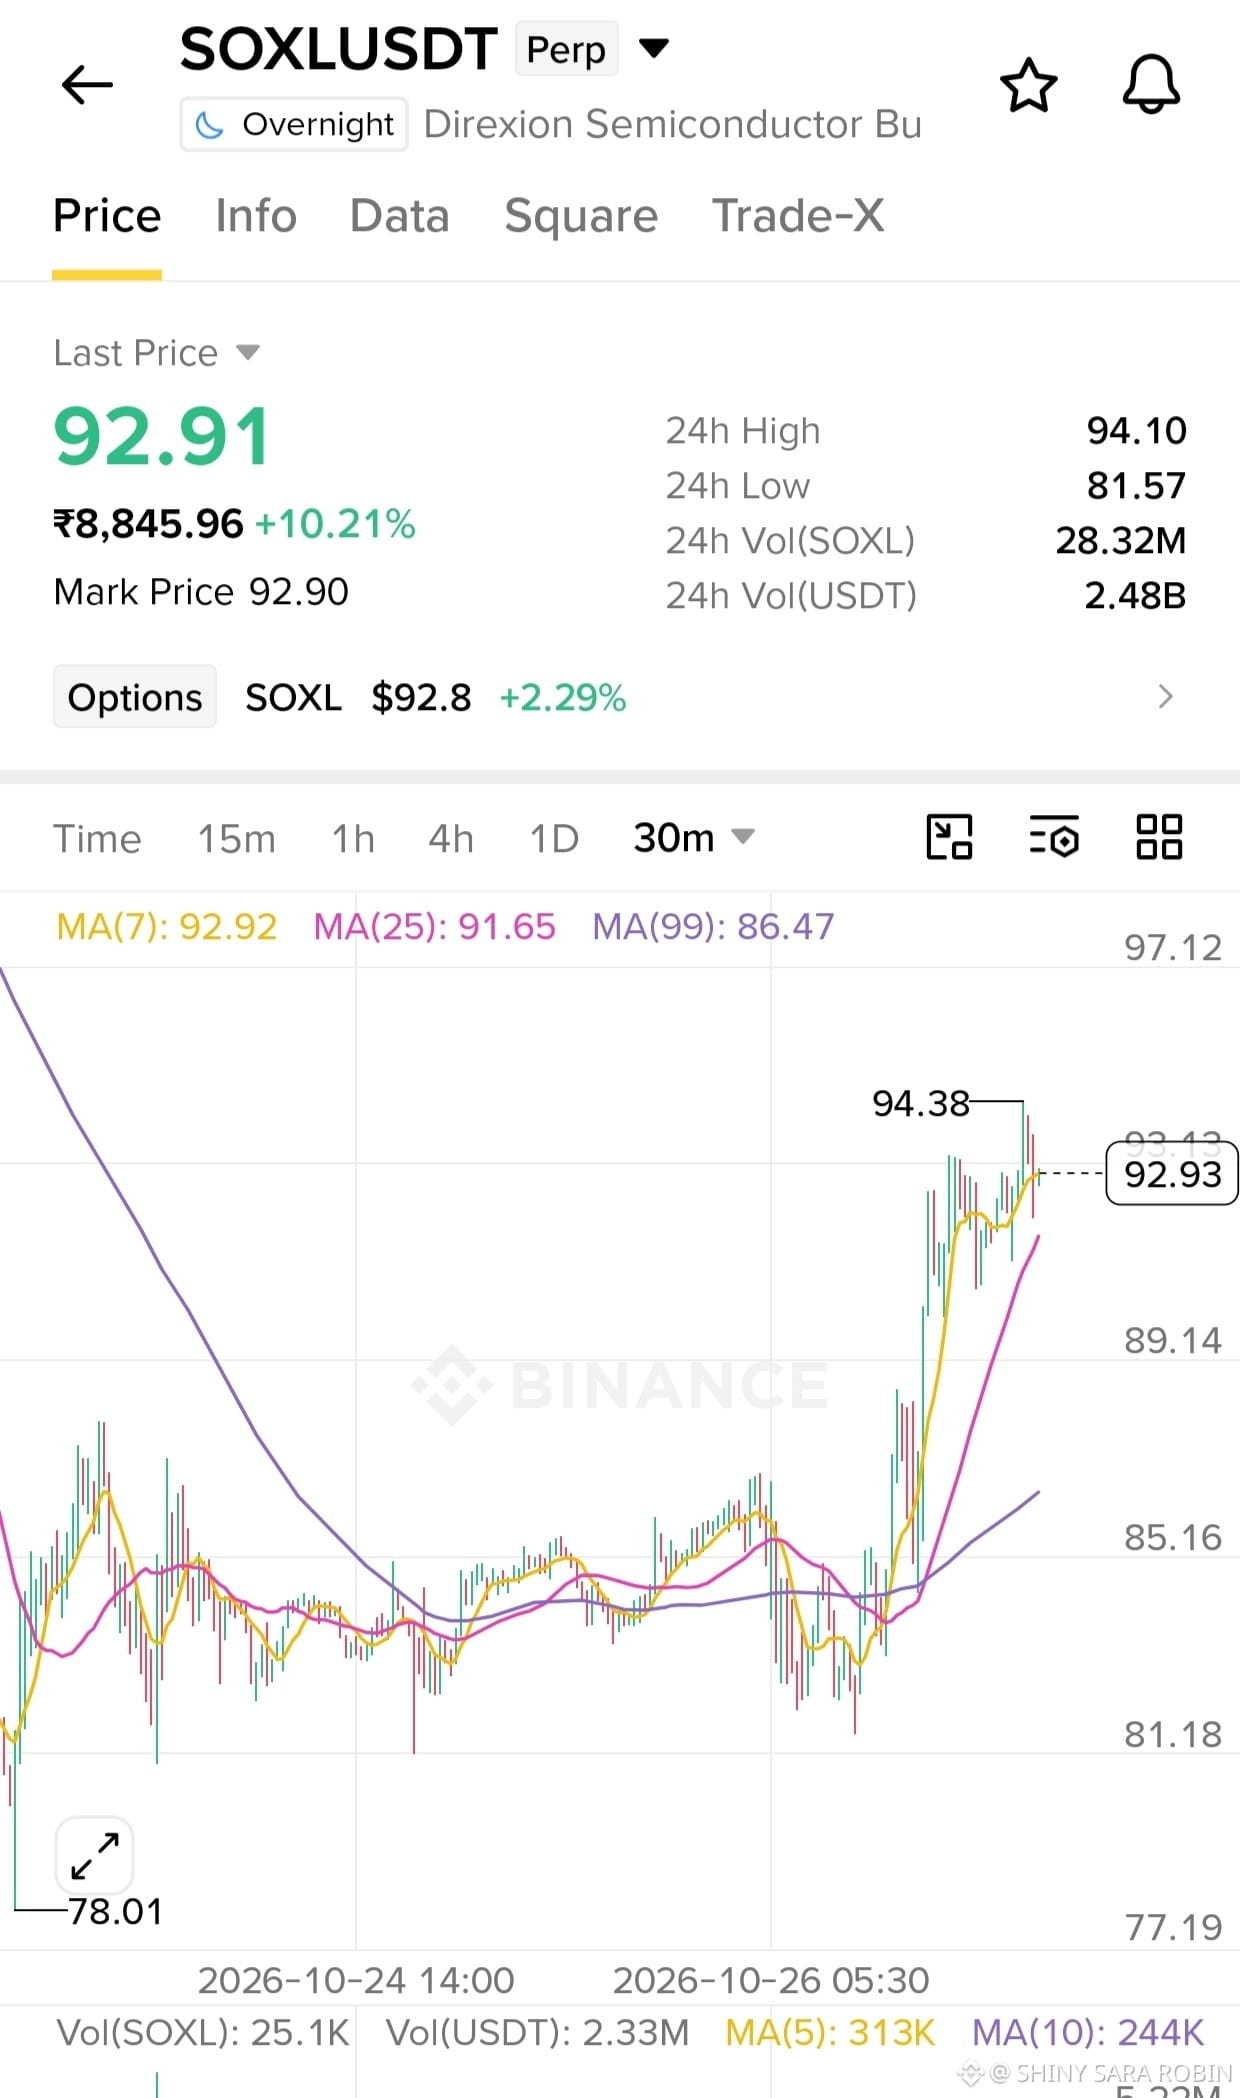
$SOXLUSDT Long
Einstieg: 92.00–92.70
SL: 90.80
TP1: 94.30
TP2: 95.80
TP3: 97.00
SOXL zeigt nach einem starken Ausbruch eine kräftige Aufwärtsdynamik. Der Kurs liegt über den wichtigen gleitenden Durchschnitten, aber der Bereich von 94.10–94.38 stellt einen unmittelbaren Widerstand dar. Ein klarer Ausbruch könnte einen weiteren Anstieg auslösen. Warte auf einen Rücksetzer oder eine Bestätigung, anstatt dem Kursanstieg hinterherzujagen.
$SOXL
{future}(SOXLUSDT)
$SOXLUSDT Long
Einstieg: 92.00–92.70
SL: 90.80
TP1: 94.30
TP2: 95.80
TP3: 97.00
SOXL zeigt nach einem starken Ausbruch eine kräftige Aufwärtsdynamik. Der Kurs liegt über den wichtigen gleitenden Durchschnitten, aber der Bereich von 94.10–94.38 stellt einen unmittelbaren Widerstand dar. Ein klarer Ausbruch könnte einen weiteren Anstieg auslösen. Warte auf einen Rücksetzer oder eine Bestätigung, anstatt dem Kursanstieg hinterherzujagen.
$SOXL
75
·
--
Bullisch
Übersetzung ansehen
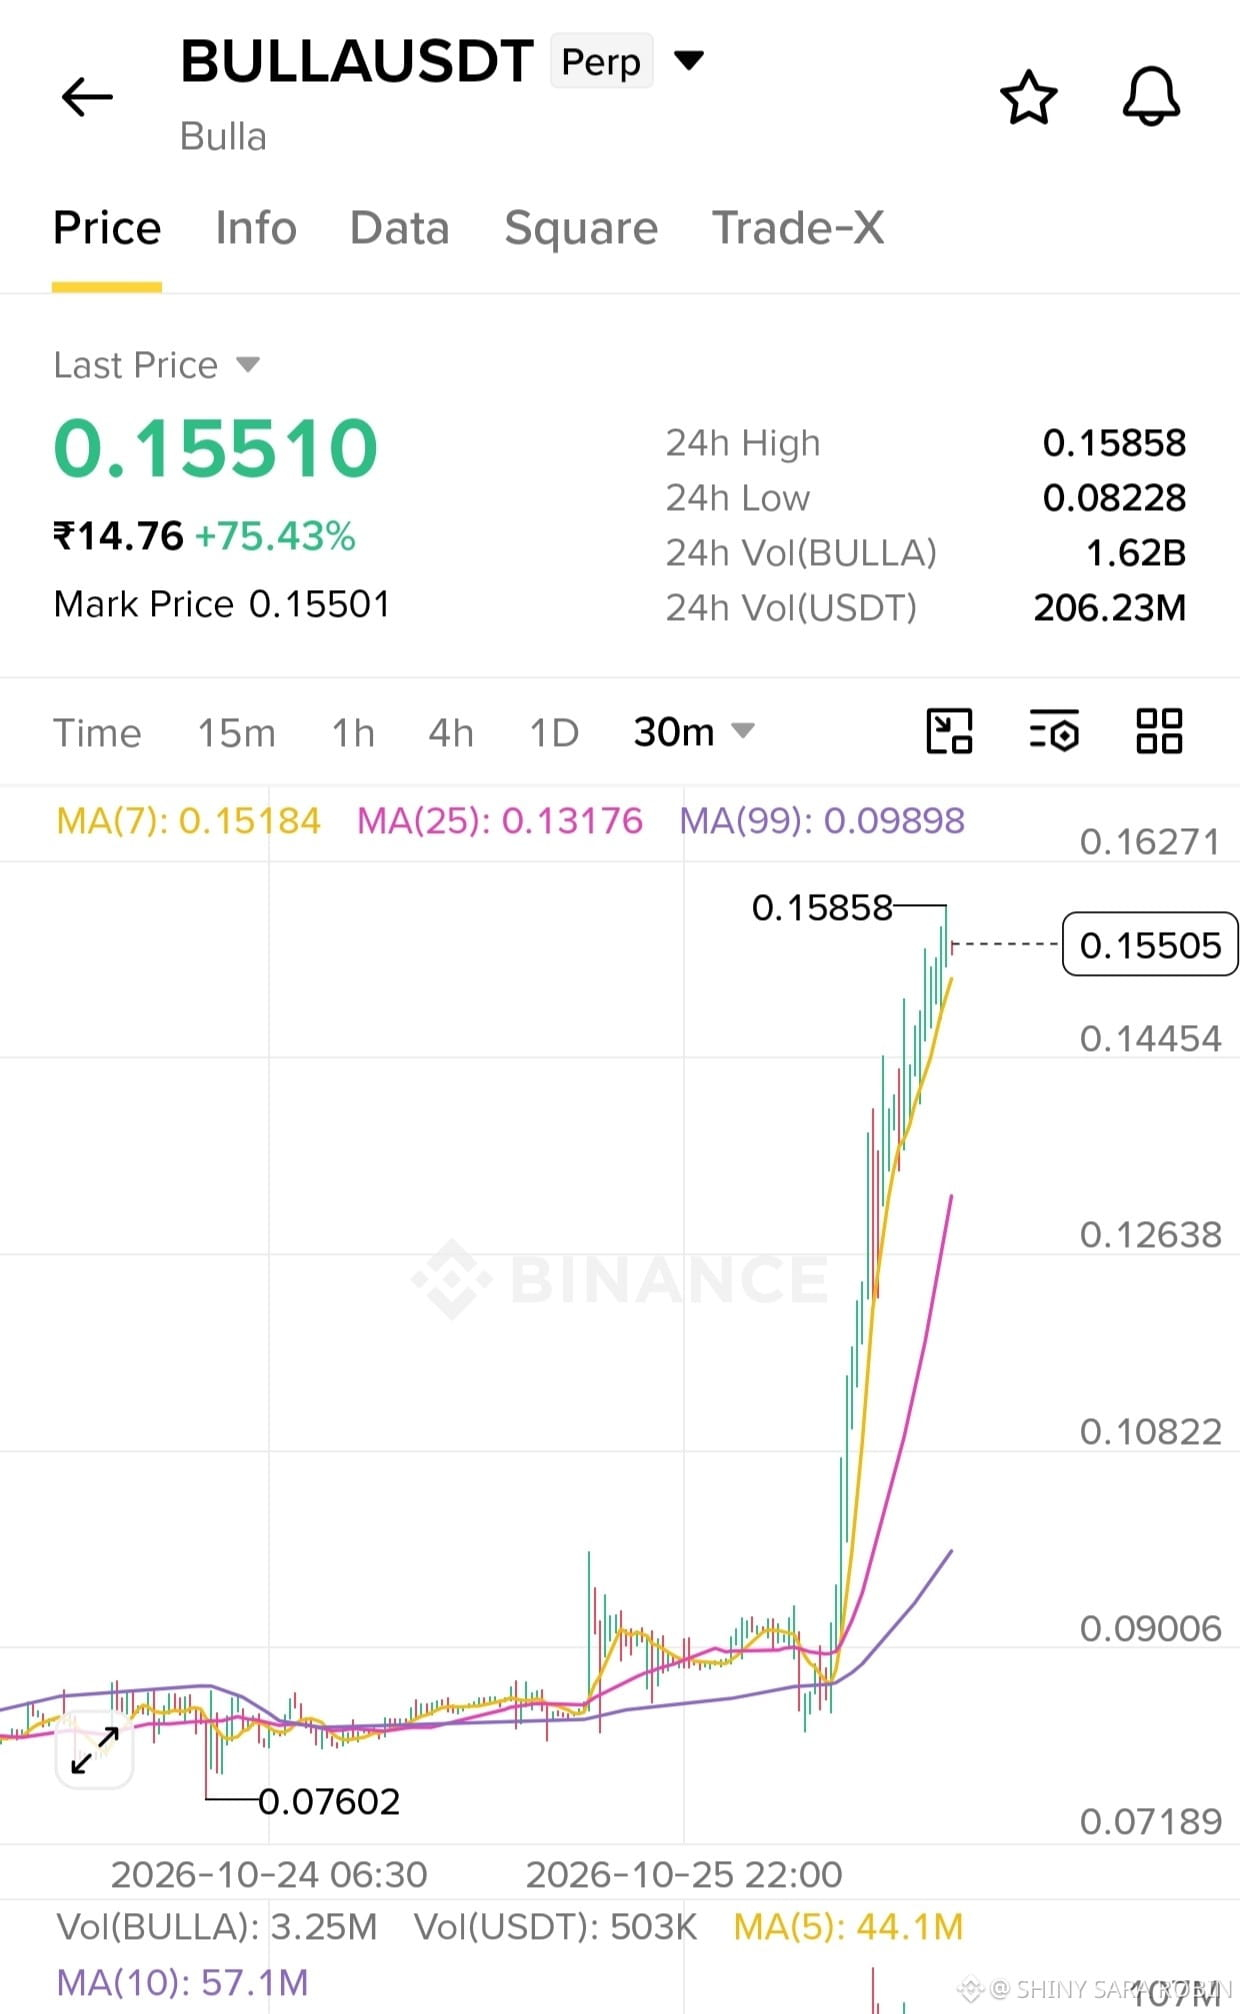
BULLA/USDT LONG Trade Plan
Entry Zone: 0.14800 – 0.15200
Stop Loss: 0.13900
TP1: 0.15850
TP2: 0.16500
TP3: 0.17500
BULLA has surged approximately 75% in 24 hours, showing strong buying momentum.
The price is above MA(7) at 0.15184, MA(25) at 0.13176, and MA(99) at 0.09898.
The recent high of 0.15858 is the immediate resistance to watch.
Because the price has risen rapidly, profit-taking and sharp pullbacks are possible.
A sustained move above 0.15858 could open the way toward higher targets. Losing 0.14800 would weaken the immediate momentum.
$BULLA
{future}(BULLAUSDT)
BULLA/USDT LONG Trade Plan
Entry Zone: 0.14800 – 0.15200
Stop Loss: 0.13900
TP1: 0.15850
TP2: 0.16500
TP3: 0.17500
BULLA has surged approximately 75% in 24 hours, showing strong buying momentum.
The price is above MA(7) at 0.15184, MA(25) at 0.13176, and MA(99) at 0.09898.
The recent high of 0.15858 is the immediate resistance to watch.
Because the price has risen rapidly, profit-taking and sharp pullbacks are possible.
A sustained move above 0.15858 could open the way toward higher targets. Losing 0.14800 would weaken the immediate momentum.
$BULLA
6
·
--
Bullisch
Übersetzung ansehen
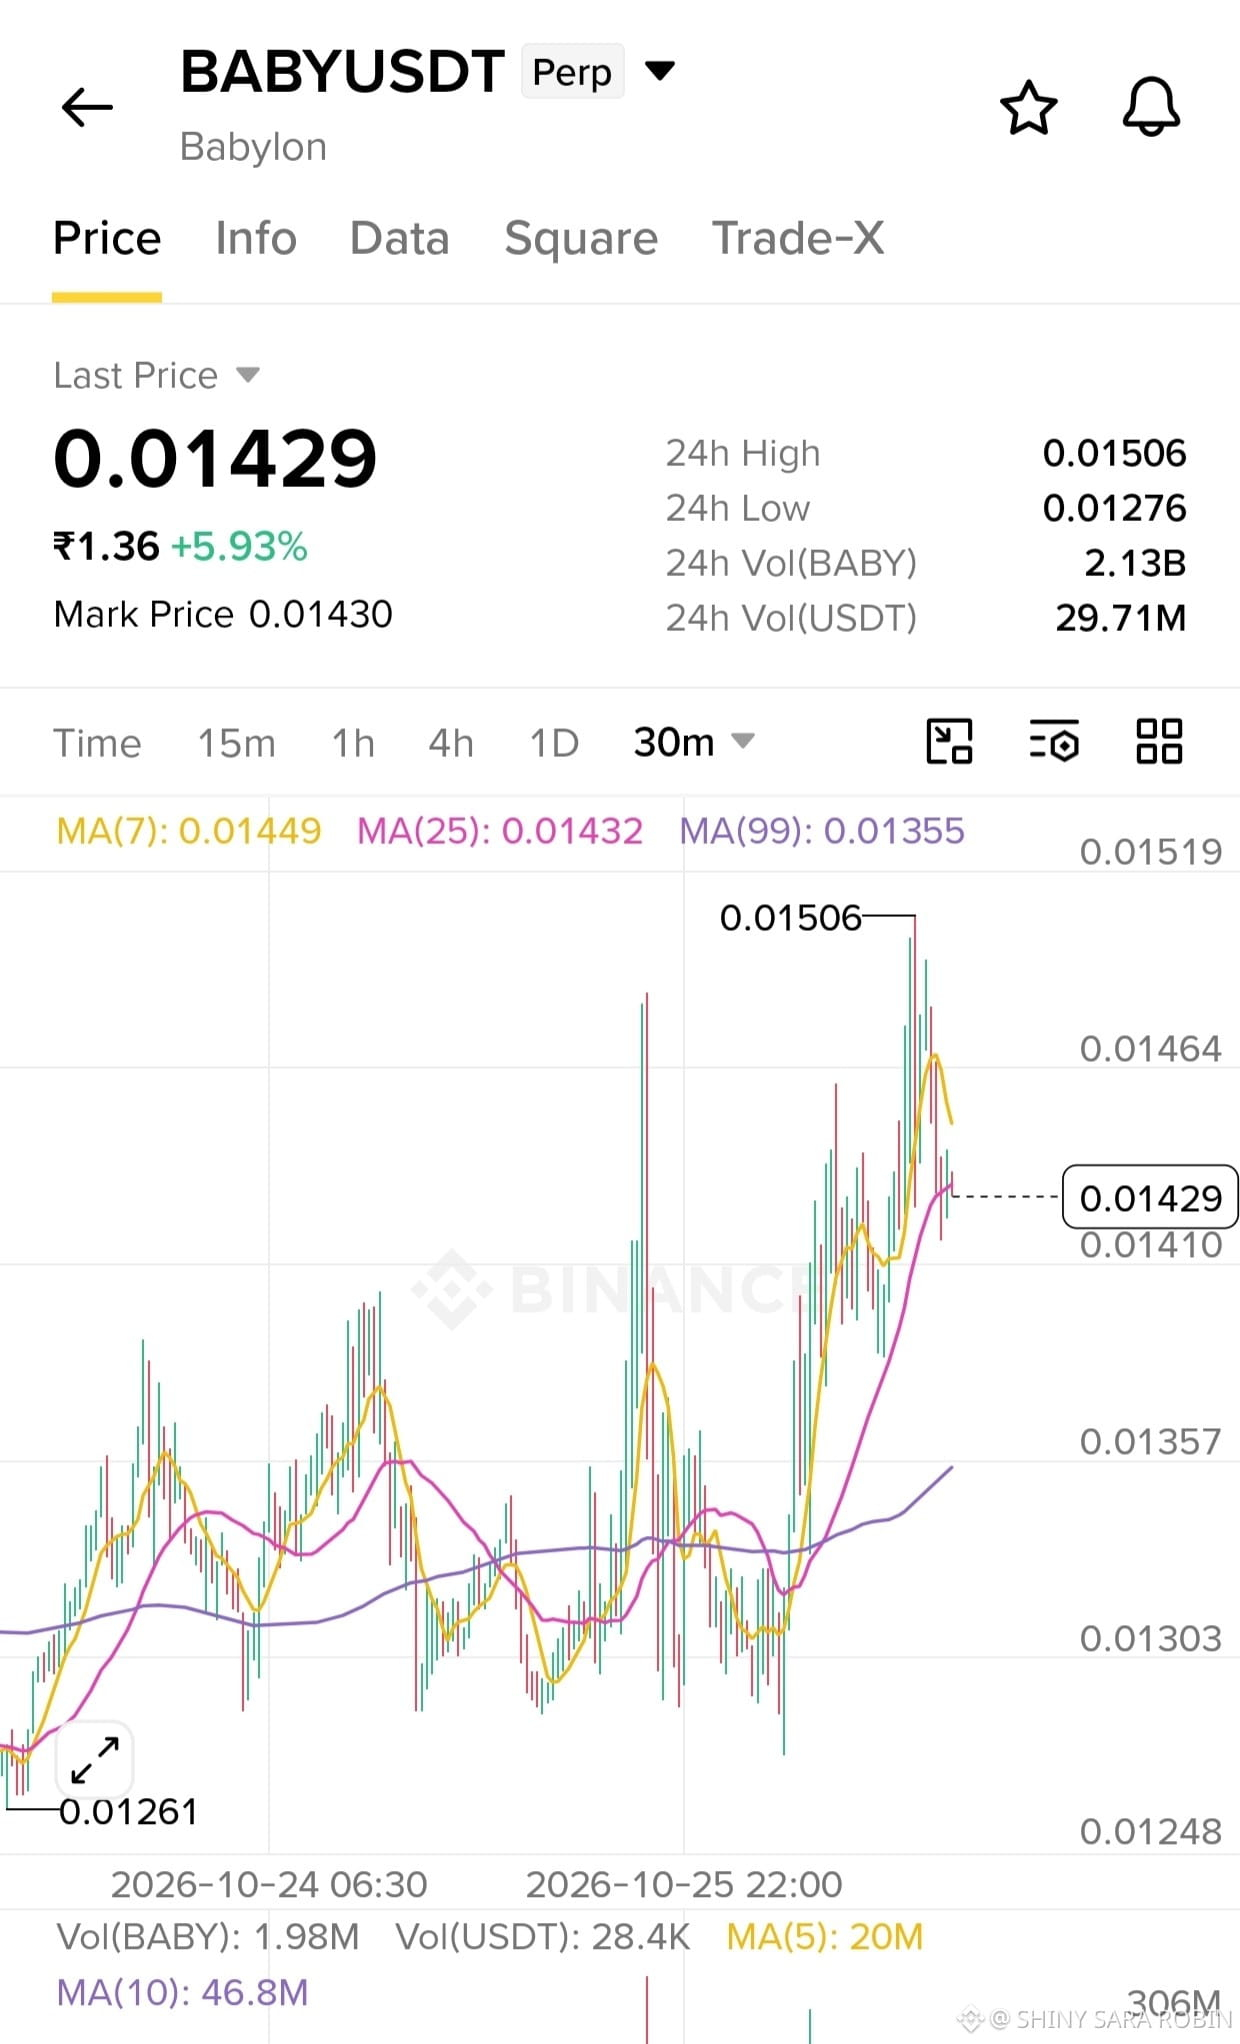
BABY/USDT LONG Trade Plan
Entry Zone: 0.01400 – 0.01420
Stop Loss: 0.01365
TP1: 0.01460
TP2: 0.01490
TP3: 0.01505
BABY is trading above MA(99) at 0.01355, suggesting the broader short-term trend remains positive.
The price has pulled back from 0.01506 after a strong upward move.
MA(7) at 0.01449 and MA(25) at 0.01432 are above the current price, so buyers need to reclaim these levels.
Support around 0.01400–0.01410 could provide a bounce opportunity.
A sustained break below 0.01365 would weaken the bullish structure.
$BABY
{future}(BABYUSDT)
BABY/USDT LONG Trade Plan
Entry Zone: 0.01400 – 0.01420
Stop Loss: 0.01365
TP1: 0.01460
TP2: 0.01490
TP3: 0.01505
BABY is trading above MA(99) at 0.01355, suggesting the broader short-term trend remains positive.
The price has pulled back from 0.01506 after a strong upward move.
MA(7) at 0.01449 and MA(25) at 0.01432 are above the current price, so buyers need to reclaim these levels.
Support around 0.01400–0.01410 could provide a bounce opportunity.
A sustained break below 0.01365 would weaken the bullish structure.
$BABY
14
Anmelden und weiter Inhalte entdecken
Krypto-Nutzer weltweit auf Binance Square kennenlernen
⚡️ Bleib in Sachen Krypto stets am Puls.
💬 Die weltgrößte Kryptobörse vertraut darauf.
👍 Erhalte verlässliche Einblicke von verifizierten Creators.
E-Mail-Adresse/Telefonnummer
Trendthemen
BitcoinSlipsBelow$80KAgain
493 Aufrufe
20 Kommentare
BTC blutet, während die Wale abziehen — im Schatten eines Unternehmensgebots
Sieben Tage im Minus, und nicht Kleinanleger haben den Rückgang verursacht.
Der BTC schloss am 27. Okt. bei etwa 79.796, rund 2,6 % weniger als vor 7 Tagen und rund 5,2 % weniger als vor 30 Tagen. Der tägliche RSI(12) liegt bei 39,8. Die Spanne der Woche: Hoch bei etwa 84.377 (22. Okt.), Tief bei etwa 79.220 (24. Okt.). Keine Kapitulationskerze. Keine Rückeroberung der 84.000. Nur ein stetiges Abrutschen.
Die Angebotsseite spricht für sich. Inaktive Wallets bewegten 2.571 BTC (etwa 206,5 Mio. $) in Richtung institutioneller Börsen. Das ist Angebot, das an der Handelsplattform ankommt, nicht sie verlässt. Auch der Appetit der Treasury-Seite ließ nach — Strategy leitete 204,9 Mio. $ in Aktienrückkäufe um, statt in BTC.
Die Nachfrage im Hintergrund kommt von Unternehmen, nicht von Spekulanten. Strive erwarb 6.182 BTC (etwa 511,4 Mio. $); börsennotierte Unternehmen kauften zusammen mehr als 6.200 BTC. Das ist ein stichhaltiges Argument für einen echten Boden nahe 79.700 $ — aber ein Boden ist kein Auslöser für einen Ausbruch.
Das Momentum ist nicht auf der Seite der Bullen. Das MACD-Histogramm liegt bei −23,99, der Kurs unter dem 99-EMA. Das Aufwärtspotenzial bleibt unter etwa 80.500 $ begrenzt, bis sich diese Struktur dreht.
Die Positionierung ist leicht bullish, aber nicht euphorisch. Umfrage in der Square-Community: 2.116 bullish gegenüber 1.714 bearish bei insgesamt 3.830 Stimmen. Eine begrenzte Stichprobe — wissenswert, aber kein Grund, allein darauf zu handeln.
Meine Einschätzung: Hier wird in eine von Unternehmen getragene Nachfrage hinein verteilt. Der Boden ist real; das Momentum fehlt. Entscheidend ist diese Woche, ob die Zone zwischen 79.200 und 79.700 den Zufluss an die Börsen aufnehmen kann.
#BitcoinSlipsBelow$80KAgain
_Mr_Singh_
·0 Likes
·418 Aufrufe
ThailandLaunchesWORPTStablecoinToQRPaymentApp
304 Aufrufe
46 Kommentare
StrategySkipsBitcoinPurchasesSpends$205MOnSTRCBuybacks
2,900 Aufrufe
66 Kommentare