
Stitch Degen
12 Beiträge

Stitch Degen
Melden
Nutzer blockieren
X : https://x.com/stitchdegen
Trade eröffnen
Regelmäßiger Trader
2.5 Jahre
1 Following
52 Follower
41 Like gegeben
Beiträge
Portfolio
·
--
Verifiziert

Artikel
Bubblemaps wird zu mehr als nur einem Tool, das man öffnet, nachdem ein Token ausverkauft wurdeIch habe in den letzten Tagen das neue Bubblemaps-Update getestet, und ich denke, die größte Veränderung ist gar nicht eigentlich die Bubble-Map selbst.
Genau dann, wenn du es eigentlich verwenden sollst
Seit Jahren sah mein üblicher Workflow mit Bubblemaps ungefähr so aus :
Finde ein Token → prüfe den Chart → öffne Bubblemaps → untersuche die Holder → wechsle zu einer anderen Plattform, um zu handeln
Das Redesign vom 15. September versucht, diesen gesamten Prozess um einen Schritt früher zu verlagern :
Finde → Prüfe → Kaufe
Alles innerhalb derselben Plattform
Und als jemand, der viel Zeit damit verbringt, neue Memecoins zu recherchieren, ergibt diese Richtung für mich sehr viel Sinn
Bubblemaps wird zu mehr als nur einem Tool, das man öffnet, nachdem ein Token ausverkauft wurde
Ich habe in den letzten Tagen das neue Bubblemaps-Update getestet, und ich denke, die größte Veränderung ist gar nicht eigentlich die Bubble-Map selbst.
Genau dann, wenn du es eigentlich verwenden sollst
Seit Jahren sah mein üblicher Workflow mit Bubblemaps ungefähr so aus :
Finde ein Token → prüfe den Chart → öffne Bubblemaps → untersuche die Holder → wechsle zu einer anderen Plattform, um zu handeln
Das Redesign vom 15. September versucht, diesen gesamten Prozess um einen Schritt früher zu verlagern :
Finde → Prüfe → Kaufe
Alles innerhalb derselben Plattform
Und als jemand, der viel Zeit damit verbringt, neue Memecoins zu recherchieren, ergibt diese Richtung für mich sehr viel Sinn
Genau dann, wenn du es eigentlich verwenden sollst
Seit Jahren sah mein üblicher Workflow mit Bubblemaps ungefähr so aus :
Finde ein Token → prüfe den Chart → öffne Bubblemaps → untersuche die Holder → wechsle zu einer anderen Plattform, um zu handeln
Das Redesign vom 15. September versucht, diesen gesamten Prozess um einen Schritt früher zu verlagern :
Finde → Prüfe → Kaufe
Alles innerhalb derselben Plattform
Und als jemand, der viel Zeit damit verbringt, neue Memecoins zu recherchieren, ergibt diese Richtung für mich sehr viel Sinn
1
8
17.5k
·
--
Übersetzung ansehen
I’m back on Binance Square
It’s been a while since I was really active here, but I think it’s time to come back
I’m still trading every day, following new narratives, looking for good setups and trying to stay early whenever something interesting starts moving
From now on, I’ll share more of that here , what I’m watching, what I’m trading, my entries, key levels and some of my thoughts on the market
Nothing too complicated. Just sharing what I actually see and trade every day
Good to be back. Let’s see what the market gives us 🤝
I’m back on Binance Square
It’s been a while since I was really active here, but I think it’s time to come back
I’m still trading every day, following new narratives, looking for good setups and trying to stay early whenever something interesting starts moving
From now on, I’ll share more of that here , what I’m watching, what I’m trading, my entries, key levels and some of my thoughts on the market
Nothing too complicated. Just sharing what I actually see and trade every day
Good to be back. Let’s see what the market gives us 🤝
It’s been a while since I was really active here, but I think it’s time to come back
I’m still trading every day, following new narratives, looking for good setups and trying to stay early whenever something interesting starts moving
From now on, I’ll share more of that here , what I’m watching, what I’m trading, my entries, key levels and some of my thoughts on the market
Nothing too complicated. Just sharing what I actually see and trade every day
Good to be back. Let’s see what the market gives us 🤝
1
157
·
--
Übersetzung ansehen
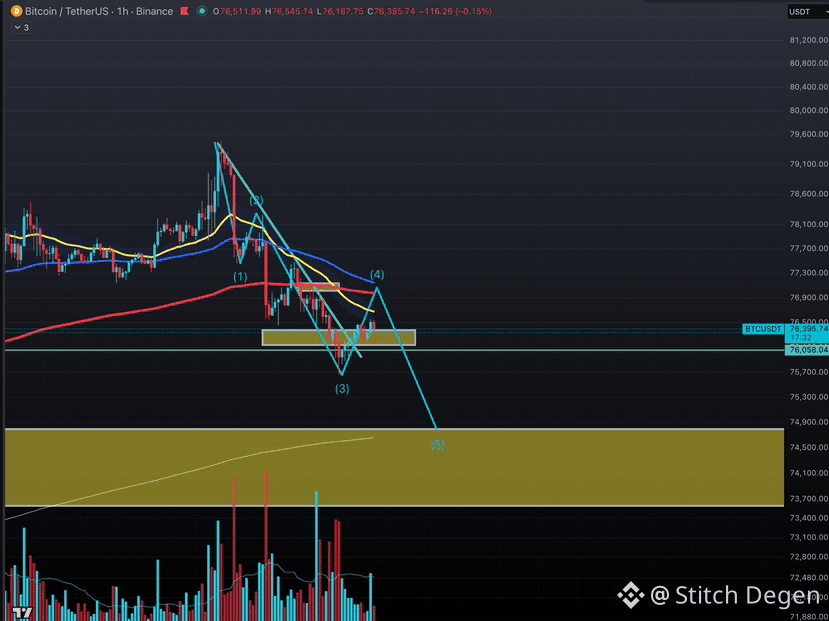
I still lean toward the market consolidating around 73–75k before continuing up to 83–92k
I think heading into early May, price will be pushed to attract liquidity going into the summer
If you want to short, you can look for entries around the 77.3k zone
I still lean toward the market consolidating around 73–75k before continuing up to 83–92k
I think heading into early May, price will be pushed to attract liquidity going into the summer
If you want to short, you can look for entries around the 77.3k zone
I think heading into early May, price will be pushed to attract liquidity going into the summer
If you want to short, you can look for entries around the 77.3k zone
87
·
--
Übersetzung ansehen
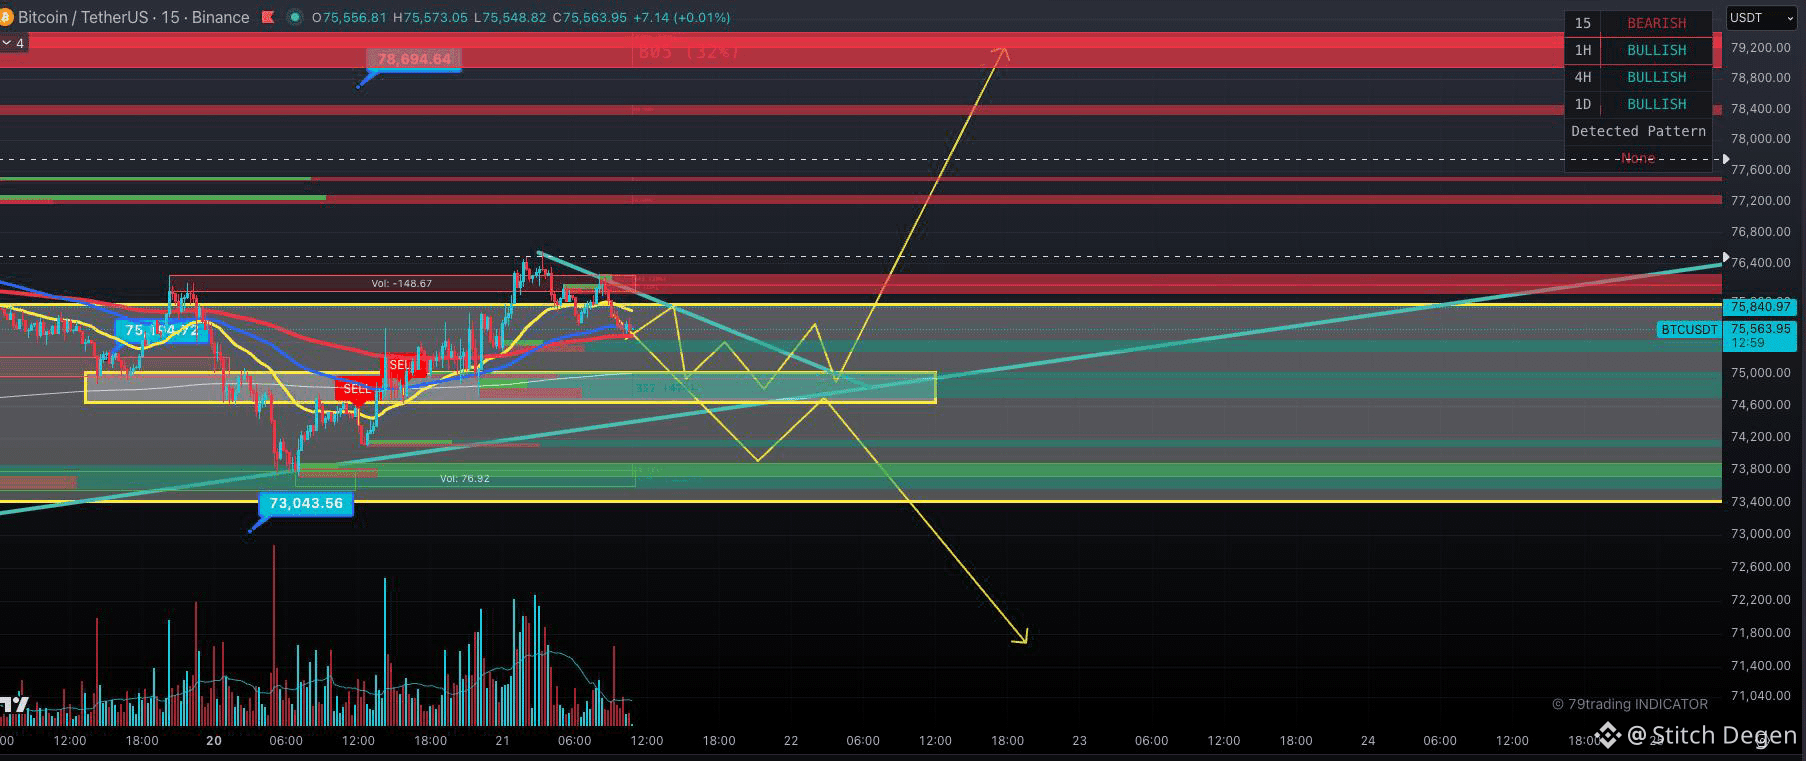
The market is still ranging. The two key levels right now are 74,600 and 76,600.
Whichever level breaks, the market will likely make a strong move in that direction
My X : https://x.com/stitchdegen?s=21
$BTC
The market is still ranging. The two key levels right now are 74,600 and 76,600.
Whichever level breaks, the market will likely make a strong move in that direction
My X : https://x.com/stitchdegen?s=21
$BTC
Whichever level breaks, the market will likely make a strong move in that direction
My X : https://x.com/stitchdegen?s=21
$BTC
136
·
--
Übersetzung ansehen
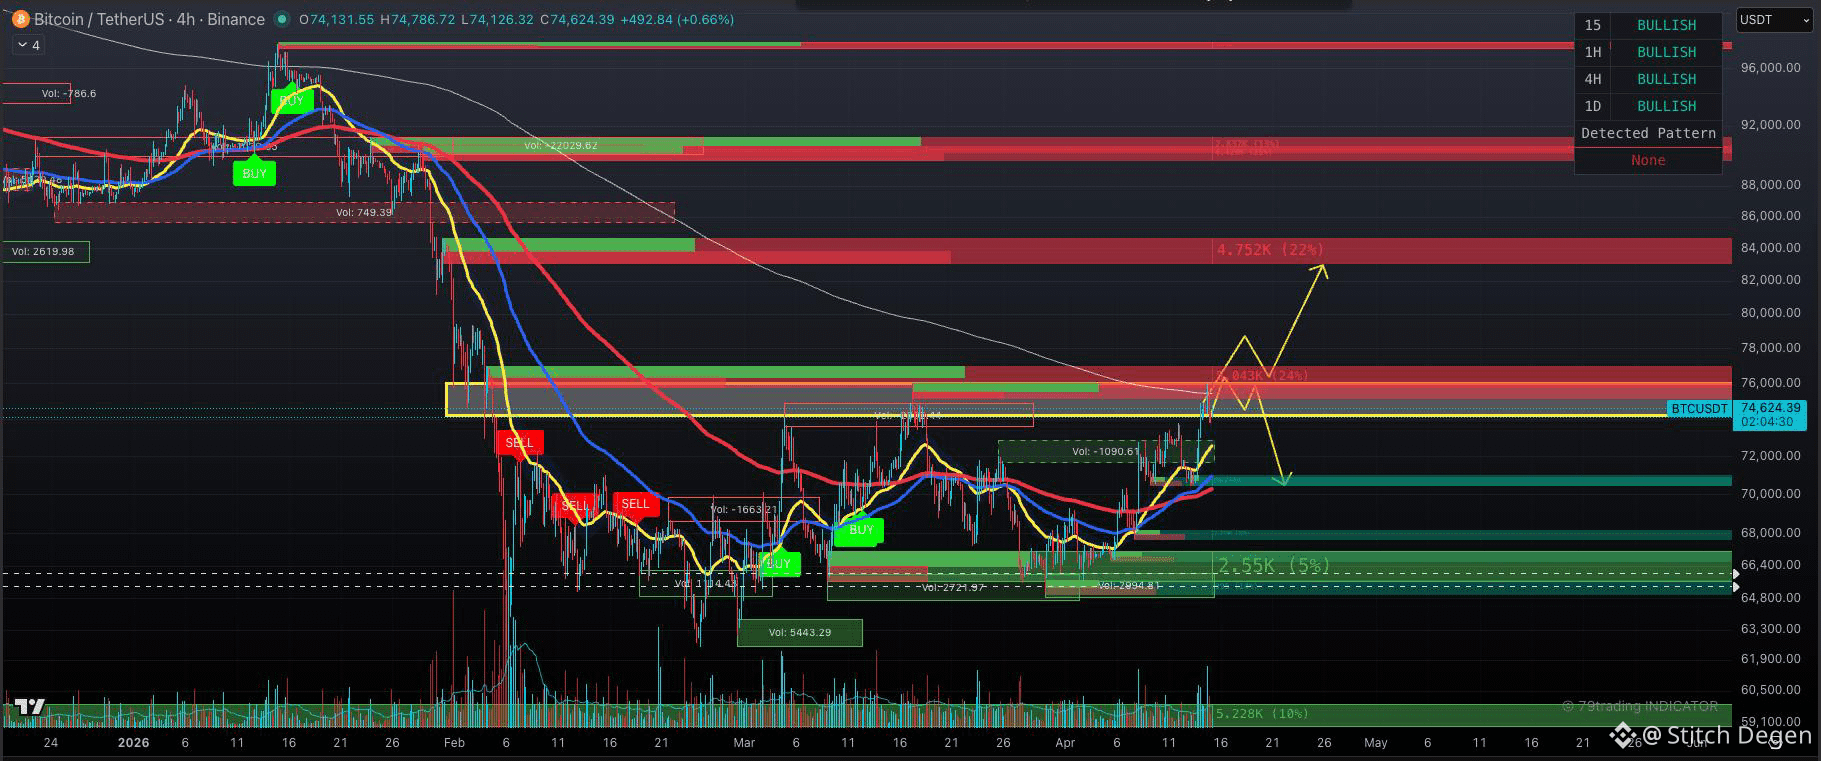
BTC is currently sitting above the strongest resistance zone of the past 3 months. The key question now is: will it break out or return to the lower range?
If it breaks, we could see a strong push toward the 80 - 90k region. But this does NOT mean BTC has formed a cycle bottom. Don’t go all-in and get trapped up there
If it continues to range below 77k into the weekend, next week it could revisit the 70k area for accumulation. If 70k breaks, there’s a high chance it drops to the lower range around 65–62k
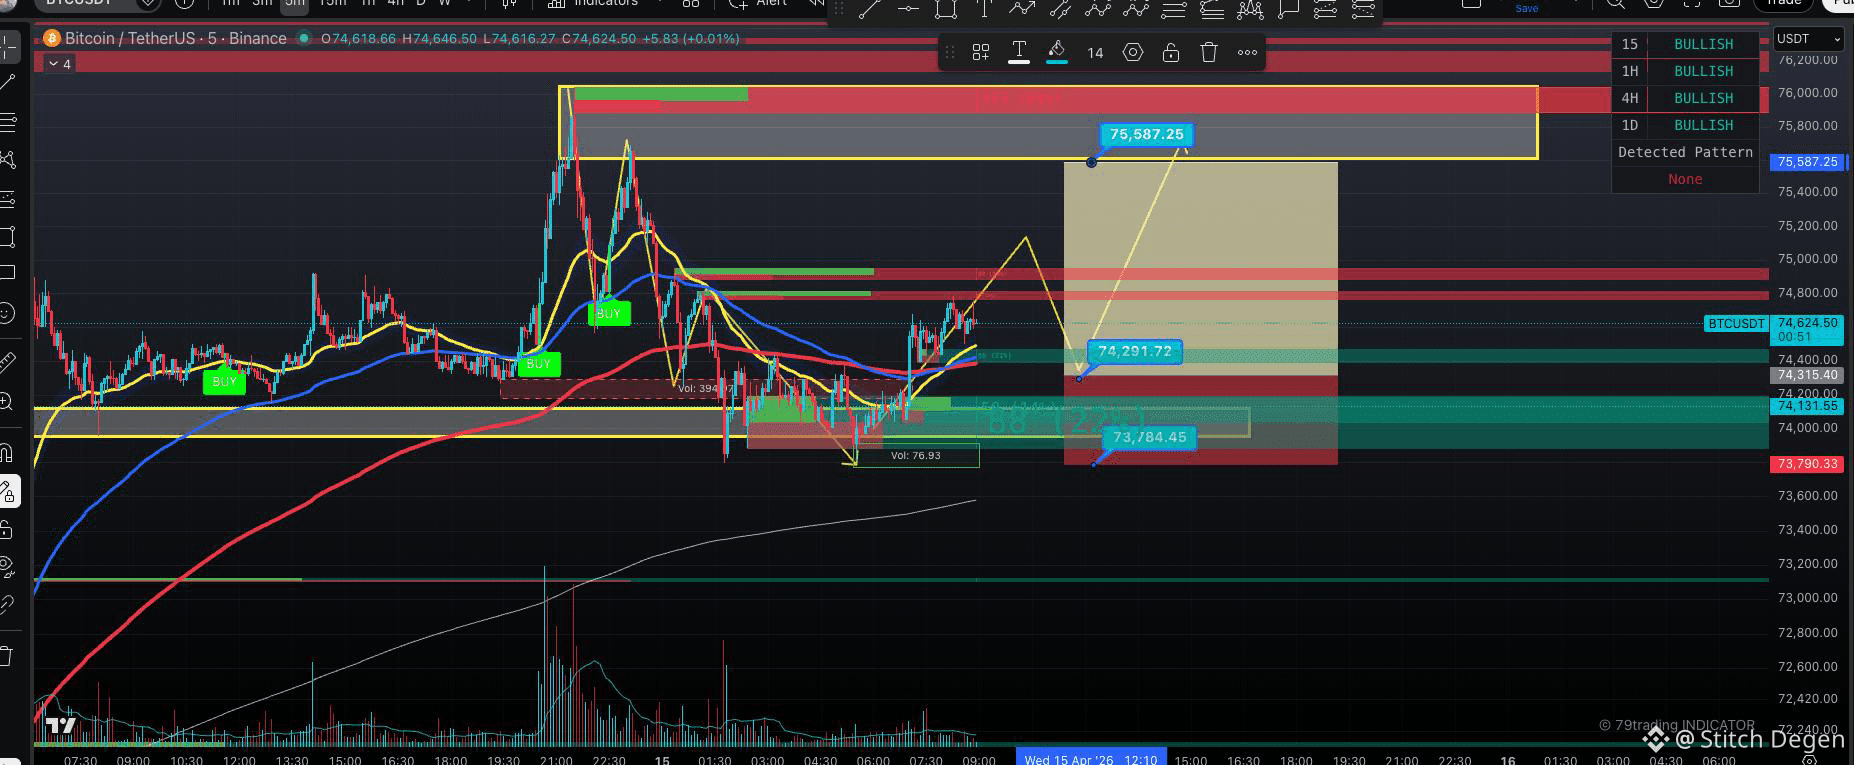
Scalping: In the short term, you can look for a breakout above 75k, then wait for a pullback to retest 74.2k for a setup like the one shown
Just sharing this with you
BTC is currently sitting above the strongest resistance zone of the past 3 months. The key question now is: will it break out or return to the lower range?
If it breaks, we could see a strong push toward the 80 - 90k region. But this does NOT mean BTC has formed a cycle bottom. Don’t go all-in and get trapped up there
If it continues to range below 77k into the weekend, next week it could revisit the 70k area for accumulation. If 70k breaks, there’s a high chance it drops to the lower range around 65–62k
Scalping: In the short term, you can look for a breakout above 75k, then wait for a pullback to retest 74.2k for a setup like the one shown
Just sharing this with you
If it breaks, we could see a strong push toward the 80 - 90k region. But this does NOT mean BTC has formed a cycle bottom. Don’t go all-in and get trapped up there
If it continues to range below 77k into the weekend, next week it could revisit the 70k area for accumulation. If 70k breaks, there’s a high chance it drops to the lower range around 65–62k
Scalping: In the short term, you can look for a breakout above 75k, then wait for a pullback to retest 74.2k for a setup like the one shown
Just sharing this with you
2
1
115
·
--
Übersetzung ansehen
BTC is currently retesting the strongest resistance zone of the past 2 months , the top of the channel , but there’s still no clear signal of a breakout
On the daily timeframe, price is still ranging, momentum is weak, and there’s no strong sign of capital flowing back in
Scenarios :
- Bullish : If BTC breaks 77.4K => short-term liquidity could return (1–2 weeks), but still a “shear the sheep” setup
- Bearish : If it keeps ranging at the top => buy pressure fades => likely forms a lower timeframe downtrend => favor short setups
Plan :
Still waiting for the 40K–50K zone to start DCA into ETH
For now, better to stay in fiat and wait for opportunities
Crypto can make you rich fast , but not
sustainably rich
$BTC $ETH
{spot}(ETHUSDT)
{spot}(BTCUSDT)
BTC is currently retesting the strongest resistance zone of the past 2 months , the top of the channel , but there’s still no clear signal of a breakout
On the daily timeframe, price is still ranging, momentum is weak, and there’s no strong sign of capital flowing back in
Scenarios :
- Bullish : If BTC breaks 77.4K => short-term liquidity could return (1–2 weeks), but still a “shear the sheep” setup
- Bearish : If it keeps ranging at the top => buy pressure fades => likely forms a lower timeframe downtrend => favor short setups
Plan :
Still waiting for the 40K–50K zone to start DCA into ETH
For now, better to stay in fiat and wait for opportunities
Crypto can make you rich fast , but not
sustainably rich
$BTC $ETH
On the daily timeframe, price is still ranging, momentum is weak, and there’s no strong sign of capital flowing back in
Scenarios :
- Bullish : If BTC breaks 77.4K => short-term liquidity could return (1–2 weeks), but still a “shear the sheep” setup
- Bearish : If it keeps ranging at the top => buy pressure fades => likely forms a lower timeframe downtrend => favor short setups
Plan :
Still waiting for the 40K–50K zone to start DCA into ETH
For now, better to stay in fiat and wait for opportunities
Crypto can make you rich fast , but not
sustainably rich
$BTC $ETH
33
·
--
Übersetzung ansehen
Plan BTC$BTC has been consolidating within the 65K–70K range over the past week
A breakout above 70K could release the built-up pressure from this consolidation phase, forming a V-shaped recovery structure and potentially driving BTC toward the 72K–75K–77K range, with 77K being a strong upside target
On the downside, a break below 65K would likely trigger a trendline breakdown and structural failure, increasing the probability of a deeper move toward the 62K–58K zone
For your information
{spot}(BTCUSDT)
Plan BTC
$BTC has been consolidating within the 65K–70K range over the past week
A breakout above 70K could release the built-up pressure from this consolidation phase, forming a V-shaped recovery structure and potentially driving BTC toward the 72K–75K–77K range, with 77K being a strong upside target
On the downside, a break below 65K would likely trigger a trendline breakdown and structural failure, increasing the probability of a deeper move toward the 62K–58K zone
For your information
A breakout above 70K could release the built-up pressure from this consolidation phase, forming a V-shaped recovery structure and potentially driving BTC toward the 72K–75K–77K range, with 77K being a strong upside target
On the downside, a break below 65K would likely trigger a trendline breakdown and structural failure, increasing the probability of a deeper move toward the 62K–58K zone
For your information
1
145
·
--
Übersetzung ansehen
BTC DAILY PLAN 07/11
If the market had managed to hold the 100.8K zone yesterday, it would’ve been ideal for me. But since it broke below that, the previous recovery structure has also been invalidated.
So for now, all timeframes are showing a downtrend. My expectation is for a small bounce back to the previous top for a double-top test before a strong continuation downward → my AI will help trigger this setup, and I’ll post when the signal comes.
At the moment, if anyone wants to LONG, better stick with trending plays. High-cap coins, as well as $ETH and $BTC , don’t look good right now.
{future}(BTCUSDT)
{future}(ETHUSDT)
BTC DAILY PLAN 07/11
If the market had managed to hold the 100.8K zone yesterday, it would’ve been ideal for me. But since it broke below that, the previous recovery structure has also been invalidated.
So for now, all timeframes are showing a downtrend. My expectation is for a small bounce back to the previous top for a double-top test before a strong continuation downward → my AI will help trigger this setup, and I’ll post when the signal comes.
At the moment, if anyone wants to LONG, better stick with trending plays. High-cap coins, as well as $ETH and $BTC , don’t look good right now.
If the market had managed to hold the 100.8K zone yesterday, it would’ve been ideal for me. But since it broke below that, the previous recovery structure has also been invalidated.
So for now, all timeframes are showing a downtrend. My expectation is for a small bounce back to the previous top for a double-top test before a strong continuation downward → my AI will help trigger this setup, and I’ll post when the signal comes.
At the moment, if anyone wants to LONG, better stick with trending plays. High-cap coins, as well as $ETH and $BTC , don’t look good right now.
8
19
·
--
Bitcoin Ausblick (6. Nov 2025)
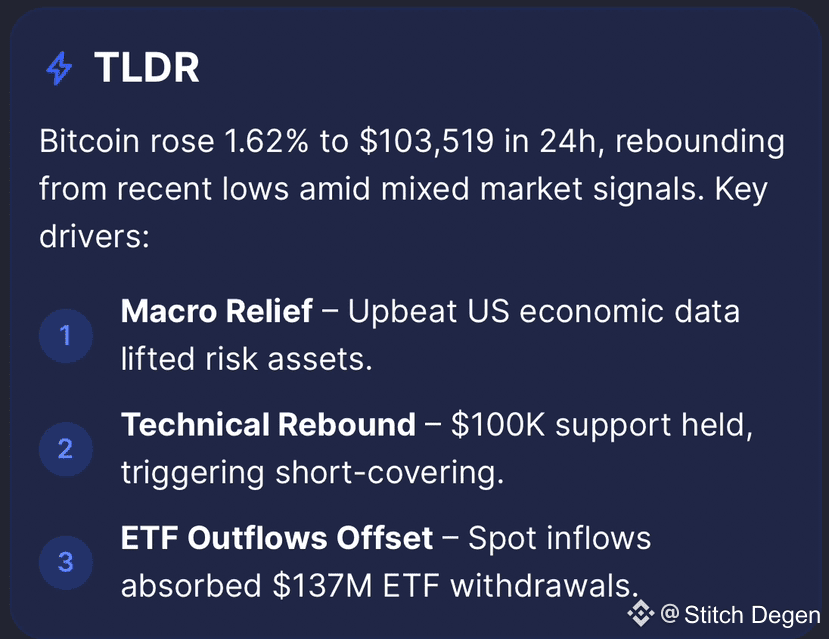
Bitcoin handelt um $103.000–$104.000, leicht erholend nach dem starken Rückgang von gestern unter $100K. Der Hauptgrund war eine Liquidation von $1,14 Milliarden, die kurzfristige Panik auslöste. Galaxy Digital senkte auch sein Jahresendziel auf $120K, was auf eine Abkühlungsphase nach einem überhitzten Lauf hinweist.
Dennoch bleibt die $100K-Zone eine starke psychologische Unterstützung. On-Chain-Daten zeigen, dass kluge Investoren den Rückgang nutzen, was auf eine mögliche technische Erholung in Richtung $110K–$120K hindeutet, wenn BTC dieses Niveau hält.
#Auswirkungen auf Solana (SOL)
SOL handelt um $160, leicht gesunken, während die Liquidität von Altcoins während der BTC-Volatilität zurückgeht. Das Handelsvolumen im Solana-Netzwerk ist um fast 20% gesunken, was die Marktvorsicht widerspiegelt. Die Zone von $150–$155 wird jedoch als attraktive Akkumulationszone angesehen, da mehrere große Wallets beginnen, zurückzukehren.
Wenn BTC sich über $100K stabilisiert, könnte SOL in der kommenden Woche schnell in Richtung $175–$180 zurückspringen.
> „BTC schüttelt Hebel heraus, beendet jedoch nicht seinen Zyklus. Sobald es sich stabilisiert, wird SOL einer der schnellsten sein, der zurückspringt.”
$BTC $SOL
{future}(SOLUSDT)
{future}(BTCUSDT)
Bitcoin Ausblick (6. Nov 2025)
Bitcoin handelt um $103.000–$104.000, leicht erholend nach dem starken Rückgang von gestern unter $100K. Der Hauptgrund war eine Liquidation von $1,14 Milliarden, die kurzfristige Panik auslöste. Galaxy Digital senkte auch sein Jahresendziel auf $120K, was auf eine Abkühlungsphase nach einem überhitzten Lauf hinweist.
Dennoch bleibt die $100K-Zone eine starke psychologische Unterstützung. On-Chain-Daten zeigen, dass kluge Investoren den Rückgang nutzen, was auf eine mögliche technische Erholung in Richtung $110K–$120K hindeutet, wenn BTC dieses Niveau hält.
#Auswirkungen auf Solana (SOL)
SOL handelt um $160, leicht gesunken, während die Liquidität von Altcoins während der BTC-Volatilität zurückgeht. Das Handelsvolumen im Solana-Netzwerk ist um fast 20% gesunken, was die Marktvorsicht widerspiegelt. Die Zone von $150–$155 wird jedoch als attraktive Akkumulationszone angesehen, da mehrere große Wallets beginnen, zurückzukehren.
Wenn BTC sich über $100K stabilisiert, könnte SOL in der kommenden Woche schnell in Richtung $175–$180 zurückspringen.
> „BTC schüttelt Hebel heraus, beendet jedoch nicht seinen Zyklus. Sobald es sich stabilisiert, wird SOL einer der schnellsten sein, der zurückspringt.”
$BTC $SOL
Bitcoin handelt um $103.000–$104.000, leicht erholend nach dem starken Rückgang von gestern unter $100K. Der Hauptgrund war eine Liquidation von $1,14 Milliarden, die kurzfristige Panik auslöste. Galaxy Digital senkte auch sein Jahresendziel auf $120K, was auf eine Abkühlungsphase nach einem überhitzten Lauf hinweist.
Dennoch bleibt die $100K-Zone eine starke psychologische Unterstützung. On-Chain-Daten zeigen, dass kluge Investoren den Rückgang nutzen, was auf eine mögliche technische Erholung in Richtung $110K–$120K hindeutet, wenn BTC dieses Niveau hält.
#Auswirkungen auf Solana (SOL)
SOL handelt um $160, leicht gesunken, während die Liquidität von Altcoins während der BTC-Volatilität zurückgeht. Das Handelsvolumen im Solana-Netzwerk ist um fast 20% gesunken, was die Marktvorsicht widerspiegelt. Die Zone von $150–$155 wird jedoch als attraktive Akkumulationszone angesehen, da mehrere große Wallets beginnen, zurückzukehren.
Wenn BTC sich über $100K stabilisiert, könnte SOL in der kommenden Woche schnell in Richtung $175–$180 zurückspringen.
> „BTC schüttelt Hebel heraus, beendet jedoch nicht seinen Zyklus. Sobald es sich stabilisiert, wird SOL einer der schnellsten sein, der zurückspringt.”
$BTC $SOL
9
84
·
--
Bullisch
Übersetzung ansehen
Solana Market Update – Nov 6, 2025
$SOL is currently trading around $160.10, up +6.47% in the past 24h after dipping to $147.89 earlier today. 24h trading volume remains strong at $7B+, showing that market activity is still hot. Market cap stands at ~$88.49B, keeping SOL in the top 6 crypto assets.
Key factors:
- After the ETF debut, SOL corrected nearly -20%, but this looks like a pullback accumulation phase , downside liquidity has been cleared, and new liquidity clusters are forming around $180–200.
- Institutional inflows are at record highs, helping SOL defend the $150–160 support zone.
- Some negative headlines , like Torrent Capital selling SOL and pressure from related meme tokens (like $BONK) , caused short-term weakness, but strong hands are still holding firm.
Outlook:
– Short term: If SOL holds $155–160, it could bounce toward $162–165 today.
– Long term: Still aiming for $230–400 by late 2025, fueled by upgrades like Alpenglow and continued DeFi + NFT expansion.
Overall: SOL looks slightly bullish today with signs of a steady recovery. Stay sharp, stay patient, and DYOR before making moves
$SOL
{spot}(SOLUSDT)
Solana Market Update – Nov 6, 2025
$SOL is currently trading around $160.10, up +6.47% in the past 24h after dipping to $147.89 earlier today. 24h trading volume remains strong at $7B+, showing that market activity is still hot. Market cap stands at ~$88.49B, keeping SOL in the top 6 crypto assets.
Key factors:
- After the ETF debut, SOL corrected nearly -20%, but this looks like a pullback accumulation phase , downside liquidity has been cleared, and new liquidity clusters are forming around $180–200.
- Institutional inflows are at record highs, helping SOL defend the $150–160 support zone.
- Some negative headlines , like Torrent Capital selling SOL and pressure from related meme tokens (like $BONK) , caused short-term weakness, but strong hands are still holding firm.
Outlook:
– Short term: If SOL holds $155–160, it could bounce toward $162–165 today.
– Long term: Still aiming for $230–400 by late 2025, fueled by upgrades like Alpenglow and continued DeFi + NFT expansion.
Overall: SOL looks slightly bullish today with signs of a steady recovery. Stay sharp, stay patient, and DYOR before making moves
$SOL
$SOL is currently trading around $160.10, up +6.47% in the past 24h after dipping to $147.89 earlier today. 24h trading volume remains strong at $7B+, showing that market activity is still hot. Market cap stands at ~$88.49B, keeping SOL in the top 6 crypto assets.
Key factors:
- After the ETF debut, SOL corrected nearly -20%, but this looks like a pullback accumulation phase , downside liquidity has been cleared, and new liquidity clusters are forming around $180–200.
- Institutional inflows are at record highs, helping SOL defend the $150–160 support zone.
- Some negative headlines , like Torrent Capital selling SOL and pressure from related meme tokens (like $BONK) , caused short-term weakness, but strong hands are still holding firm.
Outlook:
– Short term: If SOL holds $155–160, it could bounce toward $162–165 today.
– Long term: Still aiming for $230–400 by late 2025, fueled by upgrades like Alpenglow and continued DeFi + NFT expansion.
Overall: SOL looks slightly bullish today with signs of a steady recovery. Stay sharp, stay patient, and DYOR before making moves
$SOL
13
13
Anmelden und weiter Inhalte entdecken
Krypto-Nutzer weltweit auf Binance Square kennenlernen
⚡️ Bleib in Sachen Krypto stets am Puls.
💬 Die weltgrößte Kryptobörse vertraut darauf.
👍 Erhalte verlässliche Einblicke von verifizierten Creators.
E-Mail-Adresse/Telefonnummer
Trendthemen
AIStocksWhatNext
254,457 Aufrufe
2,552 Kommentare
Teile & gewinne Traffic-Rewards in unserer angesagten Hashtag-Kampagne
✨Thema: Welche anderen Investitionsmöglichkeiten gibt es noch, während KI-Aktien weiter steigen?
👉So machst du mit:
Veröffentliche einen kurzen Beitrag oder Artikel mit dem Hashtag #AIStocksWhatNext
Teile, ob du bullisch oder bärisch bist, und poste deine KI-Aktienbestände oder Trades – die Nutzung des Trade-Widgets kann deine Berechtigung verbessern.
Du kannst deinen Beitrag auch stärken, indem du Daten oder Diagramme teilst und KI-generierte Bilder vermeidest.
✍️Erstelle Inhalte basierend auf den folgenden Blickwinkeln:
- Nvidia sagt, dass sich der Chip-Umsatz im nächsten Jahr verdoppeln wird, und die führenden KI-Unternehmen erreichen weiterhin Rekordumsätze – der Rechenaufwand dahinter ist ebenso beeindruckend. Verläuft die Nachfrage nach KI wirklich gerade erst so richtig, oder geht es nur noch eine Weile weiter? KI-Aktien steigen derzeit branchenweit. Ist das ein echter Ausbruch oder nur ein kurzfristiger Rückprall?
- Branchenführer fordern dazu auf, die Entwicklung von KI zu verlangsamen, während Trump plant, eine „AI Force“ aufzubauen, und behauptet, KI könne in der Zukunft 25% des US-BIP ausmachen. Auf welcher Seite stehst du? Wird staatliche Unterstützung ein langfristiger Gewinn für KI-Aktien sein?
- Kaufst du KI-Aktien? Teile deinen KI-bezogenen Trade/deine Bestände mit unserem Trade-Sharing-Widget.
⏰Kampagnenzeitraum:
- 2026-09-22 7:00 - 2026-09-24 4:00 UTC
🎁Belohnung:
- Qualifizierte Beiträge, die die oben genannten Richtlinien einhalten und mehr als 100 Wörter enthalten, werden überprüft und können möglicherweise einen zufälligen Traffic-Boost von 500 bis 3.000 Views erhalten. Du erhältst eine Benachrichtigung von deiner Feed-Sekretärin, wenn dein Beitrag ausgewählt wurde.
- Erhalte die Chance, dass dein Artikel auf Binance Square Official vorgestellt wird
Brauchst du Ideen für deinen Beitrag? Besuche die Thema-Seite #AIStocksWhatNext oder die Square Guide on How to Post for Better Reach.
Binance Square Official
·323 Likes
·721.9k Aufrufe
BitcoinBreaksAboveMayHighNears$86K
9,304 Aufrufe
154 Kommentare
DogecoinRises15%
25,082 Aufrufe
809 Kommentare