

Mr boom 1
5 Beiträge

Mr boom 1
Melden
Nutzer blockieren
0 Following
0 Follower
0 Like gegeben
Beiträge
·
--
Übersetzung ansehen
Market is moving! $BTC strong zone mein hai, ETH & BNB bhi momentum dikha rahe hain. 📈
#CerebrasSinksNearly20%OnReportNvidiaToPowerOpenAI #SECProposesCryptoCustodyRules #G7PlansToReleaseUpTo100MBarrelsOilDiesel
Market is moving! $BTC strong zone mein hai, ETH & BNB bhi momentum dikha rahe hain. 📈
#CerebrasSinksNearly20%OnReportNvidiaToPowerOpenAI #SECProposesCryptoCustodyRules #G7PlansToReleaseUpTo100MBarrelsOilDiesel
#CerebrasSinksNearly20%OnReportNvidiaToPowerOpenAI #SECProposesCryptoCustodyRules #G7PlansToReleaseUpTo100MBarrelsOilDiesel

32
·
--
Übersetzung ansehen
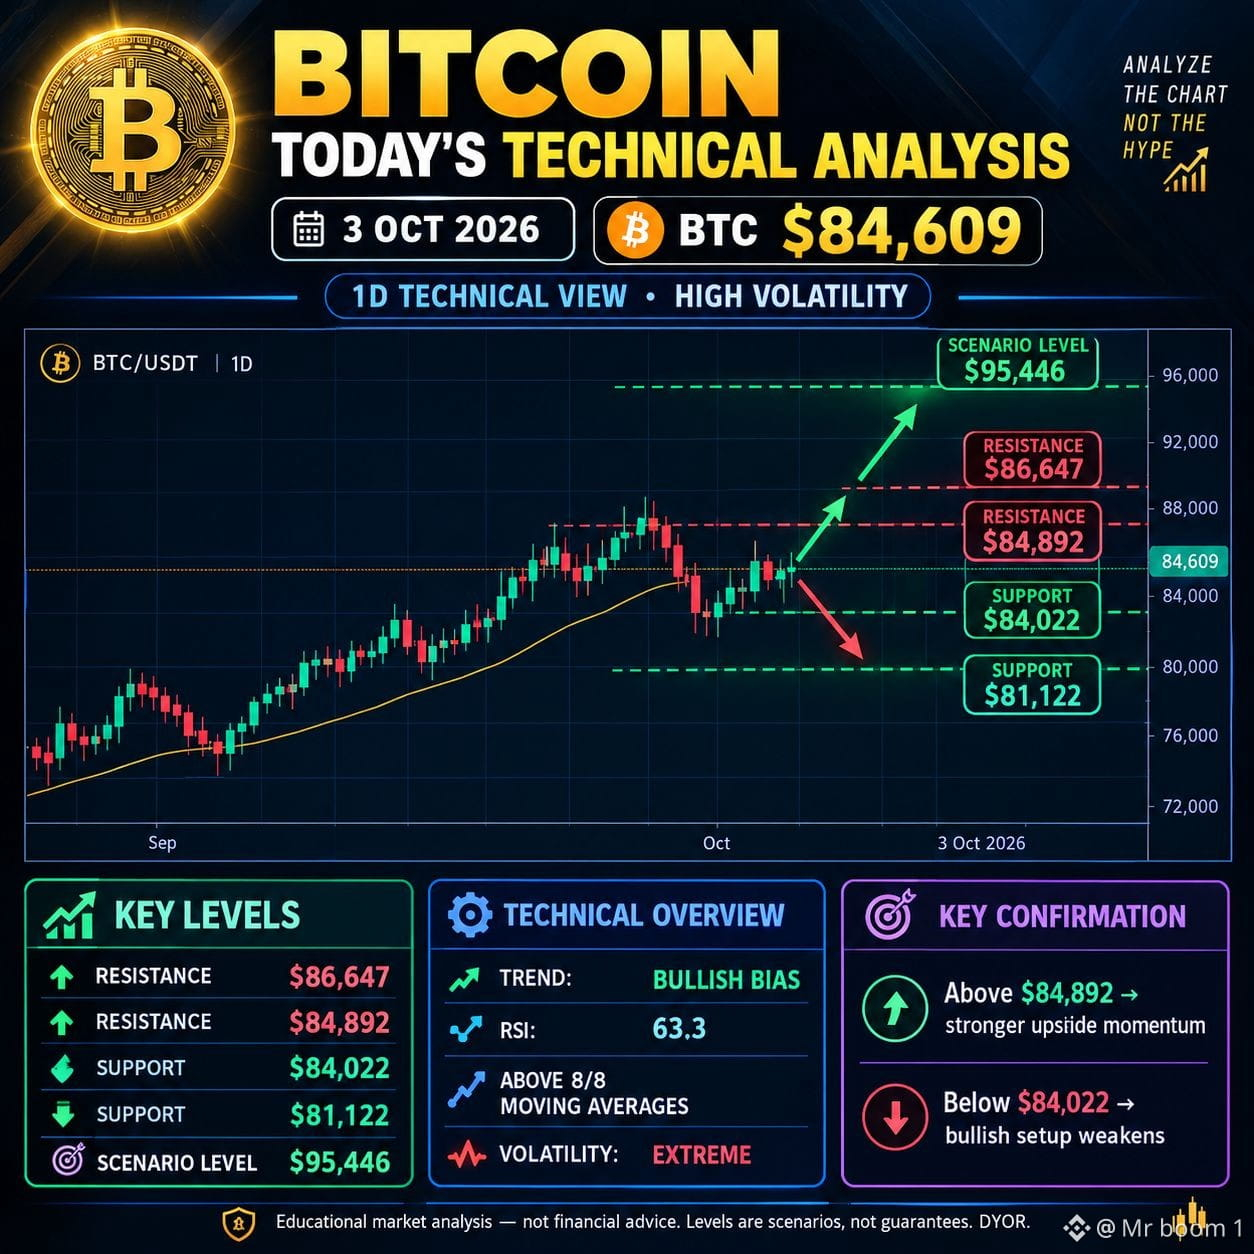
🚨 BITCOIN $BTC — TODAY’S ANALYSIS | 3 OCT 2026
💰 BTC: $84,609
📈 Trend: Bullish Bias
🟢 Resistance: $84,892 → $86,647
🎯 Scenario Level: $95,446
🔴 Support: $84,022 → $81,122
⚡ Above $84,892 → Upside momentum
⚠️ Below $84,022 → Bullish setup weakens
📊 High Volatility — Wait for confirmation.
#BTC #Bitcoin #Crypto #Trading #BTCAnalysis
{future}(BTCUSDT)
🚨 BITCOIN $BTC — TODAY’S ANALYSIS | 3 OCT 2026
💰 BTC: $84,609
📈 Trend: Bullish Bias
🟢 Resistance: $84,892 → $86,647
🎯 Scenario Level: $95,446
🔴 Support: $84,022 → $81,122
⚡ Above $84,892 → Upside momentum
⚠️ Below $84,022 → Bullish setup weakens
📊 High Volatility — Wait for confirmation.
#BTC #Bitcoin #Crypto #Trading #BTCAnalysis
💰 BTC: $84,609
📈 Trend: Bullish Bias
🟢 Resistance: $84,892 → $86,647
🎯 Scenario Level: $95,446
🔴 Support: $84,022 → $81,122
⚡ Above $84,892 → Upside momentum
⚠️ Below $84,022 → Bullish setup weakens
📊 High Volatility — Wait for confirmation.
#BTC #Bitcoin #Crypto #Trading #BTCAnalysis
43
·
--
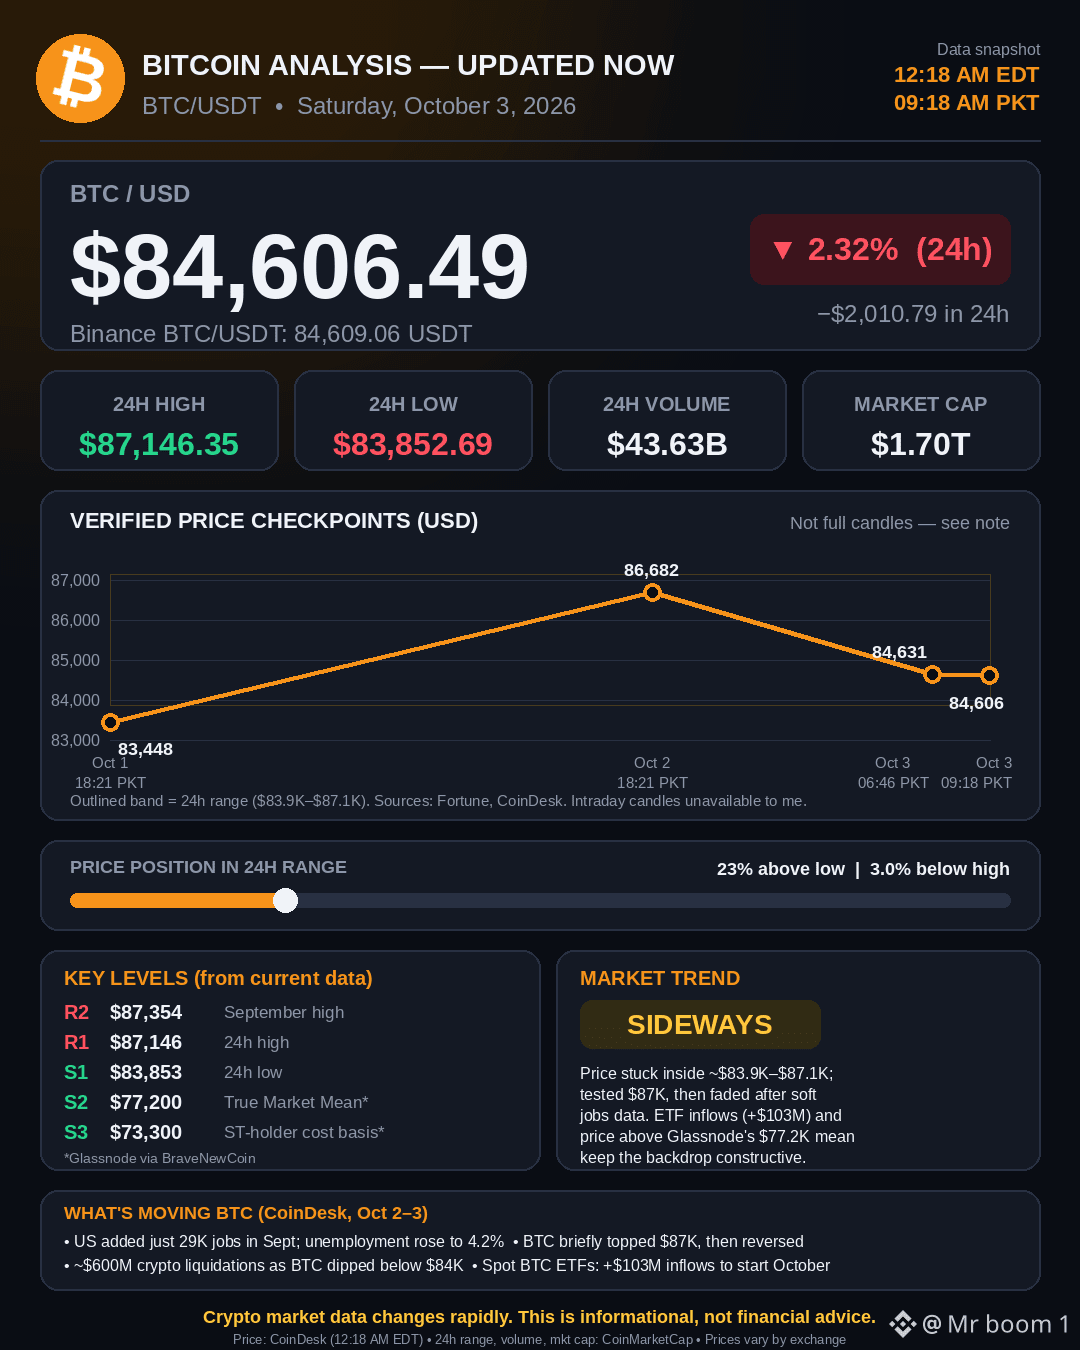
₿ BITCOIN-ANALYSE — JETZT AKTUALISIERT
$BTC /USDT | Samstag, 3. Oktober 2026
Daten-Stand: 12:18 AM EDT / 09:18 AM PKT
💰 Preis: 84.606,49 $ (Binance BTC/USDT: 84.609,06)
📉 24h Veränderung: -2,32% (-2.010,79 $)
🔼 24h Hoch: 87.146,35 $
🔽 24h Tief: 83.852,69 $
📊 24h Volumen: 43,63 Mrd. $
🏦 Marktkapitalisierung: 1,70 Bio. $
WICHTIGE NIVEAUS
Widerstand: 87.354 $ (September-Hoch), 87.146 $ (24h-Hoch)
Unterstützung: 83.853 $ (24h-Tief), 77.200 $ (True Market Mean*), 73.300 $ (Kostenbasis kurzfristiger Inhaber*)
*Glassnode-Daten
TREND: SEITWÄRTS
BTC handelt in einer Spanne von ca. 83,9K–87,1K. Es testete 87K, dann schwächte es sich nach den schwachen US-Jobdaten ab. Der Preis liegt etwa 23% über dem 24h-Tief und 3,0% unter dem 24h-Hoch. ETF-Zuflüsse (+103 Mio. $) und dass der Kurs über dem Mean von Glassnode (77,2K) bleibt, sorgen für ein grundsätzlich positives Umfeld.
WAS SICH BEWEGT BEI BTC
• Die USA haben im September nur 29K Jobs hinzugefügt; die Arbeitslosenquote stieg auf 4,2%
• BTC lag kurz über 87K, dann kam die Umkehr
• Rund 600 Mio. $ an Krypto-Liquidationen, als BTC unter 84K fiel
• Spot-BTC-ETFs: +103 Mio. $ Zuflüsse zum Start des Oktobers
⚠️ Die Marktdaten im Krypto-Sektor ändern sich schnell. Dies ist nur zu Informationszwecken und keine Finanzberatung.
Quellen: CoinDesk (Preis), CoinMarketCap (24h-Spanne, Volumen, Marktkapitalisierung), Glassnode, Fortune. Preise können je nach Börse abweichen.
#Bitcoin #BTC #Crypto #BTCUSDT #CryptoNews
₿ BITCOIN-ANALYSE — JETZT AKTUALISIERT
$BTC /USDT | Samstag, 3. Oktober 2026
Daten-Stand: 12:18 AM EDT / 09:18 AM PKT
💰 Preis: 84.606,49 $ (Binance BTC/USDT: 84.609,06)
📉 24h Veränderung: -2,32% (-2.010,79 $)
🔼 24h Hoch: 87.146,35 $
🔽 24h Tief: 83.852,69 $
📊 24h Volumen: 43,63 Mrd. $
🏦 Marktkapitalisierung: 1,70 Bio. $
WICHTIGE NIVEAUS
Widerstand: 87.354 $ (September-Hoch), 87.146 $ (24h-Hoch)
Unterstützung: 83.853 $ (24h-Tief), 77.200 $ (True Market Mean*), 73.300 $ (Kostenbasis kurzfristiger Inhaber*)
*Glassnode-Daten
TREND: SEITWÄRTS
BTC handelt in einer Spanne von ca. 83,9K–87,1K. Es testete 87K, dann schwächte es sich nach den schwachen US-Jobdaten ab. Der Preis liegt etwa 23% über dem 24h-Tief und 3,0% unter dem 24h-Hoch. ETF-Zuflüsse (+103 Mio. $) und dass der Kurs über dem Mean von Glassnode (77,2K) bleibt, sorgen für ein grundsätzlich positives Umfeld.
WAS SICH BEWEGT BEI BTC
• Die USA haben im September nur 29K Jobs hinzugefügt; die Arbeitslosenquote stieg auf 4,2%
• BTC lag kurz über 87K, dann kam die Umkehr
• Rund 600 Mio. $ an Krypto-Liquidationen, als BTC unter 84K fiel
• Spot-BTC-ETFs: +103 Mio. $ Zuflüsse zum Start des Oktobers
⚠️ Die Marktdaten im Krypto-Sektor ändern sich schnell. Dies ist nur zu Informationszwecken und keine Finanzberatung.
Quellen: CoinDesk (Preis), CoinMarketCap (24h-Spanne, Volumen, Marktkapitalisierung), Glassnode, Fortune. Preise können je nach Börse abweichen.
#Bitcoin #BTC #Crypto #BTCUSDT #CryptoNews
$BTC /USDT | Samstag, 3. Oktober 2026
Daten-Stand: 12:18 AM EDT / 09:18 AM PKT
💰 Preis: 84.606,49 $ (Binance BTC/USDT: 84.609,06)
📉 24h Veränderung: -2,32% (-2.010,79 $)
🔼 24h Hoch: 87.146,35 $
🔽 24h Tief: 83.852,69 $
📊 24h Volumen: 43,63 Mrd. $
🏦 Marktkapitalisierung: 1,70 Bio. $
WICHTIGE NIVEAUS
Widerstand: 87.354 $ (September-Hoch), 87.146 $ (24h-Hoch)
Unterstützung: 83.853 $ (24h-Tief), 77.200 $ (True Market Mean*), 73.300 $ (Kostenbasis kurzfristiger Inhaber*)
*Glassnode-Daten
TREND: SEITWÄRTS
BTC handelt in einer Spanne von ca. 83,9K–87,1K. Es testete 87K, dann schwächte es sich nach den schwachen US-Jobdaten ab. Der Preis liegt etwa 23% über dem 24h-Tief und 3,0% unter dem 24h-Hoch. ETF-Zuflüsse (+103 Mio. $) und dass der Kurs über dem Mean von Glassnode (77,2K) bleibt, sorgen für ein grundsätzlich positives Umfeld.
WAS SICH BEWEGT BEI BTC
• Die USA haben im September nur 29K Jobs hinzugefügt; die Arbeitslosenquote stieg auf 4,2%
• BTC lag kurz über 87K, dann kam die Umkehr
• Rund 600 Mio. $ an Krypto-Liquidationen, als BTC unter 84K fiel
• Spot-BTC-ETFs: +103 Mio. $ Zuflüsse zum Start des Oktobers
⚠️ Die Marktdaten im Krypto-Sektor ändern sich schnell. Dies ist nur zu Informationszwecken und keine Finanzberatung.
Quellen: CoinDesk (Preis), CoinMarketCap (24h-Spanne, Volumen, Marktkapitalisierung), Glassnode, Fortune. Preise können je nach Börse abweichen.
#Bitcoin #BTC #Crypto #BTCUSDT #CryptoNews
96
·
--
Übersetzung ansehen
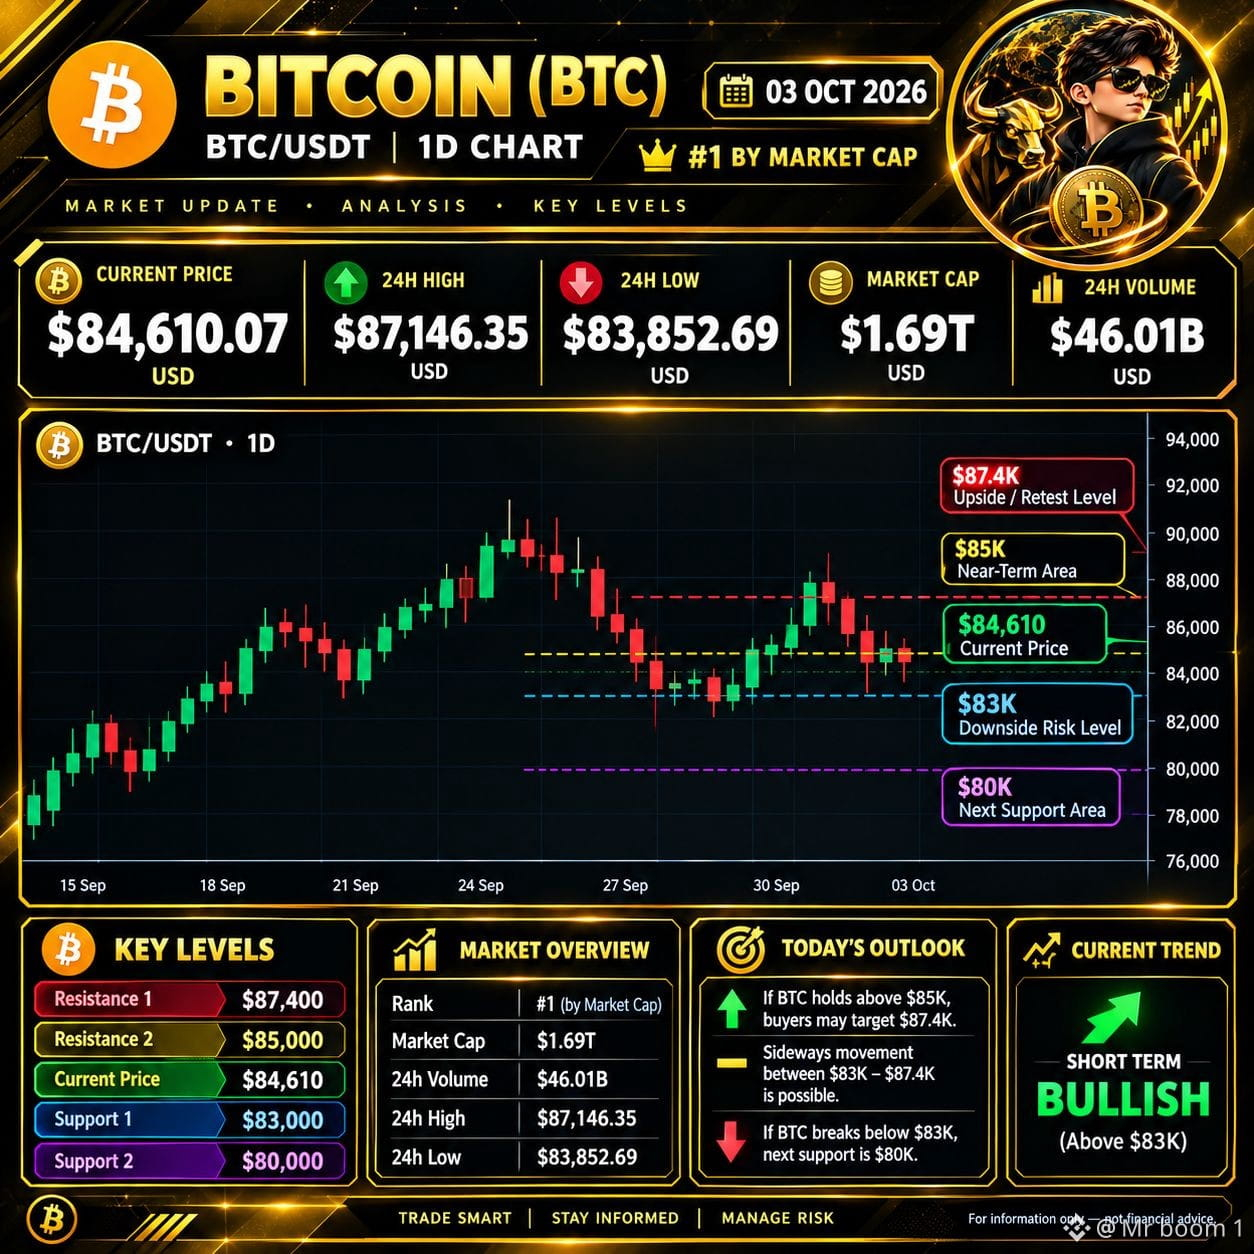
🚨 BITCOIN $BTC — TODAY’S MARKET UPDATE | 03 OCT 2026
₿ BTC is currently trading around the $84K area after recently moving above $86K. The latest price action shows a recovery followed by a pullback, so the market is currently watching the key support and resistance zones closely. �
FXDailyReport.Com +1
📊 KEY LEVELS TO WATCH
🔴 Resistance: $86K–$87.4K
🟡 Near-Term Zone: $85K
🟢 Current Area: ~$84K
🔵 Support: $83K–$84K
🟣 Major Support: ~$82K
📈 BULLISH SCENARIO
If BTC reclaims the $85K area and then breaks and holds above $87K–$87.4K, the next major psychological area to watch would be around $90K. �
FXDailyReport.Com
🟡 SIDEWAYS SCENARIO
If BTC remains between approximately $83K and $87K, consolidation and range-bound movement may continue until a clearer breakout or breakdown occurs.
🔴 BEARISH SCENARIO
If BTC loses the $83K–$82K support area and remains below it, downside risk could increase, with $80K becoming another important area to watch.
🧠 MARKET VIEW
BTC is currently in a recovery/consolidation phase, rather than showing a confirmed one-direction move. For me, the most important thing to watch is price confirmation around the key levels, not simply chasing a short-term move.
Upside: $85K → $87K/$87.4K → $90K
Downside: $83K/$82K → $80K
⚠️ This is for educational and informational purposes only, not financial advice. Crypto markets are highly volatile. Always DYOR and manage your risk before trading.
#Bitcoin #BTC #BTCUSDT #BinanceSquare #Crypto #BitcoinAnalysis #BTCUpdate #CryptoAnalysis #NFPWatch #
{future}(BTCUSDT)
🚨 BITCOIN $BTC — TODAY’S MARKET UPDATE | 03 OCT 2026
₿ BTC is currently trading around the $84K area after recently moving above $86K. The latest price action shows a recovery followed by a pullback, so the market is currently watching the key support and resistance zones closely. �
FXDailyReport.Com +1
📊 KEY LEVELS TO WATCH
🔴 Resistance: $86K–$87.4K
🟡 Near-Term Zone: $85K
🟢 Current Area: ~$84K
🔵 Support: $83K–$84K
🟣 Major Support: ~$82K
📈 BULLISH SCENARIO
If BTC reclaims the $85K area and then breaks and holds above $87K–$87.4K, the next major psychological area to watch would be around $90K. �
FXDailyReport.Com
🟡 SIDEWAYS SCENARIO
If BTC remains between approximately $83K and $87K, consolidation and range-bound movement may continue until a clearer breakout or breakdown occurs.
🔴 BEARISH SCENARIO
If BTC loses the $83K–$82K support area and remains below it, downside risk could increase, with $80K becoming another important area to watch.
🧠 MARKET VIEW
BTC is currently in a recovery/consolidation phase, rather than showing a confirmed one-direction move. For me, the most important thing to watch is price confirmation around the key levels, not simply chasing a short-term move.
Upside: $85K → $87K/$87.4K → $90K
Downside: $83K/$82K → $80K
⚠️ This is for educational and informational purposes only, not financial advice. Crypto markets are highly volatile. Always DYOR and manage your risk before trading.
#Bitcoin #BTC #BTCUSDT #BinanceSquare #Crypto #BitcoinAnalysis #BTCUpdate #CryptoAnalysis #NFPWatch #
₿ BTC is currently trading around the $84K area after recently moving above $86K. The latest price action shows a recovery followed by a pullback, so the market is currently watching the key support and resistance zones closely. �
FXDailyReport.Com +1
📊 KEY LEVELS TO WATCH
🔴 Resistance: $86K–$87.4K
🟡 Near-Term Zone: $85K
🟢 Current Area: ~$84K
🔵 Support: $83K–$84K
🟣 Major Support: ~$82K
📈 BULLISH SCENARIO
If BTC reclaims the $85K area and then breaks and holds above $87K–$87.4K, the next major psychological area to watch would be around $90K. �
FXDailyReport.Com
🟡 SIDEWAYS SCENARIO
If BTC remains between approximately $83K and $87K, consolidation and range-bound movement may continue until a clearer breakout or breakdown occurs.
🔴 BEARISH SCENARIO
If BTC loses the $83K–$82K support area and remains below it, downside risk could increase, with $80K becoming another important area to watch.
🧠 MARKET VIEW
BTC is currently in a recovery/consolidation phase, rather than showing a confirmed one-direction move. For me, the most important thing to watch is price confirmation around the key levels, not simply chasing a short-term move.
Upside: $85K → $87K/$87.4K → $90K
Downside: $83K/$82K → $80K
⚠️ This is for educational and informational purposes only, not financial advice. Crypto markets are highly volatile. Always DYOR and manage your risk before trading.
#Bitcoin #BTC #BTCUSDT #BinanceSquare #Crypto #BitcoinAnalysis #BTCUpdate #CryptoAnalysis #NFPWatch #
91
·
--
Übersetzung ansehen
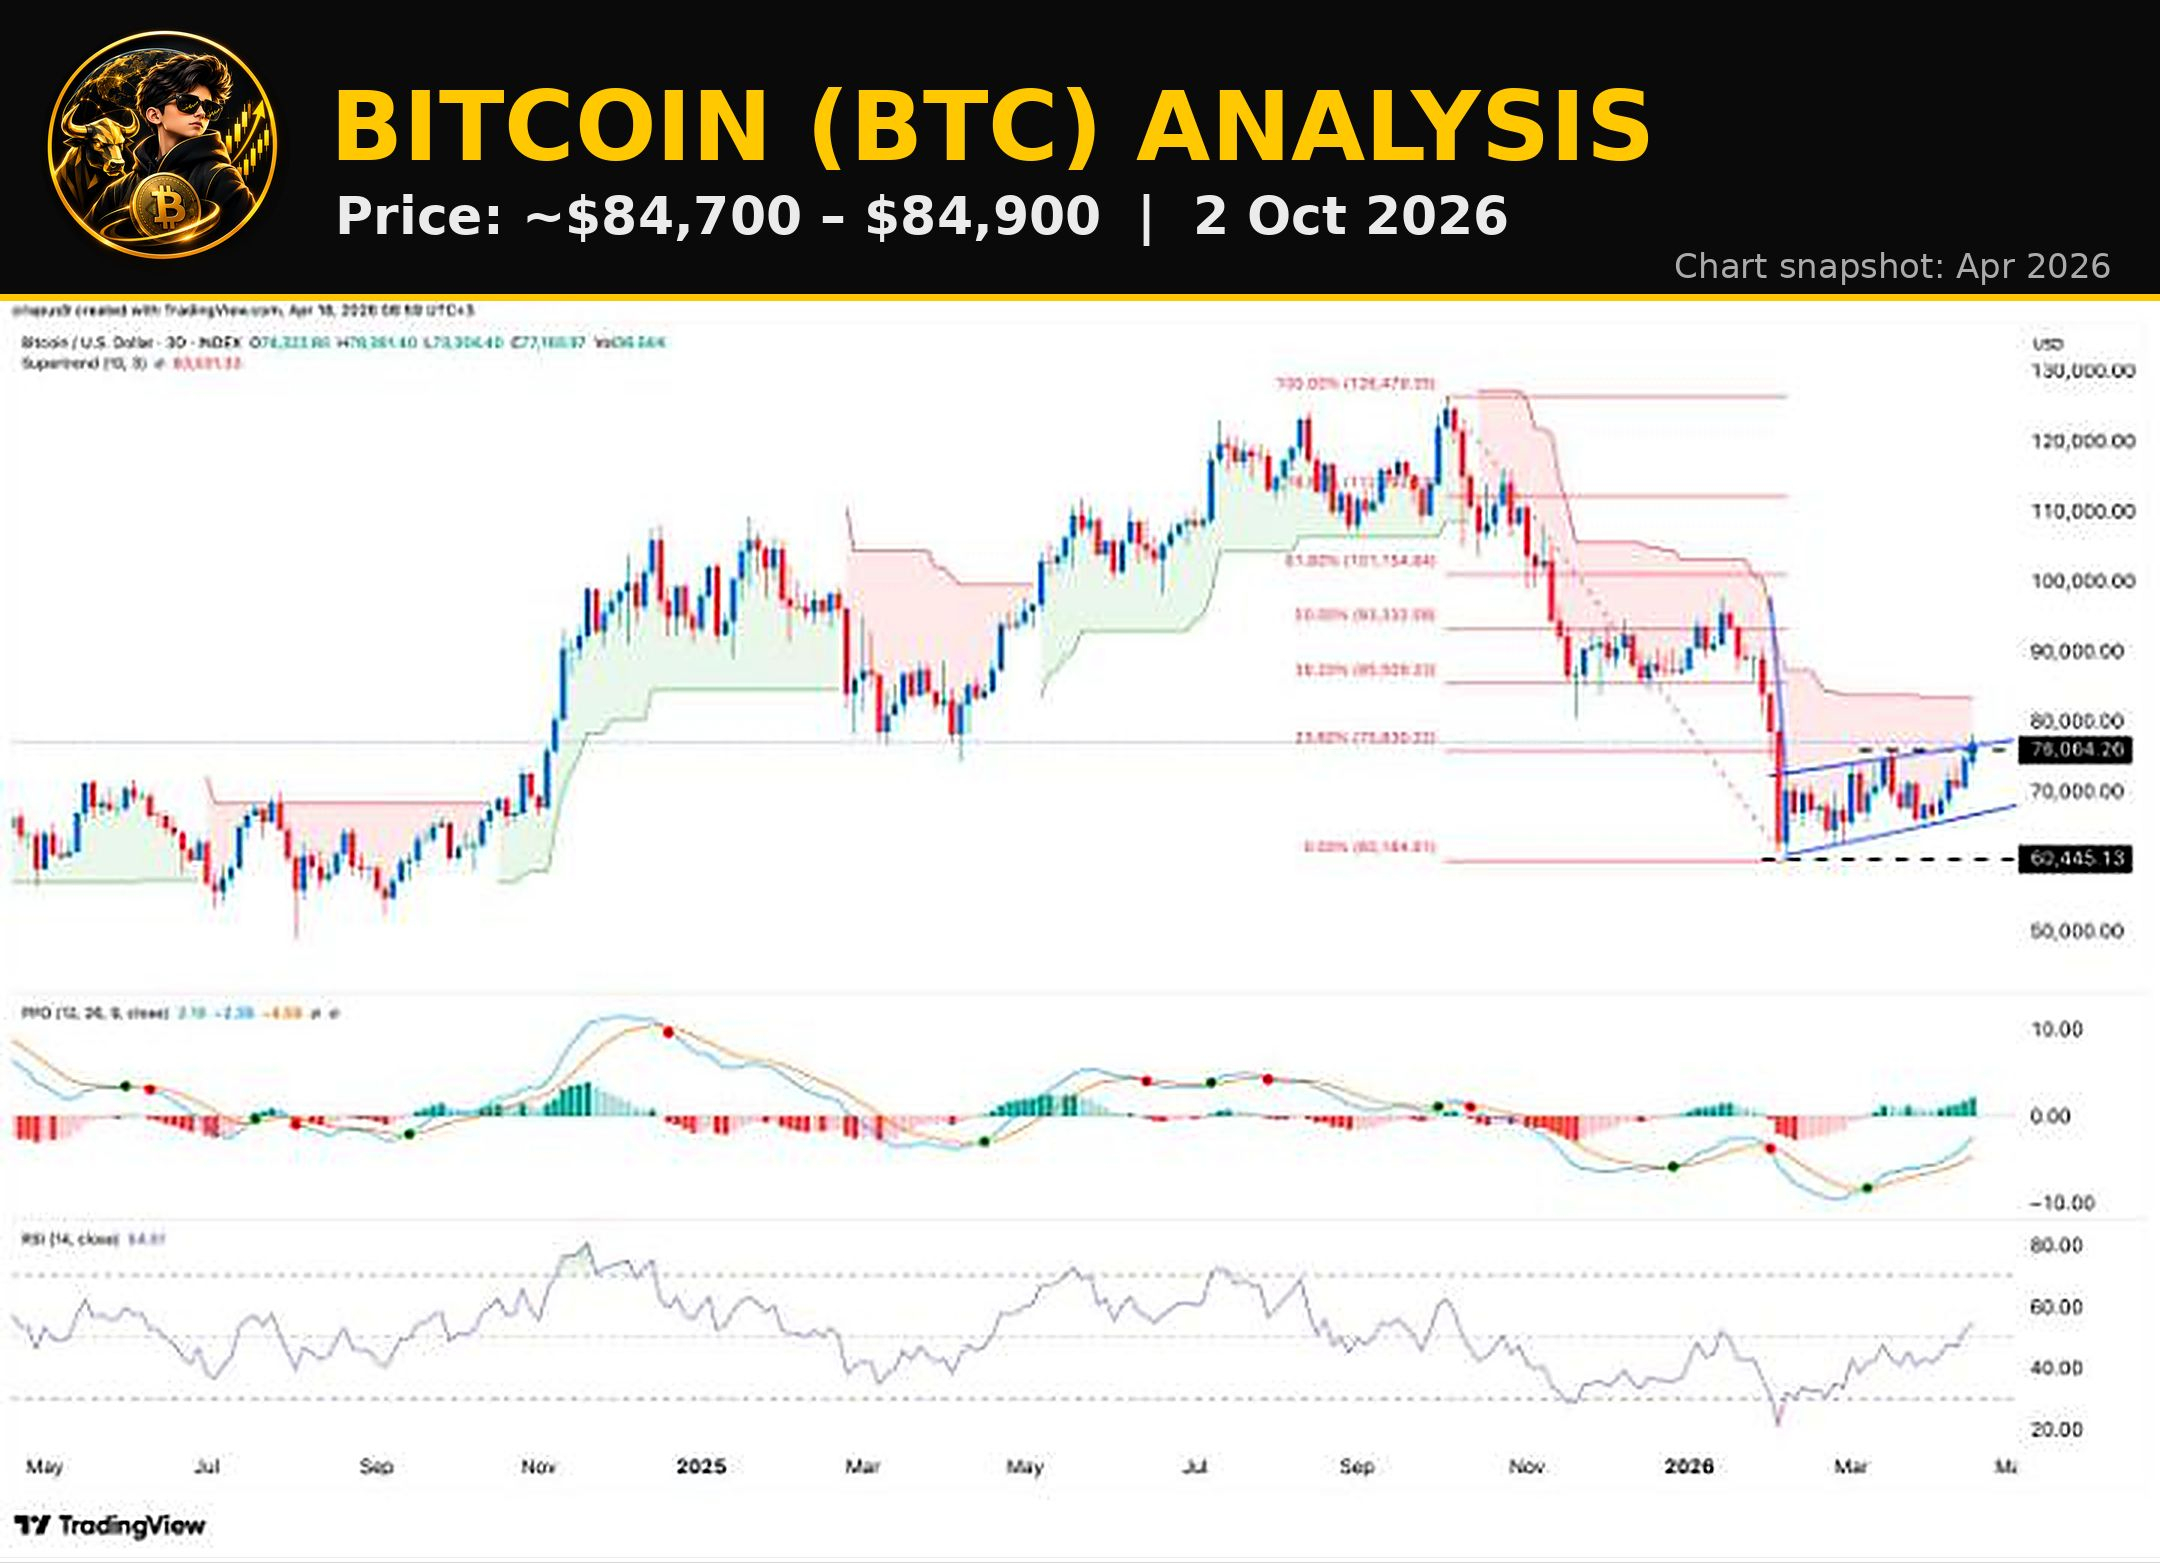
🟠 Bitcoin $BTC — Latest Analysis
🗓️ 2 October 2026
₿ Bitcoin is currently the #1 cryptocurrency by market capitalization.
BTC is trading around $84,700–$84,900, with the recent 24-hour range around $83,100–$85,200.
📊 Key Levels to Watch
🔴 Resistance: $86,000–$87,400
🟢 Support: $82,000–$82,900
🟢 Major Support: Around $80,000
A sustained move above $87,400 would bring the recent high zone back into focus.
A daily close below $82,000 would weaken the short-term structure and could bring the $80,000 area into focus.
📰 What Is Moving BTC Today?
Bitcoin has entered October after a strong Q3 rebound. U.S. Treasury yields, Federal Reserve rate expectations and ETF flows remain important factors for the market.
U.S. spot Bitcoin ETFs recorded a $148.7M net outflow on September 30, ending a nine-session inflow streak that had brought in more than $3B.
At the same time, Citigroup raised its 12-month Bitcoin forecast to $113,000, citing stronger crypto activity, supportive macro conditions and renewed ETF inflows. This is Citi's forecast, not a guaranteed price target.
📌 Bottom Line
BTC is currently testing the upper part of its recent range.
For the short term:
🟢 $82K–$83K = Important Support Zone
🔴 $86K–$87.4K = Key Resistance Zone
⚠️ This is market analysis for educational purposes, not financial advice or a guaranteed prediction.
#Bitcoin #BTC #Crypto #Cryptocurrency #BitcoinNews #BitcoinAnalysis #BTCUSD #CryptoNews #CryptoMarket #BitcoinPrice #Blockchain #DigitalAssets
{future}(BTCUSDT)
🟠 Bitcoin $BTC — Latest Analysis
🗓️ 2 October 2026
₿ Bitcoin is currently the #1 cryptocurrency by market capitalization.
BTC is trading around $84,700–$84,900, with the recent 24-hour range around $83,100–$85,200.
📊 Key Levels to Watch
🔴 Resistance: $86,000–$87,400
🟢 Support: $82,000–$82,900
🟢 Major Support: Around $80,000
A sustained move above $87,400 would bring the recent high zone back into focus.
A daily close below $82,000 would weaken the short-term structure and could bring the $80,000 area into focus.
📰 What Is Moving BTC Today?
Bitcoin has entered October after a strong Q3 rebound. U.S. Treasury yields, Federal Reserve rate expectations and ETF flows remain important factors for the market.
U.S. spot Bitcoin ETFs recorded a $148.7M net outflow on September 30, ending a nine-session inflow streak that had brought in more than $3B.
At the same time, Citigroup raised its 12-month Bitcoin forecast to $113,000, citing stronger crypto activity, supportive macro conditions and renewed ETF inflows. This is Citi's forecast, not a guaranteed price target.
📌 Bottom Line
BTC is currently testing the upper part of its recent range.
For the short term:
🟢 $82K–$83K = Important Support Zone
🔴 $86K–$87.4K = Key Resistance Zone
⚠️ This is market analysis for educational purposes, not financial advice or a guaranteed prediction.
#Bitcoin #BTC #Crypto #Cryptocurrency #BitcoinNews #BitcoinAnalysis #BTCUSD #CryptoNews #CryptoMarket #BitcoinPrice #Blockchain #DigitalAssets
🗓️ 2 October 2026
₿ Bitcoin is currently the #1 cryptocurrency by market capitalization.
BTC is trading around $84,700–$84,900, with the recent 24-hour range around $83,100–$85,200.
📊 Key Levels to Watch
🔴 Resistance: $86,000–$87,400
🟢 Support: $82,000–$82,900
🟢 Major Support: Around $80,000
A sustained move above $87,400 would bring the recent high zone back into focus.
A daily close below $82,000 would weaken the short-term structure and could bring the $80,000 area into focus.
📰 What Is Moving BTC Today?
Bitcoin has entered October after a strong Q3 rebound. U.S. Treasury yields, Federal Reserve rate expectations and ETF flows remain important factors for the market.
U.S. spot Bitcoin ETFs recorded a $148.7M net outflow on September 30, ending a nine-session inflow streak that had brought in more than $3B.
At the same time, Citigroup raised its 12-month Bitcoin forecast to $113,000, citing stronger crypto activity, supportive macro conditions and renewed ETF inflows. This is Citi's forecast, not a guaranteed price target.
📌 Bottom Line
BTC is currently testing the upper part of its recent range.
For the short term:
🟢 $82K–$83K = Important Support Zone
🔴 $86K–$87.4K = Key Resistance Zone
⚠️ This is market analysis for educational purposes, not financial advice or a guaranteed prediction.
#Bitcoin #BTC #Crypto #Cryptocurrency #BitcoinNews #BitcoinAnalysis #BTCUSD #CryptoNews #CryptoMarket #BitcoinPrice #Blockchain #DigitalAssets
83
Anmelden und weiter Inhalte entdecken
Krypto-Nutzer weltweit auf Binance Square kennenlernen
⚡️ Bleib in Sachen Krypto stets am Puls.
💬 Die weltgrößte Kryptobörse vertraut darauf.
👍 Erhalte verlässliche Einblicke von verifizierten Creators.
E-Mail-Adresse/Telefonnummer
Trendthemen
BitcoinRejectedAt$87K
30,168 Aufrufe
71 Kommentare
$BTC Update 🚨 🐼 Überspringt diese Warnung auf eigene Gefahr ⚠️
BTC klopft gerade an die 87K, als würde es den Platz schon besitzen 😂 Die Bullen sind wach… aber BTC macht normalerweise erst mal ein paar Leute raus, bevor die echte Bewegung kommt.
Insgesamt bricht BTC aus, und das Bild auf höheren Zeitrahmen bleibt weiterhin bullish. Die Struktur im 4H- und Daily-Chart ist stark, der Kurs hält sich über den wichtigen Durchschnitten, und der Momentum unterstützt die Bewegung weiterhin.
83K war ehrlich gesagt eine wunderschöne Kaufzone. Genau dort ergab das Chance/Risiko-Verhältnis Sinn. Wer dort gekauft hat, sitzt jetzt schon entspannt im Profit
Jetzt zum Hauptteil
BTC liegt direkt unter dem vorherigen Hoch bei ca. 87K. Daher würde ich nicht überrascht sein, wenn wir zuerst einen kleinen Downside-Liquiditäts-Grab sehen: einige späte Longs ausspülen, und dann entscheidet BTC, ob es wirklich den echten Ausbruch will.
Für den heutigen Scalpsetup ist das mein Plan 👇
BTC SHORT Scalp Einstieg: 86.550–86.900
TP1: 85.650
TP2: 84.850
TP3: 84.050
SL: 87.800
Ich mag das nur, wenn es wirklich nahe an den Hochs eine saubere Ablehnung gibt. Kein blindes Shorten.
Für das größere Bild: Ich bin weiterhin bullish, solange der Bereich 82,5K–83K hält. Wenn BTC einen sauberen Ausbruch hinbekommt und anfängt, über 87,4K zu akzeptieren, dann ist diese ganze Short-Idee hinfällig und der nächste bullische Schub wird viel interessanter.
ALSO EIGENTLICH IST OKTOBER DER HISTORISCH BULLISCHE MONAT FÜR BITCOIN.
MACH IMMER DEINE EIGENE RECHERCHE (DYOR)
Panda Traders
·31 Likes
·13k Aufrufe
FedOctoberRateHikeOddsFallTo17%
21,063 Aufrufe
349 Kommentare
NvidiaHitsRecordHighUp2.4%
5,714 Aufrufe
222 Kommentare