

Vicky Gobel eccs
55 Beiträge

Vicky Gobel eccs
Melden
Nutzer blockieren
new trader for binance 🥰
Trade eröffnen
Hochfrequenz-Trader
4.2 Monate
5 Following
3 Follower
3 Like gegeben
Beiträge
Portfolio
Artikel
Übersetzung ansehen
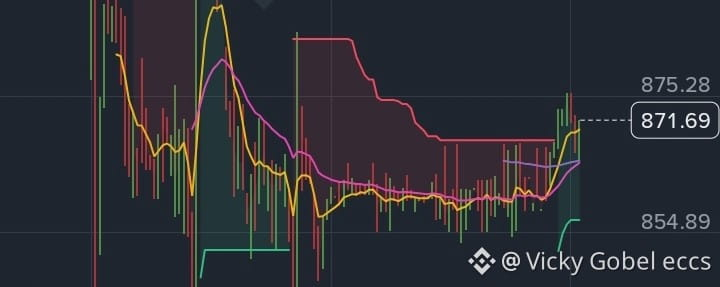
$GEVB/USDT👇### $GEVB /USDT — Binance Square Technical Analysis
{spot}(GEVBUSDT)
Short-term bullish momentum
### 871.69 USDT
Price shown in your screenshot · November 2, 2026
### 1\. Technical analysis (1H)
Your chart shows a bullish recovery after a long sideways consolidation.
* EMA 7: 870.30
* EMA 25: 865.33
* EMA 99: 865.63
* Supertrend: 856.77
Bullish EMA alignment
Price is above all three EMAs and Supertrend, suggesting buyers currently have control.
### 2\. Key price levels
| Zone | Price (USDT) |
| -------------------- | ------------ |
| Major resistance | 885–895 |
| Immediate resistance | 875.82 |
| Current price | 871.69 |
| First support | 870–865 |
| Strong support | 856.77 |
| Major support | 854.30 |
### 3\. Fundamental market outlook
Strong company fundamentals
GE Vernova reported strong Q3 2026 results:
* Revenue: $12.6 billion, up 27%.
* Orders: $29 billion.
* Backlog: $197 billion.
* Raised 2026 revenue guidance.
* Increased share repurchase authorization to $20 billion.
It also announced a $9 billion Trench Group acquisition to expand its electricity-grid business. SEC +1
Analyst sentiment is broadly positive, although individual price targets vary considerably. StockAnalysis.com +1
### 4\. My prediction
Next 24–48 hours
### 875–885
Bullish scenario if price holds above 865.
Breakout target
### 895
Requires a convincing break above 875.82.
Bearish target
### 856–854
If 865 support breaks.
My view: Bullish, but wait for confirmation above 875.82 before chasing the breakout.
### 5\. Binance Square post
🚀 **GEVB/USDT Technical Analysis | Bullish Breakout Setup**
💰 Current Price: 871.69 USDT
📊 **1H Technical Indicators**
- EMA 7: 870.30
- EMA 25: 865.33
- EMA 99: 865.63
- Supertrend: 856.77
🟢 **Bullish Targets**
- 875.82
- 885
- 895
🔴 **Important Support**
- 865
- 856.77
- 854.30
🔥 **My Prediction:** GEVB is showing bullish momentum. If buyers maintain control above 865 and break 875.82, the next possible targets are 885–895.
⚠️ A breakdown below 865 could trigger a pullback toward 856–854.
**Strategy:** Wait for breakout conf
irmation. Manage risk carefully.
#GEVB #GEV #Binance #CryptoTrading #TechnicalAnalysis #TradingSignals💎 #BinanceProcesses$4.65BWithdrawals #BitcoinClosesAbove50WeekMAFor7thStraightWeek $GEVB
$GEVB/USDT👇
### $GEVB /USDT — Binance Square Technical Analysis
Short-term bullish momentum
### 871.69 USDT
Price shown in your screenshot · November 2, 2026
### 1\. Technical analysis (1H)
Your chart shows a bullish recovery after a long sideways consolidation.
* EMA 7: 870.30
* EMA 25: 865.33
* EMA 99: 865.63
* Supertrend: 856.77
Bullish EMA alignment
Price is above all three EMAs and Supertrend, suggesting buyers currently have control.
### 2\. Key price levels
| Zone | Price (USDT) |
| -------------------- | ------------ |
| Major resistance | 885–895 |
| Immediate resistance | 875.82 |
| Current price | 871.69 |
| First support | 870–865 |
| Strong support | 856.77 |
| Major support | 854.30 |
### 3\. Fundamental market outlook
Strong company fundamentals
GE Vernova reported strong Q3 2026 results:
* Revenue: $12.6 billion, up 27%.
* Orders: $29 billion.
* Backlog: $197 billion.
* Raised 2026 revenue guidance.
* Increased share repurchase authorization to $20 billion.
It also announced a $9 billion Trench Group acquisition to expand its electricity-grid business. SEC +1
Analyst sentiment is broadly positive, although individual price targets vary considerably. StockAnalysis.com +1
### 4\. My prediction
Next 24–48 hours
### 875–885
Bullish scenario if price holds above 865.
Breakout target
### 895
Requires a convincing break above 875.82.
Bearish target
### 856–854
If 865 support breaks.
My view: Bullish, but wait for confirmation above 875.82 before chasing the breakout.
### 5\. Binance Square post
🚀 **GEVB/USDT Technical Analysis | Bullish Breakout Setup**
💰 Current Price: 871.69 USDT
📊 **1H Technical Indicators**
- EMA 7: 870.30
- EMA 25: 865.33
- EMA 99: 865.63
- Supertrend: 856.77
🟢 **Bullish Targets**
- 875.82
- 885
- 895
🔴 **Important Support**
- 865
- 856.77
- 854.30
🔥 **My Prediction:** GEVB is showing bullish momentum. If buyers maintain control above 865 and break 875.82, the next possible targets are 885–895.
⚠️ A breakdown below 865 could trigger a pullback toward 856–854.
**Strategy:** Wait for breakout conf
irmation. Manage risk carefully.
#GEVB #GEV #Binance #CryptoTrading #TechnicalAnalysis #TradingSignals💎 #BinanceProcesses$4.65BWithdrawals #BitcoinClosesAbove50WeekMAFor7thStraightWeek $GEVB
Short-term bullish momentum
### 871.69 USDT
Price shown in your screenshot · November 2, 2026
### 1\. Technical analysis (1H)
Your chart shows a bullish recovery after a long sideways consolidation.
* EMA 7: 870.30
* EMA 25: 865.33
* EMA 99: 865.63
* Supertrend: 856.77
Bullish EMA alignment
Price is above all three EMAs and Supertrend, suggesting buyers currently have control.
### 2\. Key price levels
| Zone | Price (USDT) |
| -------------------- | ------------ |
| Major resistance | 885–895 |
| Immediate resistance | 875.82 |
| Current price | 871.69 |
| First support | 870–865 |
| Strong support | 856.77 |
| Major support | 854.30 |
### 3\. Fundamental market outlook
Strong company fundamentals
GE Vernova reported strong Q3 2026 results:
* Revenue: $12.6 billion, up 27%.
* Orders: $29 billion.
* Backlog: $197 billion.
* Raised 2026 revenue guidance.
* Increased share repurchase authorization to $20 billion.
It also announced a $9 billion Trench Group acquisition to expand its electricity-grid business. SEC +1
Analyst sentiment is broadly positive, although individual price targets vary considerably. StockAnalysis.com +1
### 4\. My prediction
Next 24–48 hours
### 875–885
Bullish scenario if price holds above 865.
Breakout target
### 895
Requires a convincing break above 875.82.
Bearish target
### 856–854
If 865 support breaks.
My view: Bullish, but wait for confirmation above 875.82 before chasing the breakout.
### 5\. Binance Square post
🚀 **GEVB/USDT Technical Analysis | Bullish Breakout Setup**
💰 Current Price: 871.69 USDT
📊 **1H Technical Indicators**
- EMA 7: 870.30
- EMA 25: 865.33
- EMA 99: 865.63
- Supertrend: 856.77
🟢 **Bullish Targets**
- 875.82
- 885
- 895
🔴 **Important Support**
- 865
- 856.77
- 854.30
🔥 **My Prediction:** GEVB is showing bullish momentum. If buyers maintain control above 865 and break 875.82, the next possible targets are 885–895.
⚠️ A breakdown below 865 could trigger a pullback toward 856–854.
**Strategy:** Wait for breakout conf
irmation. Manage risk carefully.
#GEVB #GEV #Binance #CryptoTrading #TechnicalAnalysis #TradingSignals💎 #BinanceProcesses$4.65BWithdrawals #BitcoinClosesAbove50WeekMAFor7thStraightWeek $GEVB
10
Artikel
Übersetzung ansehen
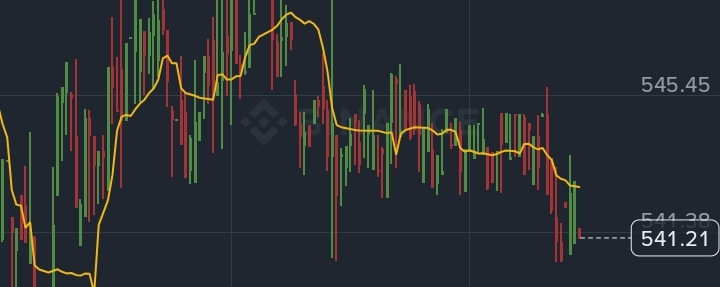
BRKBB/USDT 👇### $BRKBB /USDT — Strong Price Prediction
{spot}(BRKBBUSDT)
My analysis combines your Binance 1-hour chart, BRKBB market data, Berkshire Hathaway fundamentals, analyst outlook and global geopolitical risks.
### 541.21 USDT
Your screenshot price · November 2, 2026
### 1\. Technical analysis — 1H chart

Here is what your chart is showing:
* Price is below VWAP (542.73): short-term sellers have an advantage.
* Recent movement shows lower highs.
* Price has fallen from approximately 552.66 to 541.21.
* A small recovery is visible near the recent low, but reversal is not confirmed.
Important levels
| Level | Price (USDT) |
| ----------------- | ------------ |
| Strong resistance | 545.45 |
| First resistance | 542.73 |
| Current price | 541.21 |
| First support | 540.50 |
| Second support | 537.31 |
| Strong support | 534.17 |
### 2\. International market and Berkshire fundamentals
There are two important sides to consider:
* Berkshire's diversified businesses and large financial reserves provide fundamental support.
* Global uncertainty, interest rates, energy prices and geopolitical tensions can affect investor appetite and valuation.
Recent market commentary identifies geopolitical tensions, crude oil and earnings as important market drivers. Rediff +1
Recent analyst commentary has also discussed renewed buybacks and potential earnings growth at Berkshire. Seeking Alpha +1
### 3\. Analyst price targets
Long-term fundamentals: Positive
According to an October 29 analyst roundup:
| Analyst / estimate | BRK.B target |
| ------------------- | ------------ |
| UBS | $628 |
| DA Davidson | $592 |
| Consensus | $555.67 |
| DBS | $540 |
| TD Cowen equivalent | $528 |
These are underlying Berkshire Class B share targets, not guaranteed BRKBB trading prices. Beinsure
### 4\. War and global financial risks
The main risks to watch:
* US–Iran tensions and any escalation.
* Oil-price spikes and inflation.
* US Treasury yields and Federal Reserve policy.
* US dollar strength and global institutional investment flows.
These factors can cause short-term volatility even when Berkshire's business fundamentals remain strong. Rediff.com Business +1
### 5\. My BRKBB price forecast
Scenario estimates based on your chart, not guaranteed targets.
Next 24–48 hours
### 542–546
Possible recovery zone if buyers reclaim VWAP.
Bullish breakout
### 549–553
Requires a sustained move above 545.70.
Bearish breakdown
### 537–534
Likely downside targets if 540.50 fails.
My probability-weighted view:
* 50% — sideways to mild recovery.
* 35% — further downside.
* 15% — strong bullish breakout.
These are my subjective scenario probabilities, not statistical guarantees.
### 6\. Trading decision
Wait for confirmation
My strongest trading view:
* Buy signal: 1H candle closes above 542.73–543 and holds that level on a retest.
* Stronger buy confirmation: Break and hold above 545.70.
* Sell / avoid new longs: 1H candle closes below 540.50.
* Stop-loss reference: Below 537.30, depending on your entry and risk tolerance.
One important warning: BRKBB is a tokenized security, not an ordinary cryptocurrency or direct traditional share. CoinMarketCap's available snapshot showed a market cap around $552K and only 35 holders. Thin liquidity can make execution prices differ from the underlying Berkshire share. CoinMarketCap +1
Final verdict: Short-term slightly bearish until 543 is reclaimed. A break above 545.70 would change my view to bullish. I would not enter with a large position before confirmation.
Show
me the predicted next candle in an image
This is a scenario forecast, not a guaranteed price prediction or financial advice.#BinanceProcesses$4.65BWithdrawals #BrazilVirtualAssetLicenseDeadlineDrawsAbout40Firms #BTCPayServerUrgesOperatorsToShutDownInstances $BRKBB
BRKBB/USDT 👇
### $BRKBB /USDT — Strong Price Prediction
My analysis combines your Binance 1-hour chart, BRKBB market data, Berkshire Hathaway fundamentals, analyst outlook and global geopolitical risks.
### 541.21 USDT
Your screenshot price · November 2, 2026
### 1\. Technical analysis — 1H chart

Here is what your chart is showing:
* Price is below VWAP (542.73): short-term sellers have an advantage.
* Recent movement shows lower highs.
* Price has fallen from approximately 552.66 to 541.21.
* A small recovery is visible near the recent low, but reversal is not confirmed.
Important levels
| Level | Price (USDT) |
| ----------------- | ------------ |
| Strong resistance | 545.45 |
| First resistance | 542.73 |
| Current price | 541.21 |
| First support | 540.50 |
| Second support | 537.31 |
| Strong support | 534.17 |
### 2\. International market and Berkshire fundamentals
There are two important sides to consider:
* Berkshire's diversified businesses and large financial reserves provide fundamental support.
* Global uncertainty, interest rates, energy prices and geopolitical tensions can affect investor appetite and valuation.
Recent market commentary identifies geopolitical tensions, crude oil and earnings as important market drivers. Rediff +1
Recent analyst commentary has also discussed renewed buybacks and potential earnings growth at Berkshire. Seeking Alpha +1
### 3\. Analyst price targets
Long-term fundamentals: Positive
According to an October 29 analyst roundup:
| Analyst / estimate | BRK.B target |
| ------------------- | ------------ |
| UBS | $628 |
| DA Davidson | $592 |
| Consensus | $555.67 |
| DBS | $540 |
| TD Cowen equivalent | $528 |
These are underlying Berkshire Class B share targets, not guaranteed BRKBB trading prices. Beinsure
### 4\. War and global financial risks
The main risks to watch:
* US–Iran tensions and any escalation.
* Oil-price spikes and inflation.
* US Treasury yields and Federal Reserve policy.
* US dollar strength and global institutional investment flows.
These factors can cause short-term volatility even when Berkshire's business fundamentals remain strong. Rediff.com Business +1
### 5\. My BRKBB price forecast
Scenario estimates based on your chart, not guaranteed targets.
Next 24–48 hours
### 542–546
Possible recovery zone if buyers reclaim VWAP.
Bullish breakout
### 549–553
Requires a sustained move above 545.70.
Bearish breakdown
### 537–534
Likely downside targets if 540.50 fails.
My probability-weighted view:
* 50% — sideways to mild recovery.
* 35% — further downside.
* 15% — strong bullish breakout.
These are my subjective scenario probabilities, not statistical guarantees.
### 6\. Trading decision
Wait for confirmation
My strongest trading view:
* Buy signal: 1H candle closes above 542.73–543 and holds that level on a retest.
* Stronger buy confirmation: Break and hold above 545.70.
* Sell / avoid new longs: 1H candle closes below 540.50.
* Stop-loss reference: Below 537.30, depending on your entry and risk tolerance.
One important warning: BRKBB is a tokenized security, not an ordinary cryptocurrency or direct traditional share. CoinMarketCap's available snapshot showed a market cap around $552K and only 35 holders. Thin liquidity can make execution prices differ from the underlying Berkshire share. CoinMarketCap +1
Final verdict: Short-term slightly bearish until 543 is reclaimed. A break above 545.70 would change my view to bullish. I would not enter with a large position before confirmation.
Show
me the predicted next candle in an image
This is a scenario forecast, not a guaranteed price prediction or financial advice.#BinanceProcesses$4.65BWithdrawals #BrazilVirtualAssetLicenseDeadlineDrawsAbout40Firms #BTCPayServerUrgesOperatorsToShutDownInstances $BRKBB
My analysis combines your Binance 1-hour chart, BRKBB market data, Berkshire Hathaway fundamentals, analyst outlook and global geopolitical risks.
### 541.21 USDT
Your screenshot price · November 2, 2026
### 1\. Technical analysis — 1H chart

Here is what your chart is showing:
* Price is below VWAP (542.73): short-term sellers have an advantage.
* Recent movement shows lower highs.
* Price has fallen from approximately 552.66 to 541.21.
* A small recovery is visible near the recent low, but reversal is not confirmed.
Important levels
| Level | Price (USDT) |
| ----------------- | ------------ |
| Strong resistance | 545.45 |
| First resistance | 542.73 |
| Current price | 541.21 |
| First support | 540.50 |
| Second support | 537.31 |
| Strong support | 534.17 |
### 2\. International market and Berkshire fundamentals
There are two important sides to consider:
* Berkshire's diversified businesses and large financial reserves provide fundamental support.
* Global uncertainty, interest rates, energy prices and geopolitical tensions can affect investor appetite and valuation.
Recent market commentary identifies geopolitical tensions, crude oil and earnings as important market drivers. Rediff +1
Recent analyst commentary has also discussed renewed buybacks and potential earnings growth at Berkshire. Seeking Alpha +1
### 3\. Analyst price targets
Long-term fundamentals: Positive
According to an October 29 analyst roundup:
| Analyst / estimate | BRK.B target |
| ------------------- | ------------ |
| UBS | $628 |
| DA Davidson | $592 |
| Consensus | $555.67 |
| DBS | $540 |
| TD Cowen equivalent | $528 |
These are underlying Berkshire Class B share targets, not guaranteed BRKBB trading prices. Beinsure
### 4\. War and global financial risks
The main risks to watch:
* US–Iran tensions and any escalation.
* Oil-price spikes and inflation.
* US Treasury yields and Federal Reserve policy.
* US dollar strength and global institutional investment flows.
These factors can cause short-term volatility even when Berkshire's business fundamentals remain strong. Rediff.com Business +1
### 5\. My BRKBB price forecast
Scenario estimates based on your chart, not guaranteed targets.
Next 24–48 hours
### 542–546
Possible recovery zone if buyers reclaim VWAP.
Bullish breakout
### 549–553
Requires a sustained move above 545.70.
Bearish breakdown
### 537–534
Likely downside targets if 540.50 fails.
My probability-weighted view:
* 50% — sideways to mild recovery.
* 35% — further downside.
* 15% — strong bullish breakout.
These are my subjective scenario probabilities, not statistical guarantees.
### 6\. Trading decision
Wait for confirmation
My strongest trading view:
* Buy signal: 1H candle closes above 542.73–543 and holds that level on a retest.
* Stronger buy confirmation: Break and hold above 545.70.
* Sell / avoid new longs: 1H candle closes below 540.50.
* Stop-loss reference: Below 537.30, depending on your entry and risk tolerance.
One important warning: BRKBB is a tokenized security, not an ordinary cryptocurrency or direct traditional share. CoinMarketCap's available snapshot showed a market cap around $552K and only 35 holders. Thin liquidity can make execution prices differ from the underlying Berkshire share. CoinMarketCap +1
Final verdict: Short-term slightly bearish until 543 is reclaimed. A break above 545.70 would change my view to bullish. I would not enter with a large position before confirmation.
Show
me the predicted next candle in an image
This is a scenario forecast, not a guaranteed price prediction or financial advice.#BinanceProcesses$4.65BWithdrawals #BrazilVirtualAssetLicenseDeadlineDrawsAbout40Firms #BTCPayServerUrgesOperatorsToShutDownInstances $BRKBB
29
Artikel
Übersetzung ansehen
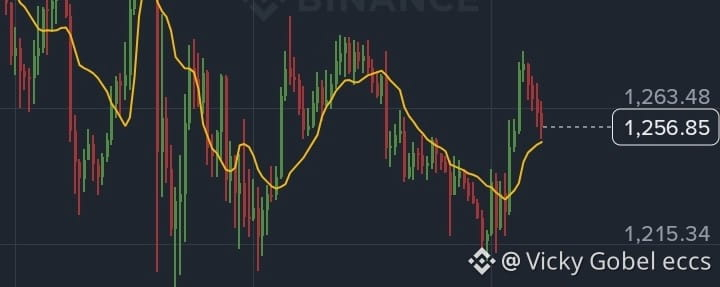
$ZECUSDT 👇Worked for 11s
### $ZEC /USDC — Strong price prediction
Analysis date: 2 November 2026 · Binance · 1-hour chart
Short-term: Cautiously bullish
I have examined your Binance screenshot. Here is the technical picture before considering international markets and geopolitical risks.
ZEC current price in your screenshot
### 1,256.85 USDC
VWAP (14)
1,251.54
24h high
1,283.68
24h low
1,209.43
My initial chart reading:
* ZEC has rebounded from approximately 1,210.
* Price is slightly above VWAP, a short-term positive sign.
* Resistance is developing around 1,263–1,284.
* A rejection at resistance could send price back towards 1,240 or 1,215.
### 1\. International market and geopolitical analysis
Bitcoin and global risk sentiment
* Bitcoin is trading around $78,789 in the latest November 2 market report.
* Bitcoin investment funds experienced approximately $643 million in outflows.
* This indicates caution among institutional investors, which can put pressure on altcoins including ZEC. Saxo UK +1
War and geopolitical situation
* Iran–US tensions remain a risk.
* Oil prices fell around 3% amid renewed diplomatic discussions involving Qatar and Iran.
* Attacks on vessels near the Strait of Hormuz mean geopolitical risk has not disappeared. Global Banking & Finance Review +1
My interpretation: improving diplomacy could help crypto sentiment, but renewed military escalation could trigger another sell-off.
### 2\. Zcash-specific developments
There are three important developments:
* ETF flows: ZEC saw approximately $17.72 million in weekly ETF inflows, although a Friday outflow showed that demand is not consistently positive.
* NU7 upgrade: Zcash's Network Upgrade 7 is expected around November 5, potentially providing a positive catalyst.
* Development funding: A proposal to change the 8% block reward allocation is attracting attention from the Zcash development community. TMGM +1
These developments give ZEC some positive fundamental support, but they do not guarantee a rally.
### 3\. My ZEC price forecast
Scenario estimates based on your screenshot and November 2 market information, not guaranteed targets.
| Scenario | ZEC target (USDC) |
| --------------------- | ----------------- |
| Immediate resistance | 1,263–1,284 |
| Bullish breakout | 1,310–1,350 |
| Strong bullish target | 1,385 |
| First support | 1,250–1,240 |
| Second support | 1,215–1,205 |
| Bearish extension | 1,185 |
My probability assessment
Bullish
### 50%
Sideways
### 30%
Bearish
### 20%
My subjective scenario weights, not statistically measured probabilities.
### 4\. Trading strategy — what I would watch
Bullish confirmation needed
* Buy confirmation: 1-hour candle closes above 1,284 with strong volume.
* Potential entry: 1,265–1,280 after a successful retest.
* Targets: 1,310 → 1,350 → 1,385.
* Stop-loss reference: Below 1,240, depending on entry and risk tolerance.
Bearish warning
If ZEC breaks 1,240 and fails to recover, watch 1,215 and 1,205. A break below 1,205 increases the risk of 1,185.
### 5\. Final prediction
### 1,310–1,350 USDC
My preferred bullish scenario over the next 24–72 hours, provided support holds.
My verdict: ZEC has a recovery opportunity, but I would not chase a buy at resistance. Wait for a confirmed breakout or a successful support retest.
One important warning: these are scenario forecasts, not guaranteed prices. Avoid high leverage, especially during geopolitical uncertainty.
I can also create an annotated Binance-style image showing the predicted next ZEC can
dle, buy zone, targets and stop-loss.
ZEC ki next candle prediction image banao, buy zone, targets aur stop loss ke sath.
{spot}(ZECUSDT)
#BinanceProcesses$4.65BWithdrawals #BitcoinSpotETFsPost$203MWeeklyOutflow #BrazilVirtualAssetLicenseDeadlineDrawsAbout40Firms $ZEC
$ZECUSDT 👇
Worked for 11s
### $ZEC /USDC — Strong price prediction
Analysis date: 2 November 2026 · Binance · 1-hour chart
Short-term: Cautiously bullish
I have examined your Binance screenshot. Here is the technical picture before considering international markets and geopolitical risks.
ZEC current price in your screenshot
### 1,256.85 USDC
VWAP (14)
1,251.54
24h high
1,283.68
24h low
1,209.43
My initial chart reading:
* ZEC has rebounded from approximately 1,210.
* Price is slightly above VWAP, a short-term positive sign.
* Resistance is developing around 1,263–1,284.
* A rejection at resistance could send price back towards 1,240 or 1,215.
### 1\. International market and geopolitical analysis
Bitcoin and global risk sentiment
* Bitcoin is trading around $78,789 in the latest November 2 market report.
* Bitcoin investment funds experienced approximately $643 million in outflows.
* This indicates caution among institutional investors, which can put pressure on altcoins including ZEC. Saxo UK +1
War and geopolitical situation
* Iran–US tensions remain a risk.
* Oil prices fell around 3% amid renewed diplomatic discussions involving Qatar and Iran.
* Attacks on vessels near the Strait of Hormuz mean geopolitical risk has not disappeared. Global Banking & Finance Review +1
My interpretation: improving diplomacy could help crypto sentiment, but renewed military escalation could trigger another sell-off.
### 2\. Zcash-specific developments
There are three important developments:
* ETF flows: ZEC saw approximately $17.72 million in weekly ETF inflows, although a Friday outflow showed that demand is not consistently positive.
* NU7 upgrade: Zcash's Network Upgrade 7 is expected around November 5, potentially providing a positive catalyst.
* Development funding: A proposal to change the 8% block reward allocation is attracting attention from the Zcash development community. TMGM +1
These developments give ZEC some positive fundamental support, but they do not guarantee a rally.
### 3\. My ZEC price forecast
Scenario estimates based on your screenshot and November 2 market information, not guaranteed targets.
| Scenario | ZEC target (USDC) |
| --------------------- | ----------------- |
| Immediate resistance | 1,263–1,284 |
| Bullish breakout | 1,310–1,350 |
| Strong bullish target | 1,385 |
| First support | 1,250–1,240 |
| Second support | 1,215–1,205 |
| Bearish extension | 1,185 |
My probability assessment
Bullish
### 50%
Sideways
### 30%
Bearish
### 20%
My subjective scenario weights, not statistically measured probabilities.
### 4\. Trading strategy — what I would watch
Bullish confirmation needed
* Buy confirmation: 1-hour candle closes above 1,284 with strong volume.
* Potential entry: 1,265–1,280 after a successful retest.
* Targets: 1,310 → 1,350 → 1,385.
* Stop-loss reference: Below 1,240, depending on entry and risk tolerance.
Bearish warning
If ZEC breaks 1,240 and fails to recover, watch 1,215 and 1,205. A break below 1,205 increases the risk of 1,185.
### 5\. Final prediction
### 1,310–1,350 USDC
My preferred bullish scenario over the next 24–72 hours, provided support holds.
My verdict: ZEC has a recovery opportunity, but I would not chase a buy at resistance. Wait for a confirmed breakout or a successful support retest.
One important warning: these are scenario forecasts, not guaranteed prices. Avoid high leverage, especially during geopolitical uncertainty.
I can also create an annotated Binance-style image showing the predicted next ZEC can
dle, buy zone, targets and stop-loss.
ZEC ki next candle prediction image banao, buy zone, targets aur stop loss ke sath.
#BinanceProcesses$4.65BWithdrawals #BitcoinSpotETFsPost$203MWeeklyOutflow #BrazilVirtualAssetLicenseDeadlineDrawsAbout40Firms $ZEC
### $ZEC /USDC — Strong price prediction
Analysis date: 2 November 2026 · Binance · 1-hour chart
Short-term: Cautiously bullish
I have examined your Binance screenshot. Here is the technical picture before considering international markets and geopolitical risks.
ZEC current price in your screenshot
### 1,256.85 USDC
VWAP (14)
1,251.54
24h high
1,283.68
24h low
1,209.43
My initial chart reading:
* ZEC has rebounded from approximately 1,210.
* Price is slightly above VWAP, a short-term positive sign.
* Resistance is developing around 1,263–1,284.
* A rejection at resistance could send price back towards 1,240 or 1,215.
### 1\. International market and geopolitical analysis
Bitcoin and global risk sentiment
* Bitcoin is trading around $78,789 in the latest November 2 market report.
* Bitcoin investment funds experienced approximately $643 million in outflows.
* This indicates caution among institutional investors, which can put pressure on altcoins including ZEC. Saxo UK +1
War and geopolitical situation
* Iran–US tensions remain a risk.
* Oil prices fell around 3% amid renewed diplomatic discussions involving Qatar and Iran.
* Attacks on vessels near the Strait of Hormuz mean geopolitical risk has not disappeared. Global Banking & Finance Review +1
My interpretation: improving diplomacy could help crypto sentiment, but renewed military escalation could trigger another sell-off.
### 2\. Zcash-specific developments
There are three important developments:
* ETF flows: ZEC saw approximately $17.72 million in weekly ETF inflows, although a Friday outflow showed that demand is not consistently positive.
* NU7 upgrade: Zcash's Network Upgrade 7 is expected around November 5, potentially providing a positive catalyst.
* Development funding: A proposal to change the 8% block reward allocation is attracting attention from the Zcash development community. TMGM +1
These developments give ZEC some positive fundamental support, but they do not guarantee a rally.
### 3\. My ZEC price forecast
Scenario estimates based on your screenshot and November 2 market information, not guaranteed targets.
| Scenario | ZEC target (USDC) |
| --------------------- | ----------------- |
| Immediate resistance | 1,263–1,284 |
| Bullish breakout | 1,310–1,350 |
| Strong bullish target | 1,385 |
| First support | 1,250–1,240 |
| Second support | 1,215–1,205 |
| Bearish extension | 1,185 |
My probability assessment
Bullish
### 50%
Sideways
### 30%
Bearish
### 20%
My subjective scenario weights, not statistically measured probabilities.
### 4\. Trading strategy — what I would watch
Bullish confirmation needed
* Buy confirmation: 1-hour candle closes above 1,284 with strong volume.
* Potential entry: 1,265–1,280 after a successful retest.
* Targets: 1,310 → 1,350 → 1,385.
* Stop-loss reference: Below 1,240, depending on entry and risk tolerance.
Bearish warning
If ZEC breaks 1,240 and fails to recover, watch 1,215 and 1,205. A break below 1,205 increases the risk of 1,185.
### 5\. Final prediction
### 1,310–1,350 USDC
My preferred bullish scenario over the next 24–72 hours, provided support holds.
My verdict: ZEC has a recovery opportunity, but I would not chase a buy at resistance. Wait for a confirmed breakout or a successful support retest.
One important warning: these are scenario forecasts, not guaranteed prices. Avoid high leverage, especially during geopolitical uncertainty.
I can also create an annotated Binance-style image showing the predicted next ZEC can
dle, buy zone, targets and stop-loss.
ZEC ki next candle prediction image banao, buy zone, targets aur stop loss ke sath.
#BinanceProcesses$4.65BWithdrawals #BitcoinSpotETFsPost$203MWeeklyOutflow #BrazilVirtualAssetLicenseDeadlineDrawsAbout40Firms $ZEC
109
Artikel
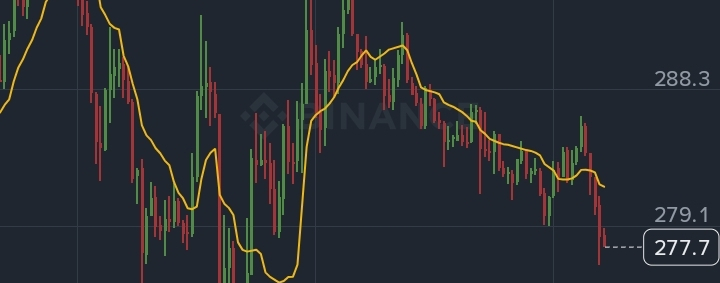
$BCHUSDT$BCH (Bitcoin Cash) Kursprognose – 2. November 2026
Basierend auf deinem Binance-Screenshot, dem 1-Stunden-Zeitrahmen und den noch zu prüfenden allgemeinen Marktfaktoren.
Kurzfristig bärische Tendenz
### 277.70 USDC
Dein Chart zeigt Schwäche.
### 1\. Technische Analyse deines Screenshots
* Aktueller Kurs: $277.70
* 24-Stunden-Hoch: $286.50
* 24-Stunden-Tief: $276.50
* VWAP (14): $281.80
* Der Kurs liegt unter dem VWAP, was darauf hindeutet, dass die Verkäufer derzeit die Kontrolle haben.
* Der Chart zeigt tiefere Hochs und tiefere Tiefs.
* Der Kurs nähert sich dem 24-Stunden-Tief, daher ist ein Durchbruch nach unten möglich.
$BCHUSDT
$BCH (Bitcoin Cash) Kursprognose – 2. November 2026
Basierend auf deinem Binance-Screenshot, dem 1-Stunden-Zeitrahmen und den noch zu prüfenden allgemeinen Marktfaktoren.
Kurzfristig bärische Tendenz
### 277.70 USDC
Dein Chart zeigt Schwäche.
### 1\. Technische Analyse deines Screenshots
* Aktueller Kurs: $277.70
* 24-Stunden-Hoch: $286.50
* 24-Stunden-Tief: $276.50
* VWAP (14): $281.80
* Der Kurs liegt unter dem VWAP, was darauf hindeutet, dass die Verkäufer derzeit die Kontrolle haben.
* Der Chart zeigt tiefere Hochs und tiefere Tiefs.
* Der Kurs nähert sich dem 24-Stunden-Tief, daher ist ein Durchbruch nach unten möglich.
Basierend auf deinem Binance-Screenshot, dem 1-Stunden-Zeitrahmen und den noch zu prüfenden allgemeinen Marktfaktoren.
Kurzfristig bärische Tendenz
### 277.70 USDC
Dein Chart zeigt Schwäche.
### 1\. Technische Analyse deines Screenshots
* Aktueller Kurs: $277.70
* 24-Stunden-Hoch: $286.50
* 24-Stunden-Tief: $276.50
* VWAP (14): $281.80
* Der Kurs liegt unter dem VWAP, was darauf hindeutet, dass die Verkäufer derzeit die Kontrolle haben.
* Der Chart zeigt tiefere Hochs und tiefere Tiefs.
* Der Kurs nähert sich dem 24-Stunden-Tief, daher ist ein Durchbruch nach unten möglich.
46
Artikel
Übersetzung ansehen
$ETHUSDT### ETHUSDT – International Market Analysis
Based on your Binance screenshot · 1
{spot}(ETHUSDT)
November 2026 · 1-hour timeframe
### $2,267.57
+0.74% (24h)Consolidation
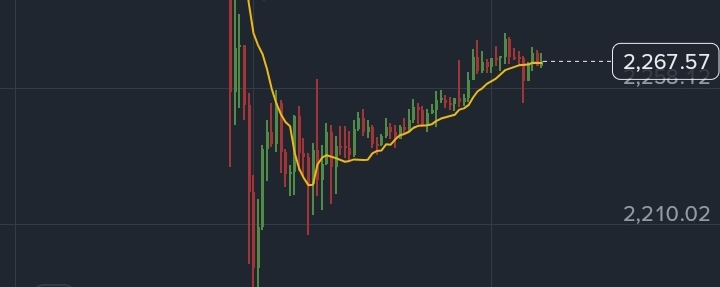
### 1\. Technical analysis of your chart
Your screenshot shows an important recovery:
* ETH dropped sharply to $2,172.85.
* Buyers pushed the price back towards $2,267.
* Price is now consolidating around VWAP ($2,267.04).
* The immediate resistance is around $2,277–$2,280.
* The recovery is positive, but a confirmed breakout has not happened yet.
My initial reading: Short-term recovery, but buyers need to break resistance before a stronger bullish move can be confirmed.
### 2\. International market, war and financial conditions
Latest available reporting: 1 November 2026
There are four important factors affecting ETH right now.
1\. Institutional money – bearish
* U.S. spot Ethereum ETFs reportedly recorded approximately $431.4 million in outflows over five sessions.
* Friday alone saw approximately $155.7 million withdrawn.
* This suggests institutional buying demand is currently weak. CoinMarketCap +2
2\. War and geopolitical risk – mixed
Iran's signals about reopening the Strait of Hormuz could reduce oil-market anxiety if confirmed. Lower geopolitical tension could help risk assets such as ETH. However, a renewed escalation could hurt crypto through risk aversion. CoinGape
3\. Bitcoin influence – important
Bitcoin is recovering towards $78,000, helping ETH recover towards $2,270. But Bitcoin weakness could quickly reverse ETH's recovery. crypto.news
4\. Security and regulatory pressure – bearish
The reported Binance-related security incident, North Korean attribution and potential movement of hacker-linked ETH create additional uncertainty for the market. CoinMarketCap
### 3\. ETH price chart and market outlook
Ethereum (ETH)
### $2,266.36
+$22.96 (1.02%)
1D5D1M6MYTD1Y5YMAX
Open
-
Volume
-
Market Cap
-
Day Low
-
Year Low
1,512.07
EPS (TTM)
-
Day High
-
Year High
3,911.96
P/E Ratio
-
### 4\. Important price levels
| Level | ETH price | Importance |
| -------------------- | ------------ | --------------------- |
| Major resistance | $2,400–2,450 | Strong bullish target |
| Resistance | $2,300 | Breakout confirmation |
| Immediate resistance | $2,278 | Screenshot 24h high |
| Current price | $2,267 | Decision zone |
| Support | $2,250–2,244 | Critical support |
| Lower support | $2,220–2,200 | Bearish targets |
| Major support | $2,173 | Previous chart low |
These levels combine your screenshot with current analyst coverage. crypto.news +1
### 5\. My ETH prediction
Short-term bias: Neutral to bearish
My estimated scenarios for the next 24–72 hours:
Bullish scenario
Conditional
### $2,300 → $2,350
ETH breaks $2,278 and establishes a 1-hour close above $2,300.
Bearish scenario
Risk
### $2,220 → $2,200
ETH loses $2,244–$2,250 with a confirmed 1-hour breakdown.
Consolidation scenario
### $2,245–$2,300
ETH remains range-bound if neither side wins control.
### 6\. My trading decision
I would not open a large leveraged position at $2,267 right now.
| Trade | Confirmation | Target |
| ----- | ------------------------------ | ------------- |
| LONG | 1h close above $2,300 + retest | $2,320–$2,350 |
| SHORT | 1h close below $2,244 | $2,220–$2,200 |
Use a stop-loss and avoid high leverage.
### 7\. Final verdict
My strongest current assessment: ETH is attempting a recovery, but the broader short-term trend remains vulnerable.
Three things could change this prediction:
* Bitcoin breaking above or falling below $78,000.
* Ethereum ETF flows turning positive.
* Whether the Iran–US negotiations reduce geopolitical risk. The Hormuz proposal is conditional, not a confirmed peace agreement. CoinGape +2
One important warning: RSI around 34 and negative MACD indicate weak momentum, although bearish momentum may be easing. crypto.news
To improve this prediction, send me your latest ETH 15-min
ute and 4-hour charts. I can
then compare the entry zones and identify a more precise setup.
Make an ETH chart image with exact LONG and SHORT entry zones, stop-loss and take-profit levels.#BinanceToResumePhaseOneOfWithdrawals #IntelHasItsWorstDaySince1974 #BinanceUpdatesProofofReservesAddresses $ETH
$ETHUSDT
### ETHUSDT – International Market Analysis
Based on your Binance screenshot · 1
November 2026 · 1-hour timeframe
### $2,267.57
+0.74% (24h)Consolidation
### 1\. Technical analysis of your chart
Your screenshot shows an important recovery:
* ETH dropped sharply to $2,172.85.
* Buyers pushed the price back towards $2,267.
* Price is now consolidating around VWAP ($2,267.04).
* The immediate resistance is around $2,277–$2,280.
* The recovery is positive, but a confirmed breakout has not happened yet.
My initial reading: Short-term recovery, but buyers need to break resistance before a stronger bullish move can be confirmed.
### 2\. International market, war and financial conditions
Latest available reporting: 1 November 2026
There are four important factors affecting ETH right now.
1\. Institutional money – bearish
* U.S. spot Ethereum ETFs reportedly recorded approximately $431.4 million in outflows over five sessions.
* Friday alone saw approximately $155.7 million withdrawn.
* This suggests institutional buying demand is currently weak. CoinMarketCap +2
2\. War and geopolitical risk – mixed
Iran's signals about reopening the Strait of Hormuz could reduce oil-market anxiety if confirmed. Lower geopolitical tension could help risk assets such as ETH. However, a renewed escalation could hurt crypto through risk aversion. CoinGape
3\. Bitcoin influence – important
Bitcoin is recovering towards $78,000, helping ETH recover towards $2,270. But Bitcoin weakness could quickly reverse ETH's recovery. crypto.news
4\. Security and regulatory pressure – bearish
The reported Binance-related security incident, North Korean attribution and potential movement of hacker-linked ETH create additional uncertainty for the market. CoinMarketCap
### 3\. ETH price chart and market outlook
Ethereum (ETH)
### $2,266.36
+$22.96 (1.02%)
1D5D1M6MYTD1Y5YMAX
Open
-
Volume
-
Market Cap
-
Day Low
-
Year Low
1,512.07
EPS (TTM)
-
Day High
-
Year High
3,911.96
P/E Ratio
-
### 4\. Important price levels
| Level | ETH price | Importance |
| -------------------- | ------------ | --------------------- |
| Major resistance | $2,400–2,450 | Strong bullish target |
| Resistance | $2,300 | Breakout confirmation |
| Immediate resistance | $2,278 | Screenshot 24h high |
| Current price | $2,267 | Decision zone |
| Support | $2,250–2,244 | Critical support |
| Lower support | $2,220–2,200 | Bearish targets |
| Major support | $2,173 | Previous chart low |
These levels combine your screenshot with current analyst coverage. crypto.news +1
### 5\. My ETH prediction
Short-term bias: Neutral to bearish
My estimated scenarios for the next 24–72 hours:
Bullish scenario
Conditional
### $2,300 → $2,350
ETH breaks $2,278 and establishes a 1-hour close above $2,300.
Bearish scenario
Risk
### $2,220 → $2,200
ETH loses $2,244–$2,250 with a confirmed 1-hour breakdown.
Consolidation scenario
### $2,245–$2,300
ETH remains range-bound if neither side wins control.
### 6\. My trading decision
I would not open a large leveraged position at $2,267 right now.
| Trade | Confirmation | Target |
| ----- | ------------------------------ | ------------- |
| LONG | 1h close above $2,300 + retest | $2,320–$2,350 |
| SHORT | 1h close below $2,244 | $2,220–$2,200 |
Use a stop-loss and avoid high leverage.
### 7\. Final verdict
My strongest current assessment: ETH is attempting a recovery, but the broader short-term trend remains vulnerable.
Three things could change this prediction:
* Bitcoin breaking above or falling below $78,000.
* Ethereum ETF flows turning positive.
* Whether the Iran–US negotiations reduce geopolitical risk. The Hormuz proposal is conditional, not a confirmed peace agreement. CoinGape +2
One important warning: RSI around 34 and negative MACD indicate weak momentum, although bearish momentum may be easing. crypto.news
To improve this prediction, send me your latest ETH 15-min
ute and 4-hour charts. I can
then compare the entry zones and identify a more precise setup.
Make an ETH chart image with exact LONG and SHORT entry zones, stop-loss and take-profit levels.#BinanceToResumePhaseOneOfWithdrawals #IntelHasItsWorstDaySince1974 #BinanceUpdatesProofofReservesAddresses $ETH
Based on your Binance screenshot · 1
November 2026 · 1-hour timeframe
### $2,267.57
+0.74% (24h)Consolidation
### 1\. Technical analysis of your chart
Your screenshot shows an important recovery:
* ETH dropped sharply to $2,172.85.
* Buyers pushed the price back towards $2,267.
* Price is now consolidating around VWAP ($2,267.04).
* The immediate resistance is around $2,277–$2,280.
* The recovery is positive, but a confirmed breakout has not happened yet.
My initial reading: Short-term recovery, but buyers need to break resistance before a stronger bullish move can be confirmed.
### 2\. International market, war and financial conditions
Latest available reporting: 1 November 2026
There are four important factors affecting ETH right now.
1\. Institutional money – bearish
* U.S. spot Ethereum ETFs reportedly recorded approximately $431.4 million in outflows over five sessions.
* Friday alone saw approximately $155.7 million withdrawn.
* This suggests institutional buying demand is currently weak. CoinMarketCap +2
2\. War and geopolitical risk – mixed
Iran's signals about reopening the Strait of Hormuz could reduce oil-market anxiety if confirmed. Lower geopolitical tension could help risk assets such as ETH. However, a renewed escalation could hurt crypto through risk aversion. CoinGape
3\. Bitcoin influence – important
Bitcoin is recovering towards $78,000, helping ETH recover towards $2,270. But Bitcoin weakness could quickly reverse ETH's recovery. crypto.news
4\. Security and regulatory pressure – bearish
The reported Binance-related security incident, North Korean attribution and potential movement of hacker-linked ETH create additional uncertainty for the market. CoinMarketCap
### 3\. ETH price chart and market outlook
Ethereum (ETH)
### $2,266.36
+$22.96 (1.02%)
1D5D1M6MYTD1Y5YMAX
Open
-
Volume
-
Market Cap
-
Day Low
-
Year Low
1,512.07
EPS (TTM)
-
Day High
-
Year High
3,911.96
P/E Ratio
-
### 4\. Important price levels
| Level | ETH price | Importance |
| -------------------- | ------------ | --------------------- |
| Major resistance | $2,400–2,450 | Strong bullish target |
| Resistance | $2,300 | Breakout confirmation |
| Immediate resistance | $2,278 | Screenshot 24h high |
| Current price | $2,267 | Decision zone |
| Support | $2,250–2,244 | Critical support |
| Lower support | $2,220–2,200 | Bearish targets |
| Major support | $2,173 | Previous chart low |
These levels combine your screenshot with current analyst coverage. crypto.news +1
### 5\. My ETH prediction
Short-term bias: Neutral to bearish
My estimated scenarios for the next 24–72 hours:
Bullish scenario
Conditional
### $2,300 → $2,350
ETH breaks $2,278 and establishes a 1-hour close above $2,300.
Bearish scenario
Risk
### $2,220 → $2,200
ETH loses $2,244–$2,250 with a confirmed 1-hour breakdown.
Consolidation scenario
### $2,245–$2,300
ETH remains range-bound if neither side wins control.
### 6\. My trading decision
I would not open a large leveraged position at $2,267 right now.
| Trade | Confirmation | Target |
| ----- | ------------------------------ | ------------- |
| LONG | 1h close above $2,300 + retest | $2,320–$2,350 |
| SHORT | 1h close below $2,244 | $2,220–$2,200 |
Use a stop-loss and avoid high leverage.
### 7\. Final verdict
My strongest current assessment: ETH is attempting a recovery, but the broader short-term trend remains vulnerable.
Three things could change this prediction:
* Bitcoin breaking above or falling below $78,000.
* Ethereum ETF flows turning positive.
* Whether the Iran–US negotiations reduce geopolitical risk. The Hormuz proposal is conditional, not a confirmed peace agreement. CoinGape +2
One important warning: RSI around 34 and negative MACD indicate weak momentum, although bearish momentum may be easing. crypto.news
To improve this prediction, send me your latest ETH 15-min
ute and 4-hour charts. I can
then compare the entry zones and identify a more precise setup.
Make an ETH chart image with exact LONG and SHORT entry zones, stop-loss and take-profit levels.#BinanceToResumePhaseOneOfWithdrawals #IntelHasItsWorstDaySince1974 #BinanceUpdatesProofofReservesAddresses $ETH
37
·
--
Bullisch
Übersetzung ansehen
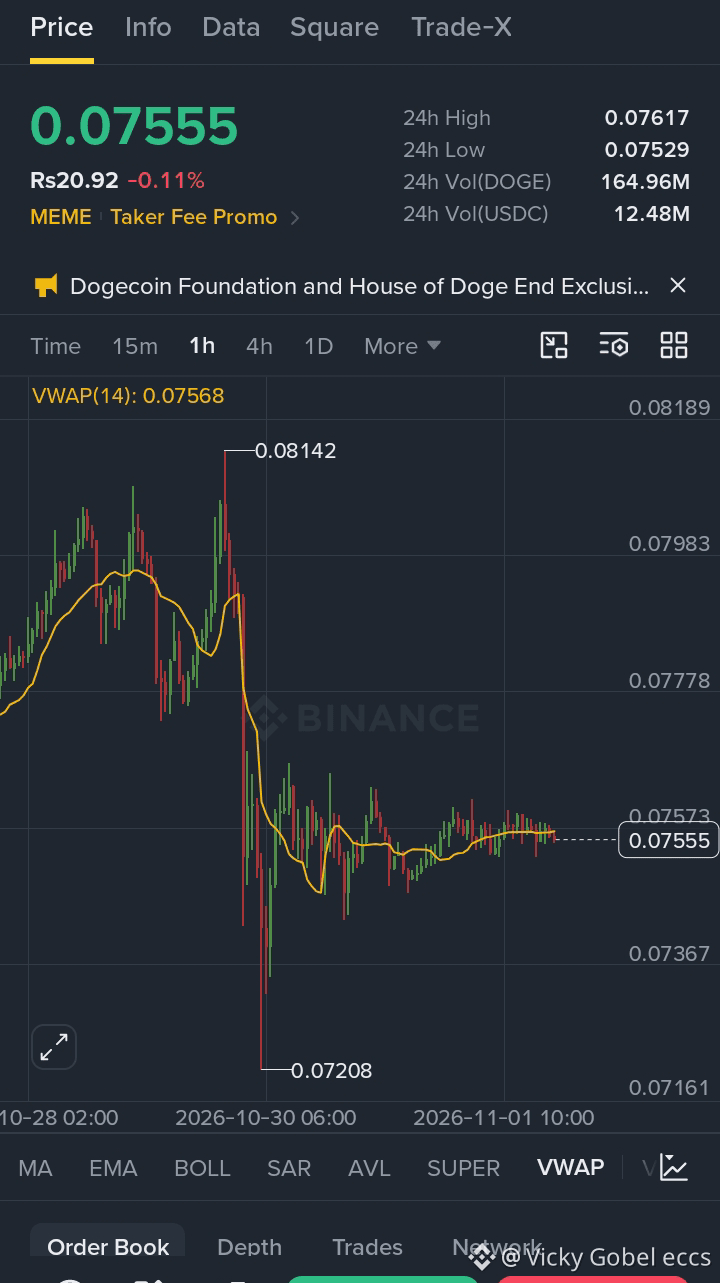
🐕 $DOGE/USDC – 1H Technical Analysis
💰 Current Price: 0.07555 USDC
📊 Market Overview:
DOGE experienced a sharp bearish move from 0.08142 to 0.07208. After this drop, the price entered a sideways consolidation phase.
Current price is slightly below VWAP (0.07568), indicating that buyers have not yet confirmed a bullish reversal.
📈 Resistance Levels:
- 0.07573
- 0.07778
- 0.07983
- 0.08142
📉 Support Levels:
- 0.07529
- 0.07367
- 0.07208
🎯 Trading Scenarios:
🟢 Bullish: A strong 1H candle close above 0.07573 and VWAP could push DOGE toward 0.07778.
🔴 Bearish: A breakdown below 0.07529 could bring another test of 0.07367.
🔥 My Prediction: Neutral to slightly bearish until DOGE reclaims VWAP. A confirmed breakout could change the short-term trend.
⚠️ Avoid emotional trading. Always use Stop Loss and proper risk management.
#DOGE #DOGEUSDC #BinanceSquare #CryptoAnalysis #TechnicalAnalysis #CryptoTrading
{spot}(DOGEUSDT)
$SAP.US #BinanceUpdatesProofofReservesAddresses #BinanceToResumePhaseOneOfWithdrawals #IntelHasItsWorstDaySince1974
please trad now 👇
🐕 $DOGE/USDC – 1H Technical Analysis
💰 Current Price: 0.07555 USDC
📊 Market Overview:
DOGE experienced a sharp bearish move from 0.08142 to 0.07208. After this drop, the price entered a sideways consolidation phase.
Current price is slightly below VWAP (0.07568), indicating that buyers have not yet confirmed a bullish reversal.
📈 Resistance Levels:
- 0.07573
- 0.07778
- 0.07983
- 0.08142
📉 Support Levels:
- 0.07529
- 0.07367
- 0.07208
🎯 Trading Scenarios:
🟢 Bullish: A strong 1H candle close above 0.07573 and VWAP could push DOGE toward 0.07778.
🔴 Bearish: A breakdown below 0.07529 could bring another test of 0.07367.
🔥 My Prediction: Neutral to slightly bearish until DOGE reclaims VWAP. A confirmed breakout could change the short-term trend.
⚠️ Avoid emotional trading. Always use Stop Loss and proper risk management.
#DOGE #DOGEUSDC #BinanceSquare #CryptoAnalysis #TechnicalAnalysis #CryptoTrading
$SAP.US #BinanceUpdatesProofofReservesAddresses #BinanceToResumePhaseOneOfWithdrawals #IntelHasItsWorstDaySince1974
please trad now 👇
💰 Current Price: 0.07555 USDC
📊 Market Overview:
DOGE experienced a sharp bearish move from 0.08142 to 0.07208. After this drop, the price entered a sideways consolidation phase.
Current price is slightly below VWAP (0.07568), indicating that buyers have not yet confirmed a bullish reversal.
📈 Resistance Levels:
- 0.07573
- 0.07778
- 0.07983
- 0.08142
📉 Support Levels:
- 0.07529
- 0.07367
- 0.07208
🎯 Trading Scenarios:
🟢 Bullish: A strong 1H candle close above 0.07573 and VWAP could push DOGE toward 0.07778.
🔴 Bearish: A breakdown below 0.07529 could bring another test of 0.07367.
🔥 My Prediction: Neutral to slightly bearish until DOGE reclaims VWAP. A confirmed breakout could change the short-term trend.
⚠️ Avoid emotional trading. Always use Stop Loss and proper risk management.
#DOGE #DOGEUSDC #BinanceSquare #CryptoAnalysis #TechnicalAnalysis #CryptoTrading
$SAP.US #BinanceUpdatesProofofReservesAddresses #BinanceToResumePhaseOneOfWithdrawals #IntelHasItsWorstDaySince1974
please trad now 👇
73
·
--
Bullisch
Übersetzung ansehen
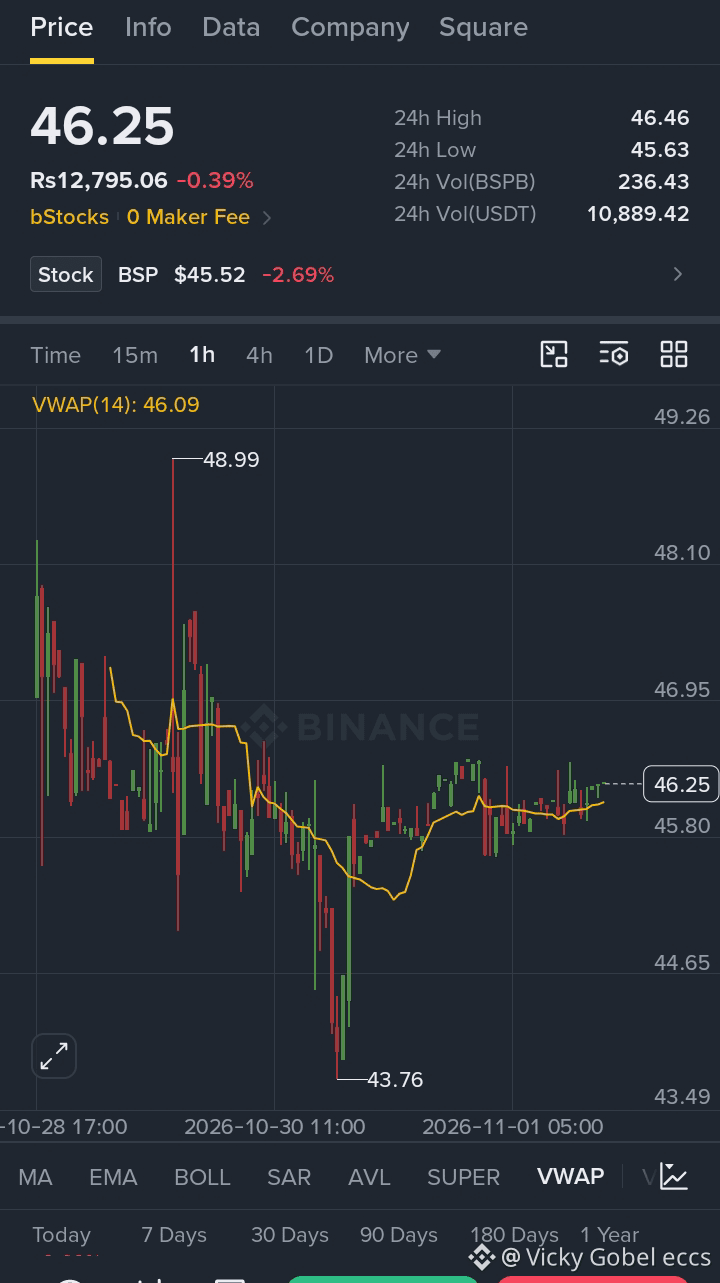
Here is a Binance Square-ready technical analysis post for $BSPB/USDT.
📊 **$BSPB/USDT – 1H Technical Analysis**
💰 Current Price: 46.25 USDT
🔍 **Market Overview:**
BSPB is showing signs of recovery after dropping to 43.76. The price is now trading above VWAP (46.09), indicating a slight improvement in short-term buying pressure.
📈 **Resistance Levels:**
- 46.46
- 46.95
- 48.10
📉 **Support Levels:**
- 46.09 (VWAP)
- 45.80
- 44.65
- 43.76
🎯 **Trading Scenarios:**
🟢 **Bullish Scenario:** A strong 1H candle close above 46.46 may open the way toward 46.95.
🔴 **Bearish Scenario:** If price falls below 45.80, selling pressure may increase toward 44.65.
🔥 **My Prediction:** Short-term neutral to slightly bullish. A confirmed breakout above 46.46 is needed for stronger bullish momentum.
⚠️ Trade carefully. Always use Stop Loss and manage your risk.
#BSPBUSDT #BinanceSquare #CryptoAnalysis #TechnicalAnalysis #TradingSignals #CryptoTrading
*Not financial advice.*
I can also create a professional Binance Square trading chart image for BSPB/USDT with bullish and bearish target levels.
BSPB ka analysis image
please trad now
👇
{spot}(BSPBUSDT)
$NVDAB #B14gReportsUnauthorizedTransferOfAbout97MCORE #BinanceToResumePhaseOneOfWithdrawals #USSpotETHETFsPost23StraightDaysOfNetOutflows #BinanceUpdatesProofofReservesAddresses
Here is a Binance Square-ready technical analysis post for $BSPB/USDT.
📊 **$BSPB/USDT – 1H Technical Analysis**
💰 Current Price: 46.25 USDT
🔍 **Market Overview:**
BSPB is showing signs of recovery after dropping to 43.76. The price is now trading above VWAP (46.09), indicating a slight improvement in short-term buying pressure.
📈 **Resistance Levels:**
- 46.46
- 46.95
- 48.10
📉 **Support Levels:**
- 46.09 (VWAP)
- 45.80
- 44.65
- 43.76
🎯 **Trading Scenarios:**
🟢 **Bullish Scenario:** A strong 1H candle close above 46.46 may open the way toward 46.95.
🔴 **Bearish Scenario:** If price falls below 45.80, selling pressure may increase toward 44.65.
🔥 **My Prediction:** Short-term neutral to slightly bullish. A confirmed breakout above 46.46 is needed for stronger bullish momentum.
⚠️ Trade carefully. Always use Stop Loss and manage your risk.
#BSPBUSDT #BinanceSquare #CryptoAnalysis #TechnicalAnalysis #TradingSignals #CryptoTrading
*Not financial advice.*
I can also create a professional Binance Square trading chart image for BSPB/USDT with bullish and bearish target levels.
BSPB ka analysis image
please trad now
👇
$NVDAB #B14gReportsUnauthorizedTransferOfAbout97MCORE #BinanceToResumePhaseOneOfWithdrawals #USSpotETHETFsPost23StraightDaysOfNetOutflows #BinanceUpdatesProofofReservesAddresses
📊 **$BSPB/USDT – 1H Technical Analysis**
💰 Current Price: 46.25 USDT
🔍 **Market Overview:**
BSPB is showing signs of recovery after dropping to 43.76. The price is now trading above VWAP (46.09), indicating a slight improvement in short-term buying pressure.
📈 **Resistance Levels:**
- 46.46
- 46.95
- 48.10
📉 **Support Levels:**
- 46.09 (VWAP)
- 45.80
- 44.65
- 43.76
🎯 **Trading Scenarios:**
🟢 **Bullish Scenario:** A strong 1H candle close above 46.46 may open the way toward 46.95.
🔴 **Bearish Scenario:** If price falls below 45.80, selling pressure may increase toward 44.65.
🔥 **My Prediction:** Short-term neutral to slightly bullish. A confirmed breakout above 46.46 is needed for stronger bullish momentum.
⚠️ Trade carefully. Always use Stop Loss and manage your risk.
#BSPBUSDT #BinanceSquare #CryptoAnalysis #TechnicalAnalysis #TradingSignals #CryptoTrading
*Not financial advice.*
I can also create a professional Binance Square trading chart image for BSPB/USDT with bullish and bearish target levels.
BSPB ka analysis image
please trad now
👇
$NVDAB #B14gReportsUnauthorizedTransferOfAbout97MCORE #BinanceToResumePhaseOneOfWithdrawals #USSpotETHETFsPost23StraightDaysOfNetOutflows #BinanceUpdatesProofofReservesAddresses
1
61
·
--
Bullisch
Übersetzung ansehen
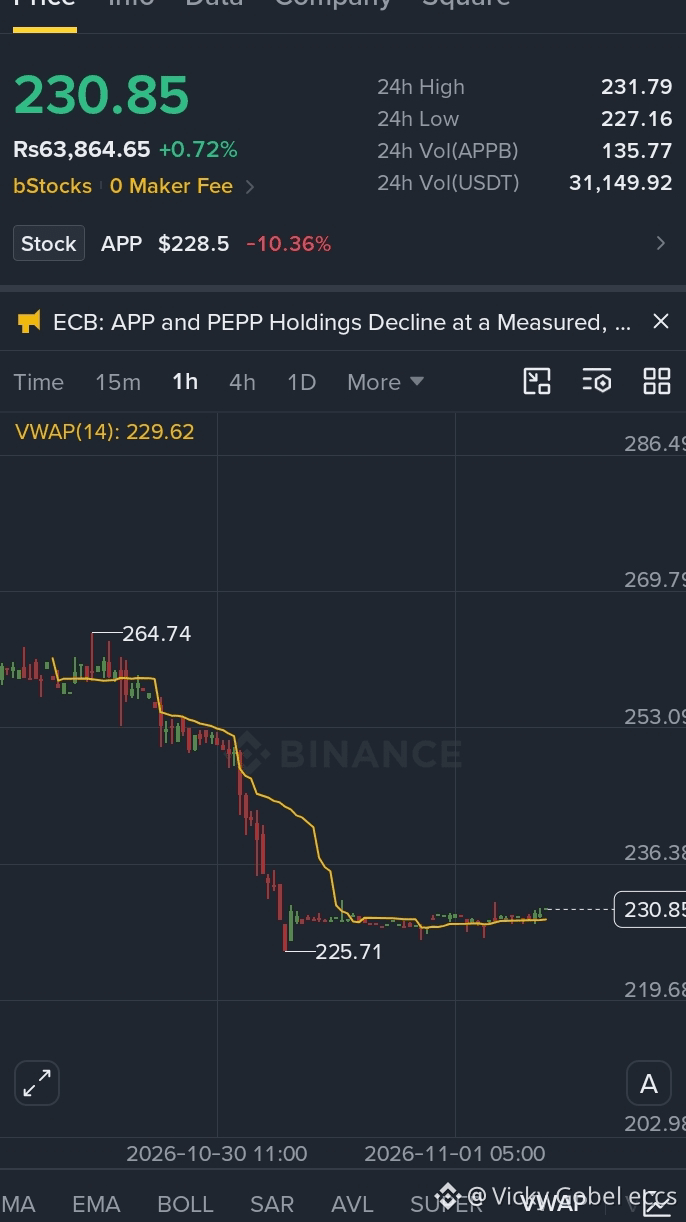
📊 $APPB/USDT – 1H Technical Analysis
💰 Current Price: 230.85 USDT
🔍 Market Overview:
APPB has experienced a strong bearish move from 264.74 to 225.71. Currently, price is consolidating around 230.85, showing signs of short-term stabilization.
📈 Key Resistance Levels:
- 231.79
- 236.38
- 253.09
📉 Key Support Levels:
- 229.62 (VWAP area)
- 225.71
- 219.68
🎯 Trading Scenarios:
🟢 Bullish: A strong 1H close above 231.79 could open the way toward 236.38.
🔴 Bearish: A breakdown below 229.62 could bring another test of 225.71.
⚠️ My View: Neutral to slightly bullish in the short term, but the overall trend remains bearish until resistance is broken.
Trade carefully. Always use Stop Loss.
#APPBUSDT #BinanceSquare #TechnicalAnalysis #CryptoTrading #TradingSignals #MarketAnalysis
Not financial advice.
{spot}(APPBUSDT)
$AAPLB #IntelHasItsWorstDaySince1974 #BinanceToResumePhaseOneOfWithdrawals #BinanceUpdatesProofofReservesAddresses
📊 $APPB/USDT – 1H Technical Analysis
💰 Current Price: 230.85 USDT
🔍 Market Overview:
APPB has experienced a strong bearish move from 264.74 to 225.71. Currently, price is consolidating around 230.85, showing signs of short-term stabilization.
📈 Key Resistance Levels:
- 231.79
- 236.38
- 253.09
📉 Key Support Levels:
- 229.62 (VWAP area)
- 225.71
- 219.68
🎯 Trading Scenarios:
🟢 Bullish: A strong 1H close above 231.79 could open the way toward 236.38.
🔴 Bearish: A breakdown below 229.62 could bring another test of 225.71.
⚠️ My View: Neutral to slightly bullish in the short term, but the overall trend remains bearish until resistance is broken.
Trade carefully. Always use Stop Loss.
#APPBUSDT #BinanceSquare #TechnicalAnalysis #CryptoTrading #TradingSignals #MarketAnalysis
Not financial advice.
$AAPLB #IntelHasItsWorstDaySince1974 #BinanceToResumePhaseOneOfWithdrawals #BinanceUpdatesProofofReservesAddresses
💰 Current Price: 230.85 USDT
🔍 Market Overview:
APPB has experienced a strong bearish move from 264.74 to 225.71. Currently, price is consolidating around 230.85, showing signs of short-term stabilization.
📈 Key Resistance Levels:
- 231.79
- 236.38
- 253.09
📉 Key Support Levels:
- 229.62 (VWAP area)
- 225.71
- 219.68
🎯 Trading Scenarios:
🟢 Bullish: A strong 1H close above 231.79 could open the way toward 236.38.
🔴 Bearish: A breakdown below 229.62 could bring another test of 225.71.
⚠️ My View: Neutral to slightly bullish in the short term, but the overall trend remains bearish until resistance is broken.
Trade carefully. Always use Stop Loss.
#APPBUSDT #BinanceSquare #TechnicalAnalysis #CryptoTrading #TradingSignals #MarketAnalysis
Not financial advice.
$AAPLB #IntelHasItsWorstDaySince1974 #BinanceToResumePhaseOneOfWithdrawals #BinanceUpdatesProofofReservesAddresses
84
·
--
Bullisch
Übersetzung ansehen
$MELIUSDT – 1 Hour Chart Analysis
Short-term bullish bias
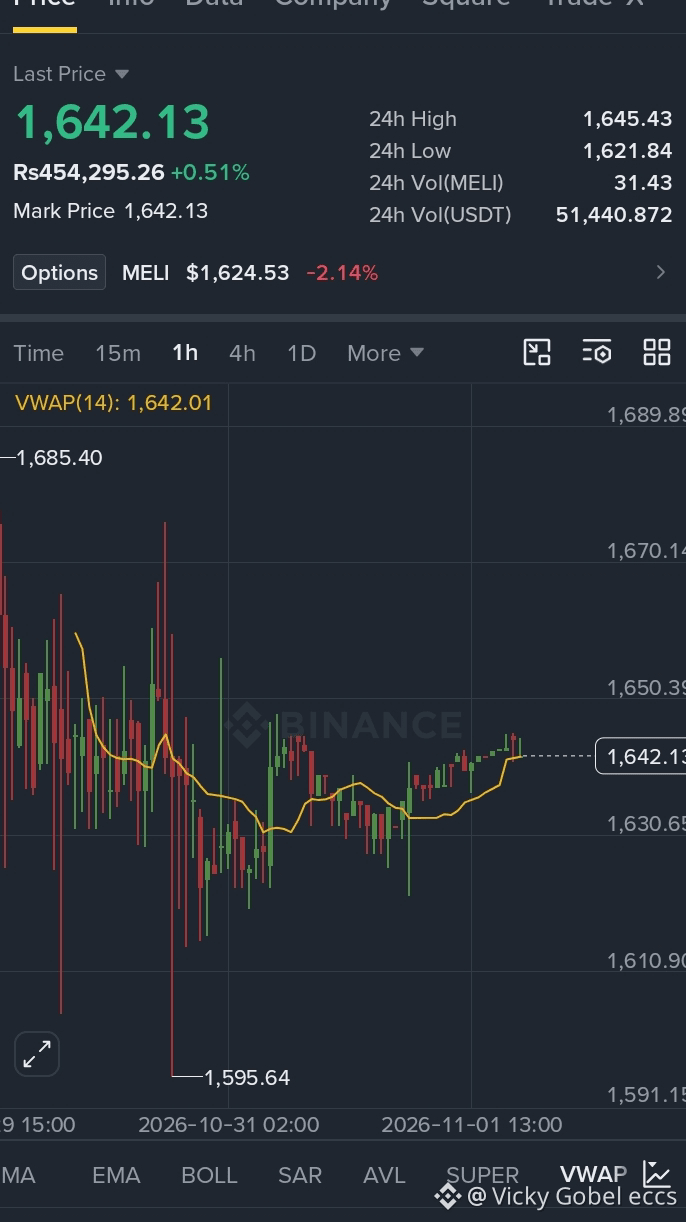
Current price: 1642.13 USDT VWAP: 1642.01
### 1\. Technical analysis
* Price VWAP ke upar hai, bullish signal.
* Recent candles higher lows bana rahi hain.
* Buyers price ko gradually upar push kar rahe hain.
* 1645–1646 par strong resistance nazar aa rahi hai.
### 2\. Important levels
| Level | Price |
| ------------ | ------- |
| Resistance 1 | 1645.50 |
| Resistance 2 | 1650.40 |
| Resistance 3 | 1660 |
| Support 1 | 1640 |
| Support 2 | 1630.65 |
| Support 3 | 1621.84 |
### 3\. Next candle prediction
Bullish possibility
Meri reading ke mutabiq next candle green banne ka chance thora zyada hai, lekin resistance ke paas rejection bhi aa sakti hai.
Trading setup:
* LONG: 1646 ke upar 1H candle close hone par confirmation.
* SHORT: 1640 ke neeche breakdown aur confirmation par.
* Stop-loss zaroor lagana.
Ek baat: Abhi direct entry lene ke bajaye candle close ka wait karna behtar hai. Yeh guaranteed prediction nahi hai.
please trad now
👇
{future}(MELIUSDT)
$MELIUSDT – 1 Hour Chart Analysis
Short-term bullish bias
Current price: 1642.13 USDT VWAP: 1642.01
### 1\. Technical analysis
* Price VWAP ke upar hai, bullish signal.
* Recent candles higher lows bana rahi hain.
* Buyers price ko gradually upar push kar rahe hain.
* 1645–1646 par strong resistance nazar aa rahi hai.
### 2\. Important levels
| Level | Price |
| ------------ | ------- |
| Resistance 1 | 1645.50 |
| Resistance 2 | 1650.40 |
| Resistance 3 | 1660 |
| Support 1 | 1640 |
| Support 2 | 1630.65 |
| Support 3 | 1621.84 |
### 3\. Next candle prediction
Bullish possibility
Meri reading ke mutabiq next candle green banne ka chance thora zyada hai, lekin resistance ke paas rejection bhi aa sakti hai.
Trading setup:
* LONG: 1646 ke upar 1H candle close hone par confirmation.
* SHORT: 1640 ke neeche breakdown aur confirmation par.
* Stop-loss zaroor lagana.
Ek baat: Abhi direct entry lene ke bajaye candle close ka wait karna behtar hai. Yeh guaranteed prediction nahi hai.
please trad now
👇
Short-term bullish bias
Current price: 1642.13 USDT VWAP: 1642.01
### 1\. Technical analysis
* Price VWAP ke upar hai, bullish signal.
* Recent candles higher lows bana rahi hain.
* Buyers price ko gradually upar push kar rahe hain.
* 1645–1646 par strong resistance nazar aa rahi hai.
### 2\. Important levels
| Level | Price |
| ------------ | ------- |
| Resistance 1 | 1645.50 |
| Resistance 2 | 1650.40 |
| Resistance 3 | 1660 |
| Support 1 | 1640 |
| Support 2 | 1630.65 |
| Support 3 | 1621.84 |
### 3\. Next candle prediction
Bullish possibility
Meri reading ke mutabiq next candle green banne ka chance thora zyada hai, lekin resistance ke paas rejection bhi aa sakti hai.
Trading setup:
* LONG: 1646 ke upar 1H candle close hone par confirmation.
* SHORT: 1640 ke neeche breakdown aur confirmation par.
* Stop-loss zaroor lagana.
Ek baat: Abhi direct entry lene ke bajaye candle close ka wait karna behtar hai. Yeh guaranteed prediction nahi hai.
please trad now
👇
57
·
--
Bullisch
{future}(BTCUSDT)
Hier ist eine technische Analyse der bereitgestellten 4-Stunden-Binance-Chart für $BTC/USDT:
📊 Aktuelle Marktstatistiken
* Letzter Preis: $64.038,2 (Rs 17.794.935,02)
* 24h Veränderung: -1,56%
* 24h Hoch: $65.110,1
* 24h Tief: $63.666,0
* 24h Volumen: 114.859,359 BTC / 7,37B USDT
📈 Technische Indikatoren & gleitende Durchschnitte (4H-Chart)
* Gleitende Durchschnitte (MA):
* MA(7): 64.213,0 (Gelb)
* MA(25): 65.345,3 (Pink)
* MA(99): 64.364,1 (Lila)
* Analyse: Der Preis handelt derzeit unter allen drei wichtigen gleitenden Durchschnitten (MA 7, MA 25 und MA 99), was auf eine bärische Dynamik im kurzfristigen bis mittelfristigen Bereich hindeutet. Der kurzfristige MA(7) hat die längerfristigen Durchschnitte nach unten gekreuzt und zeigt damit Abwärtsdruck.
* Supertrend (10, 3):
* Niveau: 65.421,2 (Rote Linie)
* Analyse: Der Indikator ist auf Rot umgeschaltet und liegt oberhalb der aktuellen Preisbewegung; dies bestätigt einen vorherrschenden bärischen Trend im 4-Stunden-Zeitrahmen.
* Unterstützungs- & Widerstandsniveaus:
* Sofortige Unterstützung: $63.666,0 (markiert durch das jüngste 24h-Tief)
* Sofortiger Widerstand: Rund $64.364,1 (MA 99) bis zur Supertrend-Linie bei $65.421,2
📉 Volumenanalyse
* Volumenspitzen sind während der jüngsten starken roten Abwärtskerzen sichtbar, was auf hohen Verkaufsdruck hinweist und die Preise bis nahe an das Niveau von $63.666 nach unten trieb, bevor es zu einer leichten Konsolidierung kam.
$GOOG.US
#SaudiRoutesOilExportsViaSuez #FedSeptHikeOddsJumpToAbout82%
Hier ist eine technische Analyse der bereitgestellten 4-Stunden-Binance-Chart für $BTC/USDT:
📊 Aktuelle Marktstatistiken
* Letzter Preis: $64.038,2 (Rs 17.794.935,02)
* 24h Veränderung: -1,56%
* 24h Hoch: $65.110,1
* 24h Tief: $63.666,0
* 24h Volumen: 114.859,359 BTC / 7,37B USDT
📈 Technische Indikatoren & gleitende Durchschnitte (4H-Chart)
* Gleitende Durchschnitte (MA):
* MA(7): 64.213,0 (Gelb)
* MA(25): 65.345,3 (Pink)
* MA(99): 64.364,1 (Lila)
* Analyse: Der Preis handelt derzeit unter allen drei wichtigen gleitenden Durchschnitten (MA 7, MA 25 und MA 99), was auf eine bärische Dynamik im kurzfristigen bis mittelfristigen Bereich hindeutet. Der kurzfristige MA(7) hat die längerfristigen Durchschnitte nach unten gekreuzt und zeigt damit Abwärtsdruck.
* Supertrend (10, 3):
* Niveau: 65.421,2 (Rote Linie)
* Analyse: Der Indikator ist auf Rot umgeschaltet und liegt oberhalb der aktuellen Preisbewegung; dies bestätigt einen vorherrschenden bärischen Trend im 4-Stunden-Zeitrahmen.
* Unterstützungs- & Widerstandsniveaus:
* Sofortige Unterstützung: $63.666,0 (markiert durch das jüngste 24h-Tief)
* Sofortiger Widerstand: Rund $64.364,1 (MA 99) bis zur Supertrend-Linie bei $65.421,2
📉 Volumenanalyse
* Volumenspitzen sind während der jüngsten starken roten Abwärtskerzen sichtbar, was auf hohen Verkaufsdruck hinweist und die Preise bis nahe an das Niveau von $63.666 nach unten trieb, bevor es zu einer leichten Konsolidierung kam.
$GOOG.US
#SaudiRoutesOilExportsViaSuez #FedSeptHikeOddsJumpToAbout82%
📊 Aktuelle Marktstatistiken
* Letzter Preis: $64.038,2 (Rs 17.794.935,02)
* 24h Veränderung: -1,56%
* 24h Hoch: $65.110,1
* 24h Tief: $63.666,0
* 24h Volumen: 114.859,359 BTC / 7,37B USDT
📈 Technische Indikatoren & gleitende Durchschnitte (4H-Chart)
* Gleitende Durchschnitte (MA):
* MA(7): 64.213,0 (Gelb)
* MA(25): 65.345,3 (Pink)
* MA(99): 64.364,1 (Lila)
* Analyse: Der Preis handelt derzeit unter allen drei wichtigen gleitenden Durchschnitten (MA 7, MA 25 und MA 99), was auf eine bärische Dynamik im kurzfristigen bis mittelfristigen Bereich hindeutet. Der kurzfristige MA(7) hat die längerfristigen Durchschnitte nach unten gekreuzt und zeigt damit Abwärtsdruck.
* Supertrend (10, 3):
* Niveau: 65.421,2 (Rote Linie)
* Analyse: Der Indikator ist auf Rot umgeschaltet und liegt oberhalb der aktuellen Preisbewegung; dies bestätigt einen vorherrschenden bärischen Trend im 4-Stunden-Zeitrahmen.
* Unterstützungs- & Widerstandsniveaus:
* Sofortige Unterstützung: $63.666,0 (markiert durch das jüngste 24h-Tief)
* Sofortiger Widerstand: Rund $64.364,1 (MA 99) bis zur Supertrend-Linie bei $65.421,2
📉 Volumenanalyse
* Volumenspitzen sind während der jüngsten starken roten Abwärtskerzen sichtbar, was auf hohen Verkaufsdruck hinweist und die Preise bis nahe an das Niveau von $63.666 nach unten trieb, bevor es zu einer leichten Konsolidierung kam.
$GOOG.US
#SaudiRoutesOilExportsViaSuez #FedSeptHikeOddsJumpToAbout82%
BTC-0,04%
GOOGLUS+0,91%
77
PK Exklusiv: Lade Freunde ein und teile den $10.000 USDT-Preispool. Außerdem erhalten deine Freunde einen $5 USDT Willkommensbonus https://www.binance.com/activity/trading-competition/pk2026affiliatereferral?ref=1257512286
PK Exklusiv: Lade Freunde ein und teile den $10.000 USDT-Preispool. Außerdem erhalten deine Freunde einen $5 USDT Willkommensbonus https://www.binance.com/activity/trading-competition/pk2026affiliatereferral?ref=1257512286
·
--
Bullisch
HK1810USDT Future Price Szenarien (4-Stunden-Chart-Analyse)
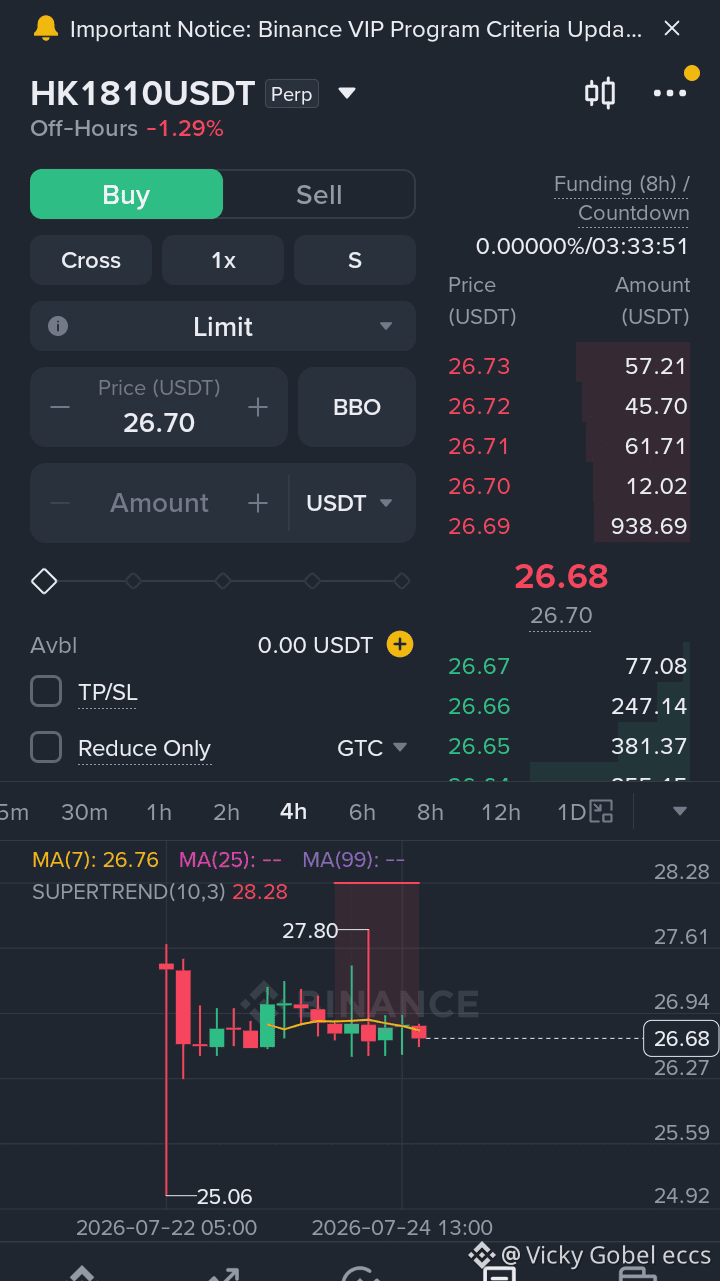
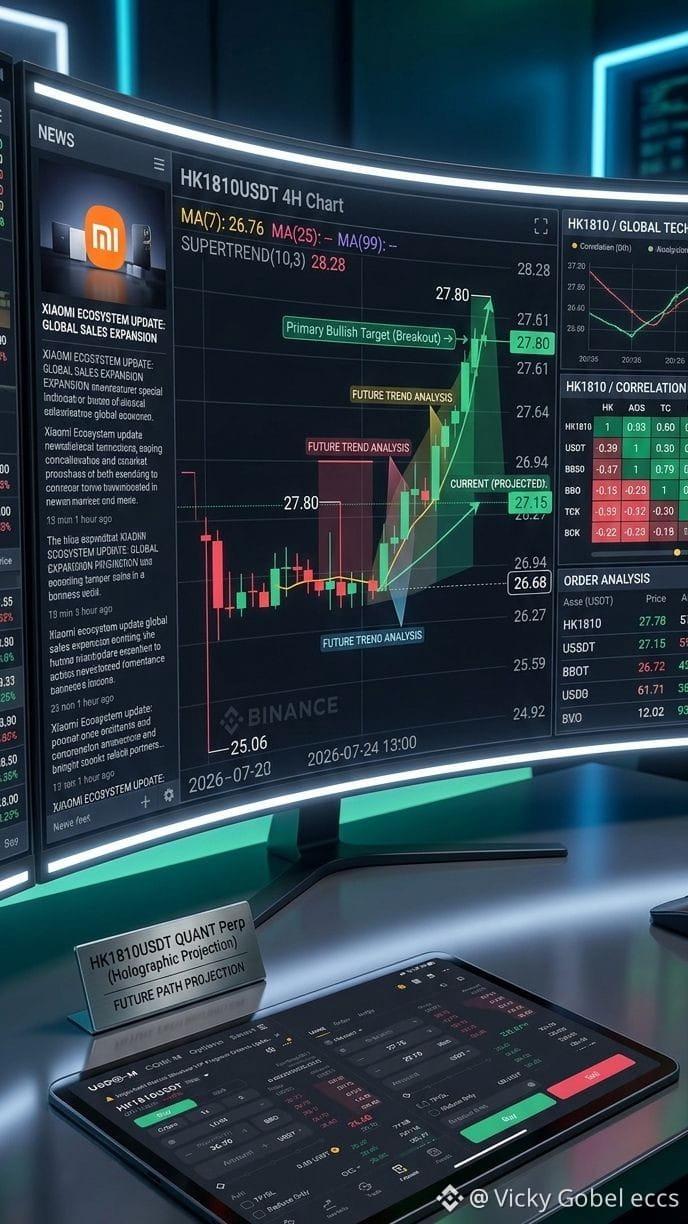
Basierend auf der neuesten Kursentwicklung für HK1810USDT (aktuell bei $26.68 handelnd) folgt hier die detaillierte technische Aufschlüsselung und die zukünftige Einschätzung auf Englisch:
1. Bärisches Szenario (Primärer Pfad - Hohe Wahrscheinlichkeit)
* Marktbedingungen: Der Kurs bleibt unter dem MA(7)-Widerstand ($26.76) gefangen und deutlich unter der roten SuperTrend-Linie ($28.28). Geringes Handelsvolumen während der Off-Hours begünstigt eine Fortsetzung oder weitere Konsolidierung.
* Wichtiger Auslöser: Ein 4-Stunden-Kerzenabschluss unter dem unmittelbaren Support von $26.27.
* Zielniveaus:
* Ziel 1: $25.06 (Jüngstes wichtiges WicK-Tief)
* Ziel 2: $24.50 (Psychologisches Support-Extension)
2. Bullisches Szenario (Sekundärer Pfad - Erleichterungs-Ausbruch)
* Marktbedingungen: Käufer müssen mit starkem Volumen eingreifen, um einen Tages-/4-Stunden-Schluss wieder über den kurzfristigen Widerstand zu erzwingen.
* Wichtiger Auslöser: Ein entschiedener 4-Stunden-Kerzenbruch über $27.00.
* Zielniveaus:
* Ziel 1: $27.80 (Jüngster Swing-Hochpunkt)
* Ziel 2: $28.28 (Wichtiger SuperTrend-Widerstand)
Zusammenfassungstabelle
| Szenario | Trigger-Niveau | Ziel 1 | Ziel 2 | Marktbias |
|---|---|---|---|---|
| Bearish | Bruch unter $26.27 | $25.06 | $24.50 | Stärker |
| Bullish | Bruch über $27.00 | $27.80 | $28.28 | Schwach / Bedingt |
> Handelseinblick: Der sicherste Ansatz ist, abzuwarten, bis der Kurs aus der engen Spanne von $26.27 – $27.00 ausbricht, bevor man einen Trade eingeht.
>
OilTops$100#DowJonesFallsOver500Points
HK1810USDT Future Price Szenarien (4-Stunden-Chart-Analyse)
Basierend auf der neuesten Kursentwicklung für HK1810USDT (aktuell bei $26.68 handelnd) folgt hier die detaillierte technische Aufschlüsselung und die zukünftige Einschätzung auf Englisch:
1. Bärisches Szenario (Primärer Pfad - Hohe Wahrscheinlichkeit)
* Marktbedingungen: Der Kurs bleibt unter dem MA(7)-Widerstand ($26.76) gefangen und deutlich unter der roten SuperTrend-Linie ($28.28). Geringes Handelsvolumen während der Off-Hours begünstigt eine Fortsetzung oder weitere Konsolidierung.
* Wichtiger Auslöser: Ein 4-Stunden-Kerzenabschluss unter dem unmittelbaren Support von $26.27.
* Zielniveaus:
* Ziel 1: $25.06 (Jüngstes wichtiges WicK-Tief)
* Ziel 2: $24.50 (Psychologisches Support-Extension)
2. Bullisches Szenario (Sekundärer Pfad - Erleichterungs-Ausbruch)
* Marktbedingungen: Käufer müssen mit starkem Volumen eingreifen, um einen Tages-/4-Stunden-Schluss wieder über den kurzfristigen Widerstand zu erzwingen.
* Wichtiger Auslöser: Ein entschiedener 4-Stunden-Kerzenbruch über $27.00.
* Zielniveaus:
* Ziel 1: $27.80 (Jüngster Swing-Hochpunkt)
* Ziel 2: $28.28 (Wichtiger SuperTrend-Widerstand)
Zusammenfassungstabelle
| Szenario | Trigger-Niveau | Ziel 1 | Ziel 2 | Marktbias |
|---|---|---|---|---|
| Bearish | Bruch unter $26.27 | $25.06 | $24.50 | Stärker |
| Bullish | Bruch über $27.00 | $27.80 | $28.28 | Schwach / Bedingt |
> Handelseinblick: Der sicherste Ansatz ist, abzuwarten, bis der Kurs aus der engen Spanne von $26.27 – $27.00 ausbricht, bevor man einen Trade eingeht.
>
OilTops$100#DowJonesFallsOver500Points
Basierend auf der neuesten Kursentwicklung für HK1810USDT (aktuell bei $26.68 handelnd) folgt hier die detaillierte technische Aufschlüsselung und die zukünftige Einschätzung auf Englisch:
1. Bärisches Szenario (Primärer Pfad - Hohe Wahrscheinlichkeit)
* Marktbedingungen: Der Kurs bleibt unter dem MA(7)-Widerstand ($26.76) gefangen und deutlich unter der roten SuperTrend-Linie ($28.28). Geringes Handelsvolumen während der Off-Hours begünstigt eine Fortsetzung oder weitere Konsolidierung.
* Wichtiger Auslöser: Ein 4-Stunden-Kerzenabschluss unter dem unmittelbaren Support von $26.27.
* Zielniveaus:
* Ziel 1: $25.06 (Jüngstes wichtiges WicK-Tief)
* Ziel 2: $24.50 (Psychologisches Support-Extension)
2. Bullisches Szenario (Sekundärer Pfad - Erleichterungs-Ausbruch)
* Marktbedingungen: Käufer müssen mit starkem Volumen eingreifen, um einen Tages-/4-Stunden-Schluss wieder über den kurzfristigen Widerstand zu erzwingen.
* Wichtiger Auslöser: Ein entschiedener 4-Stunden-Kerzenbruch über $27.00.
* Zielniveaus:
* Ziel 1: $27.80 (Jüngster Swing-Hochpunkt)
* Ziel 2: $28.28 (Wichtiger SuperTrend-Widerstand)
Zusammenfassungstabelle
| Szenario | Trigger-Niveau | Ziel 1 | Ziel 2 | Marktbias |
|---|---|---|---|---|
| Bearish | Bruch unter $26.27 | $25.06 | $24.50 | Stärker |
| Bullish | Bruch über $27.00 | $27.80 | $28.28 | Schwach / Bedingt |
> Handelseinblick: Der sicherste Ansatz ist, abzuwarten, bis der Kurs aus der engen Spanne von $26.27 – $27.00 ausbricht, bevor man einen Trade eingeht.
>
OilTops$100#DowJonesFallsOver500Points
1
494
{future}(TENCENTUSDT)
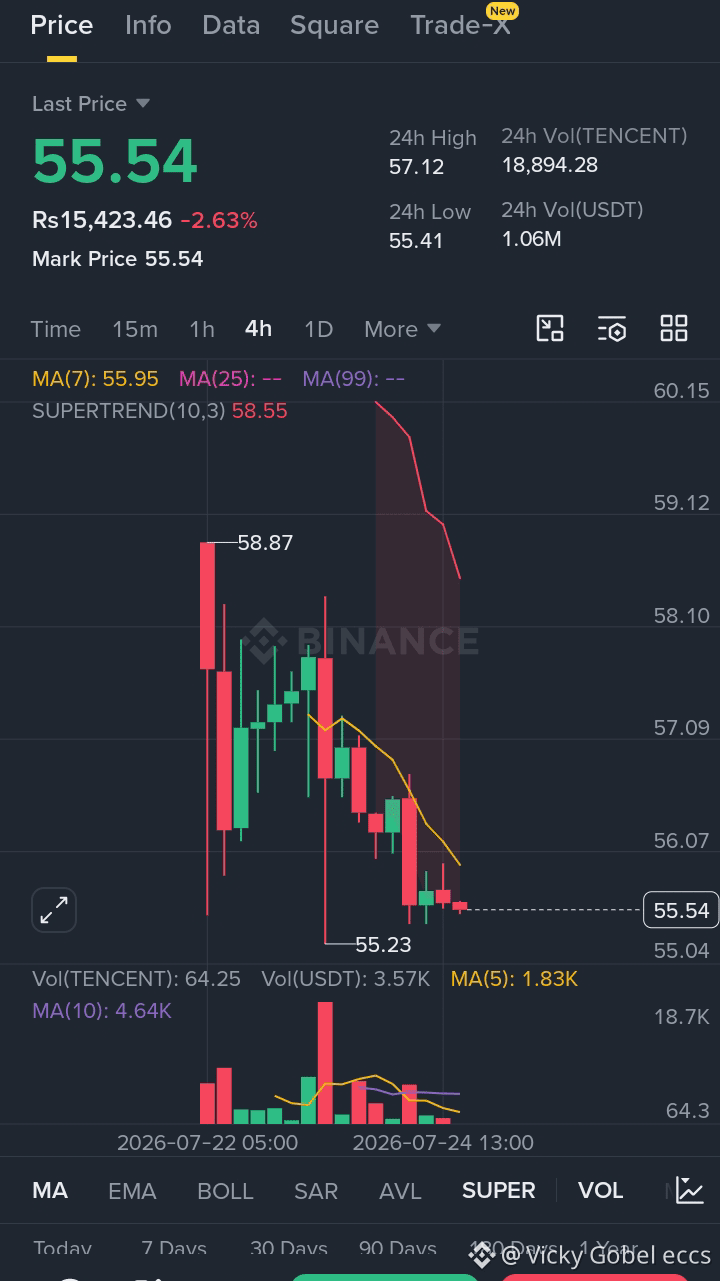
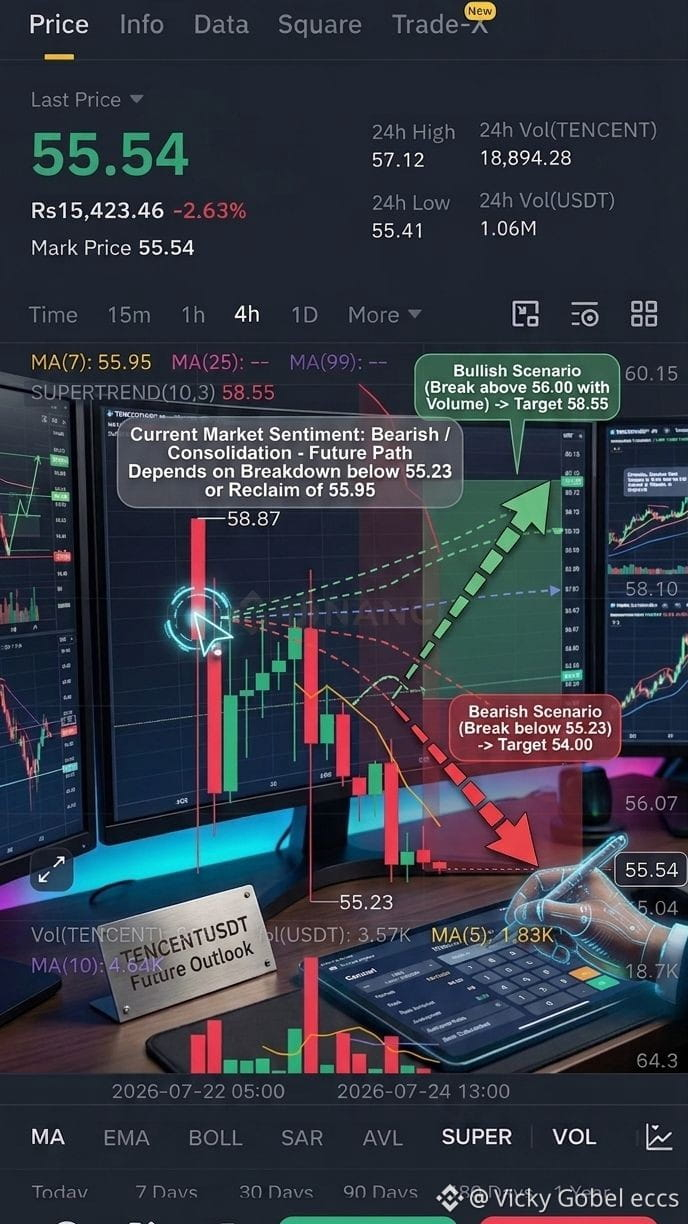
$TENCENTUSDT Future-Ausblick (Kurzfristige Techniken)
Laut Chart-Signalen und Price Action könnten die nächsten Moves so aussehen:
1. Bärische Fortsetzung (Abwärtsbewegung)
* Bedingung: Der Gesamttrend ist derzeit bärisch, da der Preis unter MA(7) ($55,95) und dem SuperTrend ($58,55) liegt.
* Breakdown-Level: Wenn eine 4-Stunden-Kerze unter $55,23 (jüngste Tief-unterstützung) schließt, könnten Verkäufer starken Druck aufbauen.
* Zielniveaus: $54,50 – $53,80
2. Bärisches Entlastungs-Rallye (Aufwärtsbewegung)
* Bedingung: Käufer müssen die MA(7)-Linie mit starkem Volumen kreuzen, um eine Umkehr einzuleiten.
* Ausbruch-Level: Ein Schluss einer 4-Stunden-Kerze über $56,00 ist erforderlich.
* Zielniveaus:
* Erstes Ziel: $57,12 (24h-Hoch)
* Bedeutender Widerstand: $58,55 (SuperTrend-Rotzone)
Zusammenfassung
> Aktuelle Marktstimmung: Bärisch / Konsolidierung
> Solange der Preis nicht über $56,00 ausbricht, ist die Wahrscheinlichkeit höher, dass Verkäufer dominieren. Achten Sie im kurzfristigen Trading besonders auf die wichtige Unterstützungszone bei $55,23.
>
#WTIUp6.17%BrentUp7.04% OilTops$100
$TENCENTUSDT Future-Ausblick (Kurzfristige Techniken)
Laut Chart-Signalen und Price Action könnten die nächsten Moves so aussehen:
1. Bärische Fortsetzung (Abwärtsbewegung)
* Bedingung: Der Gesamttrend ist derzeit bärisch, da der Preis unter MA(7) ($55,95) und dem SuperTrend ($58,55) liegt.
* Breakdown-Level: Wenn eine 4-Stunden-Kerze unter $55,23 (jüngste Tief-unterstützung) schließt, könnten Verkäufer starken Druck aufbauen.
* Zielniveaus: $54,50 – $53,80
2. Bärisches Entlastungs-Rallye (Aufwärtsbewegung)
* Bedingung: Käufer müssen die MA(7)-Linie mit starkem Volumen kreuzen, um eine Umkehr einzuleiten.
* Ausbruch-Level: Ein Schluss einer 4-Stunden-Kerze über $56,00 ist erforderlich.
* Zielniveaus:
* Erstes Ziel: $57,12 (24h-Hoch)
* Bedeutender Widerstand: $58,55 (SuperTrend-Rotzone)
Zusammenfassung
> Aktuelle Marktstimmung: Bärisch / Konsolidierung
> Solange der Preis nicht über $56,00 ausbricht, ist die Wahrscheinlichkeit höher, dass Verkäufer dominieren. Achten Sie im kurzfristigen Trading besonders auf die wichtige Unterstützungszone bei $55,23.
>
#WTIUp6.17%BrentUp7.04% OilTops$100
Laut Chart-Signalen und Price Action könnten die nächsten Moves so aussehen:
1. Bärische Fortsetzung (Abwärtsbewegung)
* Bedingung: Der Gesamttrend ist derzeit bärisch, da der Preis unter MA(7) ($55,95) und dem SuperTrend ($58,55) liegt.
* Breakdown-Level: Wenn eine 4-Stunden-Kerze unter $55,23 (jüngste Tief-unterstützung) schließt, könnten Verkäufer starken Druck aufbauen.
* Zielniveaus: $54,50 – $53,80
2. Bärisches Entlastungs-Rallye (Aufwärtsbewegung)
* Bedingung: Käufer müssen die MA(7)-Linie mit starkem Volumen kreuzen, um eine Umkehr einzuleiten.
* Ausbruch-Level: Ein Schluss einer 4-Stunden-Kerze über $56,00 ist erforderlich.
* Zielniveaus:
* Erstes Ziel: $57,12 (24h-Hoch)
* Bedeutender Widerstand: $58,55 (SuperTrend-Rotzone)
Zusammenfassung
> Aktuelle Marktstimmung: Bärisch / Konsolidierung
> Solange der Preis nicht über $56,00 ausbricht, ist die Wahrscheinlichkeit höher, dass Verkäufer dominieren. Achten Sie im kurzfristigen Trading besonders auf die wichtige Unterstützungszone bei $55,23.
>
#WTIUp6.17%BrentUp7.04% OilTops$100
42
·
--
Bullisch
{future}(POPMARTUSDT)
Hier ist eine detaillierte Aufschlüsselung und technische Analyse des bereitgestellten $POPMARTUSDT-Perpetual-Futures-Charts (auf Englisch):
📊 Überblick zum Bild
* Handels-Paar: $POPMARTUSDT (Perpetual Futures)
* Aktueller Preis: 20.55 $USDT (Abwärts -1.91%)
* 24h Hoch / Tief: 21.04 / 20.20
* Zeiteinheit: 4-Stunden (4h)
* Marktstatus: Außerbörslich (zeigt eine reduzierte Handelsaktivität oder eine übliche Marktschließung an)
📈 Technische Aufschlüsselung
1. Wichtige Preisniveaus
* Unmittelbarer Widerstand: 20.68 - 21.18 USDT
* Der Moving Average (MA 7) liegt bei 20.68 und wirkt als direkter kurzfristiger Widerstand nach oben.
* Die starke Abweisung bei 21.18 markiert eine kritische Widerstandszone, die Käufer überwinden müssen.
* Wichtiges Support-Niveau: 20.20 USDT
* Der Preis fiel zweimal auf 20.20 und zeigte anschließend einen kleinen Bounce, wodurch 20.20 der entscheidende kurzfristige Support darstellt.
2. Indikatoren & Volumen
* Trendindikator: Der Kurs handelt unter dem kurzfristigen gleitenden Durchschnitt (MA(7) = 20.68), was auf eine kurzfristig bärische / seitwärts gerichtete Tendenz hindeutet.
* Volumen: Das Volumen ist während der starken roten Kerzen deutlich angestiegen und hat sich seitdem wieder abgeschwächt; das zeigt eine geringere Dynamik während dieses leichten Rücksetzers.
🔮 Mögliche Szenarien & Marktausblick
🔴 Bärisches Szenario (Wenn der Support bricht)
* Wenn der Preis es nicht schafft, oberhalb von 20.20 $USDT zu halten, könnte ein Breakdown unter diese Unterstützung weiteres Abwärtsmomentum hin zu niedrigeren psychologischen Marken auslösen (z. B. 20.00 $USDT oder niedriger).
🟢 Bullisches Szenario (Wenn der Widerstand zurückerobert wird)
* Um den kurzfristigen Abwärtstrend zu drehen, müssen Käufer den Kurs über 20.68 $USDT (MA 7) drücken und 21.00 $USDT mit starkem Volumen überwinden. Das Zurückholen von 21.18 $USDT würde eine bullische Fortsetzung bestätigen.
> ⚠️ Hinweis zum Handelsrisiko: Der Markt ist derzeit als Außerbörslich markiert, was zu geringerer Liquidität, höherem Slippage oder plötzlichen Kurslücken führen kann, wenn das reguläre Handelsvolumen wieder einsetzt. Verwende stets einen strikten Stop-Loss und gehe verantwortungsvoll mit deinem Leverage um.
>
#KRXActivatesSellSideSidecar
Hier ist eine detaillierte Aufschlüsselung und technische Analyse des bereitgestellten $POPMARTUSDT-Perpetual-Futures-Charts (auf Englisch):
📊 Überblick zum Bild
* Handels-Paar: $POPMARTUSDT (Perpetual Futures)
* Aktueller Preis: 20.55 $USDT (Abwärts -1.91%)
* 24h Hoch / Tief: 21.04 / 20.20
* Zeiteinheit: 4-Stunden (4h)
* Marktstatus: Außerbörslich (zeigt eine reduzierte Handelsaktivität oder eine übliche Marktschließung an)
📈 Technische Aufschlüsselung
1. Wichtige Preisniveaus
* Unmittelbarer Widerstand: 20.68 - 21.18 USDT
* Der Moving Average (MA 7) liegt bei 20.68 und wirkt als direkter kurzfristiger Widerstand nach oben.
* Die starke Abweisung bei 21.18 markiert eine kritische Widerstandszone, die Käufer überwinden müssen.
* Wichtiges Support-Niveau: 20.20 USDT
* Der Preis fiel zweimal auf 20.20 und zeigte anschließend einen kleinen Bounce, wodurch 20.20 der entscheidende kurzfristige Support darstellt.
2. Indikatoren & Volumen
* Trendindikator: Der Kurs handelt unter dem kurzfristigen gleitenden Durchschnitt (MA(7) = 20.68), was auf eine kurzfristig bärische / seitwärts gerichtete Tendenz hindeutet.
* Volumen: Das Volumen ist während der starken roten Kerzen deutlich angestiegen und hat sich seitdem wieder abgeschwächt; das zeigt eine geringere Dynamik während dieses leichten Rücksetzers.
🔮 Mögliche Szenarien & Marktausblick
🔴 Bärisches Szenario (Wenn der Support bricht)
* Wenn der Preis es nicht schafft, oberhalb von 20.20 $USDT zu halten, könnte ein Breakdown unter diese Unterstützung weiteres Abwärtsmomentum hin zu niedrigeren psychologischen Marken auslösen (z. B. 20.00 $USDT oder niedriger).
🟢 Bullisches Szenario (Wenn der Widerstand zurückerobert wird)
* Um den kurzfristigen Abwärtstrend zu drehen, müssen Käufer den Kurs über 20.68 $USDT (MA 7) drücken und 21.00 $USDT mit starkem Volumen überwinden. Das Zurückholen von 21.18 $USDT würde eine bullische Fortsetzung bestätigen.
> ⚠️ Hinweis zum Handelsrisiko: Der Markt ist derzeit als Außerbörslich markiert, was zu geringerer Liquidität, höherem Slippage oder plötzlichen Kurslücken führen kann, wenn das reguläre Handelsvolumen wieder einsetzt. Verwende stets einen strikten Stop-Loss und gehe verantwortungsvoll mit deinem Leverage um.
>
#KRXActivatesSellSideSidecar
📊 Überblick zum Bild
* Handels-Paar: $POPMARTUSDT (Perpetual Futures)
* Aktueller Preis: 20.55 $USDT (Abwärts -1.91%)
* 24h Hoch / Tief: 21.04 / 20.20
* Zeiteinheit: 4-Stunden (4h)
* Marktstatus: Außerbörslich (zeigt eine reduzierte Handelsaktivität oder eine übliche Marktschließung an)
📈 Technische Aufschlüsselung
1. Wichtige Preisniveaus
* Unmittelbarer Widerstand: 20.68 - 21.18 USDT
* Der Moving Average (MA 7) liegt bei 20.68 und wirkt als direkter kurzfristiger Widerstand nach oben.
* Die starke Abweisung bei 21.18 markiert eine kritische Widerstandszone, die Käufer überwinden müssen.
* Wichtiges Support-Niveau: 20.20 USDT
* Der Preis fiel zweimal auf 20.20 und zeigte anschließend einen kleinen Bounce, wodurch 20.20 der entscheidende kurzfristige Support darstellt.
2. Indikatoren & Volumen
* Trendindikator: Der Kurs handelt unter dem kurzfristigen gleitenden Durchschnitt (MA(7) = 20.68), was auf eine kurzfristig bärische / seitwärts gerichtete Tendenz hindeutet.
* Volumen: Das Volumen ist während der starken roten Kerzen deutlich angestiegen und hat sich seitdem wieder abgeschwächt; das zeigt eine geringere Dynamik während dieses leichten Rücksetzers.
🔮 Mögliche Szenarien & Marktausblick
🔴 Bärisches Szenario (Wenn der Support bricht)
* Wenn der Preis es nicht schafft, oberhalb von 20.20 $USDT zu halten, könnte ein Breakdown unter diese Unterstützung weiteres Abwärtsmomentum hin zu niedrigeren psychologischen Marken auslösen (z. B. 20.00 $USDT oder niedriger).
🟢 Bullisches Szenario (Wenn der Widerstand zurückerobert wird)
* Um den kurzfristigen Abwärtstrend zu drehen, müssen Käufer den Kurs über 20.68 $USDT (MA 7) drücken und 21.00 $USDT mit starkem Volumen überwinden. Das Zurückholen von 21.18 $USDT würde eine bullische Fortsetzung bestätigen.
> ⚠️ Hinweis zum Handelsrisiko: Der Markt ist derzeit als Außerbörslich markiert, was zu geringerer Liquidität, höherem Slippage oder plötzlichen Kurslücken führen kann, wenn das reguläre Handelsvolumen wieder einsetzt. Verwende stets einen strikten Stop-Loss und gehe verantwortungsvoll mit deinem Leverage um.
>
#KRXActivatesSellSideSidecar
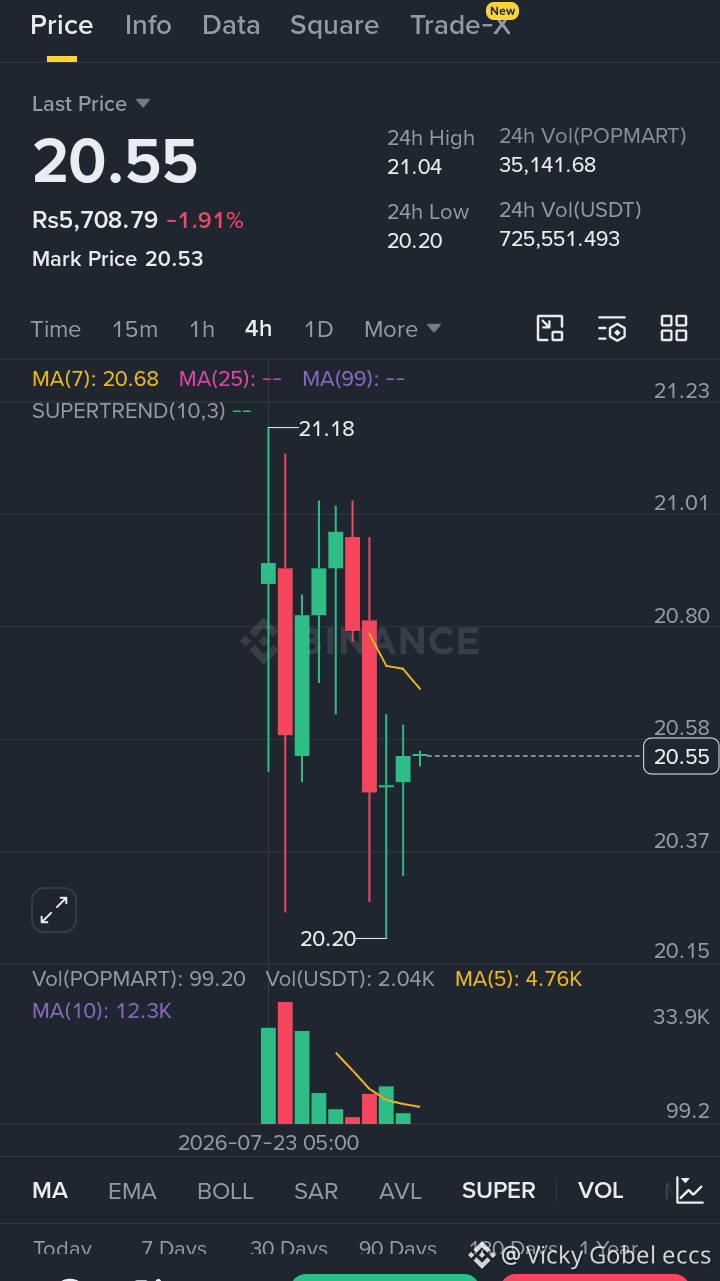
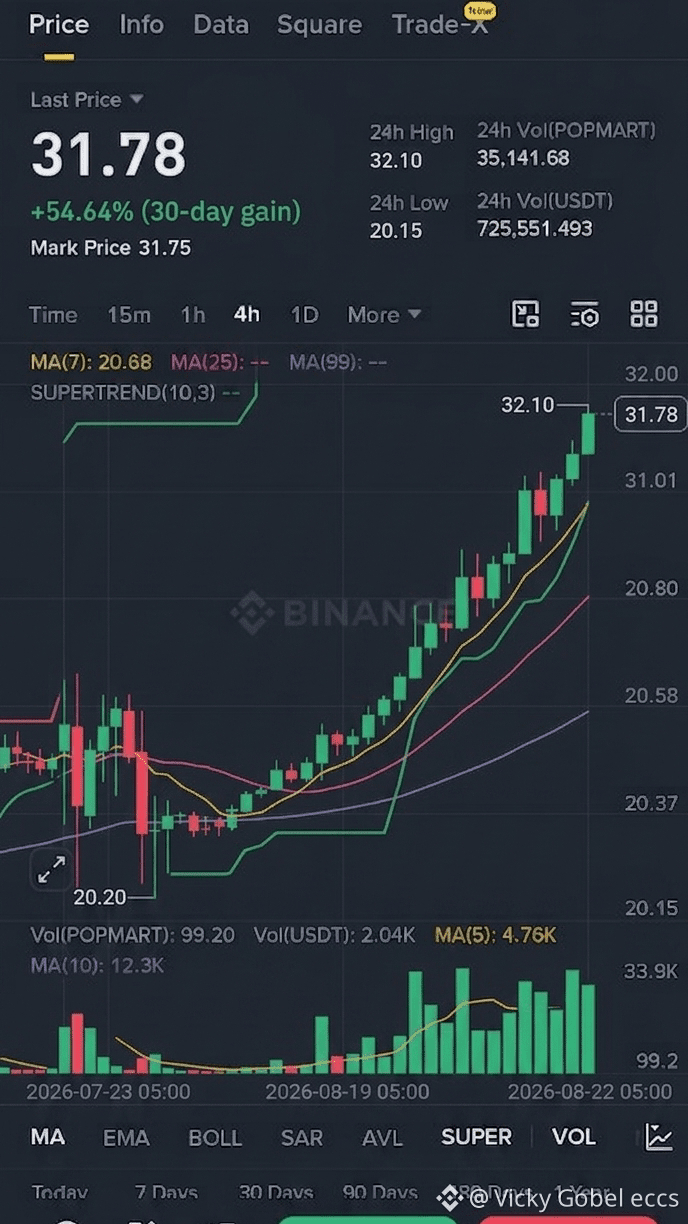
115
·
--
Bullisch
#KRXActivatesSellSideSidecar
$SKYNIUSDT
Der Preis fällt aktuell im Chart, und der Indikator (Supertrend) zeigt rot an, was darauf hindeutet, dass der Preis möglicherweise noch weiter fallen könnte. Das vorherige Niveau um $164.75 könnte als wichtiger Support dienen.
{future}(SKHYNIXUSDT)
#KRXActivatesSellSideSidecar
$SKYNIUSDT
Der Preis fällt aktuell im Chart, und der Indikator (Supertrend) zeigt rot an, was darauf hindeutet, dass der Preis möglicherweise noch weiter fallen könnte. Das vorherige Niveau um $164.75 könnte als wichtiger Support dienen.
$SKYNIUSDT
Der Preis fällt aktuell im Chart, und der Indikator (Supertrend) zeigt rot an, was darauf hindeutet, dass der Preis möglicherweise noch weiter fallen könnte. Das vorherige Niveau um $164.75 könnte als wichtiger Support dienen.
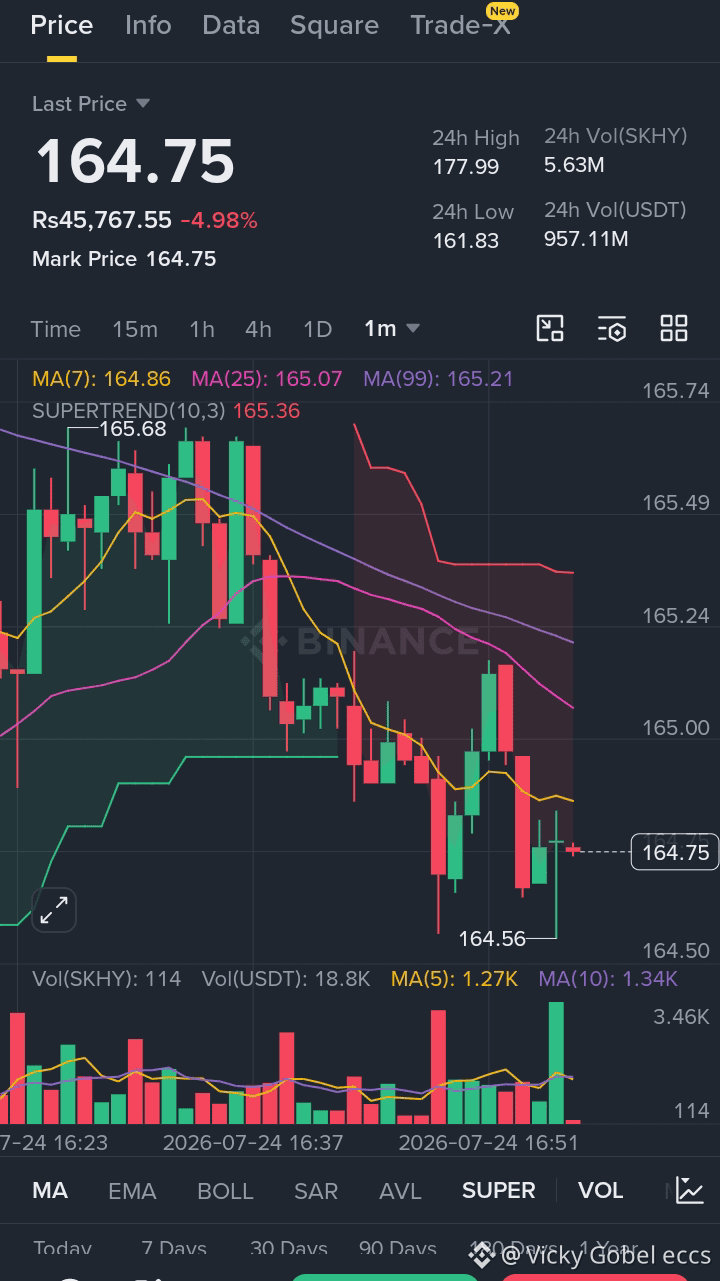
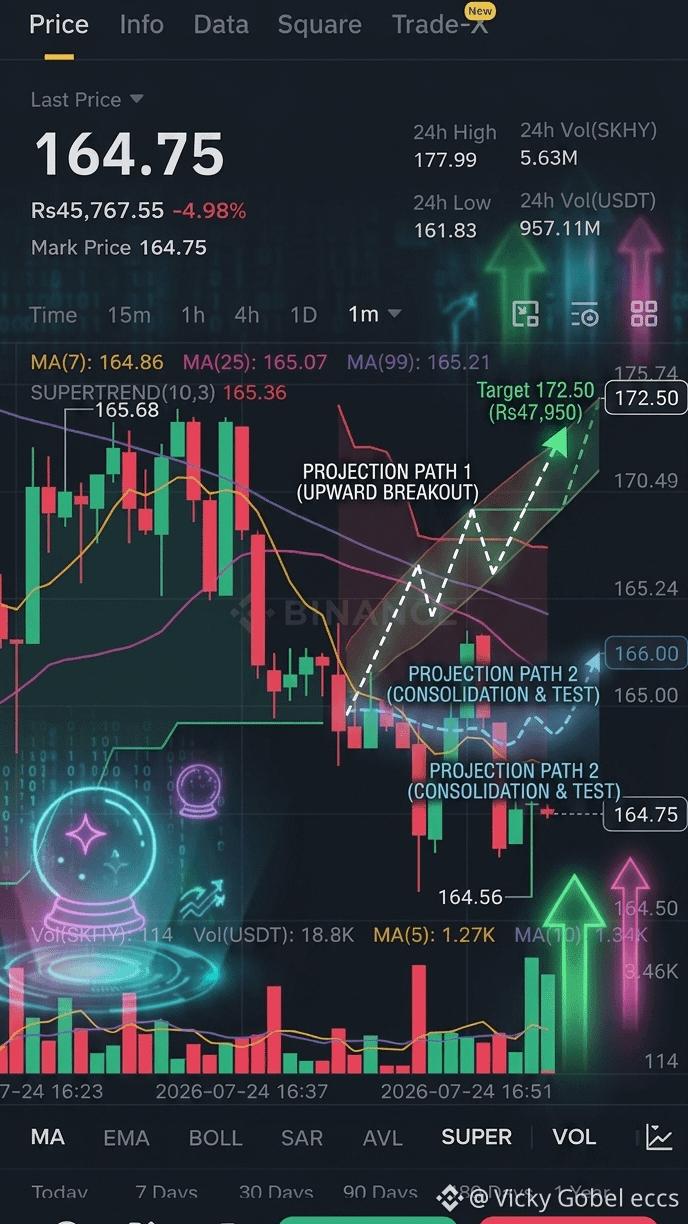
72
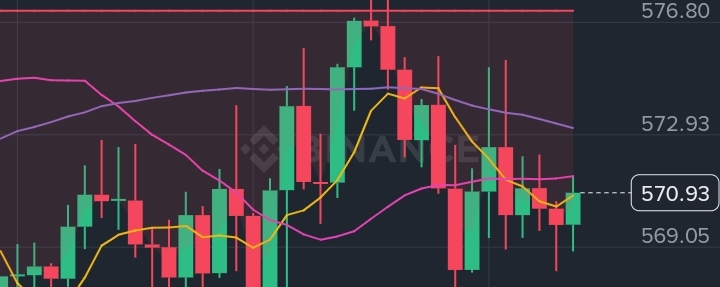
Artikel
$BNB Future-Analyse 📥Umfassender Marktartikel: BNB/USDT-Analyse & Ausblick
Einführung
Binance Coin (BNB) befindet sich derzeit in einer entscheidenden Konsolidierungsphase, während sich die breiteren Kryptowährungsmärkte stabilisieren. Bei einem Kurs um 570,94 $ bleibt BNB in engen technischen Grenzen auf niedrigeren Zeitrahmen eingeschlossen, während die Marktteilnehmer sowohl die kurzfristige Preisentwicklung als auch die langfristige Entwicklung des Ökosystems abwägen.
Technischer Überblick (4-Stunden-Zeitrahmen)
Im 4-Stunden-Chart zeigt BNB eine ausgewogene, jedoch vorsichtige Ausgangslage:
*Gleitende Durchschnitte: Der Preis pendelt direkt am MA(7) bei 570,83 $ und liegt knapp unter dem MA(25) bei 571,50 $. Der langfristige MA(99) liegt bei 573,16 $ und bildet dadurch eine lokalisierte Schicht dynamischen Widerstands oberhalb der aktuellen Kurse.
$BNB Future-Analyse 📥
Umfassender Marktartikel: BNB/USDT-Analyse & Ausblick
Einführung
Binance Coin (BNB) befindet sich derzeit in einer entscheidenden Konsolidierungsphase, während sich die breiteren Kryptowährungsmärkte stabilisieren. Bei einem Kurs um 570,94 $ bleibt BNB in engen technischen Grenzen auf niedrigeren Zeitrahmen eingeschlossen, während die Marktteilnehmer sowohl die kurzfristige Preisentwicklung als auch die langfristige Entwicklung des Ökosystems abwägen.
Technischer Überblick (4-Stunden-Zeitrahmen)
Im 4-Stunden-Chart zeigt BNB eine ausgewogene, jedoch vorsichtige Ausgangslage:
*Gleitende Durchschnitte: Der Preis pendelt direkt am MA(7) bei 570,83 $ und liegt knapp unter dem MA(25) bei 571,50 $. Der langfristige MA(99) liegt bei 573,16 $ und bildet dadurch eine lokalisierte Schicht dynamischen Widerstands oberhalb der aktuellen Kurse.
Einführung
Binance Coin (BNB) befindet sich derzeit in einer entscheidenden Konsolidierungsphase, während sich die breiteren Kryptowährungsmärkte stabilisieren. Bei einem Kurs um 570,94 $ bleibt BNB in engen technischen Grenzen auf niedrigeren Zeitrahmen eingeschlossen, während die Marktteilnehmer sowohl die kurzfristige Preisentwicklung als auch die langfristige Entwicklung des Ökosystems abwägen.
Technischer Überblick (4-Stunden-Zeitrahmen)
Im 4-Stunden-Chart zeigt BNB eine ausgewogene, jedoch vorsichtige Ausgangslage:
*Gleitende Durchschnitte: Der Preis pendelt direkt am MA(7) bei 570,83 $ und liegt knapp unter dem MA(25) bei 571,50 $. Der langfristige MA(99) liegt bei 573,16 $ und bildet dadurch eine lokalisierte Schicht dynamischen Widerstands oberhalb der aktuellen Kurse.
8
#CrudeOilFuturesRiseOver4%
Hier ist die technische Zusammenfassung für das $XRP/USDT 4-Stunden-Chart:
📊 Zusammenfassung $(XRP bei $1.1341)
* Aktueller Trend: Konsolidiert / kurzfristig leicht schwach. Der Kurs handelt aktuell knapp unter dem kurzfristigen gleitenden Durchschnitt (MA7 bei $1.1387), bleibt jedoch sicher über wichtigen Unterstützungen auf mittlerer und langer Sicht (MA25 bei $1.1247 und MA99 bei $1.1045). Der Supertrend-Indikator bleibt bullisch und grün bei $1.1141.
* Wichtiger Widerstand (oben): $1.1387 (MA7) und $1.1646 (jüngstes lokales Hoch).
* Wichtige Unterstützung (Boden): $1.1247 (MA25) und $1.1141 (Supertrend-Unterstützungslinie).
🔮 Was passiert als Nächstes?
* 📈 Wenn es $1.1387 zurückerobert: Erwarten Sie, dass Käufer $XRP zurück Richtung $1.1574 drücken und das Hoch bei $1.1646 erneut testen.
* 📉 Wenn es unter $1.1247 fällt: Erwarten Sie einen kleinen Rücksetzer in Richtung der wichtigen Unterstützung um $1.1140 – $1.1045.
> 💡 Fazit:$ XRP zieht sich nach einem ordentlichen Anstieg leicht zurück. Solange es über $1.1247 hält, bleibt die Gesamtstruktur in diesem Zeitrahmen bullisch.
>
#SenateReleasesUpdatedCLARITYActText
#CrudeOilFuturesRiseOver4%
Hier ist die technische Zusammenfassung für das $XRP/USDT 4-Stunden-Chart:
📊 Zusammenfassung $(XRP bei $1.1341)
* Aktueller Trend: Konsolidiert / kurzfristig leicht schwach. Der Kurs handelt aktuell knapp unter dem kurzfristigen gleitenden Durchschnitt (MA7 bei $1.1387), bleibt jedoch sicher über wichtigen Unterstützungen auf mittlerer und langer Sicht (MA25 bei $1.1247 und MA99 bei $1.1045). Der Supertrend-Indikator bleibt bullisch und grün bei $1.1141.
* Wichtiger Widerstand (oben): $1.1387 (MA7) und $1.1646 (jüngstes lokales Hoch).
* Wichtige Unterstützung (Boden): $1.1247 (MA25) und $1.1141 (Supertrend-Unterstützungslinie).
🔮 Was passiert als Nächstes?
* 📈 Wenn es $1.1387 zurückerobert: Erwarten Sie, dass Käufer $XRP zurück Richtung $1.1574 drücken und das Hoch bei $1.1646 erneut testen.
* 📉 Wenn es unter $1.1247 fällt: Erwarten Sie einen kleinen Rücksetzer in Richtung der wichtigen Unterstützung um $1.1140 – $1.1045.
> 💡 Fazit:$ XRP zieht sich nach einem ordentlichen Anstieg leicht zurück. Solange es über $1.1247 hält, bleibt die Gesamtstruktur in diesem Zeitrahmen bullisch.
>
#SenateReleasesUpdatedCLARITYActText
Hier ist die technische Zusammenfassung für das $XRP/USDT 4-Stunden-Chart:
📊 Zusammenfassung $(XRP bei $1.1341)
* Aktueller Trend: Konsolidiert / kurzfristig leicht schwach. Der Kurs handelt aktuell knapp unter dem kurzfristigen gleitenden Durchschnitt (MA7 bei $1.1387), bleibt jedoch sicher über wichtigen Unterstützungen auf mittlerer und langer Sicht (MA25 bei $1.1247 und MA99 bei $1.1045). Der Supertrend-Indikator bleibt bullisch und grün bei $1.1141.
* Wichtiger Widerstand (oben): $1.1387 (MA7) und $1.1646 (jüngstes lokales Hoch).
* Wichtige Unterstützung (Boden): $1.1247 (MA25) und $1.1141 (Supertrend-Unterstützungslinie).
🔮 Was passiert als Nächstes?
* 📈 Wenn es $1.1387 zurückerobert: Erwarten Sie, dass Käufer $XRP zurück Richtung $1.1574 drücken und das Hoch bei $1.1646 erneut testen.
* 📉 Wenn es unter $1.1247 fällt: Erwarten Sie einen kleinen Rücksetzer in Richtung der wichtigen Unterstützung um $1.1140 – $1.1045.
> 💡 Fazit:$ XRP zieht sich nach einem ordentlichen Anstieg leicht zurück. Solange es über $1.1247 hält, bleibt die Gesamtstruktur in diesem Zeitrahmen bullisch.
>
#SenateReleasesUpdatedCLARITYActText
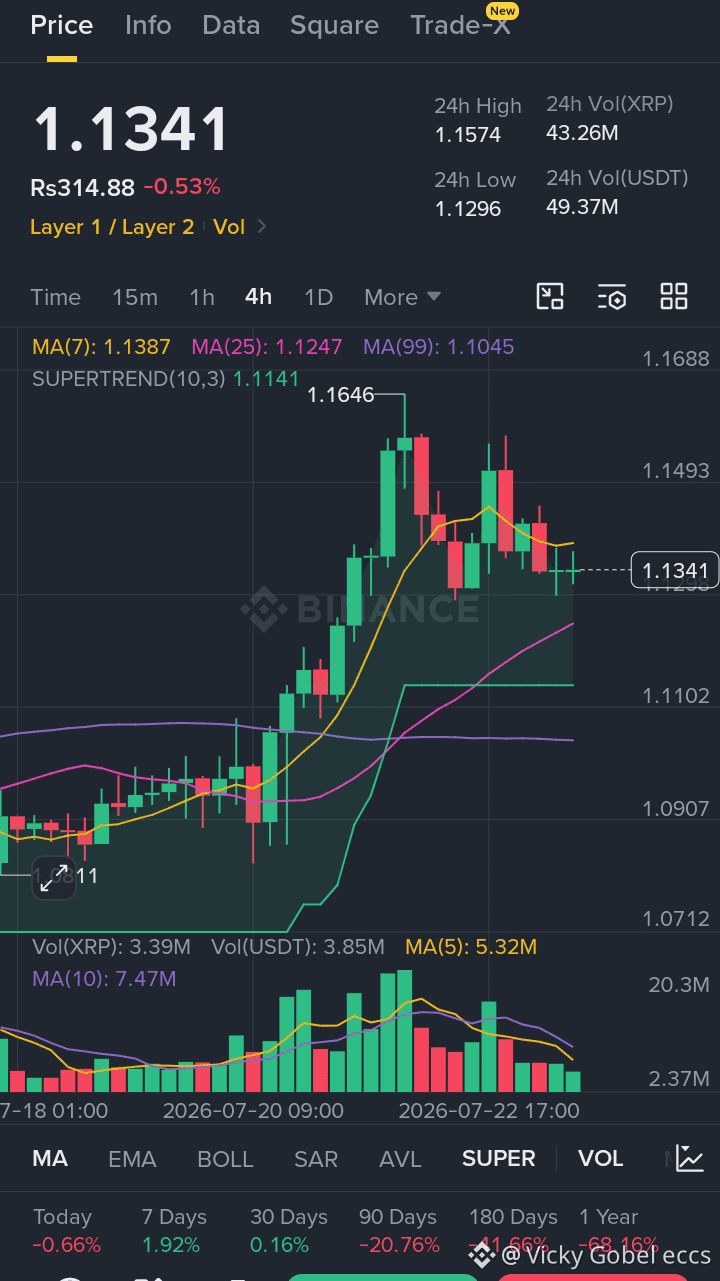
70
#SuperMicroRisesNearly20%
Hier ist die technische Zusammenfassung für das $SOL/USDT 4-Stunden-Chart:
📊 Zusammenfassung $(SOL bei $77.79)
* Aktueller Trend: Konsolidierend / Neutral-Bullisch. Der Kurs handelt leicht oberhalb aller wichtigen gleitenden Durchschnitte: MA7 ($77.74), MA25 ($77.45) und MA99 ($77.25). Die grüne Supertrend-Linie liegt tiefer bei $75.55 und bestätigt damit eine insgesamt bullische Tendenz in diesem 4h-Chart.
* Wichtigster Widerstand (Oben): $78.88 (Letztes Hoch) und $79.16.
* Wichtigste Unterstützung (Unten): $77.25 – $77.45 (Cluster der gleitenden Durchschnitte) und $75.55 (Supertrend-Unterstützung).
🔮 Was passiert als Nächstes?
* 📈 Wenn es über $78.88 ausbricht: Dann ist zu erwarten, dass die Bullen $SOL in Richtung $80.00 – $81.50 drücken.
* 📉 Wenn es unter $77.25 fällt: Der Kurs wird wahrscheinlich zurückkommen, um eine starke Unterstützung um $75.55 zu testen.
> 💡 Fazit: $SOL hält sich über seinem Cluster an gleitenden- Durchschnitts-Unterstützungen. Solange es über $77.25 bleibt, spricht das kurzfristige Setup für einen erneuten Test des $78.88-Hochs.
>
#SenateReleasesUpdatedCLARITYActText
#SuperMicroRisesNearly20%
Hier ist die technische Zusammenfassung für das $SOL/USDT 4-Stunden-Chart:
📊 Zusammenfassung $(SOL bei $77.79)
* Aktueller Trend: Konsolidierend / Neutral-Bullisch. Der Kurs handelt leicht oberhalb aller wichtigen gleitenden Durchschnitte: MA7 ($77.74), MA25 ($77.45) und MA99 ($77.25). Die grüne Supertrend-Linie liegt tiefer bei $75.55 und bestätigt damit eine insgesamt bullische Tendenz in diesem 4h-Chart.
* Wichtigster Widerstand (Oben): $78.88 (Letztes Hoch) und $79.16.
* Wichtigste Unterstützung (Unten): $77.25 – $77.45 (Cluster der gleitenden Durchschnitte) und $75.55 (Supertrend-Unterstützung).
🔮 Was passiert als Nächstes?
* 📈 Wenn es über $78.88 ausbricht: Dann ist zu erwarten, dass die Bullen $SOL in Richtung $80.00 – $81.50 drücken.
* 📉 Wenn es unter $77.25 fällt: Der Kurs wird wahrscheinlich zurückkommen, um eine starke Unterstützung um $75.55 zu testen.
> 💡 Fazit: $SOL hält sich über seinem Cluster an gleitenden- Durchschnitts-Unterstützungen. Solange es über $77.25 bleibt, spricht das kurzfristige Setup für einen erneuten Test des $78.88-Hochs.
>
#SenateReleasesUpdatedCLARITYActText
Hier ist die technische Zusammenfassung für das $SOL/USDT 4-Stunden-Chart:
📊 Zusammenfassung $(SOL bei $77.79)
* Aktueller Trend: Konsolidierend / Neutral-Bullisch. Der Kurs handelt leicht oberhalb aller wichtigen gleitenden Durchschnitte: MA7 ($77.74), MA25 ($77.45) und MA99 ($77.25). Die grüne Supertrend-Linie liegt tiefer bei $75.55 und bestätigt damit eine insgesamt bullische Tendenz in diesem 4h-Chart.
* Wichtigster Widerstand (Oben): $78.88 (Letztes Hoch) und $79.16.
* Wichtigste Unterstützung (Unten): $77.25 – $77.45 (Cluster der gleitenden Durchschnitte) und $75.55 (Supertrend-Unterstützung).
🔮 Was passiert als Nächstes?
* 📈 Wenn es über $78.88 ausbricht: Dann ist zu erwarten, dass die Bullen $SOL in Richtung $80.00 – $81.50 drücken.
* 📉 Wenn es unter $77.25 fällt: Der Kurs wird wahrscheinlich zurückkommen, um eine starke Unterstützung um $75.55 zu testen.
> 💡 Fazit: $SOL hält sich über seinem Cluster an gleitenden- Durchschnitts-Unterstützungen. Solange es über $77.25 bleibt, spricht das kurzfristige Setup für einen erneuten Test des $78.88-Hochs.
>
#SenateReleasesUpdatedCLARITYActText
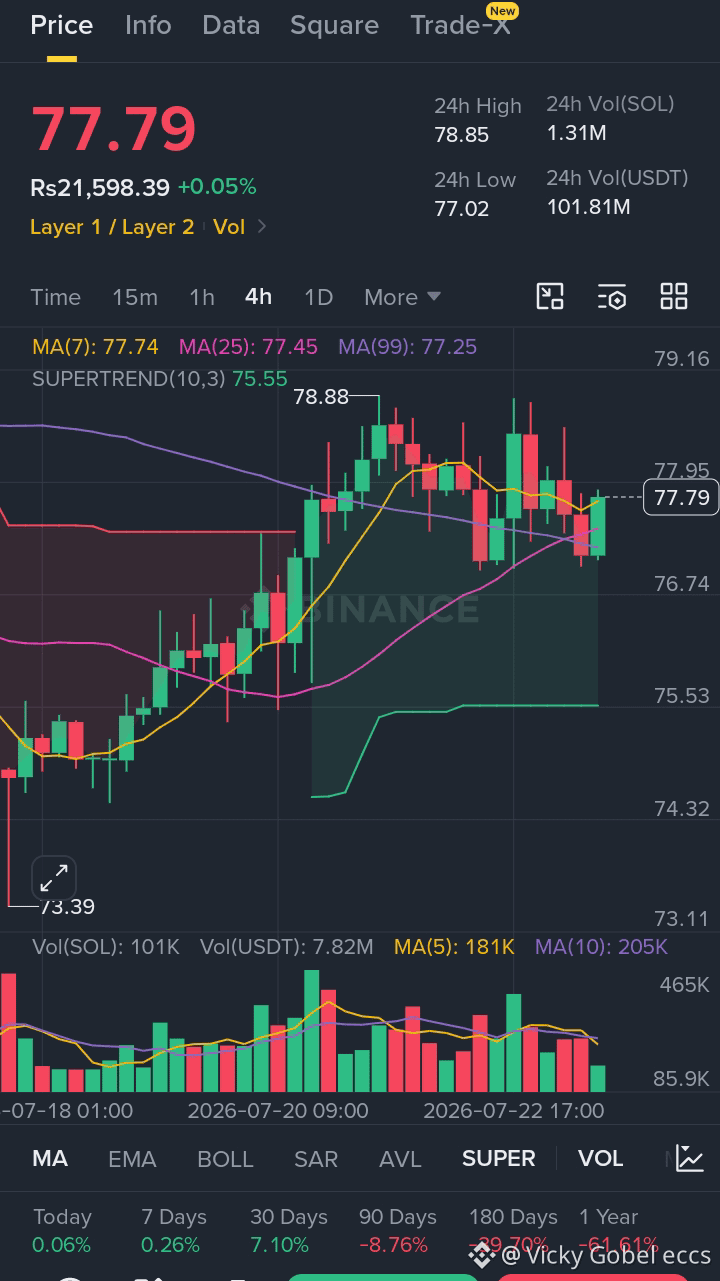
48
Anmelden und weiter Inhalte entdecken
Krypto-Nutzer weltweit auf Binance Square kennenlernen
⚡️ Bleib in Sachen Krypto stets am Puls.
💬 Die weltgrößte Kryptobörse vertraut darauf.
👍 Erhalte verlässliche Einblicke von verifizierten Creators.
E-Mail-Adresse/Telefonnummer
Trendthemen
BinanceRestores28FiatWithdrawals
1,546 Aufrufe
77 Kommentare
Binance nimmt Fiat-Auszahlungen in USD, AED und drei weiteren asiatischen Währungen wieder auf – insgesamt nun 28
Binance News
·6 Likes
·1.6k Aufrufe
BinanceProcesses$4.65BWithdrawals
60,243 Aufrufe
264 Kommentare
BitcoinClosesAbove50WeekMAFor7thStraightWeek
1 Aufrufe
7 Kommentare