
Millard Mcferrin hc8U
8 Beiträge

Millard Mcferrin hc8U
Melden
Nutzer blockieren
Trade eröffnen
4.4 Jahre
0 Following
0 Follower
1 Like gegeben
Beiträge
Portfolio
#BTC☀️ Bitcoin (BTC)
$75,200
Bärisch
6. November 2026 · Ungefähr
* Trend: Kurzfristig bärisch.
* Unterstützung: $75,000–$75,733.
* Widerstand: $77,950–$78,450.
* Momentum: Starker Verkaufsdruck.
* Ausblick: Eine Erholung über den Widerstand könnte die Marktstimmung verbessern. CoinMarketCap +1
Bitcoin (BTC)
$75,625.00
-$439.00 (0.58%)
1D5D1M6MYTD1Y5YMAX
Eröffnung
-
Volumen
-
Marktkapitalisierung
-
Tagestief
74,967
Jahrestief
57,945
Gewinn je Aktie (TTM)
-
Tageshoch
76,448
Jahreshoch
107,357
KGV
--
#TradFiForBeginners
#BTC☀️ Bitcoin (BTC)
$75,200
Bärisch
6. November 2026 · Ungefähr
* Trend: Kurzfristig bärisch.
* Unterstützung: $75,000–$75,733.
* Widerstand: $77,950–$78,450.
* Momentum: Starker Verkaufsdruck.
* Ausblick: Eine Erholung über den Widerstand könnte die Marktstimmung verbessern. CoinMarketCap +1
Bitcoin (BTC)
$75,625.00
-$439.00 (0.58%)
1D5D1M6MYTD1Y5YMAX
Eröffnung
-
Volumen
-
Marktkapitalisierung
-
Tagestief
74,967
Jahrestief
57,945
Gewinn je Aktie (TTM)
-
Tageshoch
76,448
Jahreshoch
107,357
KGV
--
#TradFiForBeginners
$75,200
Bärisch
6. November 2026 · Ungefähr
* Trend: Kurzfristig bärisch.
* Unterstützung: $75,000–$75,733.
* Widerstand: $77,950–$78,450.
* Momentum: Starker Verkaufsdruck.
* Ausblick: Eine Erholung über den Widerstand könnte die Marktstimmung verbessern. CoinMarketCap +1
Bitcoin (BTC)
$75,625.00
-$439.00 (0.58%)
1D5D1M6MYTD1Y5YMAX
Eröffnung
-
Volumen
-
Marktkapitalisierung
-
Tagestief
74,967
Jahrestief
57,945
Gewinn je Aktie (TTM)
-
Tageshoch
76,448
Jahreshoch
107,357
KGV
--
#TradFiForBeginners

91
Übersetzung ansehen
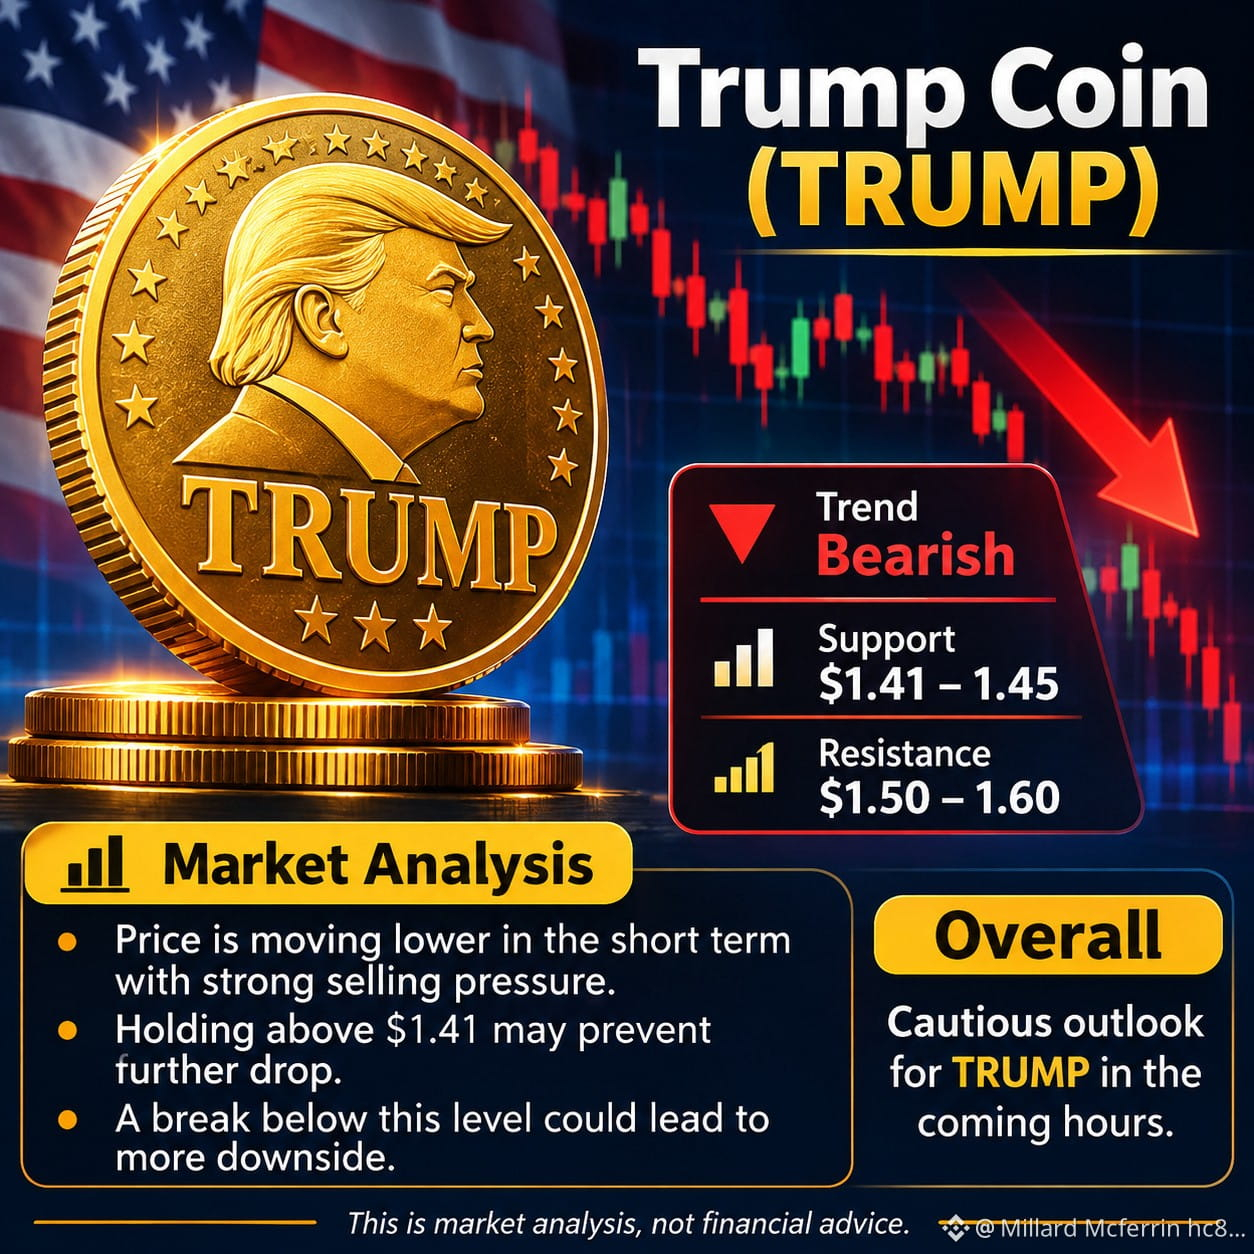
$TRUMP Trump Coin (TRUMP)
Official Trump (TRUMP)
$1.42
Bearish
November 5, 2026 · Approximate quote
* Trend: Bearish short-term.
* Support: $1.41–$1.45.
* Resistance: $1.50–$1.60.
* Momentum: Strong selling pressure.
* Outlook: A recovery needs stronger buying activity and a move above resistance.
The token was down approximately 11% over 24 hours in the CoinGecko snapshot. CoinGecko +1
### TRUMP market chart
Official Trump (TRUMP)
### $1.26
-$0.23 (15.44%)
1D5D1M6MYTD1Y5YMAX
Open
-
Volume
-
Market Cap
-
Day Low
1.22
Year Low
1.22
EPS (TTM)
-
Day High
1.49
Year High
9.5
P/E Ratio
-
#TradingCommunity
$TRUMP Trump Coin (TRUMP)
Official Trump (TRUMP)
$1.42
Bearish
November 5, 2026 · Approximate quote
* Trend: Bearish short-term.
* Support: $1.41–$1.45.
* Resistance: $1.50–$1.60.
* Momentum: Strong selling pressure.
* Outlook: A recovery needs stronger buying activity and a move above resistance.
The token was down approximately 11% over 24 hours in the CoinGecko snapshot. CoinGecko +1
### TRUMP market chart
Official Trump (TRUMP)
### $1.26
-$0.23 (15.44%)
1D5D1M6MYTD1Y5YMAX
Open
-
Volume
-
Market Cap
-
Day Low
1.22
Year Low
1.22
EPS (TTM)
-
Day High
1.49
Year High
9.5
P/E Ratio
-
#TradingCommunity
Official Trump (TRUMP)
$1.42
Bearish
November 5, 2026 · Approximate quote
* Trend: Bearish short-term.
* Support: $1.41–$1.45.
* Resistance: $1.50–$1.60.
* Momentum: Strong selling pressure.
* Outlook: A recovery needs stronger buying activity and a move above resistance.
The token was down approximately 11% over 24 hours in the CoinGecko snapshot. CoinGecko +1
### TRUMP market chart
Official Trump (TRUMP)
### $1.26
-$0.23 (15.44%)
1D5D1M6MYTD1Y5YMAX
Open
-
Volume
-
Market Cap
-
Day Low
1.22
Year Low
1.22
EPS (TTM)
-
Day High
1.49
Year High
9.5
P/E Ratio
-
#TradingCommunity
304
Übersetzung ansehen
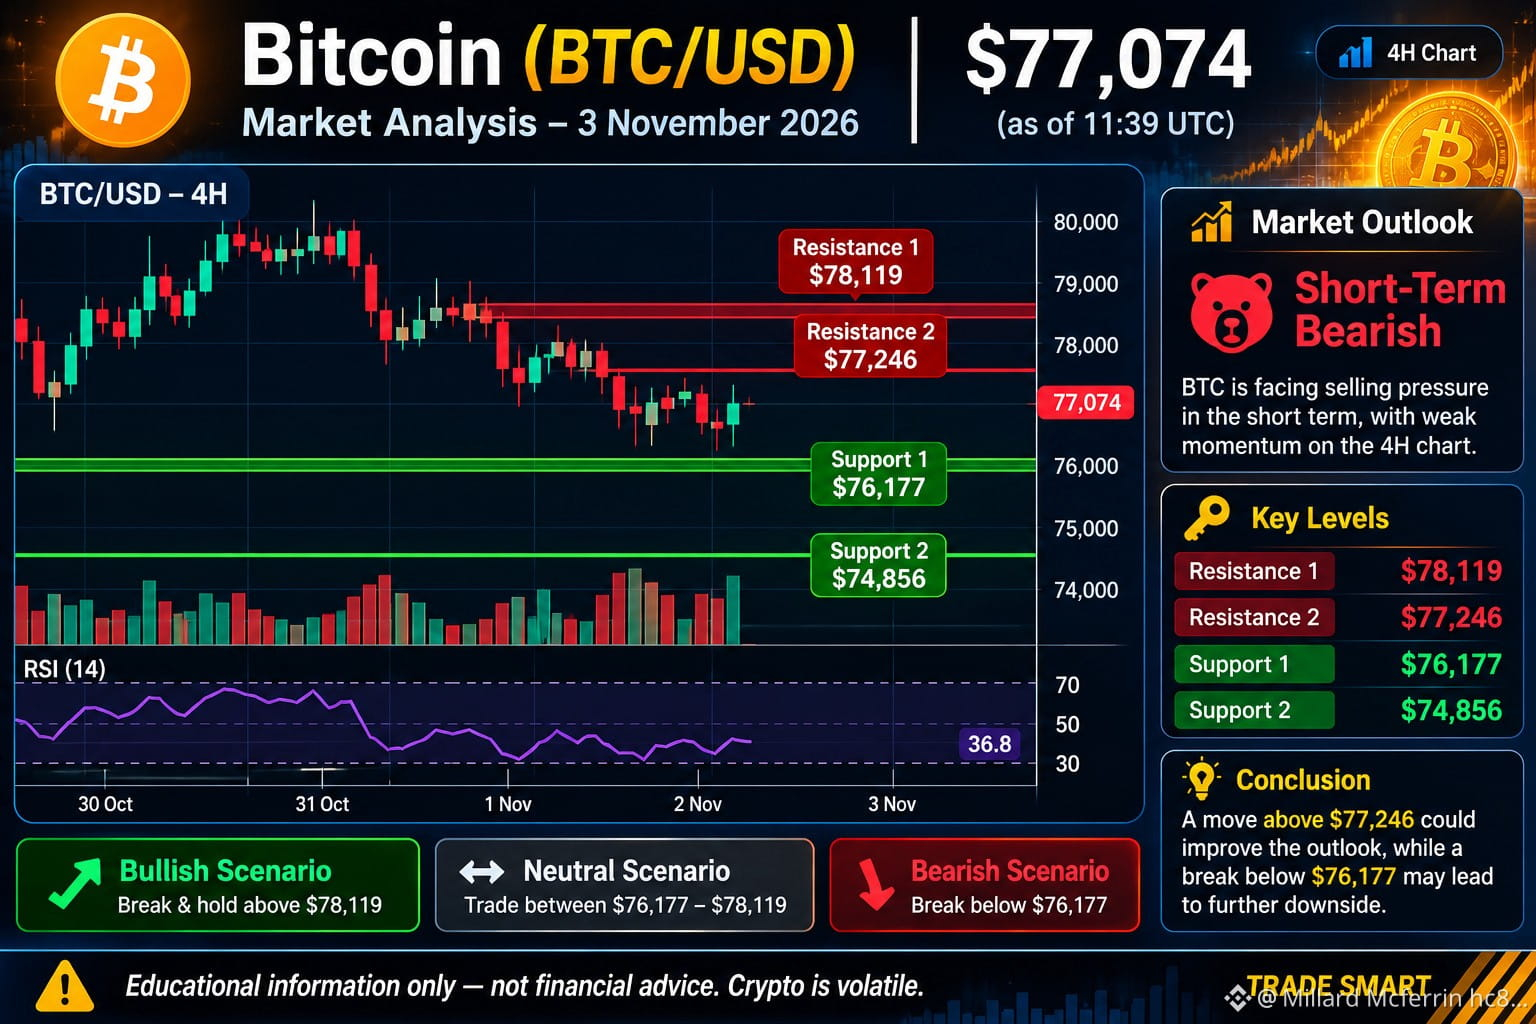
##BinanceReopensWithdrawalsForMoreAssets #AppleReportsMixedResults #BinanceHourlyDepositsExceedWithdrawals #FrenchAssemblyRejectsTwoCryptoExitTaxProposals $BTC Bitcoin (BTC) – Market Analysis
BTC is a highly volatile asset. The key things to watch are its overall trend, trading volume, and whether price holds or breaks important support and resistance levels.
$76,600–$76,800
BTC approximate market price · November 3, 2026
Short-term bearish pressure
BTC technical levels
| Level | Price |
| ------------- | ------- |
| Resistance 2 | $79,600 |
| Resistance 1 | $78,100 |
| Current price | $76,700 |
| Support 1 | $76,100 |
| Support 2 | $74,800 |
| Support 3 | $71,900 |
BTC price structure (illustrative)
Resistance
$78,100
Current BTC
$76,700
Support
$76,100
Next support
$74,800
Market outlook
* Short-term: Bearish.
* Daily: Mixed, with weak momentum.
* RSI: Approximately 34.
* Weekly: More constructive than the short-term trend.
Conclusion: Bitcoin is under selling pressure. The $76,100 area is an important support to monitor, while $78,100 is an important resistance. These are educational observations, not trading signals.
#BinanceReopensWithdrawalsForMoreAssets
##BinanceReopensWithdrawalsForMoreAssets #AppleReportsMixedResults #BinanceHourlyDepositsExceedWithdrawals #FrenchAssemblyRejectsTwoCryptoExitTaxProposals $BTC Bitcoin (BTC) – Market Analysis
BTC is a highly volatile asset. The key things to watch are its overall trend, trading volume, and whether price holds or breaks important support and resistance levels.
$76,600–$76,800
BTC approximate market price · November 3, 2026
Short-term bearish pressure
BTC technical levels
| Level | Price |
| ------------- | ------- |
| Resistance 2 | $79,600 |
| Resistance 1 | $78,100 |
| Current price | $76,700 |
| Support 1 | $76,100 |
| Support 2 | $74,800 |
| Support 3 | $71,900 |
BTC price structure (illustrative)
Resistance
$78,100
Current BTC
$76,700
Support
$76,100
Next support
$74,800
Market outlook
* Short-term: Bearish.
* Daily: Mixed, with weak momentum.
* RSI: Approximately 34.
* Weekly: More constructive than the short-term trend.
Conclusion: Bitcoin is under selling pressure. The $76,100 area is an important support to monitor, while $78,100 is an important resistance. These are educational observations, not trading signals.
#BinanceReopensWithdrawalsForMoreAssets
BTC is a highly volatile asset. The key things to watch are its overall trend, trading volume, and whether price holds or breaks important support and resistance levels.
$76,600–$76,800
BTC approximate market price · November 3, 2026
Short-term bearish pressure
BTC technical levels
| Level | Price |
| ------------- | ------- |
| Resistance 2 | $79,600 |
| Resistance 1 | $78,100 |
| Current price | $76,700 |
| Support 1 | $76,100 |
| Support 2 | $74,800 |
| Support 3 | $71,900 |
BTC price structure (illustrative)
Resistance
$78,100
Current BTC
$76,700
Support
$76,100
Next support
$74,800
Market outlook
* Short-term: Bearish.
* Daily: Mixed, with weak momentum.
* RSI: Approximately 34.
* Weekly: More constructive than the short-term trend.
Conclusion: Bitcoin is under selling pressure. The $76,100 area is an important support to monitor, while $78,100 is an important resistance. These are educational observations, not trading signals.
#BinanceReopensWithdrawalsForMoreAssets
95
Übersetzung ansehen
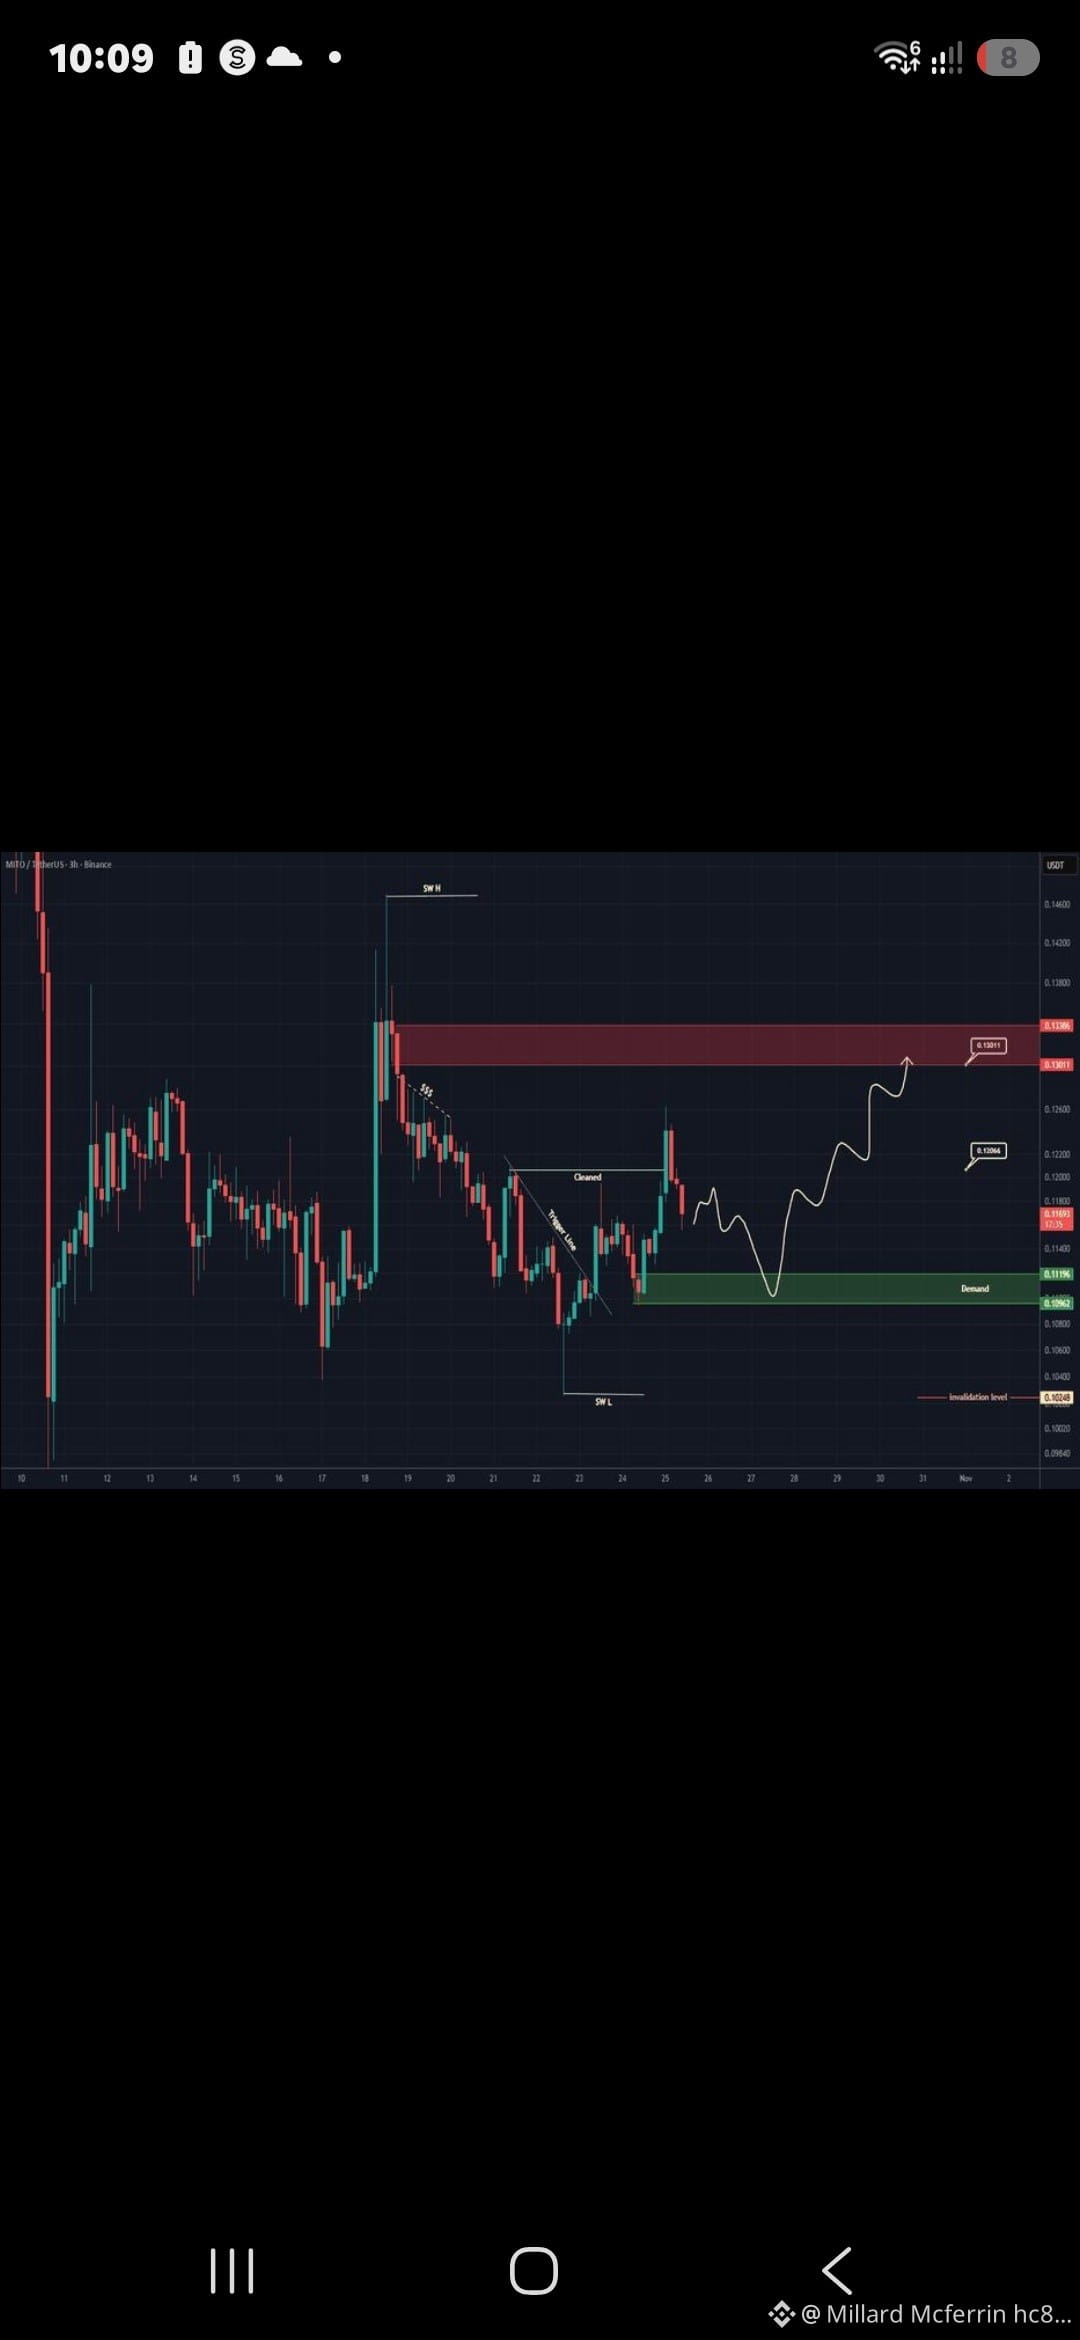
#BinanceWithdrawalScamWarning #USMidtermElections $MITO (Mitosis) – Spot & Futures Analysis
Market snapshot: November 2, 2026 · MITO/USDT
$0.008785
+18.37% (24 hours)
MITO has experienced a strong short-term bounce, but its broader trend remains weak. CoinMarketCap +1
1. Price chart
Important price levels
| Level | Price |
| ------------- | -------- |
| Resistance 2 | $0.00916 |
| Resistance 1 | $0.00895 |
| Current price | $0.00879 |
| Support 1 | $0.00745 |
| Support 2 | $0.00688 |
Approximate reference levels from available market snapshots. CoinMarketCap +2
2. Spot market outlook
* Short-term: Recovery attempt.
* Medium-term: Bearish.
* Watch for sustained trading above $0.00916.
* A decline below $0.00745 would weaken the recovery.
3. Futures market outlook
Futures involve additional risks from leverage and liquidation.
* Volatility is elevated.
* Short-term price direction is uncertain.
* Avoid treating a one-day bounce as confirmation of a trend reversal.
Future scenarios
Bullish Sustained break above $0.00916
Sideways Consolidation between $0.00745–$0.00916
Bearish Breakdown below $0.00745
Overall analysis
Caution
MITO is showing a short-term recovery, but its longer-term weakness and token-supply risks remain important. This is educational market analysis, not a recommendation to trade.
#BinanceWithdrawalScamWarning #USMidtermElections $MITO (Mitosis) – Spot & Futures Analysis
Market snapshot: November 2, 2026 · MITO/USDT
$0.008785
+18.37% (24 hours)
MITO has experienced a strong short-term bounce, but its broader trend remains weak. CoinMarketCap +1
1. Price chart
Important price levels
| Level | Price |
| ------------- | -------- |
| Resistance 2 | $0.00916 |
| Resistance 1 | $0.00895 |
| Current price | $0.00879 |
| Support 1 | $0.00745 |
| Support 2 | $0.00688 |
Approximate reference levels from available market snapshots. CoinMarketCap +2
2. Spot market outlook
* Short-term: Recovery attempt.
* Medium-term: Bearish.
* Watch for sustained trading above $0.00916.
* A decline below $0.00745 would weaken the recovery.
3. Futures market outlook
Futures involve additional risks from leverage and liquidation.
* Volatility is elevated.
* Short-term price direction is uncertain.
* Avoid treating a one-day bounce as confirmation of a trend reversal.
Future scenarios
Bullish Sustained break above $0.00916
Sideways Consolidation between $0.00745–$0.00916
Bearish Breakdown below $0.00745
Overall analysis
Caution
MITO is showing a short-term recovery, but its longer-term weakness and token-supply risks remain important. This is educational market analysis, not a recommendation to trade.
Market snapshot: November 2, 2026 · MITO/USDT
$0.008785
+18.37% (24 hours)
MITO has experienced a strong short-term bounce, but its broader trend remains weak. CoinMarketCap +1
1. Price chart
Important price levels
| Level | Price |
| ------------- | -------- |
| Resistance 2 | $0.00916 |
| Resistance 1 | $0.00895 |
| Current price | $0.00879 |
| Support 1 | $0.00745 |
| Support 2 | $0.00688 |
Approximate reference levels from available market snapshots. CoinMarketCap +2
2. Spot market outlook
* Short-term: Recovery attempt.
* Medium-term: Bearish.
* Watch for sustained trading above $0.00916.
* A decline below $0.00745 would weaken the recovery.
3. Futures market outlook
Futures involve additional risks from leverage and liquidation.
* Volatility is elevated.
* Short-term price direction is uncertain.
* Avoid treating a one-day bounce as confirmation of a trend reversal.
Future scenarios
Bullish Sustained break above $0.00916
Sideways Consolidation between $0.00745–$0.00916
Bearish Breakdown below $0.00745
Overall analysis
Caution
MITO is showing a short-term recovery, but its longer-term weakness and token-supply risks remain important. This is educational market analysis, not a recommendation to trade.
1
269
Übersetzung ansehen
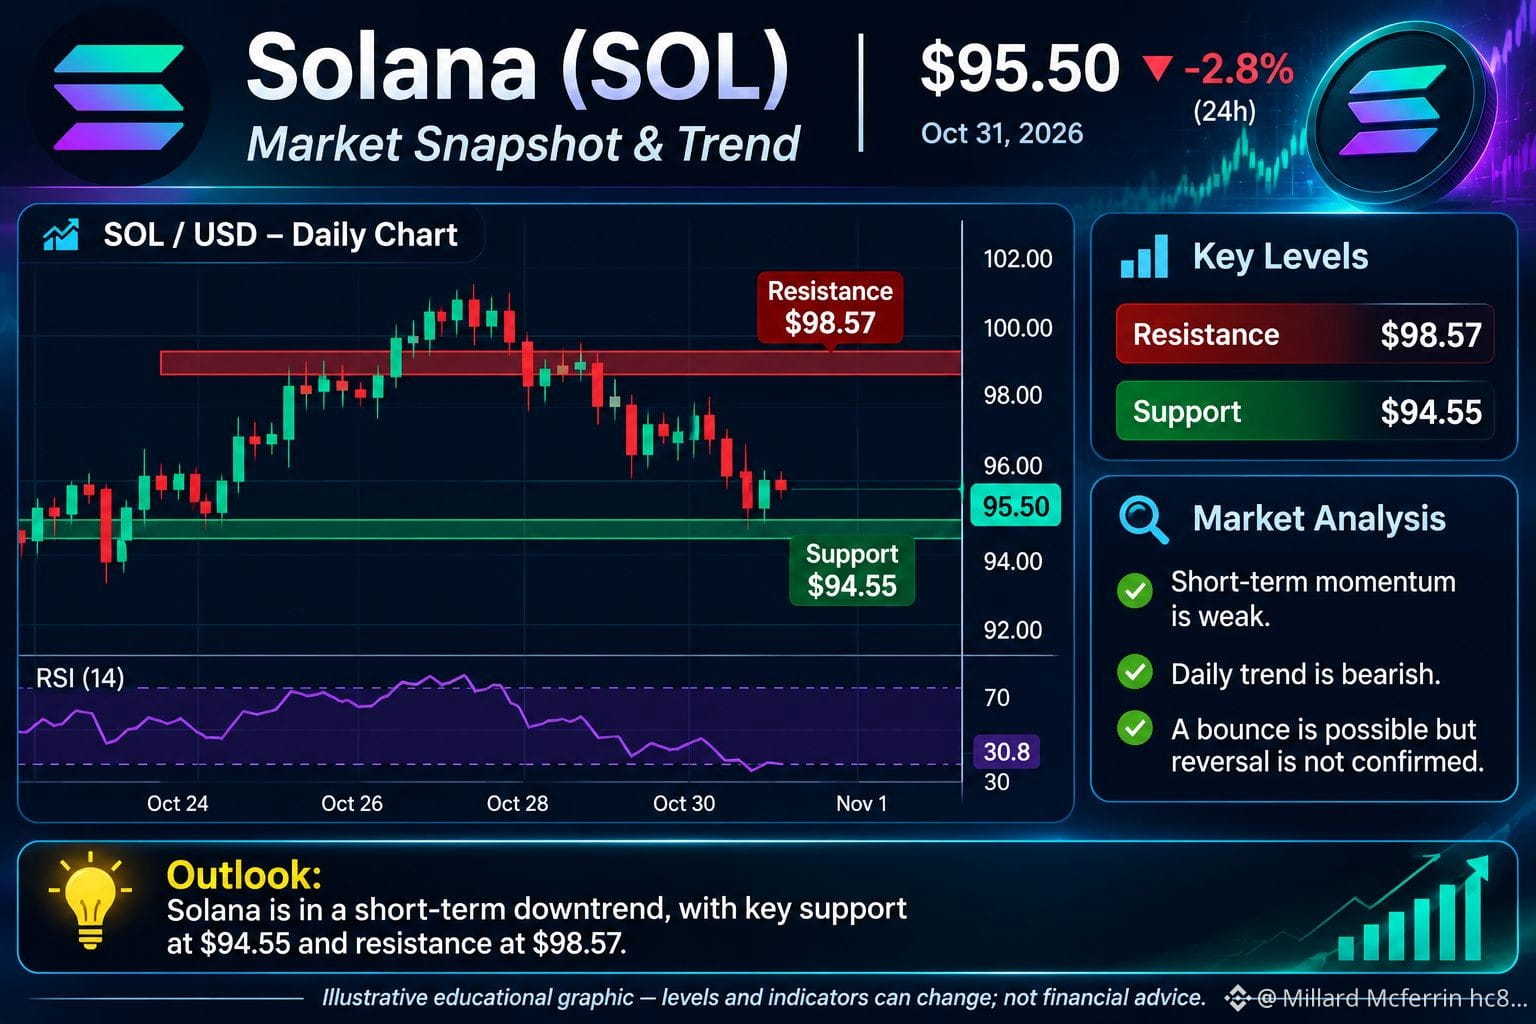
$SOL is under selling pressure. The daily RSI is around 30–31, indicating weak momentum. A short-term recovery is possible, but a confirmed reversal has not been established.
Key levels to watch
Level Price
Resistance $98.57
Current reference $95.50
Support $94.55
Possible scenarios
Bullish: A sustained move above $98.57 may indicate recovery.
Bearish: A break below $94.55 may indicate further weakness.
Neutral: Price remains between these levels.
#HeYiSaysWithdrawalsExpectedtoResumeWithin42Hours #CZSaysCompensationIsinPlaceUsersAreProtected
$SOL is under selling pressure. The daily RSI is around 30–31, indicating weak momentum. A short-term recovery is possible, but a confirmed reversal has not been established.
Key levels to watch
Level Price
Resistance $98.57
Current reference $95.50
Support $94.55
Possible scenarios
Bullish: A sustained move above $98.57 may indicate recovery.
Bearish: A break below $94.55 may indicate further weakness.
Neutral: Price remains between these levels.
#HeYiSaysWithdrawalsExpectedtoResumeWithin42Hours #CZSaysCompensationIsinPlaceUsersAreProtected
Key levels to watch
Level Price
Resistance $98.57
Current reference $95.50
Support $94.55
Possible scenarios
Bullish: A sustained move above $98.57 may indicate recovery.
Bearish: A break below $94.55 may indicate further weakness.
Neutral: Price remains between these levels.
#HeYiSaysWithdrawalsExpectedtoResumeWithin42Hours #CZSaysCompensationIsinPlaceUsersAreProtected
111
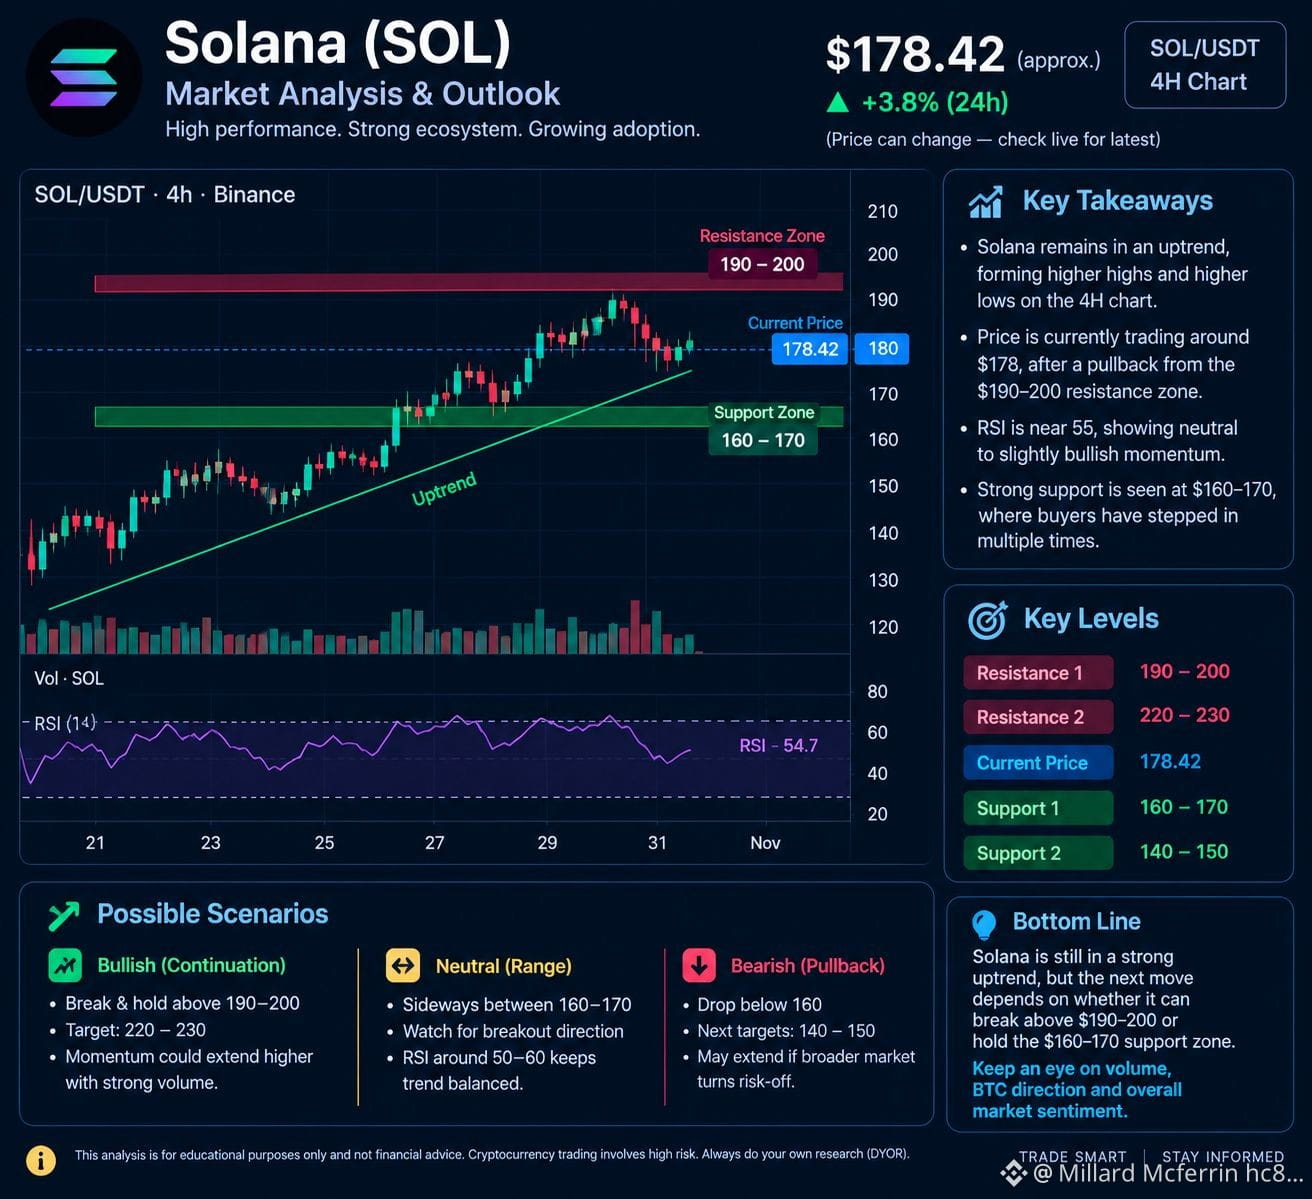
$SOL Solana (SOL) – Technische Analyse
30. Oktober 2026
$97.19
Gemeldeter SOL-Preis, 29. Oktober, 22:50 UTC
Marktausblick: Solana zeigt kurzfristig Schwäche. Der 4-Stunden-Trend ist bearish, während der Tagestrend neutral ist. COINOTAG +1
Wichtige Kursniveaus
| Niveau | Preis |
| ------------ | ------- |
| Widerstand 2 | $106.13 |
| Widerstand 1 | $103.40 |
| Unterstützung 1 | $96.44 |
| Unterstützung 2 | $91.73 |
Technische Indikatoren
* RSI: 31.2 – schwaches Momentum.
* 4H-Trend: Bearish.
* Tagestrend: Neutral.
* Wochentrend: Laut der gemeldeten Indikatorbewertung bullish. COINOTAG
Mögliche Marktszenarien
* Bullish: Ein Tagesschluss über $103.40 könnte die Erholung stärken.
* Seitwärts: Der Kurs bleibt zwischen $96.44 und $103.40.
* Bearish: Ein Tagesschluss unter $96.44 könnte den Weg bis $91.73 freimachen.
SOL weist derzeit ein schwaches kurzfristiges Momentum auf. Die Unterstützung bei $96.44 und der Widerstand bei $103.40 sind wichtige Niveaus, die es zu beobachten gilt. Dies sind technische Beobachtungen, keine Handelssignale oder garantierten Prognosen.
{spot}(SOLUSDT)
#FedWatch #EarningsSeason #USMidtermElections #BrazilCryptoExchangesMustApplyForLicensesByFriday #StanDruckenmillerBecomesInvestorInTradeXYZ
$SOL Solana (SOL) – Technische Analyse
30. Oktober 2026
$97.19
Gemeldeter SOL-Preis, 29. Oktober, 22:50 UTC
Marktausblick: Solana zeigt kurzfristig Schwäche. Der 4-Stunden-Trend ist bearish, während der Tagestrend neutral ist. COINOTAG +1
Wichtige Kursniveaus
| Niveau | Preis |
| ------------ | ------- |
| Widerstand 2 | $106.13 |
| Widerstand 1 | $103.40 |
| Unterstützung 1 | $96.44 |
| Unterstützung 2 | $91.73 |
Technische Indikatoren
* RSI: 31.2 – schwaches Momentum.
* 4H-Trend: Bearish.
* Tagestrend: Neutral.
* Wochentrend: Laut der gemeldeten Indikatorbewertung bullish. COINOTAG
Mögliche Marktszenarien
* Bullish: Ein Tagesschluss über $103.40 könnte die Erholung stärken.
* Seitwärts: Der Kurs bleibt zwischen $96.44 und $103.40.
* Bearish: Ein Tagesschluss unter $96.44 könnte den Weg bis $91.73 freimachen.
SOL weist derzeit ein schwaches kurzfristiges Momentum auf. Die Unterstützung bei $96.44 und der Widerstand bei $103.40 sind wichtige Niveaus, die es zu beobachten gilt. Dies sind technische Beobachtungen, keine Handelssignale oder garantierten Prognosen.
#FedWatch #EarningsSeason #USMidtermElections #BrazilCryptoExchangesMustApplyForLicensesByFriday #StanDruckenmillerBecomesInvestorInTradeXYZ
30. Oktober 2026
$97.19
Gemeldeter SOL-Preis, 29. Oktober, 22:50 UTC
Marktausblick: Solana zeigt kurzfristig Schwäche. Der 4-Stunden-Trend ist bearish, während der Tagestrend neutral ist. COINOTAG +1
Wichtige Kursniveaus
| Niveau | Preis |
| ------------ | ------- |
| Widerstand 2 | $106.13 |
| Widerstand 1 | $103.40 |
| Unterstützung 1 | $96.44 |
| Unterstützung 2 | $91.73 |
Technische Indikatoren
* RSI: 31.2 – schwaches Momentum.
* 4H-Trend: Bearish.
* Tagestrend: Neutral.
* Wochentrend: Laut der gemeldeten Indikatorbewertung bullish. COINOTAG
Mögliche Marktszenarien
* Bullish: Ein Tagesschluss über $103.40 könnte die Erholung stärken.
* Seitwärts: Der Kurs bleibt zwischen $96.44 und $103.40.
* Bearish: Ein Tagesschluss unter $96.44 könnte den Weg bis $91.73 freimachen.
SOL weist derzeit ein schwaches kurzfristiges Momentum auf. Die Unterstützung bei $96.44 und der Widerstand bei $103.40 sind wichtige Niveaus, die es zu beobachten gilt. Dies sind technische Beobachtungen, keine Handelssignale oder garantierten Prognosen.
#FedWatch #EarningsSeason #USMidtermElections #BrazilCryptoExchangesMustApplyForLicensesByFriday #StanDruckenmillerBecomesInvestorInTradeXYZ
130
Übersetzung ansehen
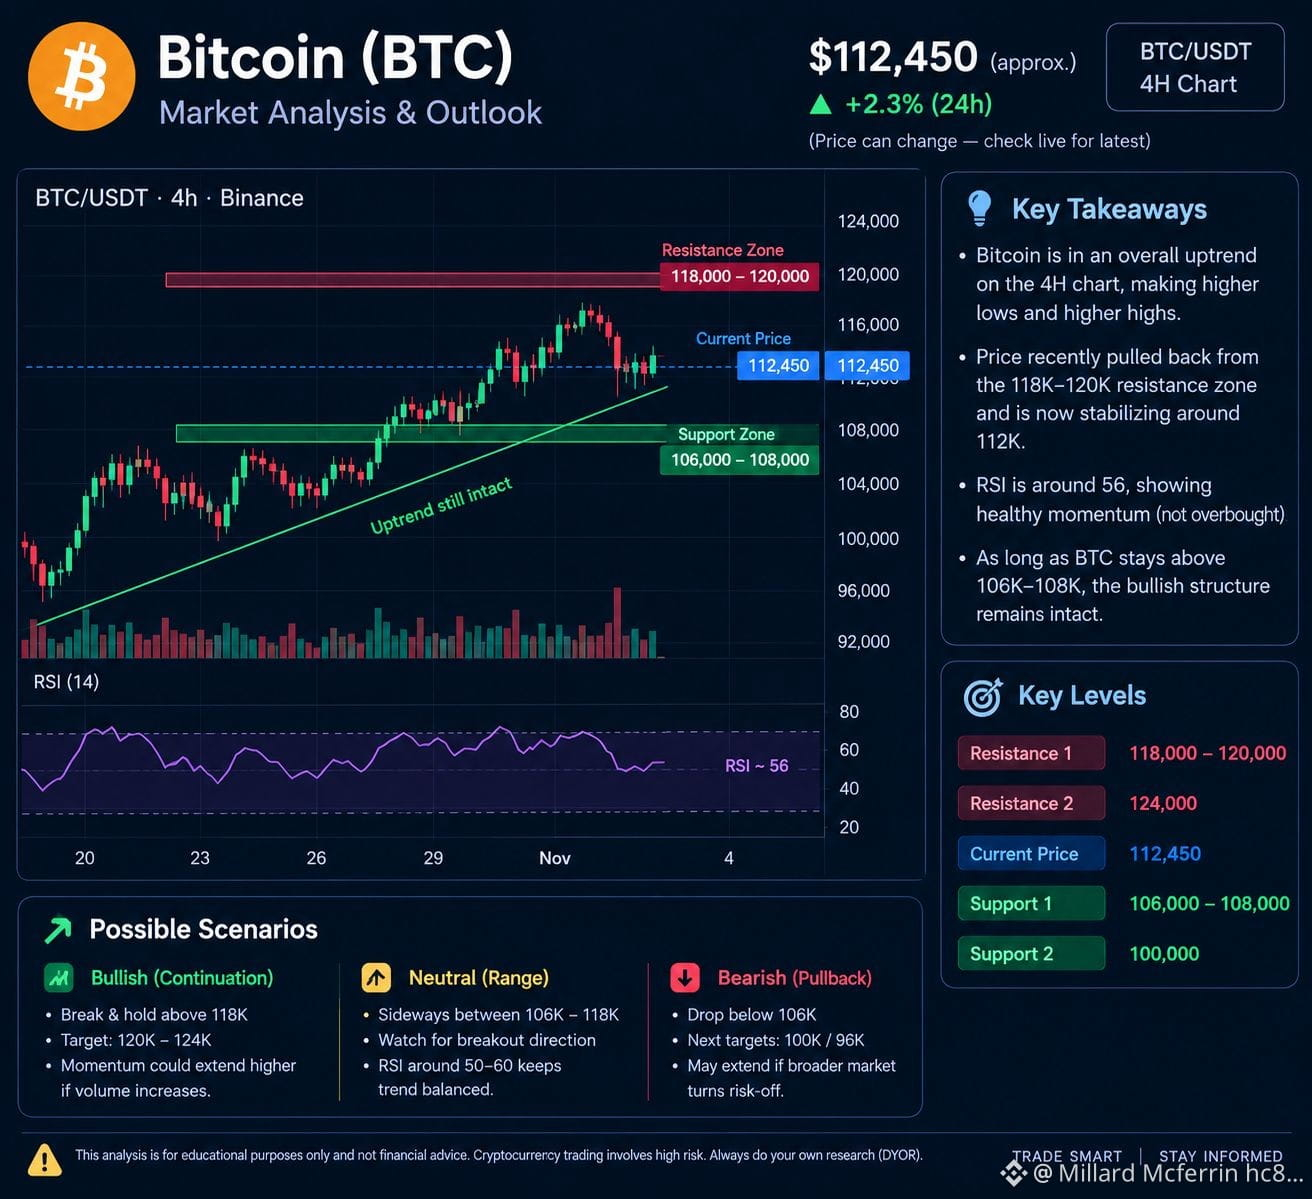
$BTC is a highly volatile cryptocurrency. Its short-term direction depends on market momentum, trading volume, investor sentiment, and broader financial conditions.
Short analysis: The chart illustrates a bullish Bitcoin structure, with a recent pullback and consolidation.
Resistance: $118,000–$120,000
Support: $106,000–$108,000
Bullish scenario: Sustained move above resistance.
Bearish scenario: Breakdown below suppo
rt.
Momentum: RSI around 56 in the illustrative chart.
Conclusion: Watch whether Bitcoin holds support or breaks resistance before drawing conclusions about its next direction.
{spot}(BTCUSDT)
#FedWatch #EarningsSeason #USMidtermElections #BrazilCryptoExchangesMustApplyForLicensesByFriday
$BTC is a highly volatile cryptocurrency. Its short-term direction depends on market momentum, trading volume, investor sentiment, and broader financial conditions.
Short analysis: The chart illustrates a bullish Bitcoin structure, with a recent pullback and consolidation.
Resistance: $118,000–$120,000
Support: $106,000–$108,000
Bullish scenario: Sustained move above resistance.
Bearish scenario: Breakdown below suppo
rt.
Momentum: RSI around 56 in the illustrative chart.
Conclusion: Watch whether Bitcoin holds support or breaks resistance before drawing conclusions about its next direction.
#FedWatch #EarningsSeason #USMidtermElections #BrazilCryptoExchangesMustApplyForLicensesByFriday
Short analysis: The chart illustrates a bullish Bitcoin structure, with a recent pullback and consolidation.
Resistance: $118,000–$120,000
Support: $106,000–$108,000
Bullish scenario: Sustained move above resistance.
Bearish scenario: Breakdown below suppo
rt.
Momentum: RSI around 56 in the illustrative chart.
Conclusion: Watch whether Bitcoin holds support or breaks resistance before drawing conclusions about its next direction.
#FedWatch #EarningsSeason #USMidtermElections #BrazilCryptoExchangesMustApplyForLicensesByFriday
65
Übersetzung ansehen
Current gold market outlook
30 October 2026
Gold is showing selling pressure:
* Latest reported spot price: approximately $4,009/oz.
* US gold futures settled around $4,032.
* Higher US inflation and expectations of tighter monetary policy are weighing on gold.
* The $4,000 area is an important level to watch. Reuters +1
Technical chart
![Gold Price Forecast: XAU/USD
The latest technical analysis reports:
| Indicator | Reading |
| -------------- | ------------ |
| Intraday pivot | $4,056 |
| Resistance | $4,087 |
| Support | $3,979 |
| Next support | $3,961 |
| Daily RSI | Around 37–40 |
Current gold market outlook
30 October 2026
Gold is showing selling pressure:
* Latest reported spot price: approximately $4,009/oz.
* US gold futures settled around $4,032.
* Higher US inflation and expectations of tighter monetary policy are weighing on gold.
* The $4,000 area is an important level to watch. Reuters +1
Technical chart
![Gold Price Forecast: XAU/USD
The latest technical analysis reports:
| Indicator | Reading |
| -------------- | ------------ |
| Intraday pivot | $4,056 |
| Resistance | $4,087 |
| Support | $3,979 |
| Next support | $3,961 |
| Daily RSI | Around 37–40 |
30 October 2026
Gold is showing selling pressure:
* Latest reported spot price: approximately $4,009/oz.
* US gold futures settled around $4,032.
* Higher US inflation and expectations of tighter monetary policy are weighing on gold.
* The $4,000 area is an important level to watch. Reuters +1
Technical chart
![Gold Price Forecast: XAU/USD
The latest technical analysis reports:
| Indicator | Reading |
| -------------- | ------------ |
| Intraday pivot | $4,056 |
| Resistance | $4,087 |
| Support | $3,979 |
| Next support | $3,961 |
| Daily RSI | Around 37–40 |
39
Anmelden und weiter Inhalte entdecken
Krypto-Nutzer weltweit auf Binance Square kennenlernen
⚡️ Bleib in Sachen Krypto stets am Puls.
💬 Die weltgrößte Kryptobörse vertraut darauf.
👍 Erhalte verlässliche Einblicke von verifizierten Creators.
E-Mail-Adresse/Telefonnummer
Trendthemen
A Packed Week of Earnings and Data Tests Markets
82,717 Aufrufe
490 Kommentare
Nvidia-Zahlen, Fed-Protokoll und Anthropic-Börsengang stellen KI-Aktien und Kryptowährungen auf die Probe
Binance News
·148 Likes
·25.7k Aufrufe
AnthropicIPOTestsInvestorAppetiteForAI
163,546 Aufrufe
1,754 Kommentare
NvidiaBoardNotConsideringHuang’sReturnasCEO
16,607 Aufrufe
244 Kommentare