

Tayyab1453
10 Beiträge

Tayyab1453
Melden
Nutzer blockieren
0 Following
1 Follower
1 Like gegeben
Beiträge
·
--
Übersetzung ansehen
🚨 BITCOIN AT A CRITICAL SUPPORT ZONE! ₿📉
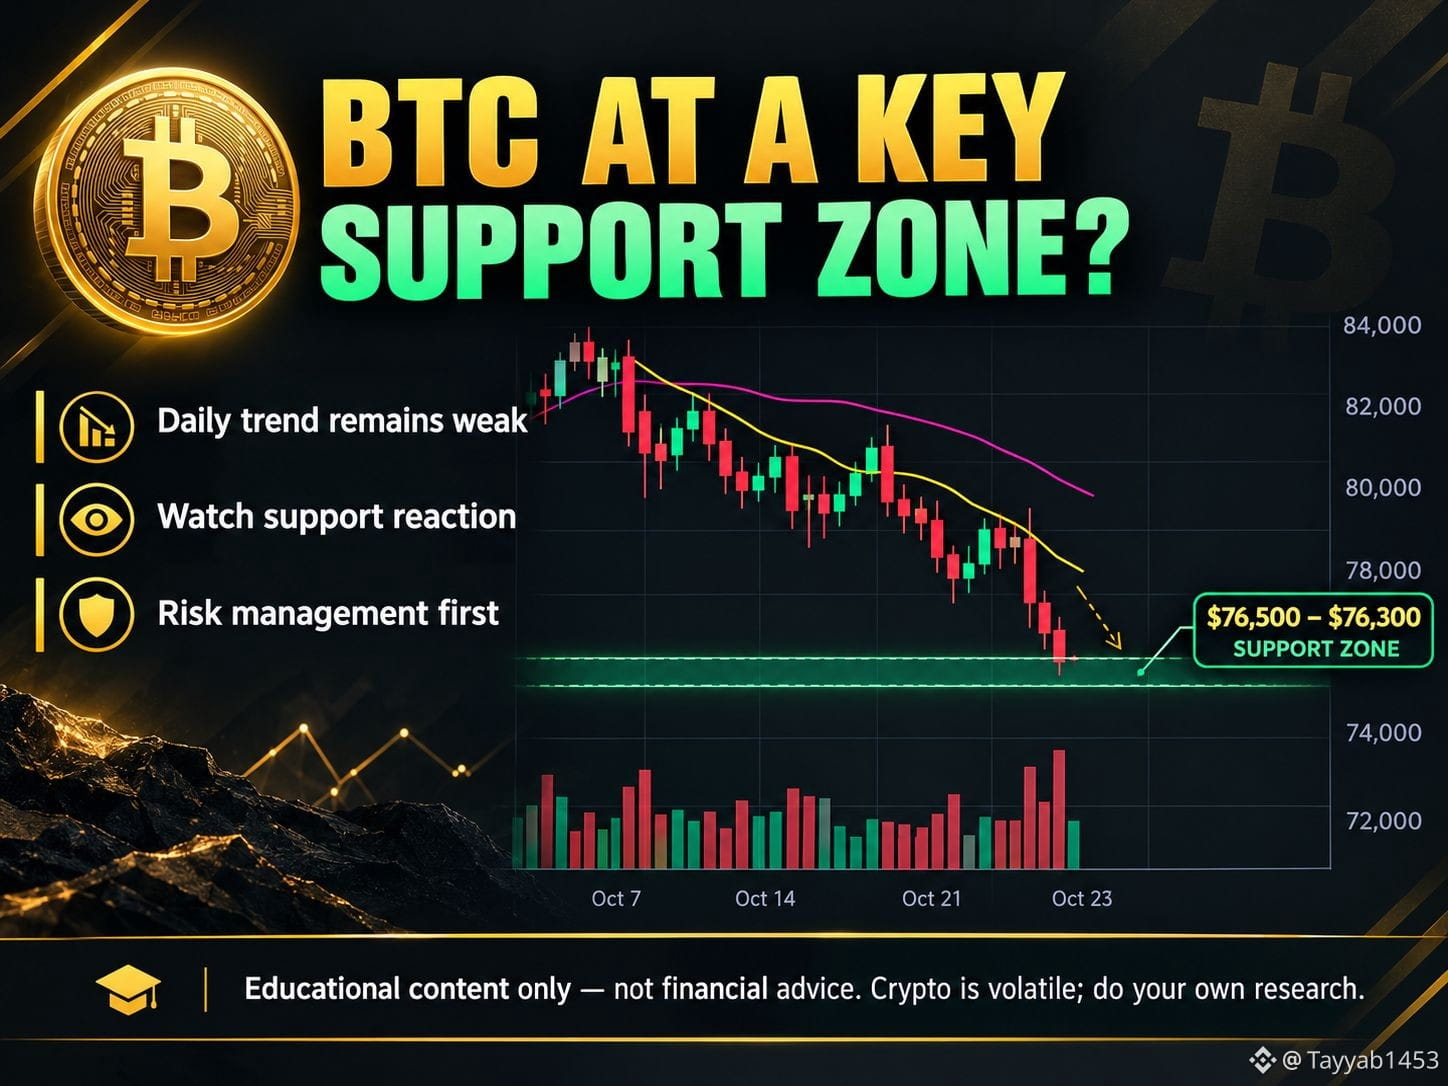
Bitcoin is trading around $77,604, down approximately 3.35% in 24 hours according to the chart.
🔍 What Should Traders Watch?
📉 Bearish Momentum: BTC is trading below its 7-day and 25-day moving averages, suggesting short-term weakness.
🟢 Key Support: The $76,500 area is an important level to monitor.
⚡ Possible Scenarios: 🔹 If support holds, BTC could attempt a recovery. 🔹 If support breaks, further downside may be possible. 🔹 Watch volume and price action before making any decision.
💡 Smart traders focus on risk management, not just profits!$BTC
👇 Your opinion matters! Will BTC bounce from support or break lower? 📊#bitcoin
💬 Comment BOUNCE 📈 or BREAKDOWN 📉!
⚠️ Disclaimer: This post is for educational purposes only and is not financial advice. Cryptocurrency trading involves significant risk. Always DYOR and never invest more than you can afford to lose.
#Bitcoin #BTC #CryptoAnalysis #BinanceSquare #CryptoTrading
🚨 BITCOIN AT A CRITICAL SUPPORT ZONE! ₿📉
Bitcoin is trading around $77,604, down approximately 3.35% in 24 hours according to the chart.
🔍 What Should Traders Watch?
📉 Bearish Momentum: BTC is trading below its 7-day and 25-day moving averages, suggesting short-term weakness.
🟢 Key Support: The $76,500 area is an important level to monitor.
⚡ Possible Scenarios: 🔹 If support holds, BTC could attempt a recovery. 🔹 If support breaks, further downside may be possible. 🔹 Watch volume and price action before making any decision.
💡 Smart traders focus on risk management, not just profits!$BTC
👇 Your opinion matters! Will BTC bounce from support or break lower? 📊#bitcoin
💬 Comment BOUNCE 📈 or BREAKDOWN 📉!
⚠️ Disclaimer: This post is for educational purposes only and is not financial advice. Cryptocurrency trading involves significant risk. Always DYOR and never invest more than you can afford to lose.
#Bitcoin #BTC #CryptoAnalysis #BinanceSquare #CryptoTrading
Bitcoin is trading around $77,604, down approximately 3.35% in 24 hours according to the chart.
🔍 What Should Traders Watch?
📉 Bearish Momentum: BTC is trading below its 7-day and 25-day moving averages, suggesting short-term weakness.
🟢 Key Support: The $76,500 area is an important level to monitor.
⚡ Possible Scenarios: 🔹 If support holds, BTC could attempt a recovery. 🔹 If support breaks, further downside may be possible. 🔹 Watch volume and price action before making any decision.
💡 Smart traders focus on risk management, not just profits!$BTC
👇 Your opinion matters! Will BTC bounce from support or break lower? 📊#bitcoin
💬 Comment BOUNCE 📈 or BREAKDOWN 📉!
⚠️ Disclaimer: This post is for educational purposes only and is not financial advice. Cryptocurrency trading involves significant risk. Always DYOR and never invest more than you can afford to lose.
#Bitcoin #BTC #CryptoAnalysis #BinanceSquare #CryptoTrading
70
·
--
🚨 NEAR/USDT: RÜCKSETZER ODER DIE NÄCHSTE GELEGENHEIT? 📉📈
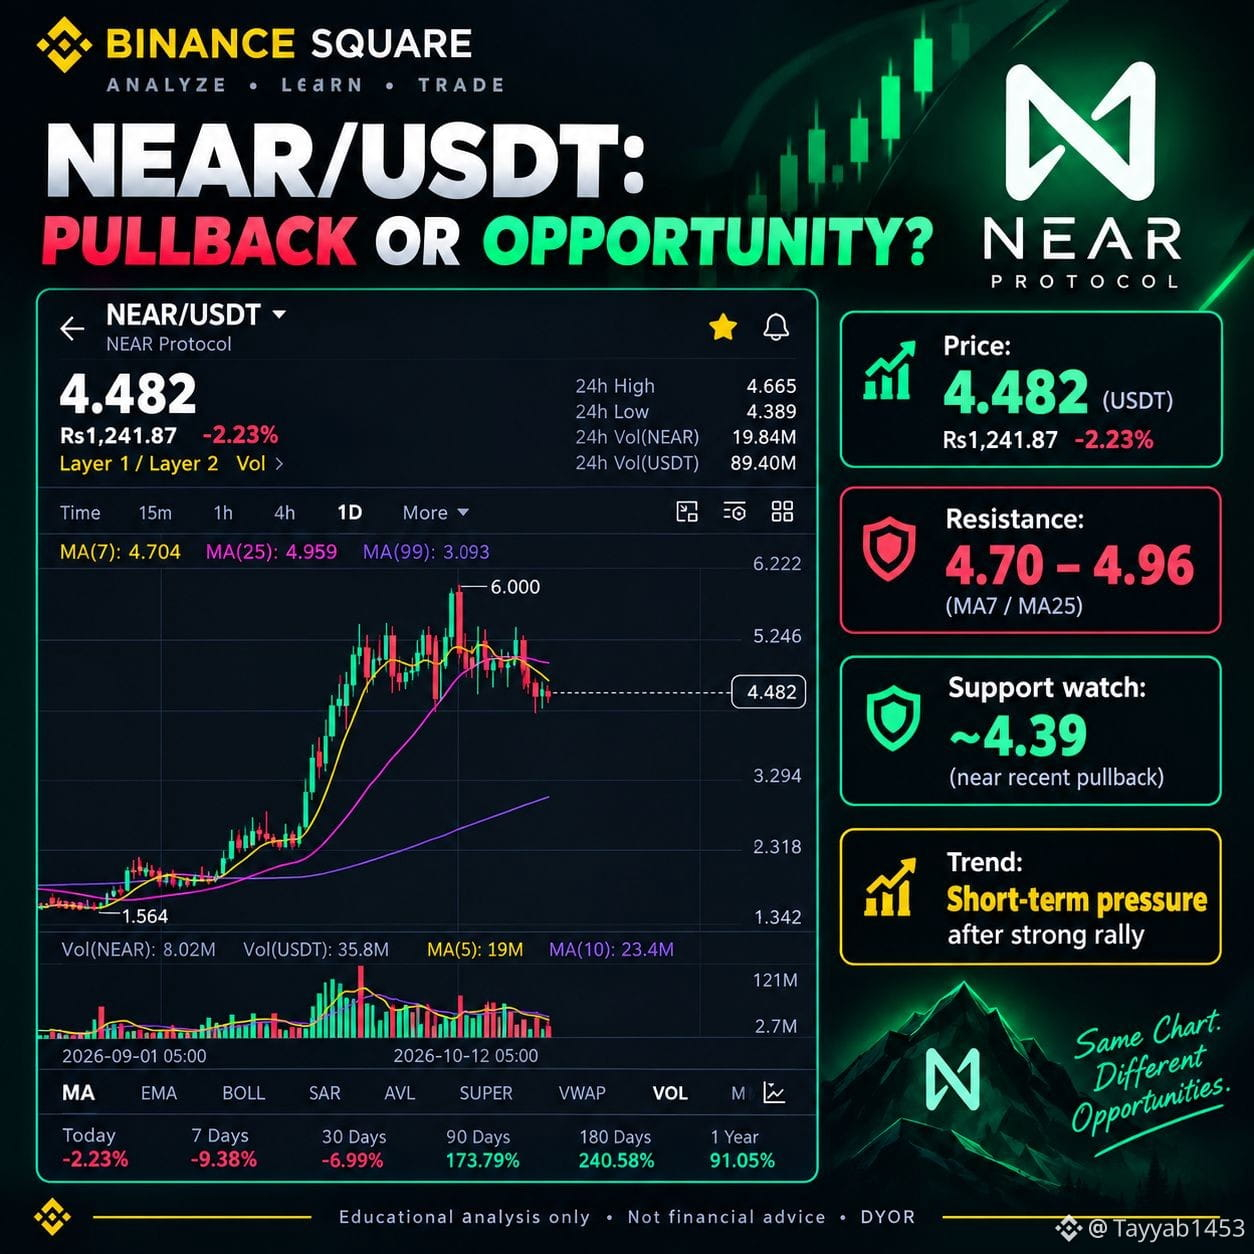
🔥 NEAR Protocol zeigt nach einer kräftigen Rallye kurzfristige Schwäche!
💰 Aktueller Kurs: $4.482
🔴 Veränderung in 24 Std.: -2.23%
🛡️ Zu beobachtende Unterstützung: $4.389
🚀 Widerstandszone: $4.70–$4.96
📊 Worauf Trader achten sollten: 🔹 Ein Halten oberhalb der Unterstützung könnte einen Erholungsversuch auslösen. 🔹 Ein Durchbruch unter die Unterstützung könnte auf weitere Verluste hindeuten. 🔹 Eine Rückeroberung der Widerstandszone könnte das bullishe Momentum verbessern#NEAR🚀🚀🚀 .
👀 Die große Frage: Ist das eine gesunde Korrektur vor der nächsten Aufwärtsbewegung oder der Beginn eines stärkeren Rücksetzers?$NEAR
💬 Wie ist eure Einschätzung? Seid ihr bei NEAR BULLISH 🟢 oder BEARISH 🔴?
👇 Teilt eure Analyse in den Kommentaren!
⚠️ HAFTUNGSAUSSCHLUSS: Dieser Beitrag dient ausschließlich Bildungszwecken und ist keine Finanzberatung. Der Handel mit Kryptowährungen ist mit erheblichen Risiken verbunden. Informiert euch vor dem Handel immer selbst und achtet auf euer Risikomanagement.
#NEAR #NEARProtocol #CryptoTrading #BinanceSquare #Altcoins
🚨 NEAR/USDT: RÜCKSETZER ODER DIE NÄCHSTE GELEGENHEIT? 📉📈
🔥 NEAR Protocol zeigt nach einer kräftigen Rallye kurzfristige Schwäche!
💰 Aktueller Kurs: $4.482
🔴 Veränderung in 24 Std.: -2.23%
🛡️ Zu beobachtende Unterstützung: $4.389
🚀 Widerstandszone: $4.70–$4.96
📊 Worauf Trader achten sollten: 🔹 Ein Halten oberhalb der Unterstützung könnte einen Erholungsversuch auslösen. 🔹 Ein Durchbruch unter die Unterstützung könnte auf weitere Verluste hindeuten. 🔹 Eine Rückeroberung der Widerstandszone könnte das bullishe Momentum verbessern#NEAR🚀🚀🚀 .
👀 Die große Frage: Ist das eine gesunde Korrektur vor der nächsten Aufwärtsbewegung oder der Beginn eines stärkeren Rücksetzers?$NEAR
💬 Wie ist eure Einschätzung? Seid ihr bei NEAR BULLISH 🟢 oder BEARISH 🔴?
👇 Teilt eure Analyse in den Kommentaren!
⚠️ HAFTUNGSAUSSCHLUSS: Dieser Beitrag dient ausschließlich Bildungszwecken und ist keine Finanzberatung. Der Handel mit Kryptowährungen ist mit erheblichen Risiken verbunden. Informiert euch vor dem Handel immer selbst und achtet auf euer Risikomanagement.
#NEAR #NEARProtocol #CryptoTrading #BinanceSquare #Altcoins
🔥 NEAR Protocol zeigt nach einer kräftigen Rallye kurzfristige Schwäche!
💰 Aktueller Kurs: $4.482
🔴 Veränderung in 24 Std.: -2.23%
🛡️ Zu beobachtende Unterstützung: $4.389
🚀 Widerstandszone: $4.70–$4.96
📊 Worauf Trader achten sollten: 🔹 Ein Halten oberhalb der Unterstützung könnte einen Erholungsversuch auslösen. 🔹 Ein Durchbruch unter die Unterstützung könnte auf weitere Verluste hindeuten. 🔹 Eine Rückeroberung der Widerstandszone könnte das bullishe Momentum verbessern#NEAR🚀🚀🚀 .
👀 Die große Frage: Ist das eine gesunde Korrektur vor der nächsten Aufwärtsbewegung oder der Beginn eines stärkeren Rücksetzers?$NEAR
💬 Wie ist eure Einschätzung? Seid ihr bei NEAR BULLISH 🟢 oder BEARISH 🔴?
👇 Teilt eure Analyse in den Kommentaren!
⚠️ HAFTUNGSAUSSCHLUSS: Dieser Beitrag dient ausschließlich Bildungszwecken und ist keine Finanzberatung. Der Handel mit Kryptowährungen ist mit erheblichen Risiken verbunden. Informiert euch vor dem Handel immer selbst und achtet auf euer Risikomanagement.
#NEAR #NEARProtocol #CryptoTrading #BinanceSquare #Altcoins
115
·
--
Übersetzung ansehen
🚨 BITCOIN AT $80,000 — WHAT HAPPENS NEXT? ₿🔥
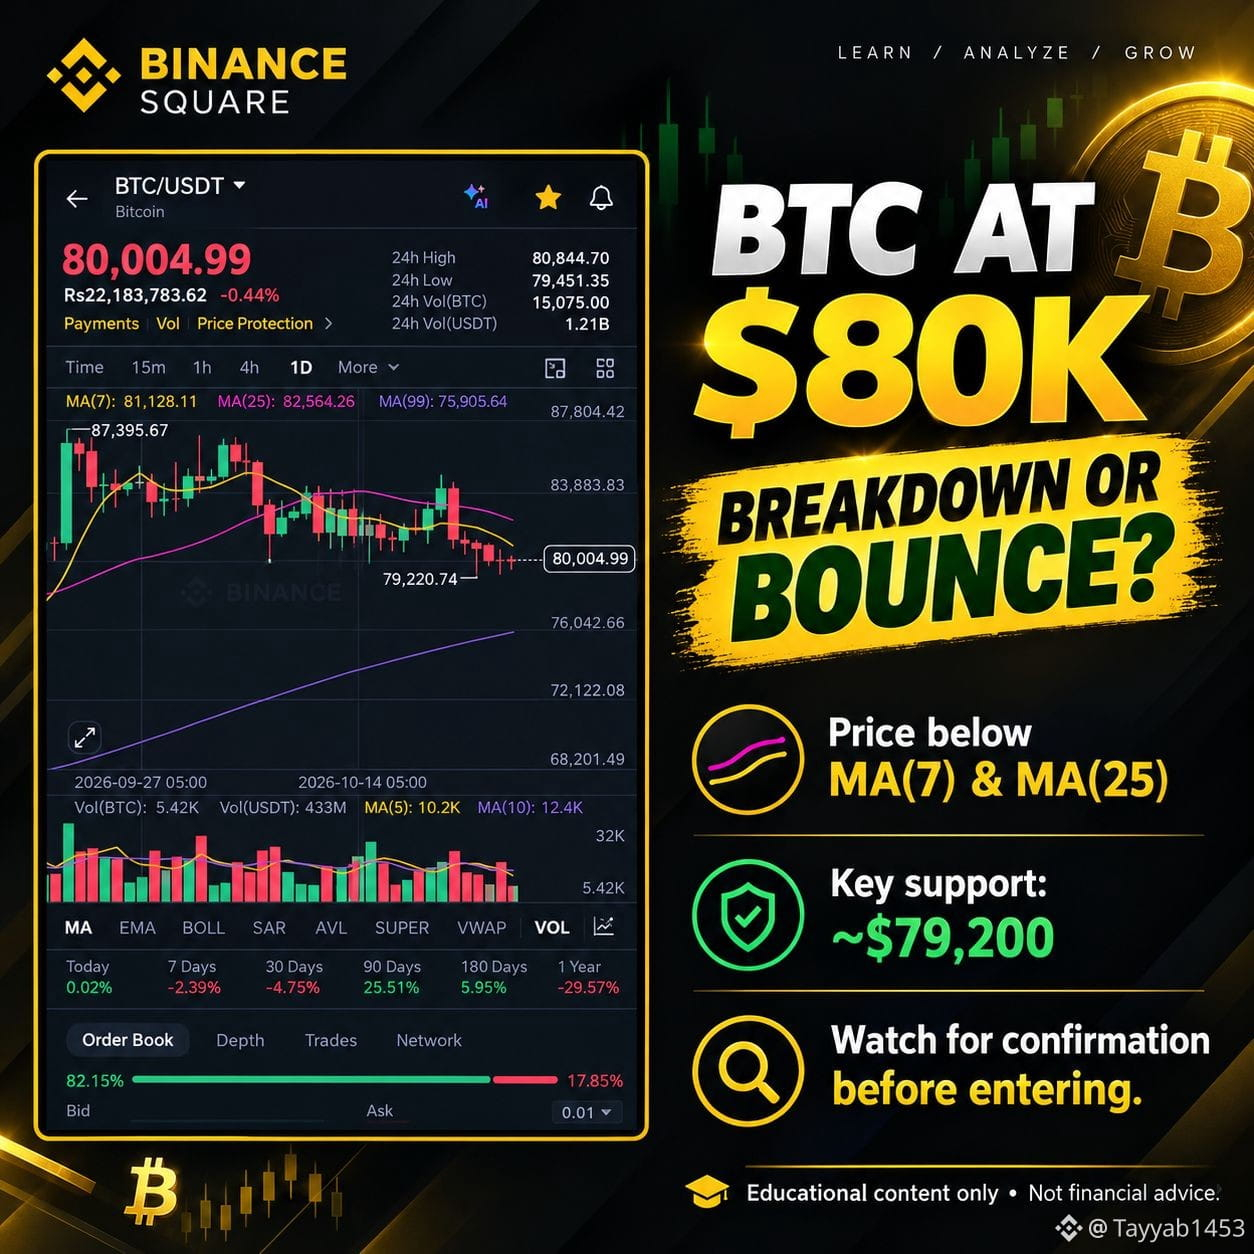
Bitcoin is trading near $80,005, and the market is at a critical point! 📉📈
🔴 Bearish Signal: BTC is below MA(7) and MA(25), showing short-term weakness.
🟢 Key Support: $79,200 — traders are watching closely to see whether buyers defend this level.#btc70k
⚡ The Big Question:$BTC
Will BTC bounce back toward $82K+, or break below support and continue falling?
👀 What traders should watch:
✅ Support and resistance levels
✅ Trading volume
✅ Confirmation before entering a trade$BTC
💬 YOUR OPINION:
Are you BULLISH 🟢 or BEARISH 🔴 on BTC?
Drop your prediction in the comments! 👇
⚠️ DISCLAIMER: This post is for educational and informational purposes only, not financial advice. Crypto trading involves significant risk. Always do your own research (DYOR) before investing.
#Bitcoin #BTC #Crypto #BinanceSquare #CryptoTrading
🚨 BITCOIN AT $80,000 — WHAT HAPPENS NEXT? ₿🔥
Bitcoin is trading near $80,005, and the market is at a critical point! 📉📈
🔴 Bearish Signal: BTC is below MA(7) and MA(25), showing short-term weakness.
🟢 Key Support: $79,200 — traders are watching closely to see whether buyers defend this level.#btc70k
⚡ The Big Question:$BTC
Will BTC bounce back toward $82K+, or break below support and continue falling?
👀 What traders should watch:
✅ Support and resistance levels
✅ Trading volume
✅ Confirmation before entering a trade$BTC
💬 YOUR OPINION:
Are you BULLISH 🟢 or BEARISH 🔴 on BTC?
Drop your prediction in the comments! 👇
⚠️ DISCLAIMER: This post is for educational and informational purposes only, not financial advice. Crypto trading involves significant risk. Always do your own research (DYOR) before investing.
#Bitcoin #BTC #Crypto #BinanceSquare #CryptoTrading
Bitcoin is trading near $80,005, and the market is at a critical point! 📉📈
🔴 Bearish Signal: BTC is below MA(7) and MA(25), showing short-term weakness.
🟢 Key Support: $79,200 — traders are watching closely to see whether buyers defend this level.#btc70k
⚡ The Big Question:$BTC
Will BTC bounce back toward $82K+, or break below support and continue falling?
👀 What traders should watch:
✅ Support and resistance levels
✅ Trading volume
✅ Confirmation before entering a trade$BTC
💬 YOUR OPINION:
Are you BULLISH 🟢 or BEARISH 🔴 on BTC?
Drop your prediction in the comments! 👇
⚠️ DISCLAIMER: This post is for educational and informational purposes only, not financial advice. Crypto trading involves significant risk. Always do your own research (DYOR) before investing.
#Bitcoin #BTC #Crypto #BinanceSquare #CryptoTrading
84
·
--
Übersetzung ansehen
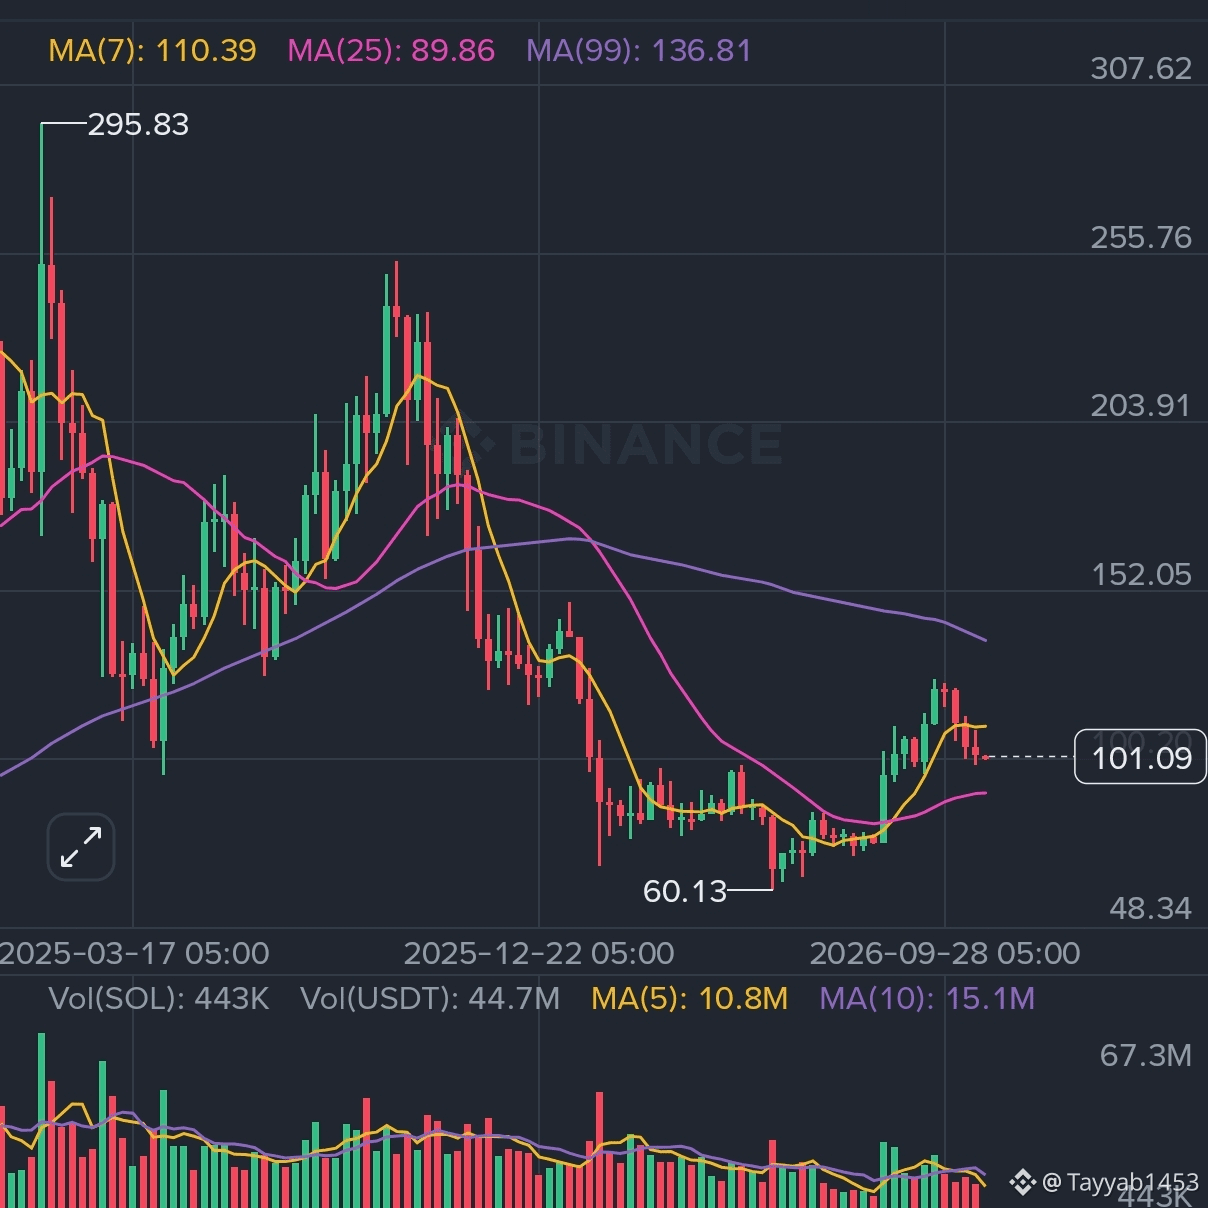
how many people waiting for $SOL to hit 60 dollar 😎
how many people waiting for $SOL to hit 60 dollar 😎
110
·
--
Übersetzung ansehen
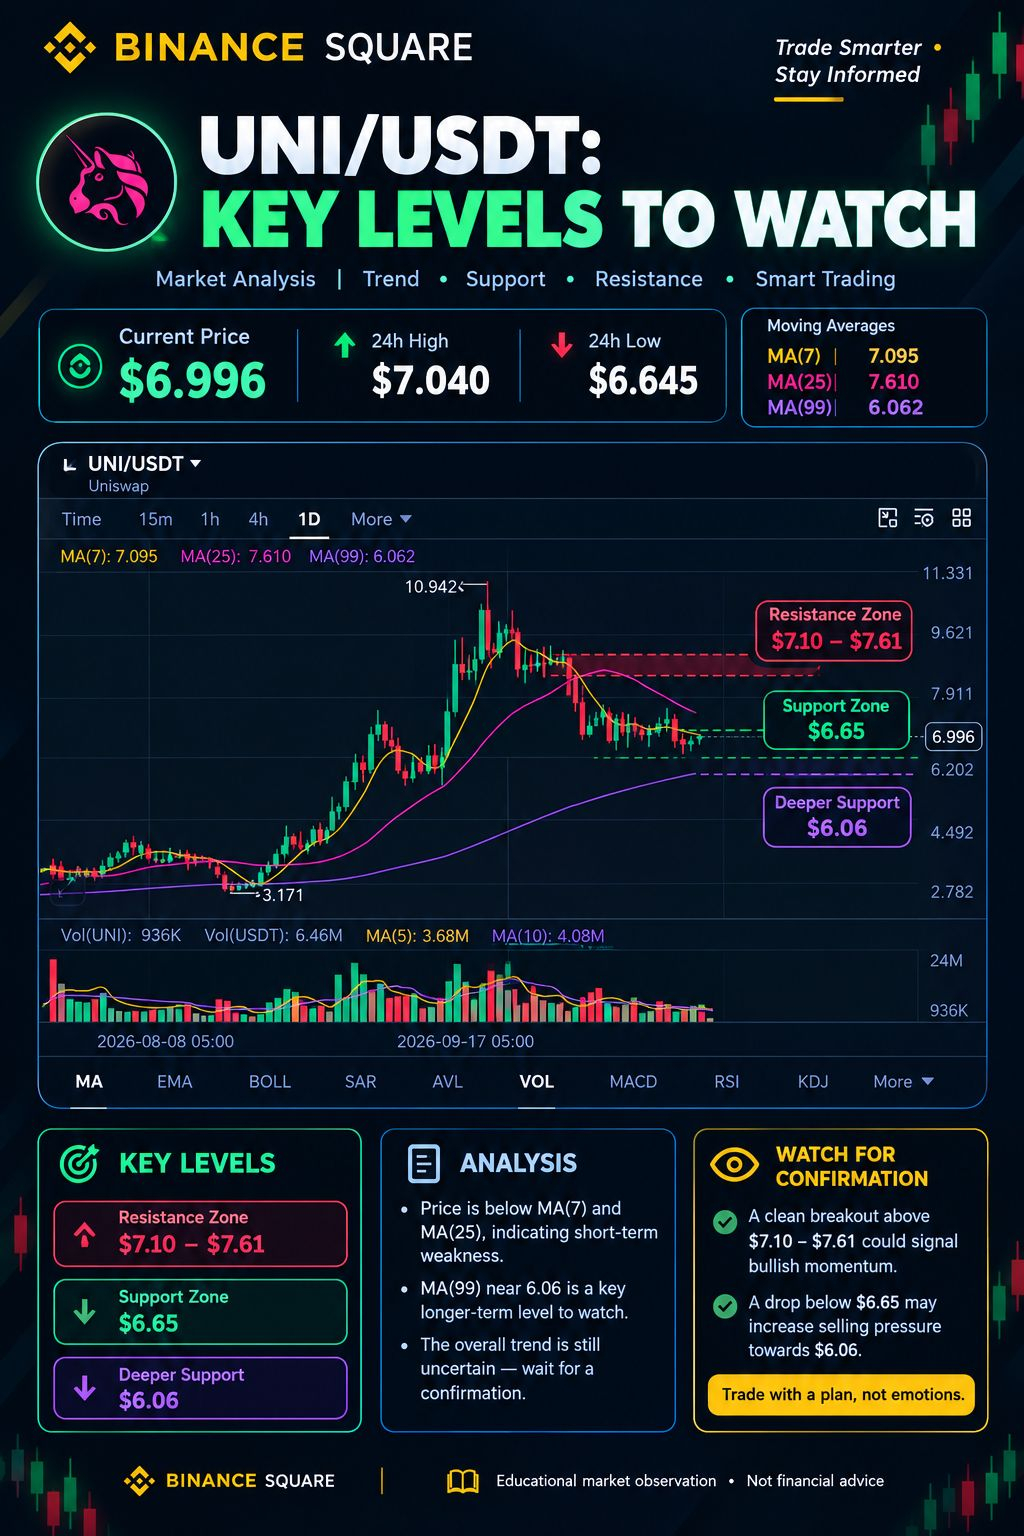
🚨 UNI/USDT: REVERSAL OR MORE DOWNSIDE? 👀
💰 Current Price: $6.996
📈 24H High: $7.040
📉 24H Low: $6.645
🔍 KEY LEVELS TO WATCH
🔴 Resistance Zone: $7.10–$7.61
🟢 Support: $6.65
🟣 Major Support: $6.06
📊 What Does the Chart Suggest?
• UNI is trading below MA(7) and MA(25), indicating short-term weakness.
• A confirmed breakout above resistance could strengthen bullish mmomentum #UNI
• Losing $6.65 could expose the price to further downside toward $6.06.
🎯 TRADERS, WHAT'S YOUR MOVE?
🐂 Bulls: Waiting for a breakout?
🐻 Bears: Expecting another dip?$UNI
💬 Comment your target below! 👇
Are you buying UNI or waiting for confirmation?
🔔 Follow for more crypto market analysis!
⚠️ DISCLAIMER: This post is for educational purposes only and is not financial advice. Cryptocurrency trading involves significant risk. Always conduct your own research (DYOR) before making investment decisions.
#UNI #Uniswap #CryptoTrading #BinanceSquare #TechnicalAnalysis #Altcoins
🚨 UNI/USDT: REVERSAL OR MORE DOWNSIDE? 👀
💰 Current Price: $6.996
📈 24H High: $7.040
📉 24H Low: $6.645
🔍 KEY LEVELS TO WATCH
🔴 Resistance Zone: $7.10–$7.61
🟢 Support: $6.65
🟣 Major Support: $6.06
📊 What Does the Chart Suggest?
• UNI is trading below MA(7) and MA(25), indicating short-term weakness.
• A confirmed breakout above resistance could strengthen bullish mmomentum #UNI
• Losing $6.65 could expose the price to further downside toward $6.06.
🎯 TRADERS, WHAT'S YOUR MOVE?
🐂 Bulls: Waiting for a breakout?
🐻 Bears: Expecting another dip?$UNI
💬 Comment your target below! 👇
Are you buying UNI or waiting for confirmation?
🔔 Follow for more crypto market analysis!
⚠️ DISCLAIMER: This post is for educational purposes only and is not financial advice. Cryptocurrency trading involves significant risk. Always conduct your own research (DYOR) before making investment decisions.
#UNI #Uniswap #CryptoTrading #BinanceSquare #TechnicalAnalysis #Altcoins
💰 Current Price: $6.996
📈 24H High: $7.040
📉 24H Low: $6.645
🔍 KEY LEVELS TO WATCH
🔴 Resistance Zone: $7.10–$7.61
🟢 Support: $6.65
🟣 Major Support: $6.06
📊 What Does the Chart Suggest?
• UNI is trading below MA(7) and MA(25), indicating short-term weakness.
• A confirmed breakout above resistance could strengthen bullish mmomentum #UNI
• Losing $6.65 could expose the price to further downside toward $6.06.
🎯 TRADERS, WHAT'S YOUR MOVE?
🐂 Bulls: Waiting for a breakout?
🐻 Bears: Expecting another dip?$UNI
💬 Comment your target below! 👇
Are you buying UNI or waiting for confirmation?
🔔 Follow for more crypto market analysis!
⚠️ DISCLAIMER: This post is for educational purposes only and is not financial advice. Cryptocurrency trading involves significant risk. Always conduct your own research (DYOR) before making investment decisions.
#UNI #Uniswap #CryptoTrading #BinanceSquare #TechnicalAnalysis #Altcoins
83
·
--
Übersetzung ansehen
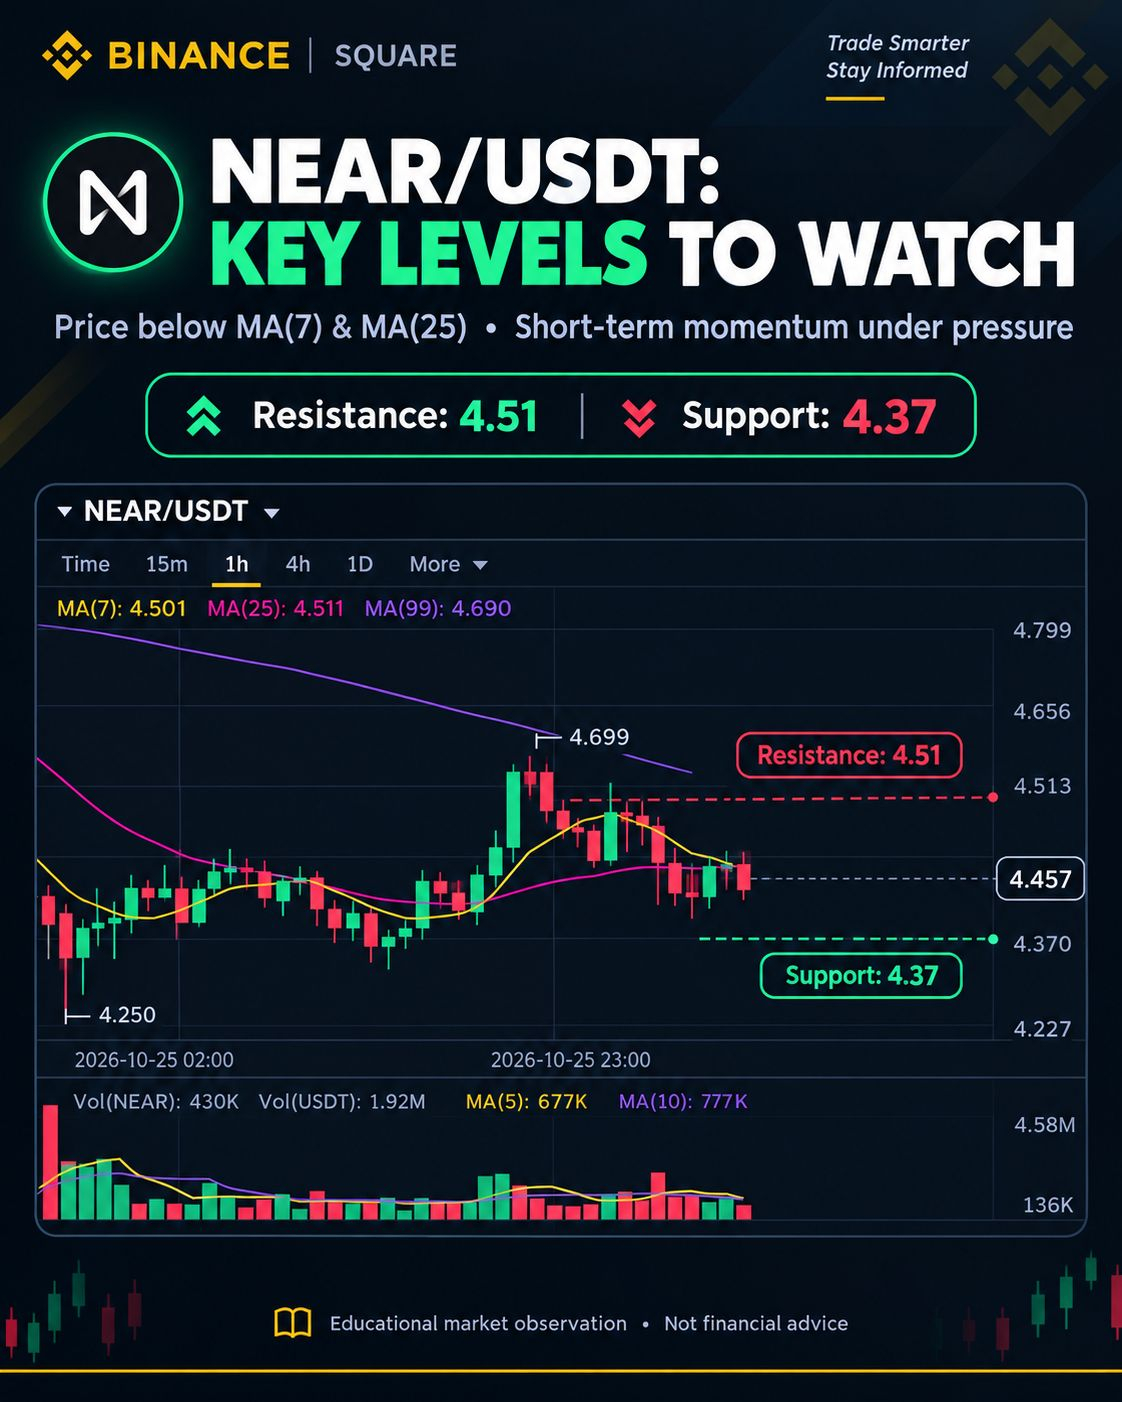
🚨 NEAR/USDT: A KEY MOMENT FOR TRADERS! 📉📈
💰 Current Price: $4.457
🟢 Resistance: $4.51
🔴 Support: $4.37
📊 What Does the Chart Tell Us? 🔸 Price is currently below MA(7) and MA(25), suggesting short-term weakness. 🔸 A breakout above $4.51 could signal a potential bullish move. 🔸 A drop below $4.37 may increase selling pressure.
🎯 What’s Your Strategy? 🐂 Bulls: Waiting for a confirmed breakout? 🐻 Bears: Watching for a support breakdown?#Near
💬 Comment below: Are you bullish or bearish on NEAR? 👇$NEAR
🔔 Follow for more crypto chart analysis and trading insights!$NEAR
⚠️ DISCLAIMER: This post is for educational and informational purposes only. It is not financial or investment advice. Cryptocurrency trading involves significant risk. Always DYOR (Do Your Own Research) before trading.
#NEAR #NEARProtocol #CryptoTrading #BinanceSquare #TechnicalAnalysis #CryptoMarket
🚨 NEAR/USDT: A KEY MOMENT FOR TRADERS! 📉📈
💰 Current Price: $4.457
🟢 Resistance: $4.51
🔴 Support: $4.37
📊 What Does the Chart Tell Us? 🔸 Price is currently below MA(7) and MA(25), suggesting short-term weakness. 🔸 A breakout above $4.51 could signal a potential bullish move. 🔸 A drop below $4.37 may increase selling pressure.
🎯 What’s Your Strategy? 🐂 Bulls: Waiting for a confirmed breakout? 🐻 Bears: Watching for a support breakdown?#Near
💬 Comment below: Are you bullish or bearish on NEAR? 👇$NEAR
🔔 Follow for more crypto chart analysis and trading insights!$NEAR
⚠️ DISCLAIMER: This post is for educational and informational purposes only. It is not financial or investment advice. Cryptocurrency trading involves significant risk. Always DYOR (Do Your Own Research) before trading.
#NEAR #NEARProtocol #CryptoTrading #BinanceSquare #TechnicalAnalysis #CryptoMarket
💰 Current Price: $4.457
🟢 Resistance: $4.51
🔴 Support: $4.37
📊 What Does the Chart Tell Us? 🔸 Price is currently below MA(7) and MA(25), suggesting short-term weakness. 🔸 A breakout above $4.51 could signal a potential bullish move. 🔸 A drop below $4.37 may increase selling pressure.
🎯 What’s Your Strategy? 🐂 Bulls: Waiting for a confirmed breakout? 🐻 Bears: Watching for a support breakdown?#Near
💬 Comment below: Are you bullish or bearish on NEAR? 👇$NEAR
🔔 Follow for more crypto chart analysis and trading insights!$NEAR
⚠️ DISCLAIMER: This post is for educational and informational purposes only. It is not financial or investment advice. Cryptocurrency trading involves significant risk. Always DYOR (Do Your Own Research) before trading.
#NEAR #NEARProtocol #CryptoTrading #BinanceSquare #TechnicalAnalysis #CryptoMarket
211

·
--
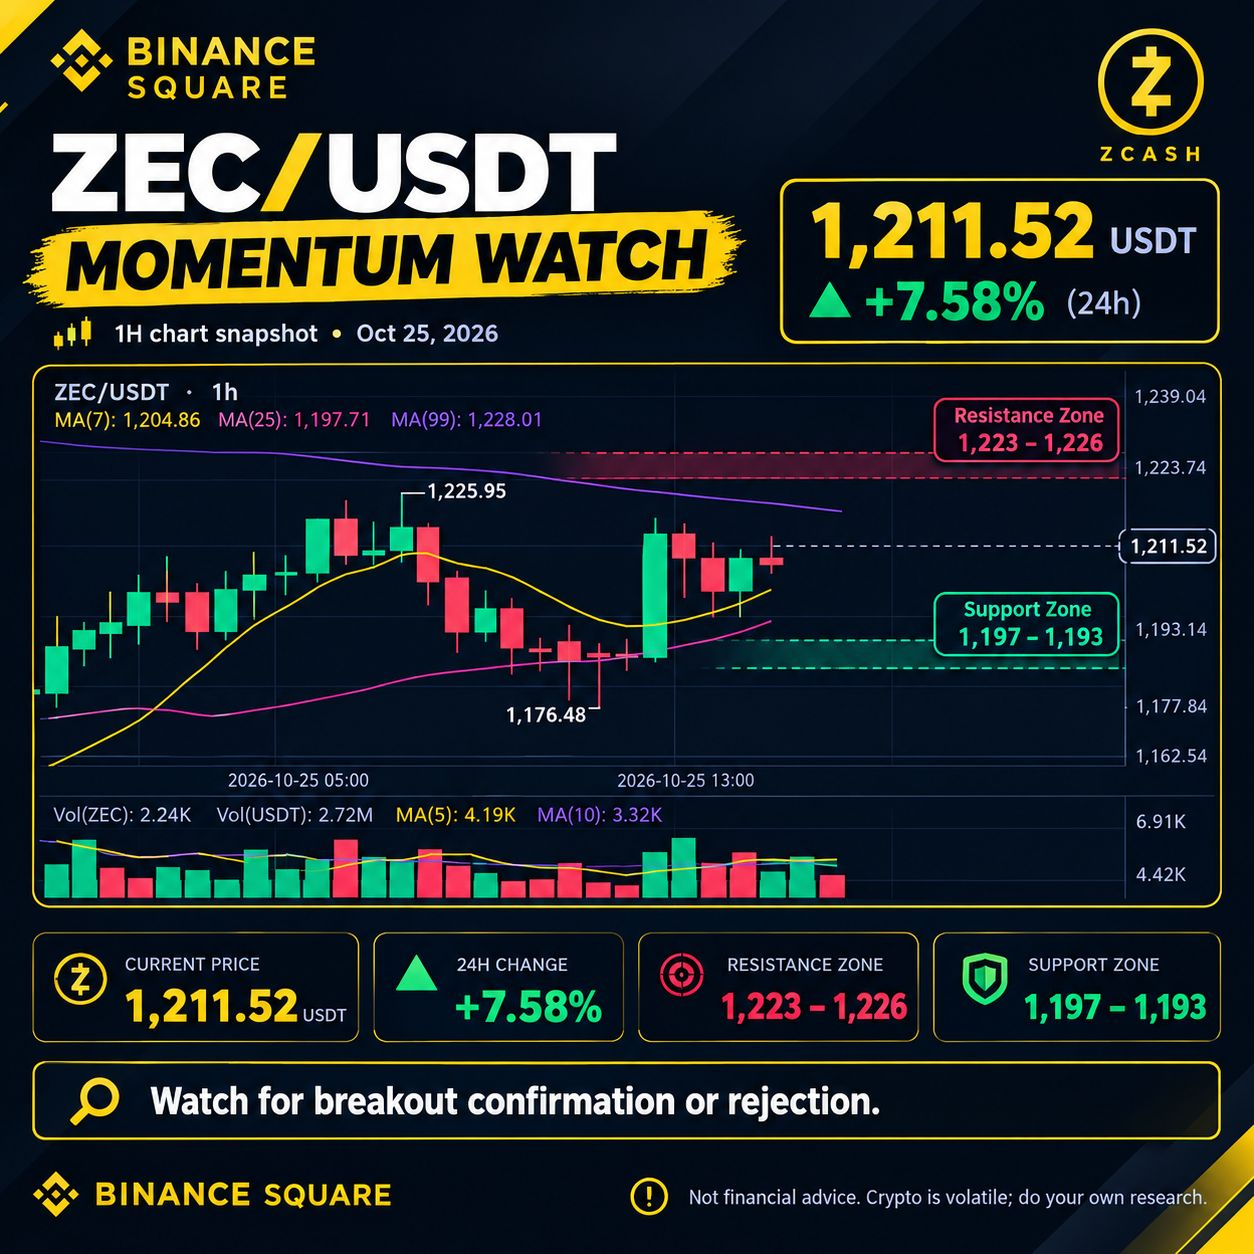
🚀 ZEC/USDT: AUFWÄRTSDYNAMIK — WIE GEHT ES WEITER? 📈
🔥 Zcash zeigt eine starke Dynamik und verzeichnet im Chart-Ausschnitt innerhalb von 24 Stunden ein Plus von 7,58 %.
📊 Wichtige Kursmarken:
🟢 Unterstützungszone: 1.197–1.193 USDT
🔴 Widerstandszone: 1.223–1.226 USDT
💰 Kurs im Ausschnitt: 1.211,52 USDT
🎯 Auf der Watchlist:
✅ Ein bestätigter Ausbruch über den Widerstand könnte auf weiteres Aufwärtspotenzial hindeuten.
⚠️ Eine Zurückweisung am Widerstand könnte zu einem Rücksetzer in Richtung Unterstützung führen.
📉 Beobachte das Handelsvolumen und achte auf eine Bestätigung durch die Candlesticks, bevor du eine Entscheidung triffst.$ZEC
💬 Wie schätzt du die Lage ein?
🐂 BULLISCH — ZEC durchbricht den Widerstand!
🐻 BÄRISCH — ZEC fällt in Richtung Unterstützung!
👇 Teile deine Analyse in den Kommentaren!#ZECASHUSDT
⚠️ HAFTUNGSAUSSCHLUSS: Dieser Beitrag dient ausschließlich Bildungszwecken und ist keine Finanzberatung. Der Handel mit Kryptowährungen ist mit erheblichen Risiken verbunden. Kurse ändern sich schnell. Informiere dich vor dem Handel selbst (DYOR).
#BinanceSquare #ZEC #Zcash #CryptoTrading #TechnicalAnalysis #Altcoins
🚀 ZEC/USDT: AUFWÄRTSDYNAMIK — WIE GEHT ES WEITER? 📈
🔥 Zcash zeigt eine starke Dynamik und verzeichnet im Chart-Ausschnitt innerhalb von 24 Stunden ein Plus von 7,58 %.
📊 Wichtige Kursmarken:
🟢 Unterstützungszone: 1.197–1.193 USDT
🔴 Widerstandszone: 1.223–1.226 USDT
💰 Kurs im Ausschnitt: 1.211,52 USDT
🎯 Auf der Watchlist:
✅ Ein bestätigter Ausbruch über den Widerstand könnte auf weiteres Aufwärtspotenzial hindeuten.
⚠️ Eine Zurückweisung am Widerstand könnte zu einem Rücksetzer in Richtung Unterstützung führen.
📉 Beobachte das Handelsvolumen und achte auf eine Bestätigung durch die Candlesticks, bevor du eine Entscheidung triffst.$ZEC
💬 Wie schätzt du die Lage ein?
🐂 BULLISCH — ZEC durchbricht den Widerstand!
🐻 BÄRISCH — ZEC fällt in Richtung Unterstützung!
👇 Teile deine Analyse in den Kommentaren!#ZECASHUSDT
⚠️ HAFTUNGSAUSSCHLUSS: Dieser Beitrag dient ausschließlich Bildungszwecken und ist keine Finanzberatung. Der Handel mit Kryptowährungen ist mit erheblichen Risiken verbunden. Kurse ändern sich schnell. Informiere dich vor dem Handel selbst (DYOR).
#BinanceSquare #ZEC #Zcash #CryptoTrading #TechnicalAnalysis #Altcoins
🔥 Zcash zeigt eine starke Dynamik und verzeichnet im Chart-Ausschnitt innerhalb von 24 Stunden ein Plus von 7,58 %.
📊 Wichtige Kursmarken:
🟢 Unterstützungszone: 1.197–1.193 USDT
🔴 Widerstandszone: 1.223–1.226 USDT
💰 Kurs im Ausschnitt: 1.211,52 USDT
🎯 Auf der Watchlist:
✅ Ein bestätigter Ausbruch über den Widerstand könnte auf weiteres Aufwärtspotenzial hindeuten.
⚠️ Eine Zurückweisung am Widerstand könnte zu einem Rücksetzer in Richtung Unterstützung führen.
📉 Beobachte das Handelsvolumen und achte auf eine Bestätigung durch die Candlesticks, bevor du eine Entscheidung triffst.$ZEC
💬 Wie schätzt du die Lage ein?
🐂 BULLISCH — ZEC durchbricht den Widerstand!
🐻 BÄRISCH — ZEC fällt in Richtung Unterstützung!
👇 Teile deine Analyse in den Kommentaren!#ZECASHUSDT
⚠️ HAFTUNGSAUSSCHLUSS: Dieser Beitrag dient ausschließlich Bildungszwecken und ist keine Finanzberatung. Der Handel mit Kryptowährungen ist mit erheblichen Risiken verbunden. Kurse ändern sich schnell. Informiere dich vor dem Handel selbst (DYOR).
#BinanceSquare #ZEC #Zcash #CryptoTrading #TechnicalAnalysis #Altcoins
282
·
--
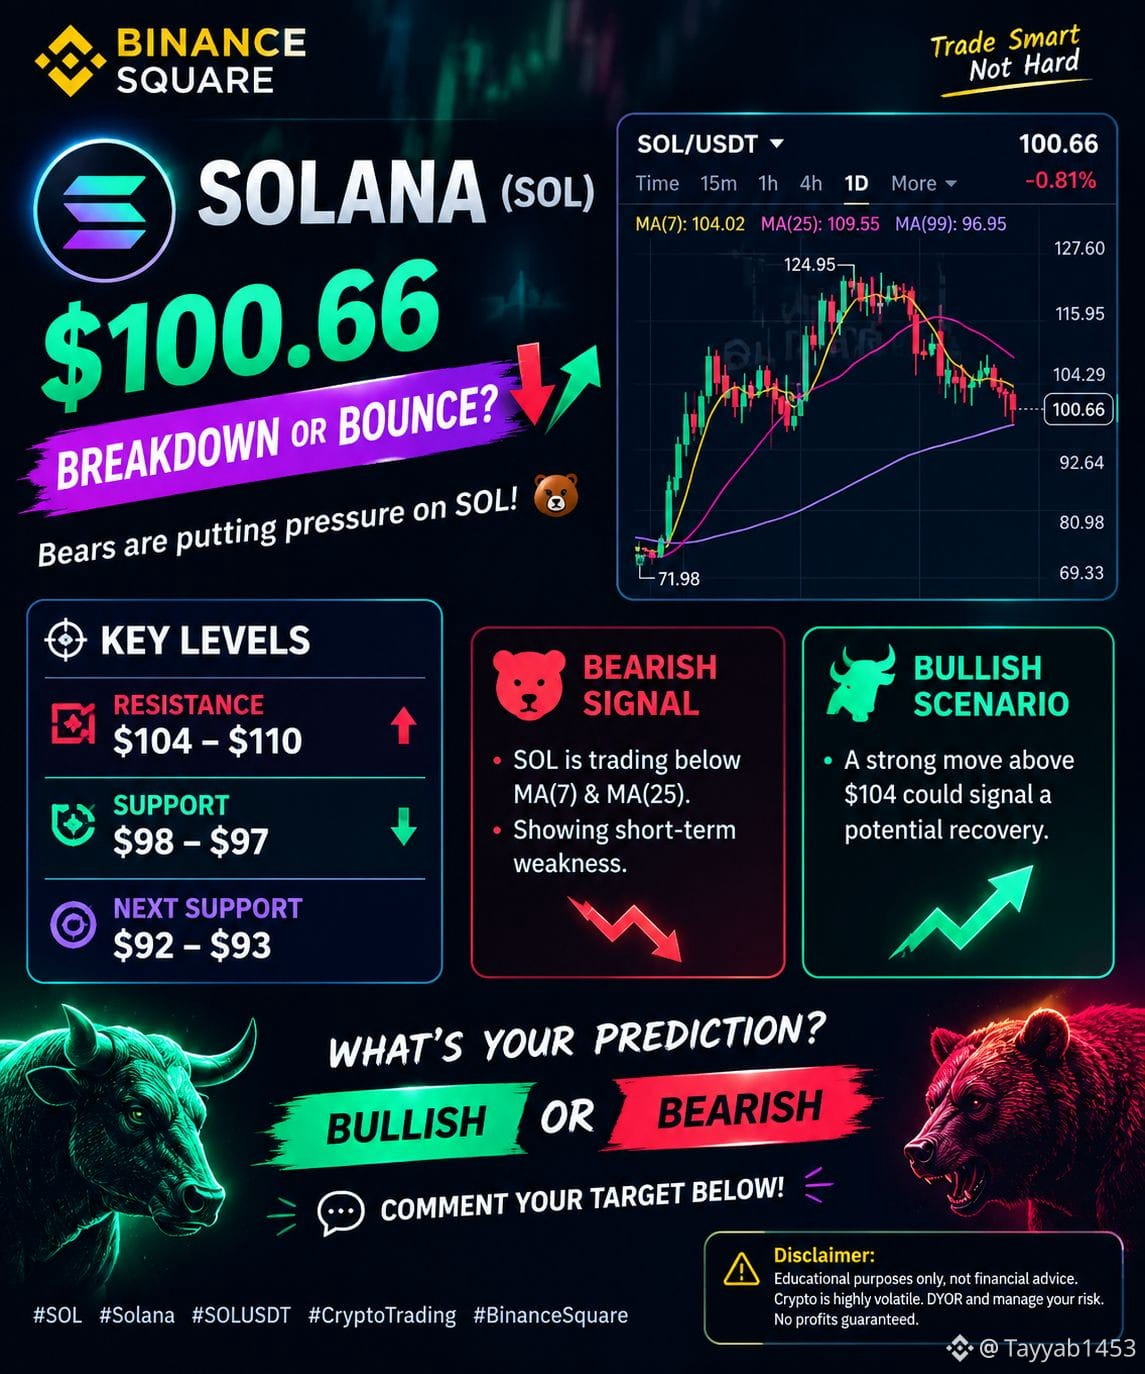
#solana 🚨 SOLANA (SOL) — $100.66 | ABVERKAUF ODER ERHOLUNG? 📉📈
🐻 Die Bären setzen SOL unter Druck!
📊 Wichtige Kursmarken:
🔴 Widerstand: $104–$110
🟢 Unterstützung: $98–$97
🎯 Nächste Unterstützung: $92–$93
📉 Bärisches Signal: SOL notiert unter MA(7) und MA(25), was auf kurzfristige Schwäche hindeutet.
🚀 Bullisches Szenario: Ein starker Anstieg über $104 könnte eine mögliche Erholung signalisieren.
🔥 Was ist eure Prognose?
🐂 BULLISCH oder 🐻 BÄRISCH?
💬 Schreibt euer Kursziel unten in die Kommentare!$SOL
#SOL #Solana #SOLUSDT #KryptoTrading #BinanceSquare
⚠️ Haftungsausschluss: Nur zu Bildungszwecken, keine Finanzberatung. Kryptowährungen sind sehr volatil. Informiert euch selbst und steuert euer Risiko. Keine Gewinne garantiert.$SOL
#solana 🚨 SOLANA (SOL) — $100.66 | ABVERKAUF ODER ERHOLUNG? 📉📈
🐻 Die Bären setzen SOL unter Druck!
📊 Wichtige Kursmarken:
🔴 Widerstand: $104–$110
🟢 Unterstützung: $98–$97
🎯 Nächste Unterstützung: $92–$93
📉 Bärisches Signal: SOL notiert unter MA(7) und MA(25), was auf kurzfristige Schwäche hindeutet.
🚀 Bullisches Szenario: Ein starker Anstieg über $104 könnte eine mögliche Erholung signalisieren.
🔥 Was ist eure Prognose?
🐂 BULLISCH oder 🐻 BÄRISCH?
💬 Schreibt euer Kursziel unten in die Kommentare!$SOL
#SOL #Solana #SOLUSDT #KryptoTrading #BinanceSquare
⚠️ Haftungsausschluss: Nur zu Bildungszwecken, keine Finanzberatung. Kryptowährungen sind sehr volatil. Informiert euch selbst und steuert euer Risiko. Keine Gewinne garantiert.$SOL
🐻 Die Bären setzen SOL unter Druck!
📊 Wichtige Kursmarken:
🔴 Widerstand: $104–$110
🟢 Unterstützung: $98–$97
🎯 Nächste Unterstützung: $92–$93
📉 Bärisches Signal: SOL notiert unter MA(7) und MA(25), was auf kurzfristige Schwäche hindeutet.
🚀 Bullisches Szenario: Ein starker Anstieg über $104 könnte eine mögliche Erholung signalisieren.
🔥 Was ist eure Prognose?
🐂 BULLISCH oder 🐻 BÄRISCH?
💬 Schreibt euer Kursziel unten in die Kommentare!$SOL
#SOL #Solana #SOLUSDT #KryptoTrading #BinanceSquare
⚠️ Haftungsausschluss: Nur zu Bildungszwecken, keine Finanzberatung. Kryptowährungen sind sehr volatil. Informiert euch selbst und steuert euer Risiko. Keine Gewinne garantiert.$SOL
117
·
--
🚨 BITCOIN (BTC) BEI $80,421 — STEHT EIN GROẞER KURSBEWEGUNG BEVOR? 📉📈🔥 BTC/USDT-Marktübersicht | Tageschart
Bitcoin zeigt nach dem Rückgang von seinem jüngsten Hoch bei $87,395 Anzeichen kurzfristiger Schwäche. Bullen und Bären kämpfen um die Kontrolle! 🐂🐻
📊 Wichtige technische Niveaus: 🔴 Widerstand 1: $81,850
🔴 Widerstand 2: $82,945–$83,200
🟢 Unterstützung 1: $79,200–$77,700
🟢 Starke Unterstützung: etwa $75,600
📉 Bärische Signale: • BTC wird unter seinem 7-Tage- und 25-Tage-Durchschnitt gehandelt. • Das kurzfristige Momentum wirkt schwach. • Verkäufer könnten den Kurs in Richtung der Unterstützungszone bei $79K–$77.7K drücken.
🚨 BITCOIN (BTC) BEI $80,421 — STEHT EIN GROẞER KURSBEWEGUNG BEVOR? 📉📈
🔥 BTC/USDT-Marktübersicht | Tageschart
Bitcoin zeigt nach dem Rückgang von seinem jüngsten Hoch bei $87,395 Anzeichen kurzfristiger Schwäche. Bullen und Bären kämpfen um die Kontrolle! 🐂🐻
📊 Wichtige technische Niveaus: 🔴 Widerstand 1: $81,850
🔴 Widerstand 2: $82,945–$83,200
🟢 Unterstützung 1: $79,200–$77,700
🟢 Starke Unterstützung: etwa $75,600
📉 Bärische Signale: • BTC wird unter seinem 7-Tage- und 25-Tage-Durchschnitt gehandelt. • Das kurzfristige Momentum wirkt schwach. • Verkäufer könnten den Kurs in Richtung der Unterstützungszone bei $79K–$77.7K drücken.
Bitcoin zeigt nach dem Rückgang von seinem jüngsten Hoch bei $87,395 Anzeichen kurzfristiger Schwäche. Bullen und Bären kämpfen um die Kontrolle! 🐂🐻
📊 Wichtige technische Niveaus: 🔴 Widerstand 1: $81,850
🔴 Widerstand 2: $82,945–$83,200
🟢 Unterstützung 1: $79,200–$77,700
🟢 Starke Unterstützung: etwa $75,600
📉 Bärische Signale: • BTC wird unter seinem 7-Tage- und 25-Tage-Durchschnitt gehandelt. • Das kurzfristige Momentum wirkt schwach. • Verkäufer könnten den Kurs in Richtung der Unterstützungszone bei $79K–$77.7K drücken.
76
Anmelden und weiter Inhalte entdecken
Krypto-Nutzer weltweit auf Binance Square kennenlernen
⚡️ Bleib in Sachen Krypto stets am Puls.
💬 Die weltgrößte Kryptobörse vertraut darauf.
👍 Erhalte verlässliche Einblicke von verifizierten Creators.
E-Mail-Adresse/Telefonnummer
Trendthemen
BinanceProcesses$4.65BWithdrawals
38,337 Aufrufe
147 Kommentare
Binance verarbeitet nach Wiederaufnahme Auszahlungen in Höhe von 4,65 Milliarden US-Dollar – Nettoabfluss von 3,64 Milliarden US-Dollar entspricht 2,1 % der Vermögenswerte im Wert von 171 Milliarden US-Dollar
Binance News
·51 Likes
·15.8k Aufrufe
WithdrawalsBack: 15 networks live
9,295 Aufrufe
139 Kommentare
BrazilVirtualAssetLicenseDeadlineDrawsAbout40Firms
537 Aufrufe
44 Kommentare