

Abdul Wahab okz
18 Beiträge

Abdul Wahab okz
Melden
Nutzer blockieren
Trade eröffnen
Gelegenheitstrader
2.9 Jahre
6 Following
31 Follower
29 Like gegeben
Beiträge
Portfolio
Übersetzung ansehen
$SOL
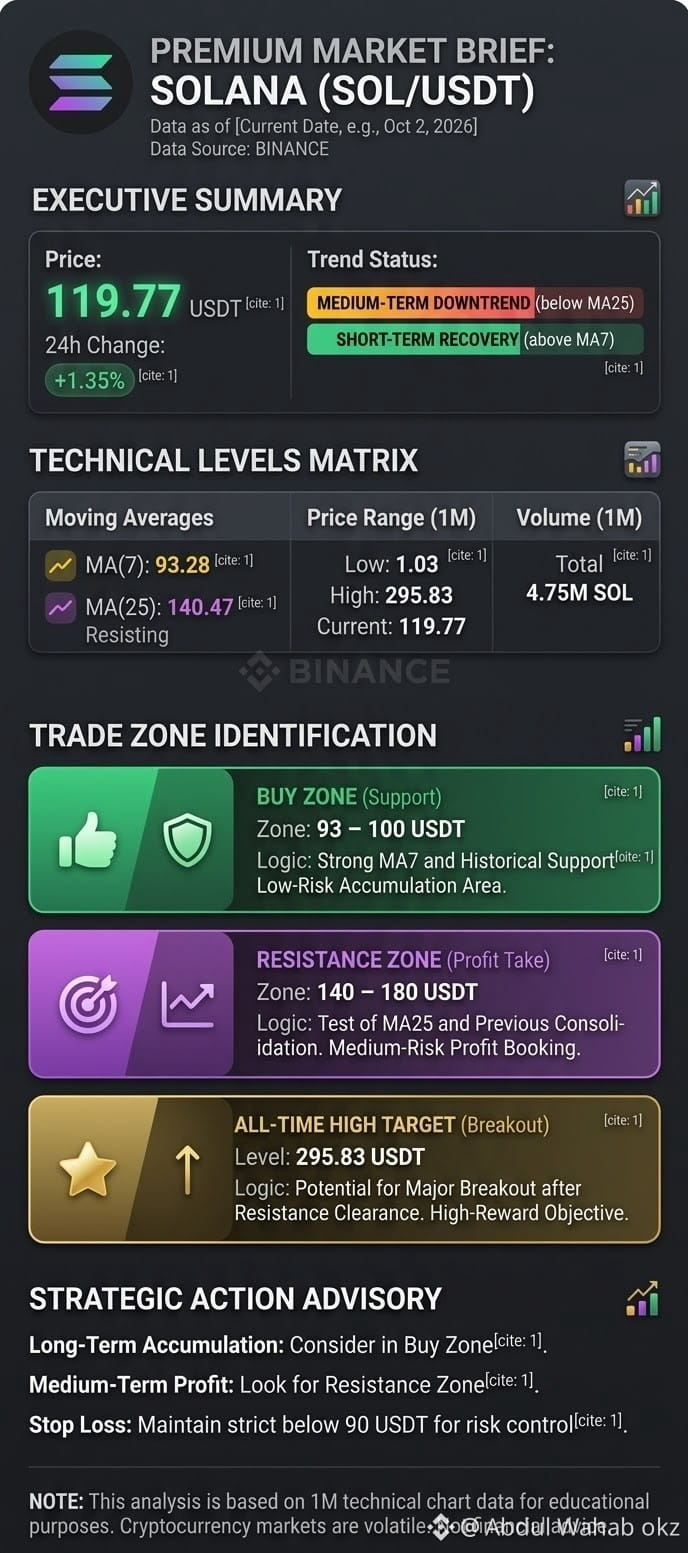
When to take an Up Trade (Long / Buy)
If you want to buy, there are two ideal setups:
On Breakout Strategy:
When? When the SOL price moves above $141 and closes a 4-hour or 1-day candle above it.
Why? There is strong resistance at $140.47 (MA 25). A breakout above this level confirms strong buyers (bulls) pushing the price towards $180 – $200.
On Dip / Support Strategy:
When? If the price drops into the $93 – $100 zone.
Why? Strong support exists around $93.28 (MA 7). Buying here offers a low-risk entry.
2. When to take a Down Trade (Short / Sell)
If you want to sell or open a short trade:
On Resistance Rejection:
When? If the price reaches the $140 – $141 resistance area and faces repeated rejections (failing to break through).
Target: $117 first, followed by $100.
On Support Breakdown:
When? If the price breaks down below the current $117 support level.
Target: $93.
Final Advice
Current Price ($119.77): The price is right in the middle. Taking a trade here is risky because it can move in either direction.
Best Strategy: Either wait for the price to break above $141 or wait for a pullback to $93 – $100. #SolanaUSTD
{spot}(SOLUSDT)
$SOL
When to take an Up Trade (Long / Buy)
If you want to buy, there are two ideal setups:
On Breakout Strategy:
When? When the SOL price moves above $141 and closes a 4-hour or 1-day candle above it.
Why? There is strong resistance at $140.47 (MA 25). A breakout above this level confirms strong buyers (bulls) pushing the price towards $180 – $200.
On Dip / Support Strategy:
When? If the price drops into the $93 – $100 zone.
Why? Strong support exists around $93.28 (MA 7). Buying here offers a low-risk entry.
2. When to take a Down Trade (Short / Sell)
If you want to sell or open a short trade:
On Resistance Rejection:
When? If the price reaches the $140 – $141 resistance area and faces repeated rejections (failing to break through).
Target: $117 first, followed by $100.
On Support Breakdown:
When? If the price breaks down below the current $117 support level.
Target: $93.
Final Advice
Current Price ($119.77): The price is right in the middle. Taking a trade here is risky because it can move in either direction.
Best Strategy: Either wait for the price to break above $141 or wait for a pullback to $93 – $100. #SolanaUSTD
When to take an Up Trade (Long / Buy)
If you want to buy, there are two ideal setups:
On Breakout Strategy:
When? When the SOL price moves above $141 and closes a 4-hour or 1-day candle above it.
Why? There is strong resistance at $140.47 (MA 25). A breakout above this level confirms strong buyers (bulls) pushing the price towards $180 – $200.
On Dip / Support Strategy:
When? If the price drops into the $93 – $100 zone.
Why? Strong support exists around $93.28 (MA 7). Buying here offers a low-risk entry.
2. When to take a Down Trade (Short / Sell)
If you want to sell or open a short trade:
On Resistance Rejection:
When? If the price reaches the $140 – $141 resistance area and faces repeated rejections (failing to break through).
Target: $117 first, followed by $100.
On Support Breakdown:
When? If the price breaks down below the current $117 support level.
Target: $93.
Final Advice
Current Price ($119.77): The price is right in the middle. Taking a trade here is risky because it can move in either direction.
Best Strategy: Either wait for the price to break above $141 or wait for a pullback to $93 – $100. #SolanaUSTD
83
·
--
Bullisch
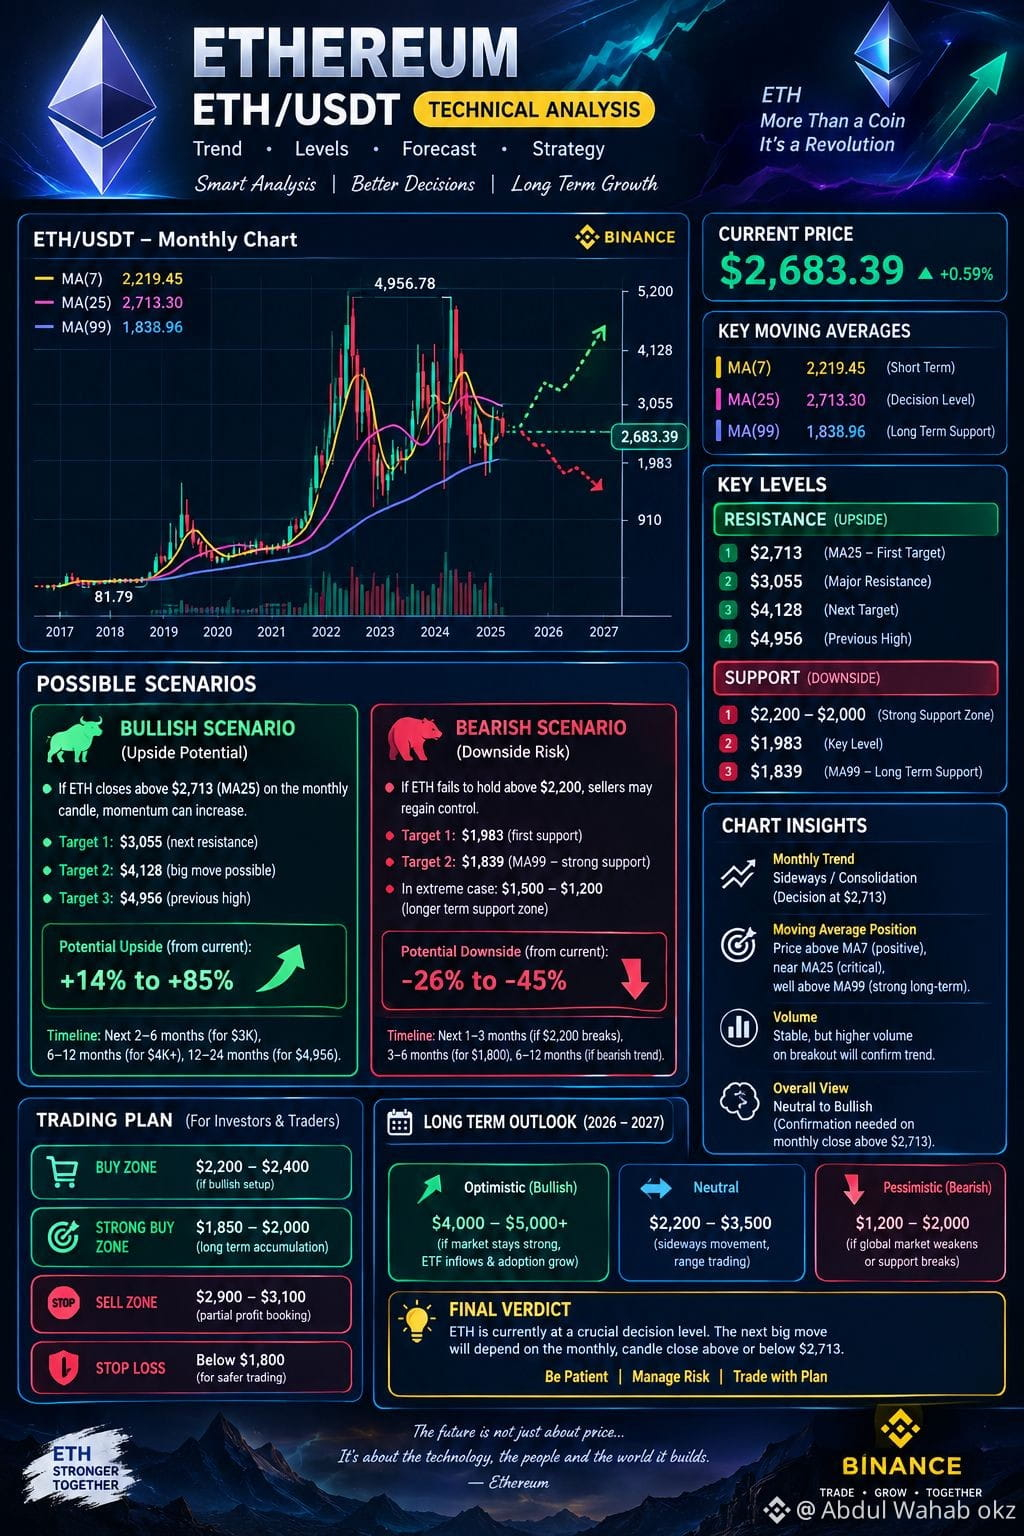
$ETH Ethereum befindet sich derzeit eher in einer Konsolidierungs-/Erholungsphase als in einem klaren einseitigen Trend.
Aktuelle Daten zeigen, dass ETH in den letzten Monat ungefähr 12–15% gewonnen hat, aber der kurzfristige Schwung hat um den Bereich von 2.700–2.800 US-Dollar begonnen zu verlangsamen. �
Coinlib +1
Die wichtigste kurzfristige Frage ist:
Kann ETH über 2.800 US-Dollar ausbrechen und dort halten?
Ein nachhaltiger Anstieg über diesen Bereich würde das bullische Szenario stärken. Eine Zurückweisung dort könnte ETH zurück in Richtung seiner Unterstützungszonen schicken.
📈 Bullisches Szenario
2.800 → 3.000
Dies ist das erste größere Aufwärtsszenario.
Aktuelle technische Einschätzungen beobachten ebenfalls den Widerstand bei 2.800 US-Dollar; ein erfolgreicher Ausbruch könnte den Weg in Richtung 3.000 freimachen. �
CoinMarketCap +1
Wenn ETH 2.800 US-Dollar mit starkem Volumen durchbricht und es als Unterstützung hält:
Möglicher Verlauf:
2.800 → 2.900 → 3.000 → 3.050
Der Bereich 3.000–3.100 könnte eine weitere Phase der Gewinnmitnahmen oder Konsolidierung auslösen.
Über 3.100
Wenn ETH sich oberhalb von ungefähr 3.050–3.100 etabliert, werden die nächsten wichtigen technischen Bereiche aus deinem Monatschart ungefähr:
3.500
4.100
4.956 — das vorherige große Hoch in deinem Chart
Das sind Szenario-Level, keine garantierten Kursziele.
📉 Bärisches Szenario
Wenn ETH wiederholt im Bereich von 2.750–2.800 scheitert und Bitcoin bzw. die allgemeine Krypto-Stimmung schwächer wird, könnte ETH einen Rücksetzer erleben.
Erste Unterstützung: 2.500–2.600
Das ist derzeit einer der wichtigen kurzfristigen Bereiche, die es zu beobachten gilt. CMCs aktuelle Analyse identifiziert außerdem ungefähr 2.500 als kurzfristige Unterstützung und 2.800 als Widerstand.#BitcoinFundingRateTriplesTo10% #ETH🔥🔥🔥🔥🔥🔥
{spot}(ETHUSDT)
$ETH Ethereum befindet sich derzeit eher in einer Konsolidierungs-/Erholungsphase als in einem klaren einseitigen Trend.
Aktuelle Daten zeigen, dass ETH in den letzten Monat ungefähr 12–15% gewonnen hat, aber der kurzfristige Schwung hat um den Bereich von 2.700–2.800 US-Dollar begonnen zu verlangsamen. �
Coinlib +1
Die wichtigste kurzfristige Frage ist:
Kann ETH über 2.800 US-Dollar ausbrechen und dort halten?
Ein nachhaltiger Anstieg über diesen Bereich würde das bullische Szenario stärken. Eine Zurückweisung dort könnte ETH zurück in Richtung seiner Unterstützungszonen schicken.
📈 Bullisches Szenario
2.800 → 3.000
Dies ist das erste größere Aufwärtsszenario.
Aktuelle technische Einschätzungen beobachten ebenfalls den Widerstand bei 2.800 US-Dollar; ein erfolgreicher Ausbruch könnte den Weg in Richtung 3.000 freimachen. �
CoinMarketCap +1
Wenn ETH 2.800 US-Dollar mit starkem Volumen durchbricht und es als Unterstützung hält:
Möglicher Verlauf:
2.800 → 2.900 → 3.000 → 3.050
Der Bereich 3.000–3.100 könnte eine weitere Phase der Gewinnmitnahmen oder Konsolidierung auslösen.
Über 3.100
Wenn ETH sich oberhalb von ungefähr 3.050–3.100 etabliert, werden die nächsten wichtigen technischen Bereiche aus deinem Monatschart ungefähr:
3.500
4.100
4.956 — das vorherige große Hoch in deinem Chart
Das sind Szenario-Level, keine garantierten Kursziele.
📉 Bärisches Szenario
Wenn ETH wiederholt im Bereich von 2.750–2.800 scheitert und Bitcoin bzw. die allgemeine Krypto-Stimmung schwächer wird, könnte ETH einen Rücksetzer erleben.
Erste Unterstützung: 2.500–2.600
Das ist derzeit einer der wichtigen kurzfristigen Bereiche, die es zu beobachten gilt. CMCs aktuelle Analyse identifiziert außerdem ungefähr 2.500 als kurzfristige Unterstützung und 2.800 als Widerstand.#BitcoinFundingRateTriplesTo10% #ETH🔥🔥🔥🔥🔥🔥
Aktuelle Daten zeigen, dass ETH in den letzten Monat ungefähr 12–15% gewonnen hat, aber der kurzfristige Schwung hat um den Bereich von 2.700–2.800 US-Dollar begonnen zu verlangsamen. �
Coinlib +1
Die wichtigste kurzfristige Frage ist:
Kann ETH über 2.800 US-Dollar ausbrechen und dort halten?
Ein nachhaltiger Anstieg über diesen Bereich würde das bullische Szenario stärken. Eine Zurückweisung dort könnte ETH zurück in Richtung seiner Unterstützungszonen schicken.
📈 Bullisches Szenario
2.800 → 3.000
Dies ist das erste größere Aufwärtsszenario.
Aktuelle technische Einschätzungen beobachten ebenfalls den Widerstand bei 2.800 US-Dollar; ein erfolgreicher Ausbruch könnte den Weg in Richtung 3.000 freimachen. �
CoinMarketCap +1
Wenn ETH 2.800 US-Dollar mit starkem Volumen durchbricht und es als Unterstützung hält:
Möglicher Verlauf:
2.800 → 2.900 → 3.000 → 3.050
Der Bereich 3.000–3.100 könnte eine weitere Phase der Gewinnmitnahmen oder Konsolidierung auslösen.
Über 3.100
Wenn ETH sich oberhalb von ungefähr 3.050–3.100 etabliert, werden die nächsten wichtigen technischen Bereiche aus deinem Monatschart ungefähr:
3.500
4.100
4.956 — das vorherige große Hoch in deinem Chart
Das sind Szenario-Level, keine garantierten Kursziele.
📉 Bärisches Szenario
Wenn ETH wiederholt im Bereich von 2.750–2.800 scheitert und Bitcoin bzw. die allgemeine Krypto-Stimmung schwächer wird, könnte ETH einen Rücksetzer erleben.
Erste Unterstützung: 2.500–2.600
Das ist derzeit einer der wichtigen kurzfristigen Bereiche, die es zu beobachten gilt. CMCs aktuelle Analyse identifiziert außerdem ungefähr 2.500 als kurzfristige Unterstützung und 2.800 als Widerstand.#BitcoinFundingRateTriplesTo10% #ETH🔥🔥🔥🔥🔥🔥
63
Übersetzung ansehen
$BITCOIN
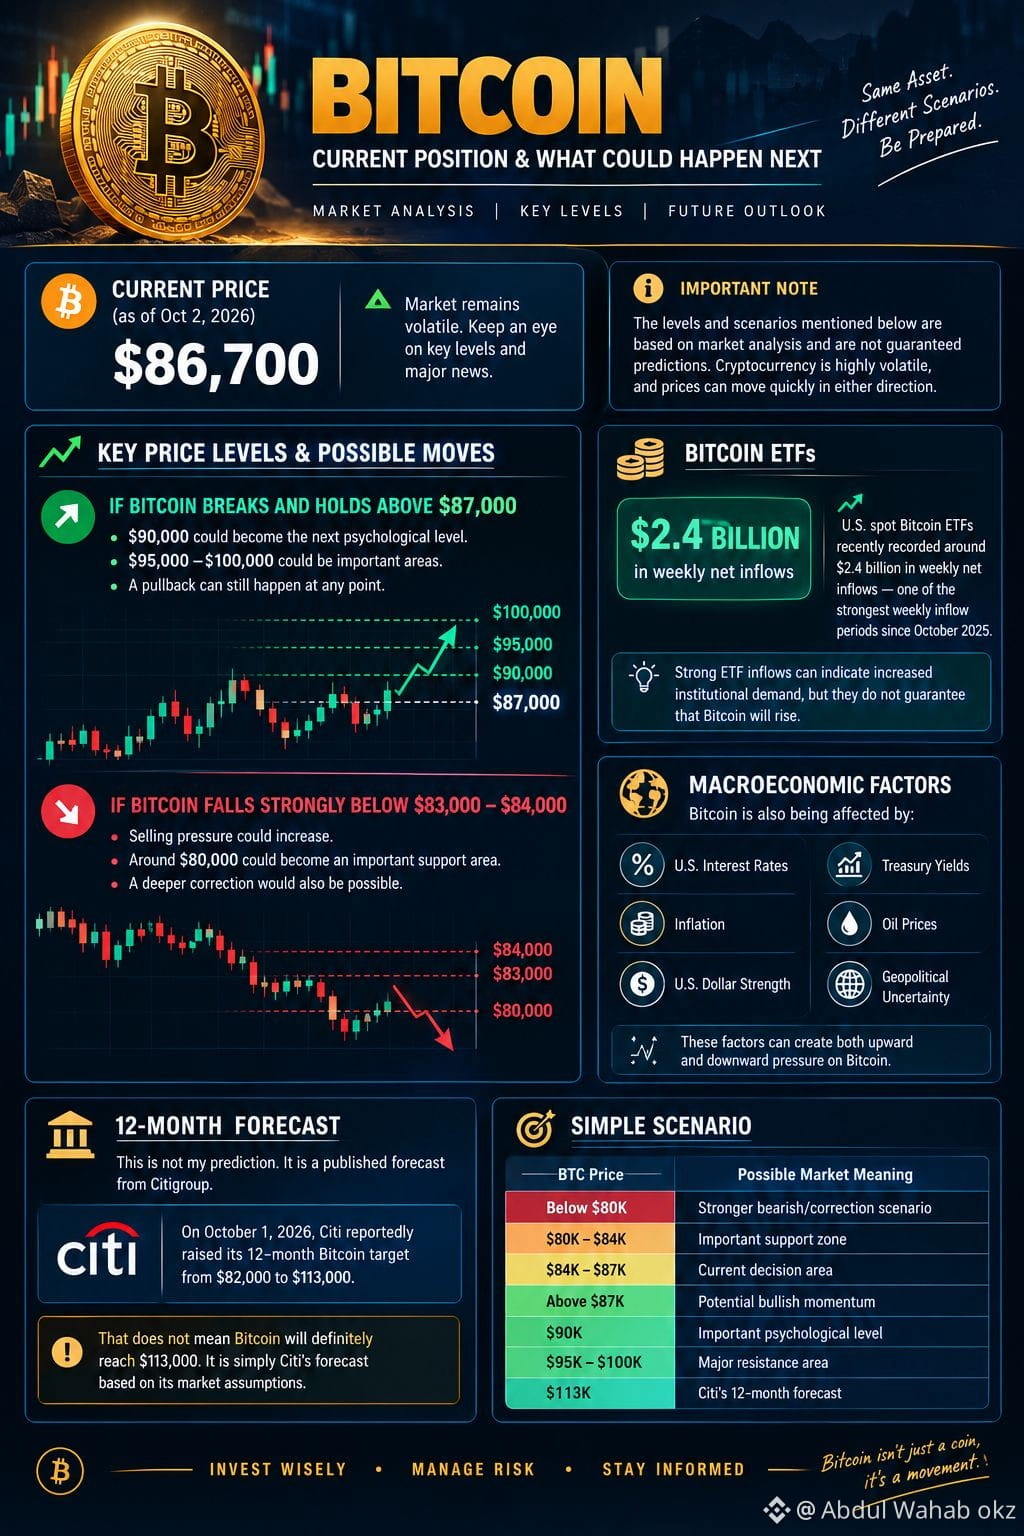
If Bitcoin breaks and holds above $87,000:
$90,000 could become the next psychological level.
After that, $95,000–$100,000 could become important areas.
A pullback can still happen at any point.
If Bitcoin falls strongly below $83,000–$84,000:
Selling pressure could increase.
Around $80,000 could become an important support area.
A deeper correction would also be possible.
These are reference levels, not guaranteed predictions.
🏦 Bitcoin ETFs
U.S. spot Bitcoin ETFs recently recorded around $2.4 billion in weekly net inflows, one of the strongest weekly inflow periods since October 2025.
Strong ETF inflows can indicate increased institutional demand, but they do not guarantee that Bitcoin will rise.
💵 Interest Rates & Global Economy
Bitcoin is also being affected by:
U.S. interest rates
Inflation
U.S. Dollar strength
Treasury yields
Oil prices
Geopolitical uncertainty
These factors can create both upward and downward pressure on Bitcoin.
🔮 12-Month Forecast
This is not my prediction. It is a published forecast from Citigroup.
On October 1, 2026, Citi reportedly raised its 12-month Bitcoin target from $82,000 to $113,000.
That does not mean Bitcoin will definitely reach $113,000. It is simply Citi's forecast based on its market assumptions.
Simple Scenario
BTC Price
Possible Market Meaning
Below $80K
Stronger bearish/correction scenario
$80K–$84K
Important support zone
$84K–$87K
Current decision area
Above $87K
Potential bullish momentum
$90K
Important psychological level
$95K–$100K
Major resistance area
$113K
Citi's 12-month forecast
Important: Crypto is highly volatile. These levels should be treated as analysis rather than guaranteed outcomes.
If you tell me your investment amount (e.g. $100, $500, $1,000) and whether you want Spot or Futures, I can explain possible entry zones, risk levels, and different BTC scenarios.#EthereumFoundationLaunchesZkAPIOnMainnet #bitcoin
$BITCOIN
If Bitcoin breaks and holds above $87,000:
$90,000 could become the next psychological level.
After that, $95,000–$100,000 could become important areas.
A pullback can still happen at any point.
If Bitcoin falls strongly below $83,000–$84,000:
Selling pressure could increase.
Around $80,000 could become an important support area.
A deeper correction would also be possible.
These are reference levels, not guaranteed predictions.
🏦 Bitcoin ETFs
U.S. spot Bitcoin ETFs recently recorded around $2.4 billion in weekly net inflows, one of the strongest weekly inflow periods since October 2025.
Strong ETF inflows can indicate increased institutional demand, but they do not guarantee that Bitcoin will rise.
💵 Interest Rates & Global Economy
Bitcoin is also being affected by:
U.S. interest rates
Inflation
U.S. Dollar strength
Treasury yields
Oil prices
Geopolitical uncertainty
These factors can create both upward and downward pressure on Bitcoin.
🔮 12-Month Forecast
This is not my prediction. It is a published forecast from Citigroup.
On October 1, 2026, Citi reportedly raised its 12-month Bitcoin target from $82,000 to $113,000.
That does not mean Bitcoin will definitely reach $113,000. It is simply Citi's forecast based on its market assumptions.
Simple Scenario
BTC Price
Possible Market Meaning
Below $80K
Stronger bearish/correction scenario
$80K–$84K
Important support zone
$84K–$87K
Current decision area
Above $87K
Potential bullish momentum
$90K
Important psychological level
$95K–$100K
Major resistance area
$113K
Citi's 12-month forecast
Important: Crypto is highly volatile. These levels should be treated as analysis rather than guaranteed outcomes.
If you tell me your investment amount (e.g. $100, $500, $1,000) and whether you want Spot or Futures, I can explain possible entry zones, risk levels, and different BTC scenarios.#EthereumFoundationLaunchesZkAPIOnMainnet #bitcoin
If Bitcoin breaks and holds above $87,000:
$90,000 could become the next psychological level.
After that, $95,000–$100,000 could become important areas.
A pullback can still happen at any point.
If Bitcoin falls strongly below $83,000–$84,000:
Selling pressure could increase.
Around $80,000 could become an important support area.
A deeper correction would also be possible.
These are reference levels, not guaranteed predictions.
🏦 Bitcoin ETFs
U.S. spot Bitcoin ETFs recently recorded around $2.4 billion in weekly net inflows, one of the strongest weekly inflow periods since October 2025.
Strong ETF inflows can indicate increased institutional demand, but they do not guarantee that Bitcoin will rise.
💵 Interest Rates & Global Economy
Bitcoin is also being affected by:
U.S. interest rates
Inflation
U.S. Dollar strength
Treasury yields
Oil prices
Geopolitical uncertainty
These factors can create both upward and downward pressure on Bitcoin.
🔮 12-Month Forecast
This is not my prediction. It is a published forecast from Citigroup.
On October 1, 2026, Citi reportedly raised its 12-month Bitcoin target from $82,000 to $113,000.
That does not mean Bitcoin will definitely reach $113,000. It is simply Citi's forecast based on its market assumptions.
Simple Scenario
BTC Price
Possible Market Meaning
Below $80K
Stronger bearish/correction scenario
$80K–$84K
Important support zone
$84K–$87K
Current decision area
Above $87K
Potential bullish momentum
$90K
Important psychological level
$95K–$100K
Major resistance area
$113K
Citi's 12-month forecast
Important: Crypto is highly volatile. These levels should be treated as analysis rather than guaranteed outcomes.
If you tell me your investment amount (e.g. $100, $500, $1,000) and whether you want Spot or Futures, I can explain possible entry zones, risk levels, and different BTC scenarios.#EthereumFoundationLaunchesZkAPIOnMainnet #bitcoin
89
🔥 Ethereum ($ETH) — Mehr als nur eine Coin
Ethereum zählt nach wie vor zu den wichtigsten Blockchain-Netzwerken im Kryptobereich.
Es ermöglicht:
✅ Smart Contracts
✅ DeFi
✅ NFTs
✅ Tausende Blockchain-Anwendungen
💡 Meine Meinung: Ich glaube, Ethereums wahre Stärke liegt nicht nur im ETH-Token, sondern auch im riesigen Ökosystem, das auf seiner Blockchain aufgebaut wird. 🚀
ETH ist definitiv ein Projekt, das man im Auge behalten sollte. 👀
❓ Was denkst du — Kann Ethereum bei der nächsten großen Bewegung am Kryptomarkt Bitcoin übertreffen?
#ETH #Ethereum #Crypto #BinanceSquare $ETH
{spot}(ETHUSDT)
💡Meine Meinung: Ich glaube, Ethereums wahre Stärke liegt nicht nur im ETH-Token, sondern auch im riesigen Ökosystem, das auf seiner Blockchain aufgebaut wird.
🔥 Ethereum ($ETH ) — Mehr als nur eine Coin
Ethereum zählt nach wie vor zu den wichtigsten Blockchain-Netzwerken im Kryptobereich.
Es ermöglicht:
✅ Smart Contracts
✅ DeFi
✅ NFTs
✅ Tausende Blockchain-Anwendungen
💡 Meine Meinung: Ich glaube, Ethereums wahre Stärke liegt nicht nur im ETH-Token, sondern auch im riesigen Ökosystem, das auf seiner Blockchain aufgebaut wird. 🚀
ETH ist definitiv ein Projekt, das man im Auge behalten sollte. 👀
❓ Was denkst du — Kann Ethereum bei der nächsten großen Bewegung am Kryptomarkt Bitcoin übertreffen?
#ETH #Ethereum #Crypto #BinanceSquare $ETH
💡Meine Meinung: Ich glaube, Ethereums wahre Stärke liegt nicht nur im ETH-Token, sondern auch im riesigen Ökosystem, das auf seiner Blockchain aufgebaut wird.
Ethereum zählt nach wie vor zu den wichtigsten Blockchain-Netzwerken im Kryptobereich.
Es ermöglicht:
✅ Smart Contracts
✅ DeFi
✅ NFTs
✅ Tausende Blockchain-Anwendungen
💡 Meine Meinung: Ich glaube, Ethereums wahre Stärke liegt nicht nur im ETH-Token, sondern auch im riesigen Ökosystem, das auf seiner Blockchain aufgebaut wird. 🚀
ETH ist definitiv ein Projekt, das man im Auge behalten sollte. 👀
❓ Was denkst du — Kann Ethereum bei der nächsten großen Bewegung am Kryptomarkt Bitcoin übertreffen?
#ETH #Ethereum #Crypto #BinanceSquare $ETH
💡Meine Meinung: Ich glaube, Ethereums wahre Stärke liegt nicht nur im ETH-Token, sondern auch im riesigen Ökosystem, das auf seiner Blockchain aufgebaut wird.
47
·
--
Bullisch
🚨 Bitcoin ($BTC) — Der König der Kryptowährungen 👑
Bitcoin bleibt die Kryptowährung Nummer 1 nach Marktkapitalisierung und dominiert weiterhin den Kryptomarkt.
📌 Warum BTC beobachten?
• Größtes Krypto-Ökosystem
• Höchste Marktliquidität
• Gibt oft die Richtung für den Gesamtmarkt vor
Die große Frage lautet:
🔥 Steht BTC vor seinem nächsten großen Kursanstieg?
Was denkst du? 🐂 Bullisch oder 🐻 bärisch?
#BTC #Bitcoin
{spot}(BTCUSDT)
🚨 Bitcoin ($BTC) — Der König der Kryptowährungen 👑
Bitcoin bleibt die Kryptowährung Nummer 1 nach Marktkapitalisierung und dominiert weiterhin den Kryptomarkt.
📌 Warum BTC beobachten?
• Größtes Krypto-Ökosystem
• Höchste Marktliquidität
• Gibt oft die Richtung für den Gesamtmarkt vor
Die große Frage lautet:
🔥 Steht BTC vor seinem nächsten großen Kursanstieg?
Was denkst du? 🐂 Bullisch oder 🐻 bärisch?
#BTC #Bitcoin
Bitcoin bleibt die Kryptowährung Nummer 1 nach Marktkapitalisierung und dominiert weiterhin den Kryptomarkt.
📌 Warum BTC beobachten?
• Größtes Krypto-Ökosystem
• Höchste Marktliquidität
• Gibt oft die Richtung für den Gesamtmarkt vor
Die große Frage lautet:
🔥 Steht BTC vor seinem nächsten großen Kursanstieg?
Was denkst du? 🐂 Bullisch oder 🐻 bärisch?
#BTC #Bitcoin
55
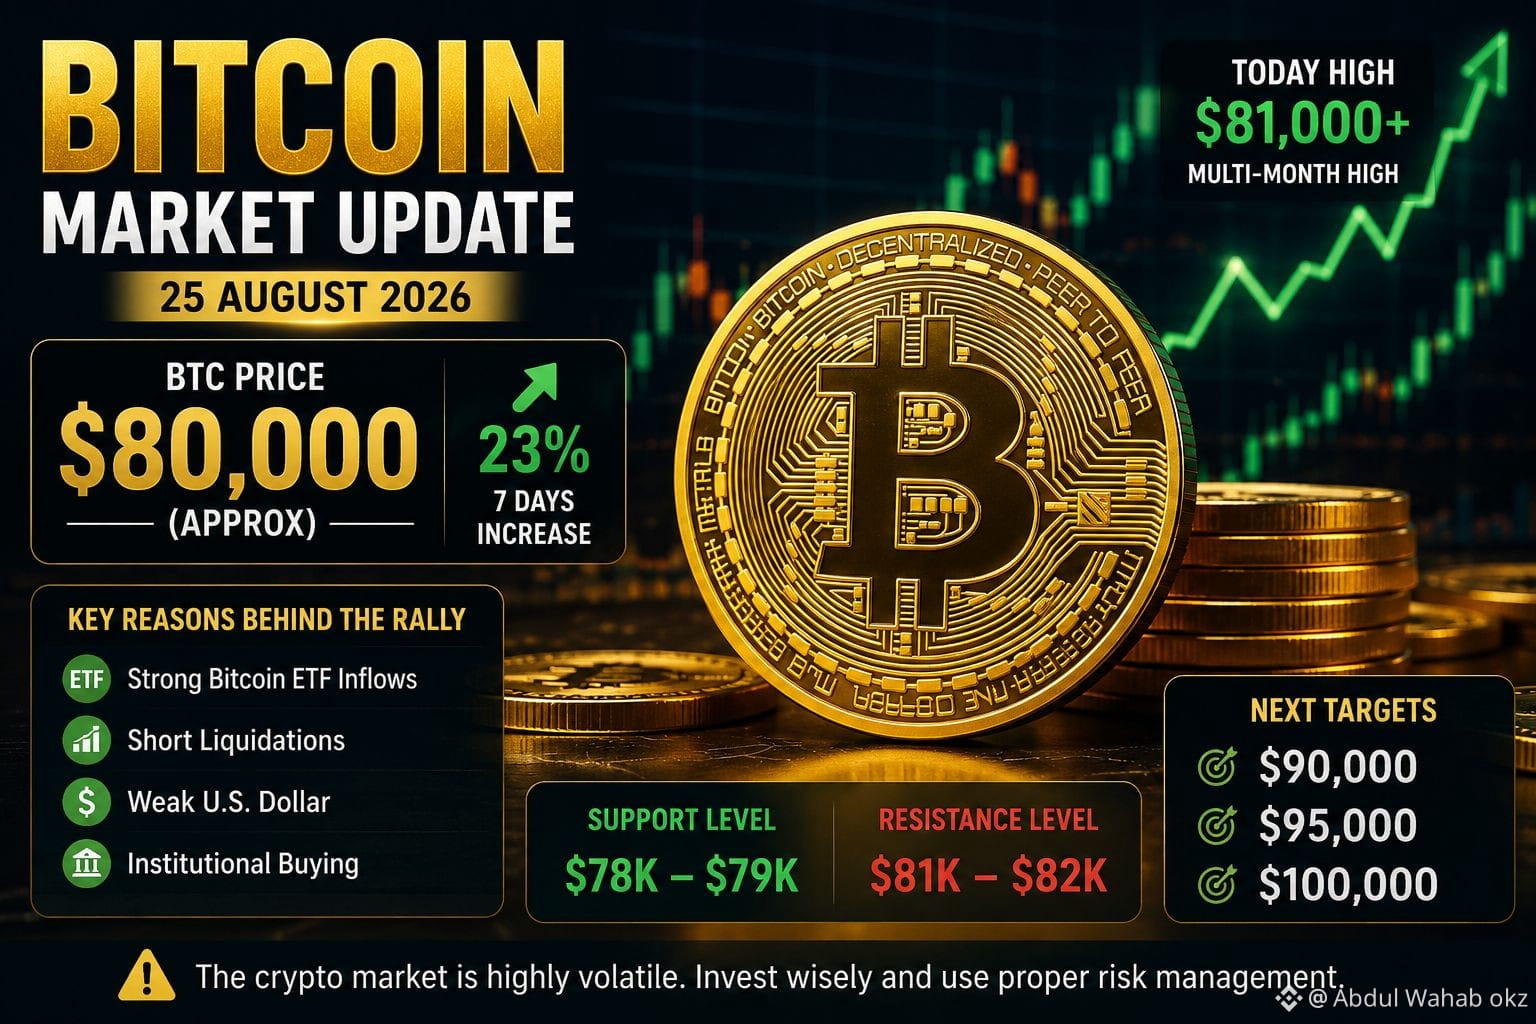
Bitcoin-Update – 25. August 2026
#Bitcoin (BTC) wird derzeit bei etwa 80.000 $ gehandelt.
Heute erreichte der Kurs kurzzeitig auch etwa 81.000 $ und damit ein Mehrmonatshoch.
In den vergangenen 7 Tagen ist Bitcoin um etwa 23 % gestiegen.
Zu den Hauptgründen für diese Aufwärtsbewegung zählen Zuflüsse in Bitcoin-ETFs, Liquidationen von Short-Positionen, ein schwächerer US-Dollar und Käufe institutioneller Anleger.
Meine kurze Einschätzung
📈 Der kurzfristige Trend ist derzeit bullisch. Da sich Bitcoin jedoch nahe der Widerstandszone von 80.000–81.000 $ befindet, ist auch eine plötzliche Korrektur möglich.
Wichtige Kursmarken
🔴 Widerstand: 81.000–82.000 $
🟢 Unterstützung: 78.000–79.000 $
Setzt sich der starke Ausbruch fort, könnten die nächsten psychologischen Kursziele bei 90.000 $ und anschließend bei 95.000–100.000 $ liegen.
Bitcoin-Update – 25. August 2026
#Bitcoin (BTC) wird derzeit bei etwa 80.000 $ gehandelt.
Heute erreichte der Kurs kurzzeitig auch etwa 81.000 $ und damit ein Mehrmonatshoch.
In den vergangenen 7 Tagen ist Bitcoin um etwa 23 % gestiegen.
Zu den Hauptgründen für diese Aufwärtsbewegung zählen Zuflüsse in Bitcoin-ETFs, Liquidationen von Short-Positionen, ein schwächerer US-Dollar und Käufe institutioneller Anleger.
Meine kurze Einschätzung
📈 Der kurzfristige Trend ist derzeit bullisch. Da sich Bitcoin jedoch nahe der Widerstandszone von 80.000–81.000 $ befindet, ist auch eine plötzliche Korrektur möglich.
Wichtige Kursmarken
🔴 Widerstand: 81.000–82.000 $
🟢 Unterstützung: 78.000–79.000 $
Setzt sich der starke Ausbruch fort, könnten die nächsten psychologischen Kursziele bei 90.000 $ und anschließend bei 95.000–100.000 $ liegen.
#Bitcoin (BTC) wird derzeit bei etwa 80.000 $ gehandelt.
Heute erreichte der Kurs kurzzeitig auch etwa 81.000 $ und damit ein Mehrmonatshoch.
In den vergangenen 7 Tagen ist Bitcoin um etwa 23 % gestiegen.
Zu den Hauptgründen für diese Aufwärtsbewegung zählen Zuflüsse in Bitcoin-ETFs, Liquidationen von Short-Positionen, ein schwächerer US-Dollar und Käufe institutioneller Anleger.
Meine kurze Einschätzung
📈 Der kurzfristige Trend ist derzeit bullisch. Da sich Bitcoin jedoch nahe der Widerstandszone von 80.000–81.000 $ befindet, ist auch eine plötzliche Korrektur möglich.
Wichtige Kursmarken
🔴 Widerstand: 81.000–82.000 $
🟢 Unterstützung: 78.000–79.000 $
Setzt sich der starke Ausbruch fort, könnten die nächsten psychologischen Kursziele bei 90.000 $ und anschließend bei 95.000–100.000 $ liegen.
71
Übersetzung ansehen
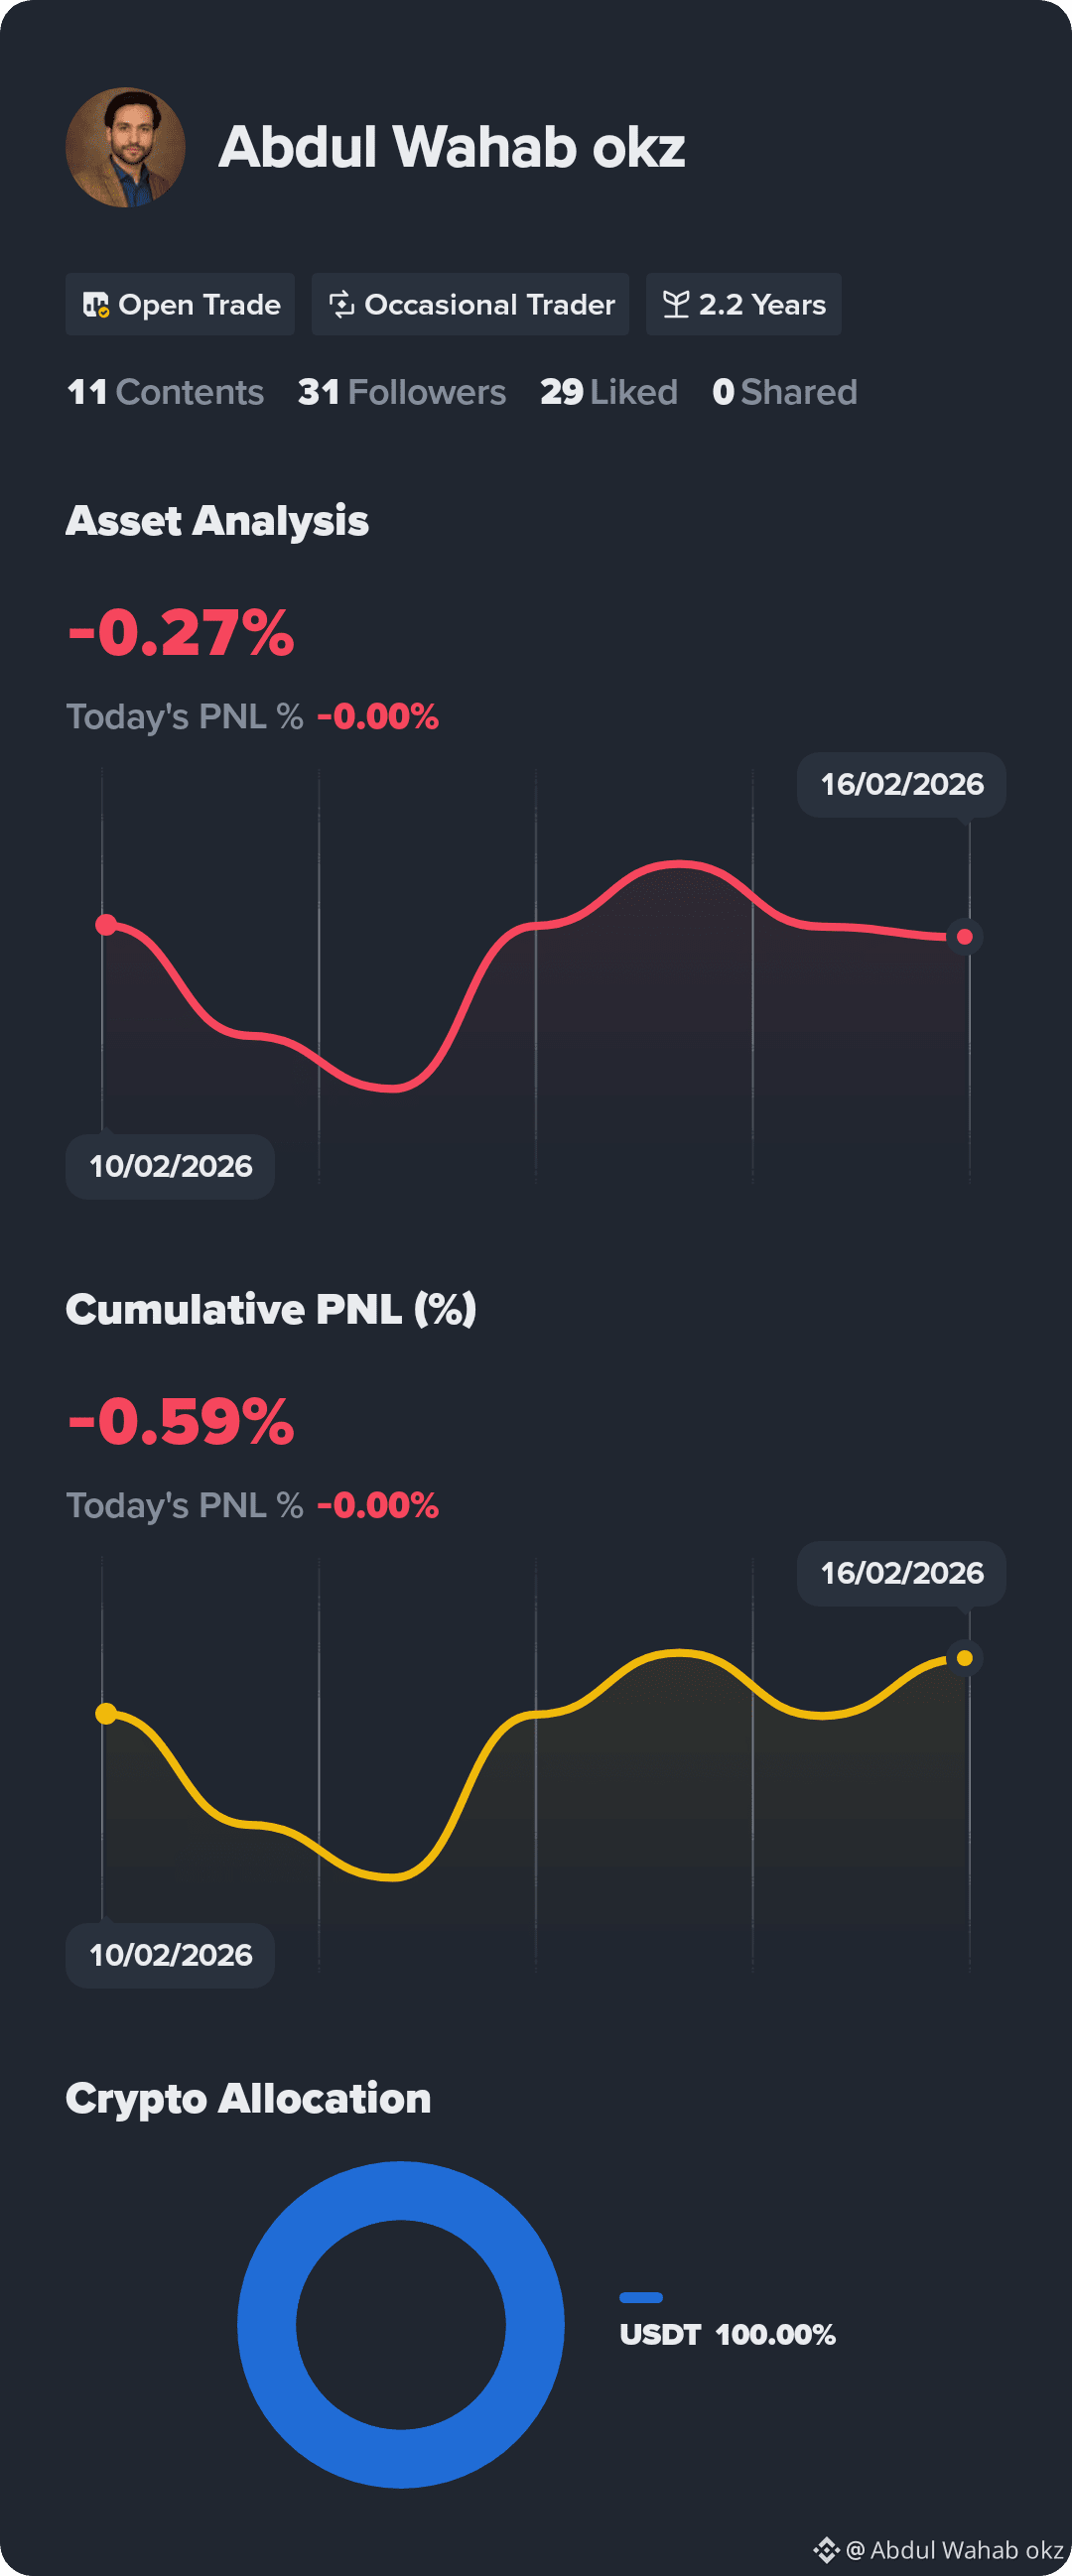
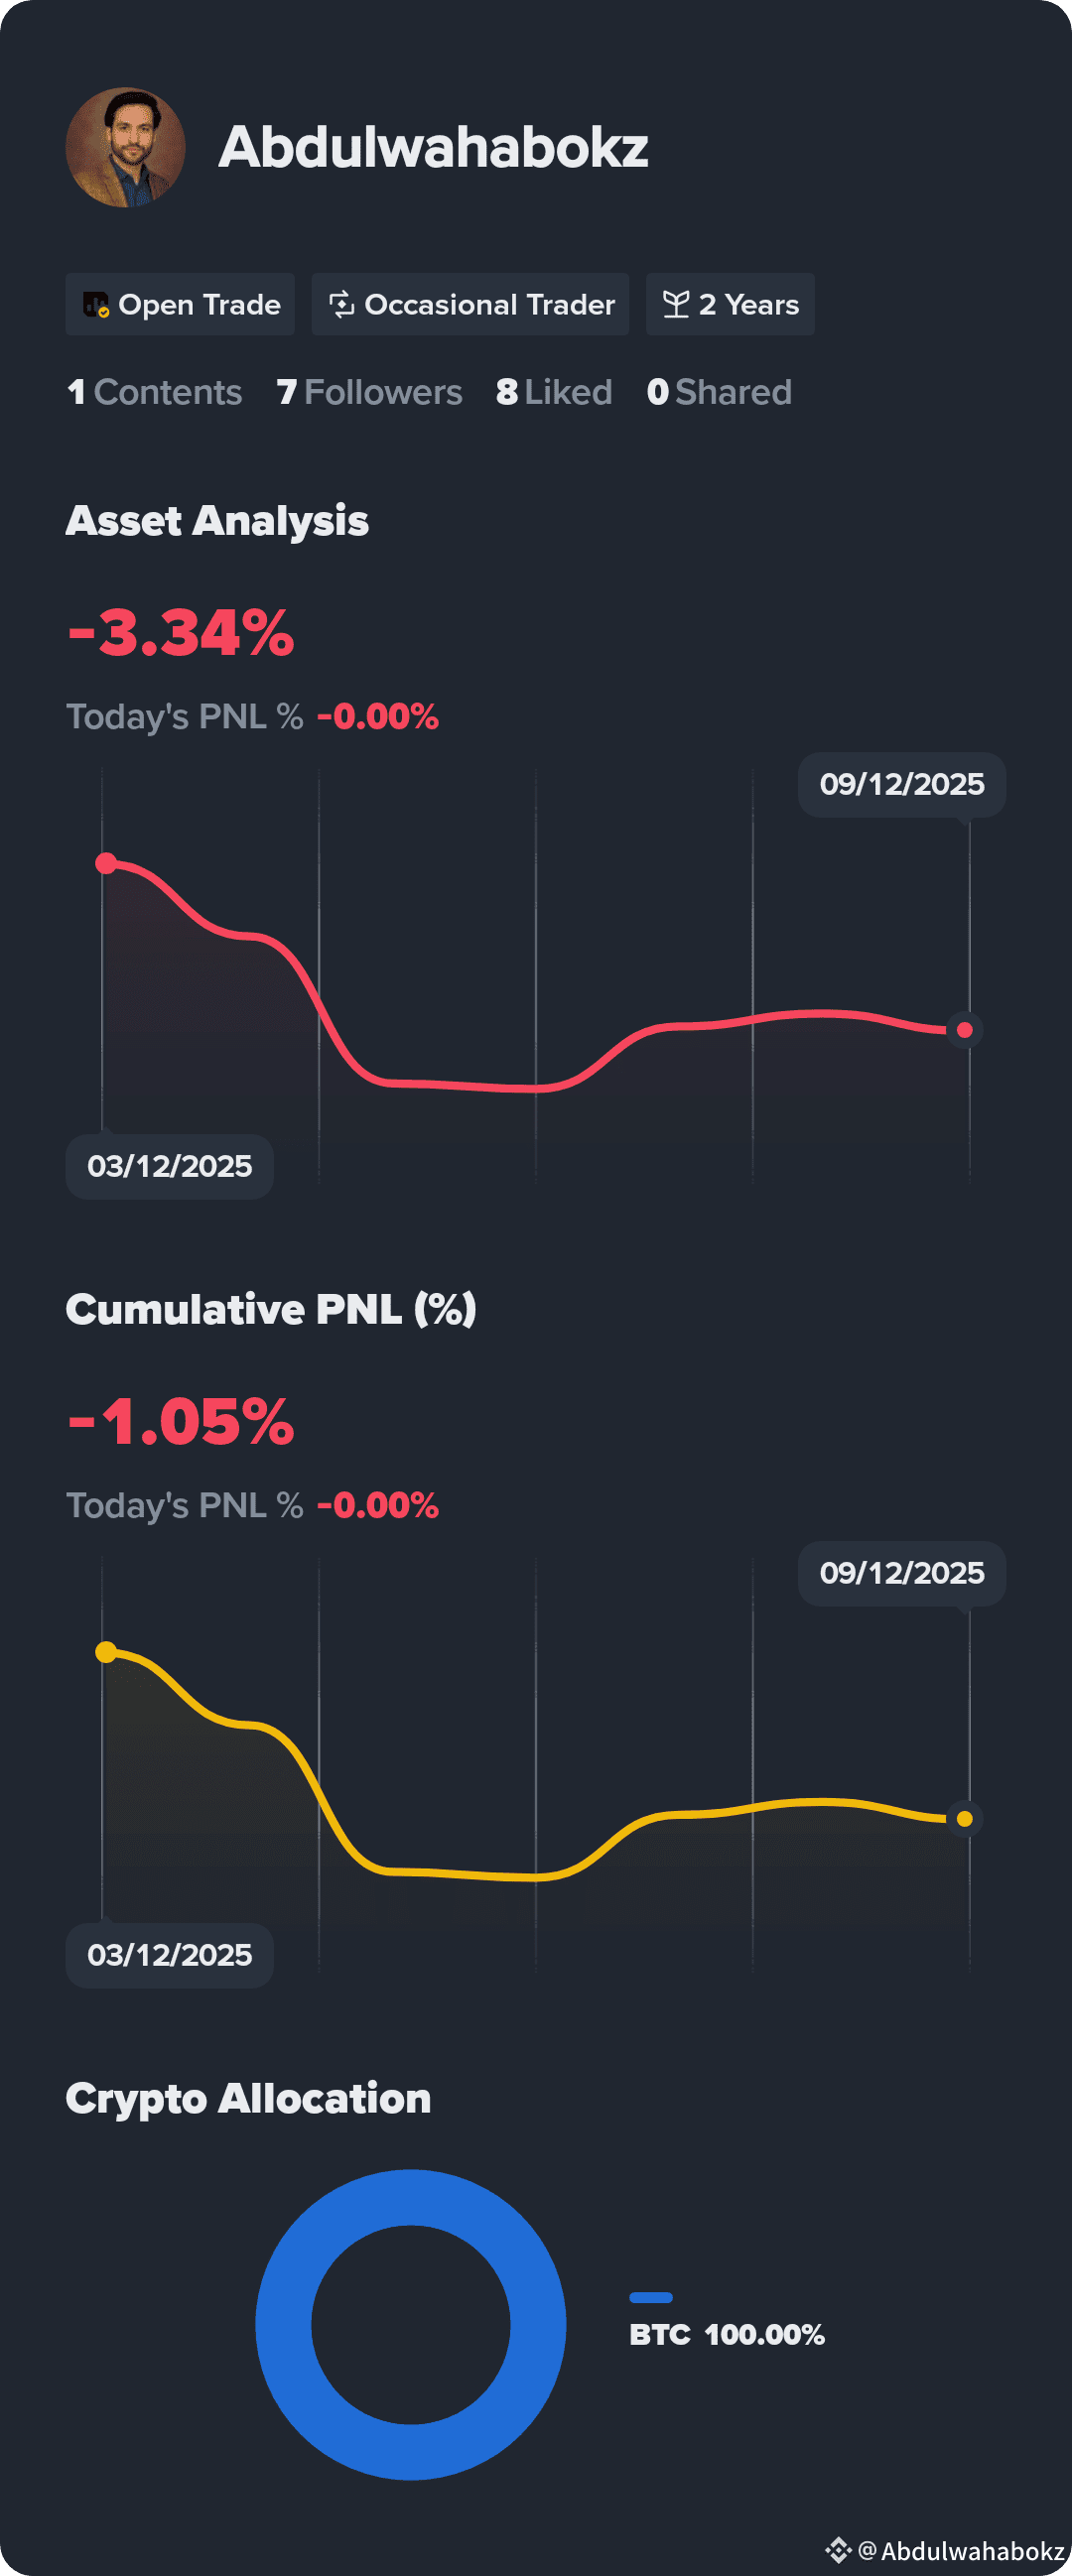
See my returns and portfolio breakdown. Follow for investment tips
See my returns and portfolio breakdown. Follow for investment tips
2
Übersetzung ansehen
Current Market Situation
Right now, Bitcoin has been falling from recent highs and is much lower📉 Current Market Situation
$BTC Right now, Bitcoin has been falling from recent highs and is much lower than its peak from late 2025. This is part of what analysts call a bear market — a period where prices fall and stay lower for some time. Prices could continue to stay low or go lower before rising again.
Some experts even warn it could drop further before stabilizing.
📈 Long-Term Predictions — Very Mixed
Different analysts have very different forecasts for Bitcoin’s price:
📊 Bearish / Cautious Views
Some think BTC could drop toward lower levels before any big rise.
In the short term, demand may weaken, delaying a rally.
📊 Bullish / Optimistic Views
Other analysts have higher price predictions years ahead:
Some forecasts suggest Bitcoin could reach over $100,000 or $140,000+ by 2025–2026 if adoption increases.
In long-term scenarios (several years), some predict even much higher prices because supply is limited and demand may grow.
❗ But remember: These are all predictions, not guarantees.
📅 When Could Bitcoin Go Up?
Nobody can say exactly when BTC will go up. Price direction depends on many unpredictable factors like:
🔹 Global economy and interest rates
🔹 Institutional buying (big companies investing)
🔹 Legal regulations and crypto laws
🔹 Market sentiment (whether people are afraid or confident)
Some people think:
🟢 If prices find a bottom (lowest point) this year, a rise might start later in 2026–2027.
🔴 But in the near term (months only), price might stay sideways or decline further before any big rally.
💼 Investment Advice — Simple, Clear Logic
Here’s how most experienced investors think about Bitcoin:
✔️ If You Are a Long-Term Investor
You can invest small amounts regularly (called DCA — dollar cost averaging),
Do not invest money you might need soon,
Think in terms of years, not weeks or months.
Long-term investors believe BTC could grow over several years because supply is limited and institutional adoption may increase.
❌ If You Want Quick Profit
Short-term price predictions are very unreliable.
BTC could go up, but it could also stay down or fall again. Short-term trading is risky.
📌 Bottom Line (Simple Truth)
✅ Bitcoin has potential over the long term due to limited supply and adoption.
❌ Bitcoin is very volatile, and short-term price movements are unpredictable.
📉 It may go lower before it goes higher.
📈 It could rise significantly in the next few years, but no one knows for sure.
🧠 Smart Investment Rules
👉 Never invest money you can’t afford to lose
👉 Spread investments — don’t put all in one asset
👉 Learn basic chart and risk management skills
👉 Think long-term (years, not days)$BTC
{spot}(BTCUSDT)
#BTCFellBelow$69,000Again #OpenClawFounderJoinsOpenAI #PEPEBrokeThroughDowntrendLine #TradeCryptosOnX
Current Market Situation Right now, Bitcoin has been falling from recent highs and is much lower
📉 Current Market Situation
$BTC Right now, Bitcoin has been falling from recent highs and is much lower than its peak from late 2025. This is part of what analysts call a bear market — a period where prices fall and stay lower for some time. Prices could continue to stay low or go lower before rising again.
Some experts even warn it could drop further before stabilizing.
📈 Long-Term Predictions — Very Mixed
Different analysts have very different forecasts for Bitcoin’s price:
📊 Bearish / Cautious Views
Some think BTC could drop toward lower levels before any big rise.
In the short term, demand may weaken, delaying a rally.
📊 Bullish / Optimistic Views
Other analysts have higher price predictions years ahead:
Some forecasts suggest Bitcoin could reach over $100,000 or $140,000+ by 2025–2026 if adoption increases.
In long-term scenarios (several years), some predict even much higher prices because supply is limited and demand may grow.
❗ But remember: These are all predictions, not guarantees.
📅 When Could Bitcoin Go Up?
Nobody can say exactly when BTC will go up. Price direction depends on many unpredictable factors like:
🔹 Global economy and interest rates
🔹 Institutional buying (big companies investing)
🔹 Legal regulations and crypto laws
🔹 Market sentiment (whether people are afraid or confident)
Some people think:
🟢 If prices find a bottom (lowest point) this year, a rise might start later in 2026–2027.
🔴 But in the near term (months only), price might stay sideways or decline further before any big rally.
💼 Investment Advice — Simple, Clear Logic
Here’s how most experienced investors think about Bitcoin:
✔️ If You Are a Long-Term Investor
You can invest small amounts regularly (called DCA — dollar cost averaging),
Do not invest money you might need soon,
Think in terms of years, not weeks or months.
Long-term investors believe BTC could grow over several years because supply is limited and institutional adoption may increase.
❌ If You Want Quick Profit
Short-term price predictions are very unreliable.
BTC could go up, but it could also stay down or fall again. Short-term trading is risky.
📌 Bottom Line (Simple Truth)
✅ Bitcoin has potential over the long term due to limited supply and adoption.
❌ Bitcoin is very volatile, and short-term price movements are unpredictable.
📉 It may go lower before it goes higher.
📈 It could rise significantly in the next few years, but no one knows for sure.
🧠 Smart Investment Rules
👉 Never invest money you can’t afford to lose
👉 Spread investments — don’t put all in one asset
👉 Learn basic chart and risk management skills
👉 Think long-term (years, not days)$BTC
#BTCFellBelow$69,000Again #OpenClawFounderJoinsOpenAI #PEPEBrokeThroughDowntrendLine #TradeCryptosOnX
$BTC Right now, Bitcoin has been falling from recent highs and is much lower than its peak from late 2025. This is part of what analysts call a bear market — a period where prices fall and stay lower for some time. Prices could continue to stay low or go lower before rising again.
Some experts even warn it could drop further before stabilizing.
📈 Long-Term Predictions — Very Mixed
Different analysts have very different forecasts for Bitcoin’s price:
📊 Bearish / Cautious Views
Some think BTC could drop toward lower levels before any big rise.
In the short term, demand may weaken, delaying a rally.
📊 Bullish / Optimistic Views
Other analysts have higher price predictions years ahead:
Some forecasts suggest Bitcoin could reach over $100,000 or $140,000+ by 2025–2026 if adoption increases.
In long-term scenarios (several years), some predict even much higher prices because supply is limited and demand may grow.
❗ But remember: These are all predictions, not guarantees.
📅 When Could Bitcoin Go Up?
Nobody can say exactly when BTC will go up. Price direction depends on many unpredictable factors like:
🔹 Global economy and interest rates
🔹 Institutional buying (big companies investing)
🔹 Legal regulations and crypto laws
🔹 Market sentiment (whether people are afraid or confident)
Some people think:
🟢 If prices find a bottom (lowest point) this year, a rise might start later in 2026–2027.
🔴 But in the near term (months only), price might stay sideways or decline further before any big rally.
💼 Investment Advice — Simple, Clear Logic
Here’s how most experienced investors think about Bitcoin:
✔️ If You Are a Long-Term Investor
You can invest small amounts regularly (called DCA — dollar cost averaging),
Do not invest money you might need soon,
Think in terms of years, not weeks or months.
Long-term investors believe BTC could grow over several years because supply is limited and institutional adoption may increase.
❌ If You Want Quick Profit
Short-term price predictions are very unreliable.
BTC could go up, but it could also stay down or fall again. Short-term trading is risky.
📌 Bottom Line (Simple Truth)
✅ Bitcoin has potential over the long term due to limited supply and adoption.
❌ Bitcoin is very volatile, and short-term price movements are unpredictable.
📉 It may go lower before it goes higher.
📈 It could rise significantly in the next few years, but no one knows for sure.
🧠 Smart Investment Rules
👉 Never invest money you can’t afford to lose
👉 Spread investments — don’t put all in one asset
👉 Learn basic chart and risk management skills
👉 Think long-term (years, not days)$BTC
#BTCFellBelow$69,000Again #OpenClawFounderJoinsOpenAI #PEPEBrokeThroughDowntrendLine #TradeCryptosOnX
2
Übersetzung ansehen
$Vanar$BTC vanarVanar
Chain is redefining the future of Web3 infrastructure 🚀
@vanar is not just another blockchain project — it is building a dedicated Layer-1 ecosystem optimized for AI, gaming, metaverse, and immersive digital experiences. In a space where many chains struggle with scalability and real-world adoption, Vanar Chain focuses on high performance, low latency, and developer-friendly tools, making it ideal for next-generation applications.
What makes Vanar unique is its clear vision: empowering creators, developers, and enterprises to build AI-driven virtual worlds without technical limitations. From seamless asset creation to efficient on-chain interactions, the Vanar ecosystem is designed for mass adoption, not speculation.
The native token $VANRY plays a critical role in powering the network — enabling transactions, ecosystem incentives, and long-term sustainability. As development continues and real use cases expand, Vanar Chain positions itself as a serious contender in the Web3 infrastructure race.
With a growing community, strong technological foundation, and focus on real utility, #Vanar is a project worth watching closely in the evolving blockchain landscape.#DPWatch #TrumpEndsShutdown #USIranStandoff #
$Vanar
$BTC vanarVanar
Chain is redefining the future of Web3 infrastructure 🚀
@vanar is not just another blockchain project — it is building a dedicated Layer-1 ecosystem optimized for AI, gaming, metaverse, and immersive digital experiences. In a space where many chains struggle with scalability and real-world adoption, Vanar Chain focuses on high performance, low latency, and developer-friendly tools, making it ideal for next-generation applications.
What makes Vanar unique is its clear vision: empowering creators, developers, and enterprises to build AI-driven virtual worlds without technical limitations. From seamless asset creation to efficient on-chain interactions, the Vanar ecosystem is designed for mass adoption, not speculation.
The native token $VANRY plays a critical role in powering the network — enabling transactions, ecosystem incentives, and long-term sustainability. As development continues and real use cases expand, Vanar Chain positions itself as a serious contender in the Web3 infrastructure race.
With a growing community, strong technological foundation, and focus on real utility, #Vanar is a project worth watching closely in the evolving blockchain landscape.#DPWatch #TrumpEndsShutdown #USIranStandoff #
Chain is redefining the future of Web3 infrastructure 🚀
@vanar is not just another blockchain project — it is building a dedicated Layer-1 ecosystem optimized for AI, gaming, metaverse, and immersive digital experiences. In a space where many chains struggle with scalability and real-world adoption, Vanar Chain focuses on high performance, low latency, and developer-friendly tools, making it ideal for next-generation applications.
What makes Vanar unique is its clear vision: empowering creators, developers, and enterprises to build AI-driven virtual worlds without technical limitations. From seamless asset creation to efficient on-chain interactions, the Vanar ecosystem is designed for mass adoption, not speculation.
The native token $VANRY plays a critical role in powering the network — enabling transactions, ecosystem incentives, and long-term sustainability. As development continues and real use cases expand, Vanar Chain positions itself as a serious contender in the Web3 infrastructure race.
With a growing community, strong technological foundation, and focus on real utility, #Vanar is a project worth watching closely in the evolving blockchain landscape.#DPWatch #TrumpEndsShutdown #USIranStandoff #
3
11
Übersetzung ansehen
#vanar $VANRY
Vanar ($VANRY) is building strong momentum in the Web3 gaming & AI space. With growing ecosystem adoption, real utility, and increasing community engagement, VANRY is positioning itself as a long-term infrastructure player rather than a hype token. Keep an eye on volume and key resistance levels.
#vanar $VANRY
Vanar ($VANRY) is building strong momentum in the Web3 gaming & AI space. With growing ecosystem adoption, real utility, and increasing community engagement, VANRY is positioning itself as a long-term infrastructure player rather than a hype token. Keep an eye on volume and key resistance levels.
Vanar ($VANRY) is building strong momentum in the Web3 gaming & AI space. With growing ecosystem adoption, real utility, and increasing community engagement, VANRY is positioning itself as a long-term infrastructure player rather than a hype token. Keep an eye on volume and key resistance levels.
2
4
$BTC chart
Marktführer. Starke langfristige bullische Struktur. Die ETF-Adoption und der Halving-Effekt unterstützen ein stetiges Wachstum.
$BTC chart
Marktführer. Starke langfristige bullische Struktur. Die ETF-Adoption und der Halving-Effekt unterstützen ein stetiges Wachstum.
Marktführer. Starke langfristige bullische Struktur. Die ETF-Adoption und der Halving-Effekt unterstützen ein stetiges Wachstum.
13
·
--
Bullisch
Übersetzung ansehen
$ASTER
{spot}(ASTERUSDT)
Aster is the native token of the Aster decentralized exchange and perpetual trading ecosystem. It aims to combine spot + perpetual derivatives trading with advanced on-chain features like MEV-free execution, hidden orders, and multi-chain support. The protocol supports capital-efficient collateral use (like liquid staking tokens) and is backed by YZI Labs (formerly Binance Labs). �
Date O H L C
--------------------------------
Jan 12 $0.72 0.75 0.70 0.74
Jan 13 $0.74 0.76 0.71 0.72
Jan 14 $0.72 0.75 0.69 0.70
Jan 15 $0.70 0.75 0.70 0.74
Jan 16 $0.74 0.75 0.71 0.73
$ASTER
Aster is the native token of the Aster decentralized exchange and perpetual trading ecosystem. It aims to combine spot + perpetual derivatives trading with advanced on-chain features like MEV-free execution, hidden orders, and multi-chain support. The protocol supports capital-efficient collateral use (like liquid staking tokens) and is backed by YZI Labs (formerly Binance Labs). �
Date O H L C
--------------------------------
Jan 12 $0.72 0.75 0.70 0.74
Jan 13 $0.74 0.76 0.71 0.72
Jan 14 $0.72 0.75 0.69 0.70
Jan 15 $0.70 0.75 0.70 0.74
Jan 16 $0.74 0.75 0.71 0.73
Aster is the native token of the Aster decentralized exchange and perpetual trading ecosystem. It aims to combine spot + perpetual derivatives trading with advanced on-chain features like MEV-free execution, hidden orders, and multi-chain support. The protocol supports capital-efficient collateral use (like liquid staking tokens) and is backed by YZI Labs (formerly Binance Labs). �
Date O H L C
--------------------------------
Jan 12 $0.72 0.75 0.70 0.74
Jan 13 $0.74 0.76 0.71 0.72
Jan 14 $0.72 0.75 0.69 0.70
Jan 15 $0.70 0.75 0.70 0.74
Jan 16 $0.74 0.75 0.71 0.73
14
Übersetzung ansehen
$BTC
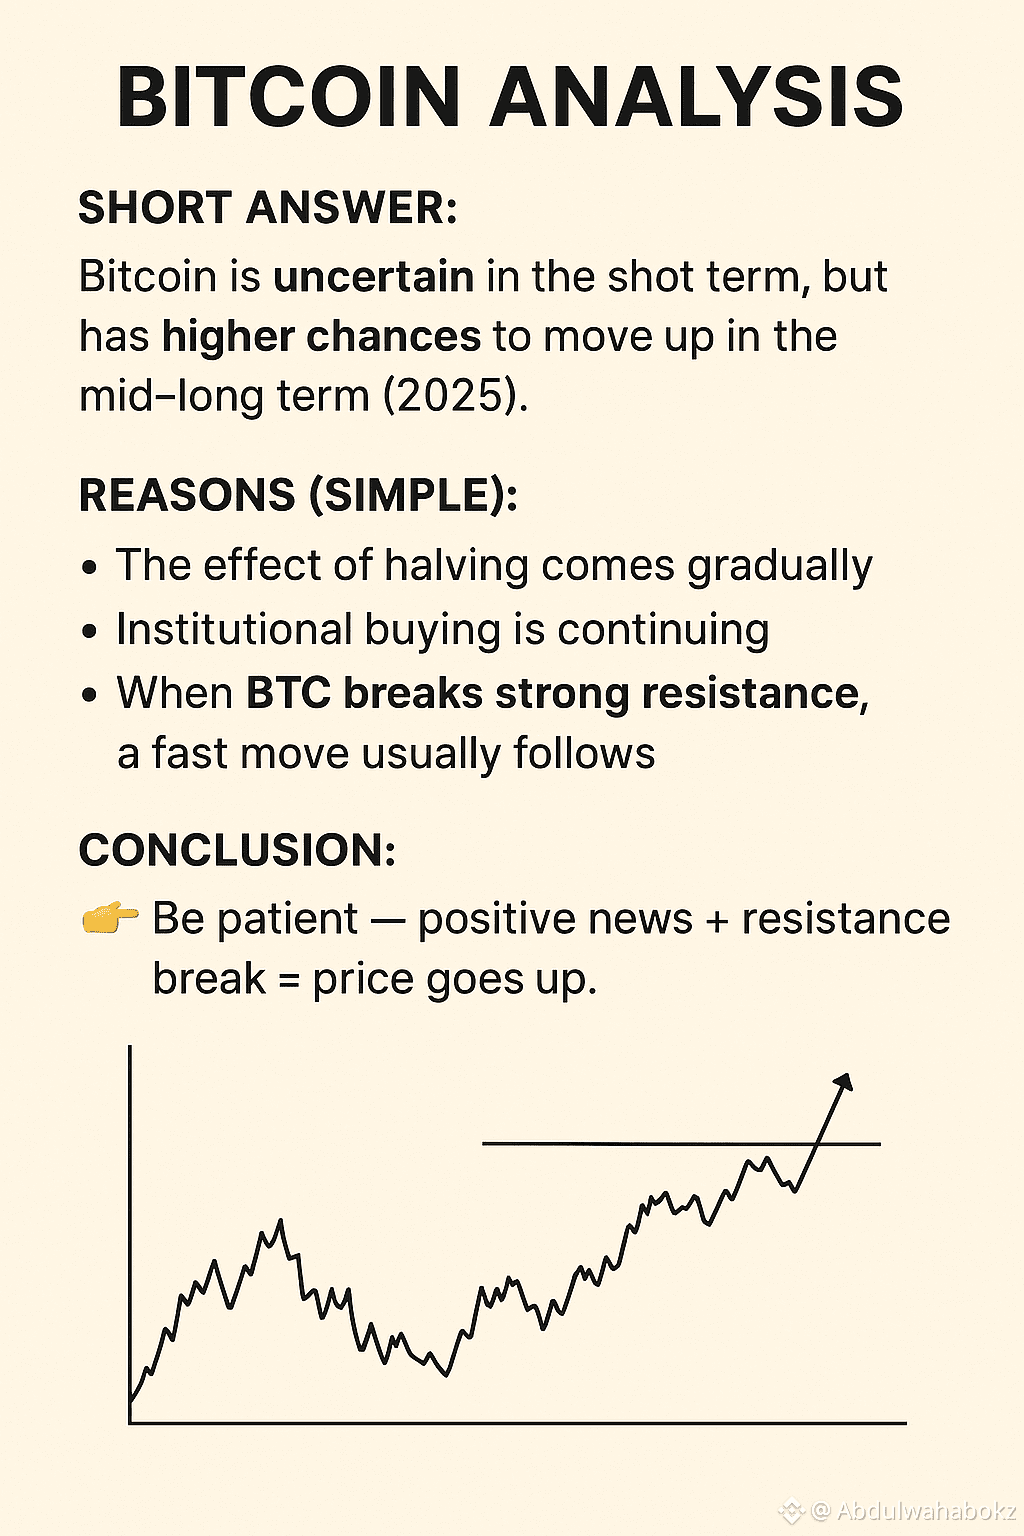
Short answer:
Bitcoin is uncertain in the short term, but has higher chances to move up in the mid–long term (2025).
Reasons (simple):
The effect of halving comes gradually
Institutional buying is continuing
When BTC breaks strong resistance, a fast move usually follows
Conclusion:
👉 Be patient — positive news + resistance break = price goes up.
$BTC
Short answer:
Bitcoin is uncertain in the short term, but has higher chances to move up in the mid–long term (2025).
Reasons (simple):
The effect of halving comes gradually
Institutional buying is continuing
When BTC breaks strong resistance, a fast move usually follows
Conclusion:
👉 Be patient — positive news + resistance break = price goes up.
Short answer:
Bitcoin is uncertain in the short term, but has higher chances to move up in the mid–long term (2025).
Reasons (simple):
The effect of halving comes gradually
Institutional buying is continuing
When BTC breaks strong resistance, a fast move usually follows
Conclusion:
👉 Be patient — positive news + resistance break = price goes up.
17
Übersetzung ansehen
$BTC
Bitcoin is a crypto asset, and its future price direction is uncertain — but here is the latest analysis on when it may “go up”.
✅ Current Situation & Short-Term Forecast
Right now, several models show a bearish or sideways trend.
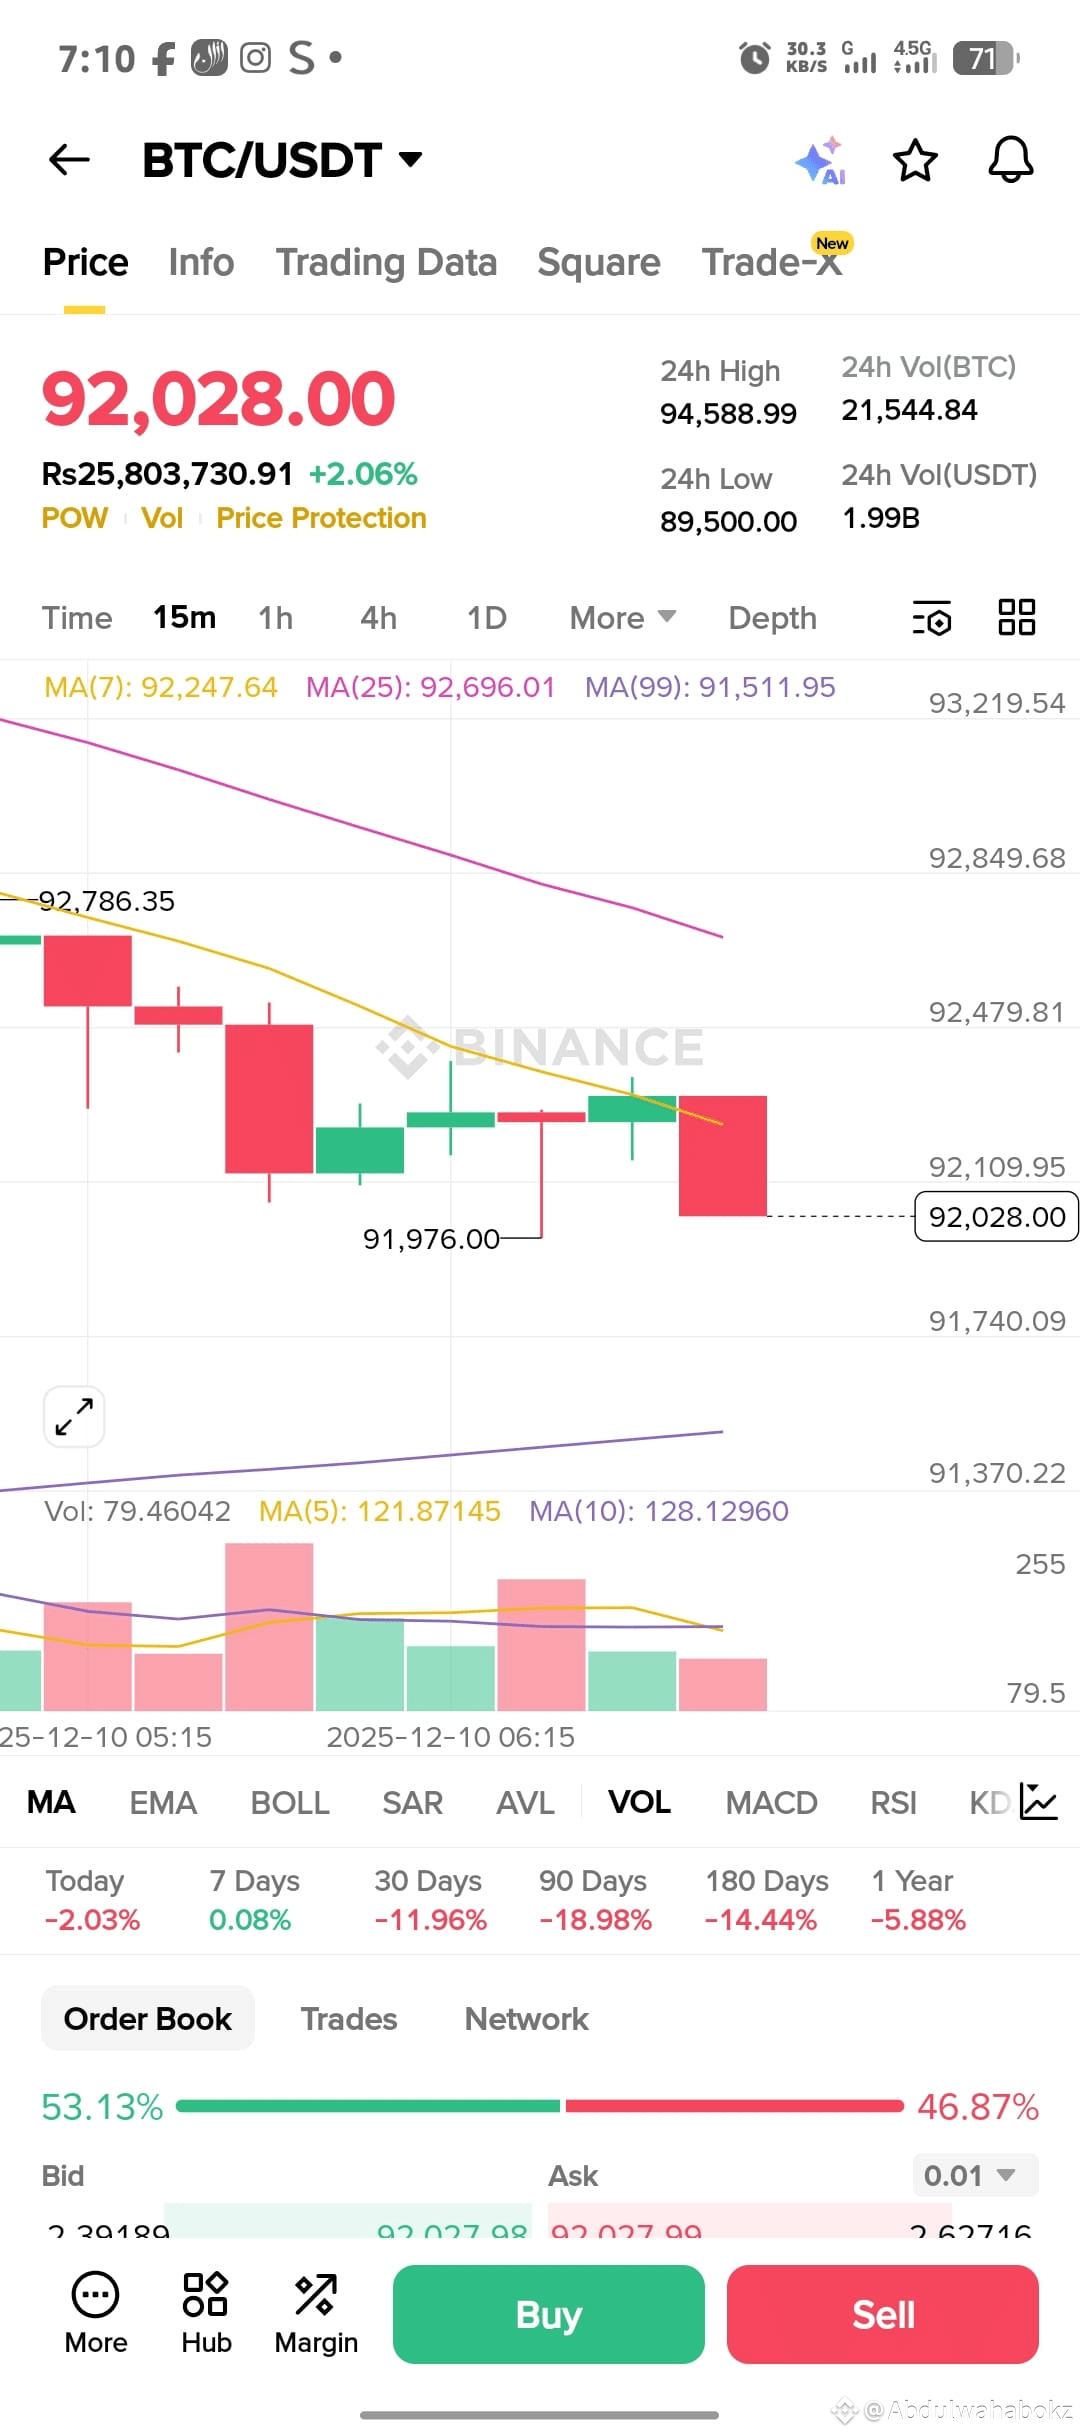
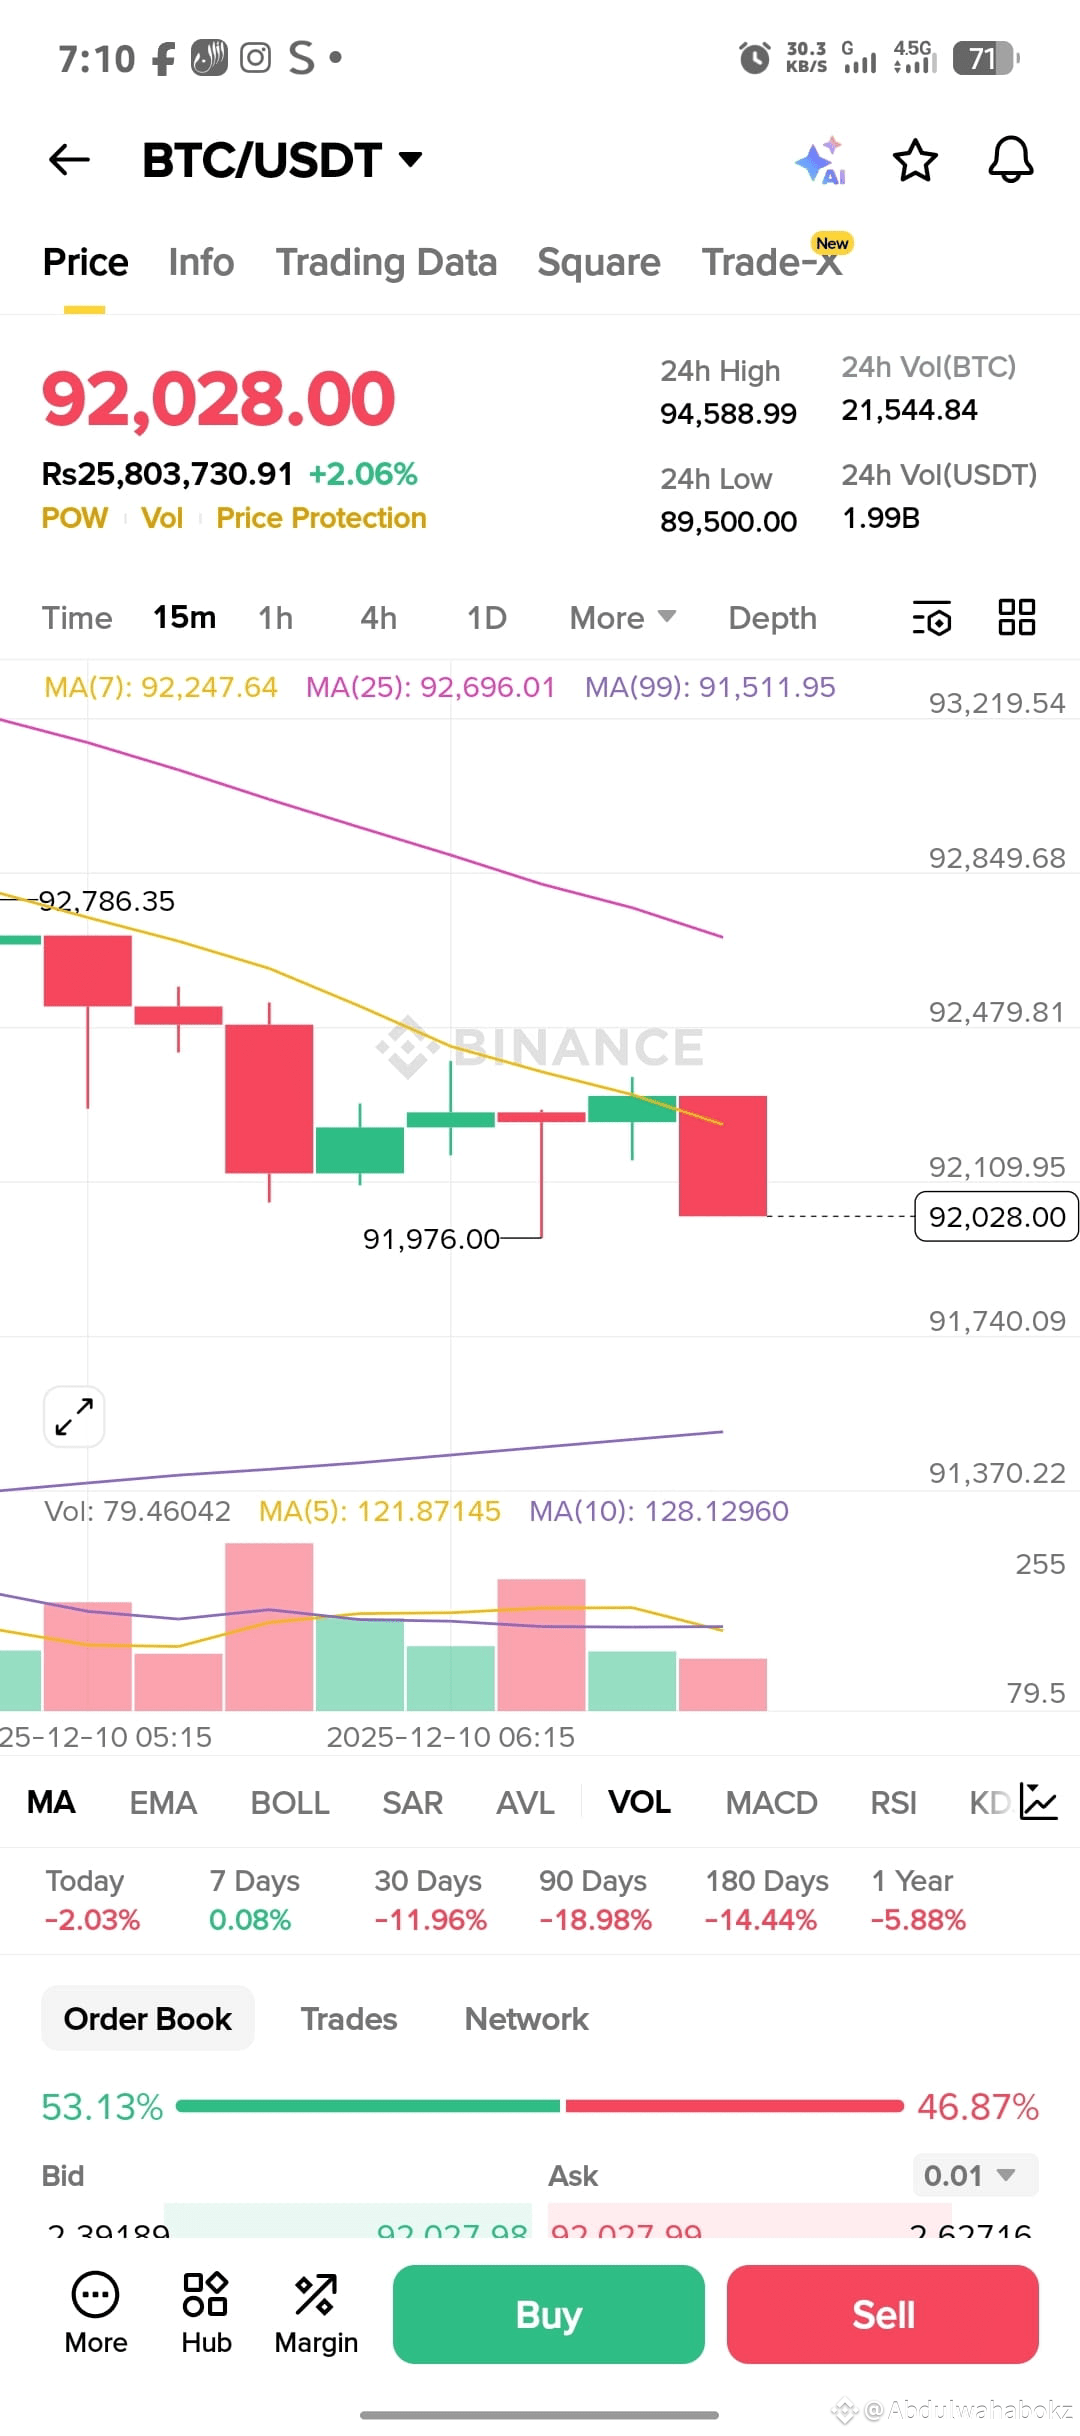
Most predictions suggest Bitcoin will trade between $91,000–$94,000 in the short term.
If a strong breakout happens, Bitcoin may move toward $110,000 again.
Technical indicators show the price is still stuck between support and resistance zones.
Meaning: A big jump is not expected immediately unless a positive market trigger appears.
---
🔭 Medium-Term Future (Possible Rise)
Analysts predict that in 2026 or later, Bitcoin could rise to $150,000–$250,000 if:
Institutional investors increase buying
Bitcoin ETFs attract more funds
Global market confidence improves
Some reports even give a $201,000 target for 2026.
---
⚠️ Why It May Not Rise Quickly
High volatility
Weak market sentiment
Global economic conditions
Regulations and interest rate changes
These factors slow down momentum.
---
🎯 My Simple Prediction
If things go well, Bitcoin has a higher chance of rising within the next 6–12 months (during 2026).
$BTC
Bitcoin is a crypto asset, and its future price direction is uncertain — but here is the latest analysis on when it may “go up”.
✅ Current Situation & Short-Term Forecast
Right now, several models show a bearish or sideways trend.
Most predictions suggest Bitcoin will trade between $91,000–$94,000 in the short term.
If a strong breakout happens, Bitcoin may move toward $110,000 again.
Technical indicators show the price is still stuck between support and resistance zones.
Meaning: A big jump is not expected immediately unless a positive market trigger appears.
---
🔭 Medium-Term Future (Possible Rise)
Analysts predict that in 2026 or later, Bitcoin could rise to $150,000–$250,000 if:
Institutional investors increase buying
Bitcoin ETFs attract more funds
Global market confidence improves
Some reports even give a $201,000 target for 2026.
---
⚠️ Why It May Not Rise Quickly
High volatility
Weak market sentiment
Global economic conditions
Regulations and interest rate changes
These factors slow down momentum.
---
🎯 My Simple Prediction
If things go well, Bitcoin has a higher chance of rising within the next 6–12 months (during 2026).
Bitcoin is a crypto asset, and its future price direction is uncertain — but here is the latest analysis on when it may “go up”.
✅ Current Situation & Short-Term Forecast
Right now, several models show a bearish or sideways trend.
Most predictions suggest Bitcoin will trade between $91,000–$94,000 in the short term.
If a strong breakout happens, Bitcoin may move toward $110,000 again.
Technical indicators show the price is still stuck between support and resistance zones.
Meaning: A big jump is not expected immediately unless a positive market trigger appears.
---
🔭 Medium-Term Future (Possible Rise)
Analysts predict that in 2026 or later, Bitcoin could rise to $150,000–$250,000 if:
Institutional investors increase buying
Bitcoin ETFs attract more funds
Global market confidence improves
Some reports even give a $201,000 target for 2026.
---
⚠️ Why It May Not Rise Quickly
High volatility
Weak market sentiment
Global economic conditions
Regulations and interest rate changes
These factors slow down momentum.
---
🎯 My Simple Prediction
If things go well, Bitcoin has a higher chance of rising within the next 6–12 months (during 2026).
2
Übersetzung ansehen
$BTC 📈 What analysts & experts are forecasting (2025–2030 and beyond)
Different analyses and forecasts vary quite a lot, showing how uncertain the future remains. Here’s an illustrative snapshot of what’s out there:
Forecast / Source Price Target / Outlook
Some 2025 “bullish cycle” forecasts BTC could hit ~ $180,000 during a 2025 rally.
Mid-term (2026–2027) “neutral to bullish” scenarios Estimates range ~$110,000–$165,000 for 2026, and potential further growth in 2027 under favorable conditions.
Long-term (2030) optimistic paths Some see $240,000–$340,000 by 2030 under strong demand and adoption.
Very bullish / “digital-gold” believers If adoption continues to accelerate — institutional, retail, global — BTC could significantly outperform many assets (though such forecasts come with high uncertainty).
One academic study published recently shows that advanced forecasting models (using techniques like VMD + LSTM) can predict short-term (≈30 days) BTC price movements with more reliability than simpler models — suggesting analytical techniques may improve, but price remains hard to predict long-term. #BTCVSGOLD #BinanceBlockchainWeek #TrumpTariffs #USJobsData #CPIWatch
$BTC 📈 What analysts & experts are forecasting (2025–2030 and beyond)
Different analyses and forecasts vary quite a lot, showing how uncertain the future remains. Here’s an illustrative snapshot of what’s out there:
Forecast / Source Price Target / Outlook
Some 2025 “bullish cycle” forecasts BTC could hit ~ $180,000 during a 2025 rally.
Mid-term (2026–2027) “neutral to bullish” scenarios Estimates range ~$110,000–$165,000 for 2026, and potential further growth in 2027 under favorable conditions.
Long-term (2030) optimistic paths Some see $240,000–$340,000 by 2030 under strong demand and adoption.
Very bullish / “digital-gold” believers If adoption continues to accelerate — institutional, retail, global — BTC could significantly outperform many assets (though such forecasts come with high uncertainty).
One academic study published recently shows that advanced forecasting models (using techniques like VMD + LSTM) can predict short-term (≈30 days) BTC price movements with more reliability than simpler models — suggesting analytical techniques may improve, but price remains hard to predict long-term. #BTCVSGOLD #BinanceBlockchainWeek #TrumpTariffs #USJobsData #CPIWatch
Different analyses and forecasts vary quite a lot, showing how uncertain the future remains. Here’s an illustrative snapshot of what’s out there:
Forecast / Source Price Target / Outlook
Some 2025 “bullish cycle” forecasts BTC could hit ~ $180,000 during a 2025 rally.
Mid-term (2026–2027) “neutral to bullish” scenarios Estimates range ~$110,000–$165,000 for 2026, and potential further growth in 2027 under favorable conditions.
Long-term (2030) optimistic paths Some see $240,000–$340,000 by 2030 under strong demand and adoption.
Very bullish / “digital-gold” believers If adoption continues to accelerate — institutional, retail, global — BTC could significantly outperform many assets (though such forecasts come with high uncertainty).
One academic study published recently shows that advanced forecasting models (using techniques like VMD + LSTM) can predict short-term (≈30 days) BTC price movements with more reliability than simpler models — suggesting analytical techniques may improve, but price remains hard to predict long-term. #BTCVSGOLD #BinanceBlockchainWeek #TrumpTariffs #USJobsData #CPIWatch
12
Übersetzung ansehen
$$BTC recently dipped below $88,000 — a notable support level — before rebounding.
As of early December 2025, the market appears cautiously optimistic: some analysts see a recovery toward $98,000–$102,000 by year-end.
#BTCVSGOLD #BinanceBlockchainWeek #TrumpTariffs #USJobsData #CPIWatch
$
$BTC recently dipped below $88,000 — a notable support level — before rebounding.
As of early December 2025, the market appears cautiously optimistic: some analysts see a recovery toward $98,000–$102,000 by year-end.
#BTCVSGOLD #BinanceBlockchainWeek #TrumpTariffs #USJobsData #CPIWatch
As of early December 2025, the market appears cautiously optimistic: some analysts see a recovery toward $98,000–$102,000 by year-end.
#BTCVSGOLD #BinanceBlockchainWeek #TrumpTariffs #USJobsData #CPIWatch
6
8
Übersetzung ansehen
See my returns and portfolio breakdown. Follow for investment tips
See my returns and portfolio breakdown. Follow for investment tips
10
10
Anmelden und weiter Inhalte entdecken
Krypto-Nutzer weltweit auf Binance Square kennenlernen
⚡️ Bleib in Sachen Krypto stets am Puls.
💬 Die weltgrößte Kryptobörse vertraut darauf.
👍 Erhalte verlässliche Einblicke von verifizierten Creators.
E-Mail-Adresse/Telefonnummer
Trendthemen
BinanceLaunchesBinanceIntelligence
430,542 Aufrufe
3,165 Kommentare
#BinanceLaunchesBinanceIntelligence
⚡ KI trifft auf Krypto-Trading: Binance Intelligence ist live! ⚡
Trading erhält mit der neuen KI-Suite von Binance ein gewaltiges Upgrade:
1️⃣ Binance AI: Personalisierte Markt-Dashboards und Audio-Briefings zu makroökonomischen Marktentwicklungen im 4-Stunden-Takt.
2️⃣ Binance AI Pro: Erstelle und führe automatisierte Strategien mit einfachen Eingaben in natürlicher Sprache aus.
3️⃣ Binance Agent OS: Entwickler-Framework für autonome Finanz-KI-Agenten.
Beschreibe deine Strategie ➔ Teste sie im Paper-Trading ➔ Führe sie rund um die Uhr aus.
Entwickelst du deine nächste Trading-Strategie mit KI? Teile deine Gedanken unten in den Kommentaren! 👇
#BinanceLaunchesBinanceIntelligence #BinanceSquare #CryptoAI #Trading $EDEN
Hazi BNB
·1 Likes
·955 Aufrufe
BitcoinTargets2026OpenAt$87570
2,721 Aufrufe
81 Kommentare
BitcoinRejectedAt$87KThirdTime
2,627 Aufrufe
66 Kommentare