

Zeesha_Ali76
5 Beiträge

Zeesha_Ali76
Melden
Nutzer blockieren
Trade eröffnen
4.4 Jahre
0 Following
0 Follower
0 Like gegeben
Beiträge
Portfolio
·
--
Übersetzung ansehen
$SOL
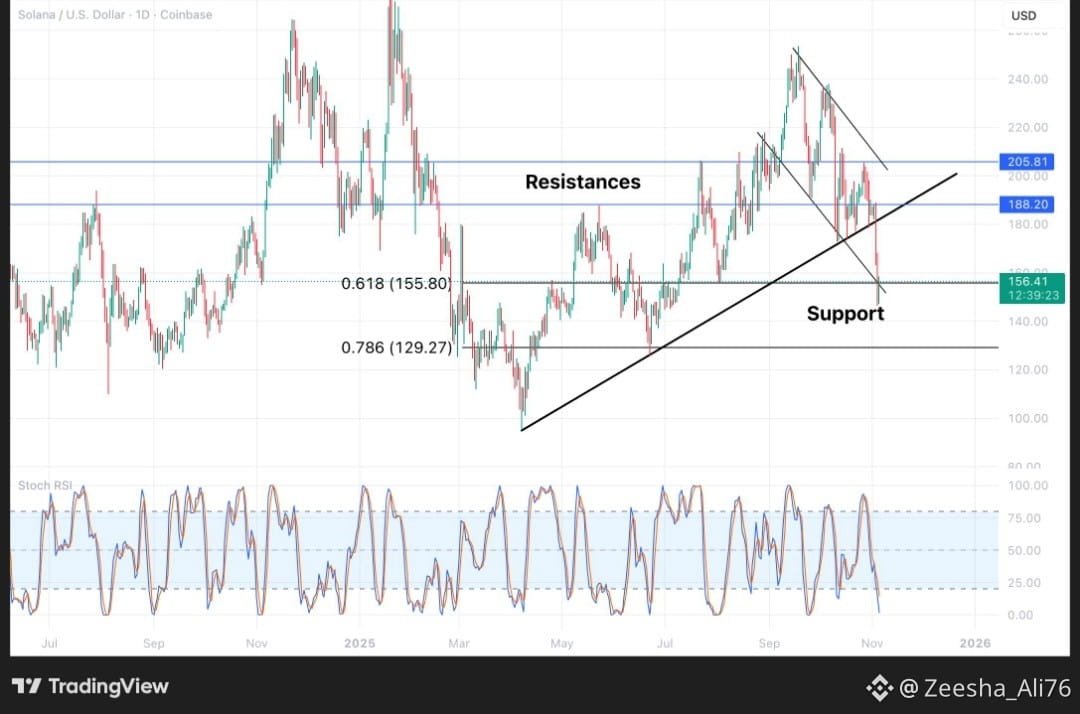
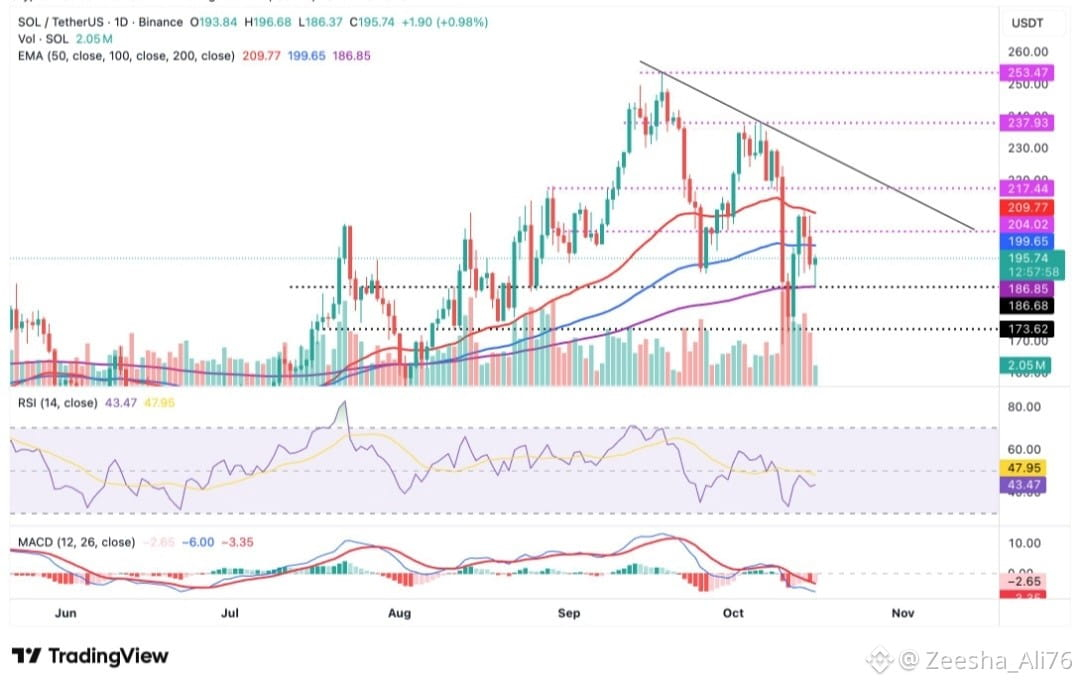
SOL (Solana) ka latest technical analysis dekh kar:
Current price: ~$119.4
Nearest support: $118.2
Next support: $112.3
Immediate resistance: $119.8–$120
Strong resistance: $124.4
Uske upar levels: $129–$141
Daily RSI: 63.7, yani momentum positive hai lekin abhi overbought zone (>70) mein nahi.
Daily/weekly trend indicators filhal bullish side par hain, lekin $118.2 ke neeche daily close short-term structure ko weak kar sakta hai.
Important levels:
$120 → $124.4 → $129 → $141
$118.2 → $112.3 → $102.4
#GreekPoliceBustCryptoScamRingArrest17
$SOL
SOL (Solana) ka latest technical analysis dekh kar:
Current price: ~$119.4
Nearest support: $118.2
Next support: $112.3
Immediate resistance: $119.8–$120
Strong resistance: $124.4
Uske upar levels: $129–$141
Daily RSI: 63.7, yani momentum positive hai lekin abhi overbought zone (>70) mein nahi.
Daily/weekly trend indicators filhal bullish side par hain, lekin $118.2 ke neeche daily close short-term structure ko weak kar sakta hai.
Important levels:
$120 → $124.4 → $129 → $141
$118.2 → $112.3 → $102.4
#GreekPoliceBustCryptoScamRingArrest17
SOL (Solana) ka latest technical analysis dekh kar:
Current price: ~$119.4
Nearest support: $118.2
Next support: $112.3
Immediate resistance: $119.8–$120
Strong resistance: $124.4
Uske upar levels: $129–$141
Daily RSI: 63.7, yani momentum positive hai lekin abhi overbought zone (>70) mein nahi.
Daily/weekly trend indicators filhal bullish side par hain, lekin $118.2 ke neeche daily close short-term structure ko weak kar sakta hai.
Important levels:
$120 → $124.4 → $129 → $141
$118.2 → $112.3 → $102.4
#GreekPoliceBustCryptoScamRingArrest17
40
·
--
Übersetzung ansehen
$BNB
BNB کی current technical picture کے مطابق price تقریباً $778 کے آس پاس ہے۔ آج کی مختلف market readings میں BNB نے $770–$775 area کو اہم resistance کے طور پر test کیا ہے۔
Key levels:
🟢 Support: $756 → $733
🔴 Resistance: $770–$775 → $803
🚀 اگر $803 کے اوپر daily close ملے تو اگلا اہم technical area $881 کے قریب ہے۔
⚠️ $756 کے نیچے weakness بڑھے تو $733 اگلا support ہے۔
Daily RSI تقریباً 57 ہے، جبکہ price major moving averages کے اوپر ہے؛ اس لیے trend structure فی الحال positive ہے، لیکن MACD میں کچھ short-term caution موجود ہے۔
— اسی طرح جیسے ETH والی بنائی تھی۔
$BNB
BNB کی current technical picture کے مطابق price تقریباً $778 کے آس پاس ہے۔ آج کی مختلف market readings میں BNB نے $770–$775 area کو اہم resistance کے طور پر test کیا ہے۔
Key levels:
🟢 Support: $756 → $733
🔴 Resistance: $770–$775 → $803
🚀 اگر $803 کے اوپر daily close ملے تو اگلا اہم technical area $881 کے قریب ہے۔
⚠️ $756 کے نیچے weakness بڑھے تو $733 اگلا support ہے۔
Daily RSI تقریباً 57 ہے، جبکہ price major moving averages کے اوپر ہے؛ اس لیے trend structure فی الحال positive ہے، لیکن MACD میں کچھ short-term caution موجود ہے۔
— اسی طرح جیسے ETH والی بنائی تھی۔
BNB کی current technical picture کے مطابق price تقریباً $778 کے آس پاس ہے۔ آج کی مختلف market readings میں BNB نے $770–$775 area کو اہم resistance کے طور پر test کیا ہے۔
Key levels:
🟢 Support: $756 → $733
🔴 Resistance: $770–$775 → $803
🚀 اگر $803 کے اوپر daily close ملے تو اگلا اہم technical area $881 کے قریب ہے۔
⚠️ $756 کے نیچے weakness بڑھے تو $733 اگلا support ہے۔
Daily RSI تقریباً 57 ہے، جبکہ price major moving averages کے اوپر ہے؛ اس لیے trend structure فی الحال positive ہے، لیکن MACD میں کچھ short-term caution موجود ہے۔
— اسی طرح جیسے ETH والی بنائی تھی۔
34
·
--
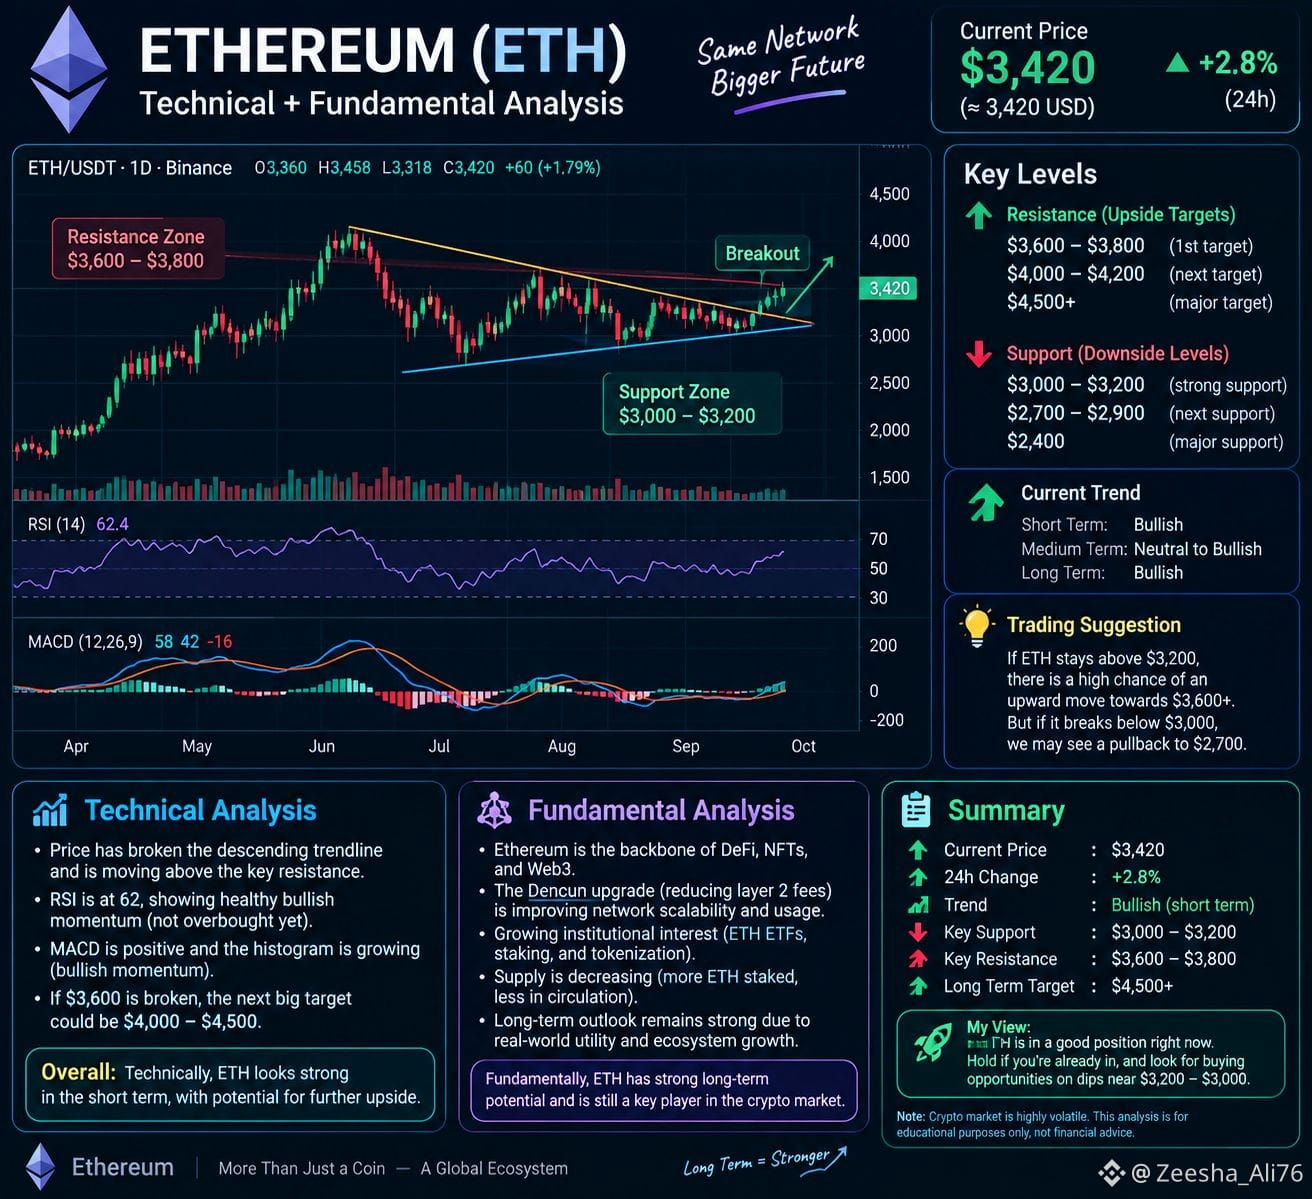
$ETH Aktuelle Analyse — 3. Okt. 2026
Aktueller Preis: ungefähr 2.680 $
ETH ist heute ungefähr 1,5 % im Minus.
Technisches Bild:
🟢 Unterstützung: 2.650–2.680 $
🟡 Wenn 2.650 gehalten wird, könnte 2.800 erneut getestet werden.
🔴 Wenn 2.650 deutlich nachgibt, liegt der nächste wichtige Bereich bei ungefähr 2.500.
ETH befindet sich derzeit über seinen 50-Tage-(~2.465) und 200-Tage-(~2.315)-Durchschnitten, was für die mittelfristige Struktur entscheidend ist.
Kurzfristiger Ausblick: ETH befindet sich aktuell in einer Entscheidungszone im Bereich 2.650–2.800 $. Wenn die Stärke über 2.800 kommt, könnte sich der Aufwärtsimpuls verbessern; unter 2.650 könnte die Schwäche zunehmen.
Fundamental: In den letzten 3 Handelssitzungen wurden aus den US-Spot-ETH-ETFs ungefähr 118 Mio. $ Netto-Abflüsse gemeldet, was kurzfristig auf die Nachfrage drückt.
Chart-Bild: Oben im Live-Chart könnt ihr die aktuelle ETH-Bewegung sehen.
#GreekPoliceBustCryptoScamRingArrest17
#FedOctoberRateHikeOddsFallTo17%
$ETH Aktuelle Analyse — 3. Okt. 2026
Aktueller Preis: ungefähr 2.680 $
ETH ist heute ungefähr 1,5 % im Minus.
Technisches Bild:
🟢 Unterstützung: 2.650–2.680 $
🟡 Wenn 2.650 gehalten wird, könnte 2.800 erneut getestet werden.
🔴 Wenn 2.650 deutlich nachgibt, liegt der nächste wichtige Bereich bei ungefähr 2.500.
ETH befindet sich derzeit über seinen 50-Tage-(~2.465) und 200-Tage-(~2.315)-Durchschnitten, was für die mittelfristige Struktur entscheidend ist.
Kurzfristiger Ausblick: ETH befindet sich aktuell in einer Entscheidungszone im Bereich 2.650–2.800 $. Wenn die Stärke über 2.800 kommt, könnte sich der Aufwärtsimpuls verbessern; unter 2.650 könnte die Schwäche zunehmen.
Fundamental: In den letzten 3 Handelssitzungen wurden aus den US-Spot-ETH-ETFs ungefähr 118 Mio. $ Netto-Abflüsse gemeldet, was kurzfristig auf die Nachfrage drückt.
Chart-Bild: Oben im Live-Chart könnt ihr die aktuelle ETH-Bewegung sehen.
#GreekPoliceBustCryptoScamRingArrest17
#FedOctoberRateHikeOddsFallTo17%
Aktueller Preis: ungefähr 2.680 $
ETH ist heute ungefähr 1,5 % im Minus.
Technisches Bild:
🟢 Unterstützung: 2.650–2.680 $
🟡 Wenn 2.650 gehalten wird, könnte 2.800 erneut getestet werden.
🔴 Wenn 2.650 deutlich nachgibt, liegt der nächste wichtige Bereich bei ungefähr 2.500.
ETH befindet sich derzeit über seinen 50-Tage-(~2.465) und 200-Tage-(~2.315)-Durchschnitten, was für die mittelfristige Struktur entscheidend ist.
Kurzfristiger Ausblick: ETH befindet sich aktuell in einer Entscheidungszone im Bereich 2.650–2.800 $. Wenn die Stärke über 2.800 kommt, könnte sich der Aufwärtsimpuls verbessern; unter 2.650 könnte die Schwäche zunehmen.
Fundamental: In den letzten 3 Handelssitzungen wurden aus den US-Spot-ETH-ETFs ungefähr 118 Mio. $ Netto-Abflüsse gemeldet, was kurzfristig auf die Nachfrage drückt.
Chart-Bild: Oben im Live-Chart könnt ihr die aktuelle ETH-Bewegung sehen.
#GreekPoliceBustCryptoScamRingArrest17
#FedOctoberRateHikeOddsFallTo17%
70
·
--
Übersetzung ansehen
$BTC BTC/USD — Fundamental & Technical Analysis
As of 3 October 2026
Technical Analysis
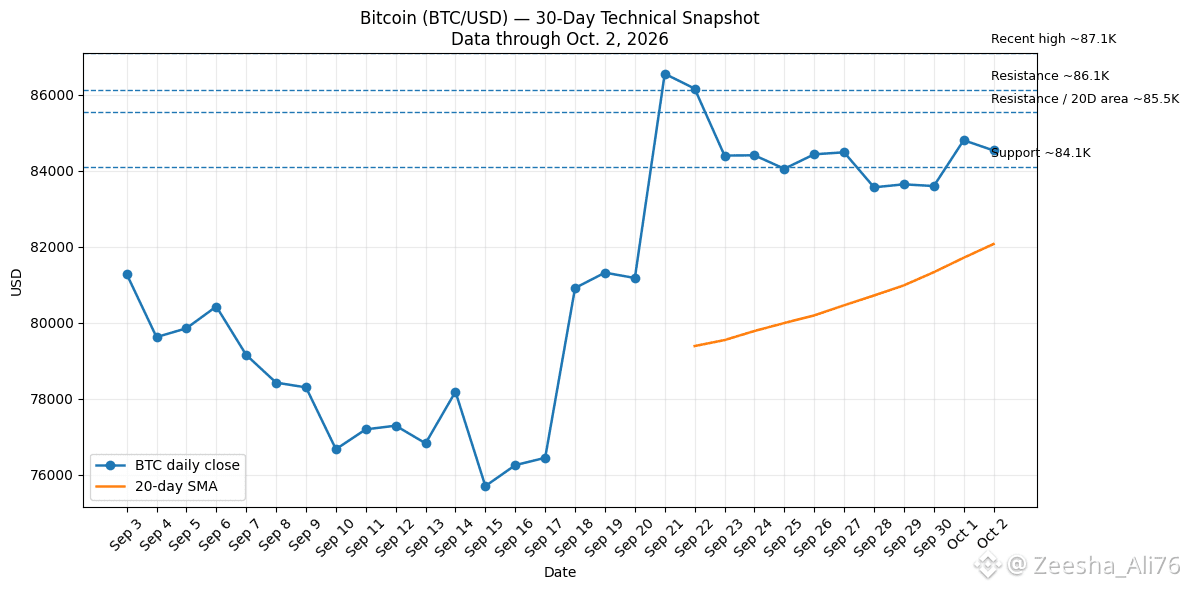
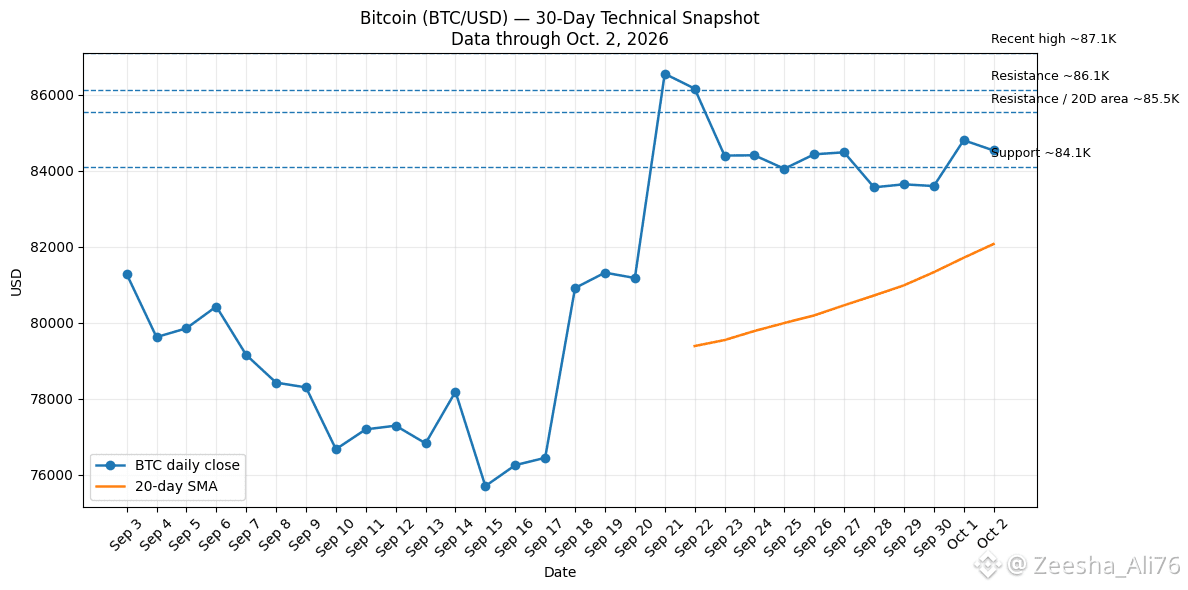
BTC is currently around $84.3K–$84.7K. The recent 30-day data shows a strong recovery from the $75–76K area, followed by consolidation around $84K–$86K.
Key levels:
Support: ~$84.1K
Next support: ~$82.5K–$83K
Resistance: ~$85.5K
Major resistance: ~$86.1K
Recent high: ~$87.1K
Current indicators are mixed. One BTC/USD technical snapshot shows RSI around 46, while the short moving averages are above price and the 50/100/200-day averages are lower. This indicates short-term consolidation rather than a clean one-directional setup.
Fundamental Analysis
Bitcoin's fundamental structure remains based on:
Fixed maximum supply of 21 million BTC
Current block subsidy of 3.125 BTC
Next halving is estimated for 2028, reducing the subsidy to 1.5625 BTC.
Network security remains substantial: recent estimates put Bitcoin's hashrate roughly around 900–1,000 EH/s.
Institutional/ETF demand is an important market factor. Reuters reported renewed ETF inflows as one reason cited by Citi for its October 2026 revision to its Bitcoin outlook.
Market Structure
The chart shows a sharp move from approximately $76K → $87K, followed by a pullback/consolidation around $84K–$85K.
Important levels to watch:
84.1K → 85.5K → 86.1K → 87.1K
A sustained move above a resistance level would change the technical structure; conversely, losing the $84K area would make the lower support zones more relevant. These are technical scenarios, not guaranteed price predictions.
#G7PlansToReleaseUpTo100MBarrelsOilDiesel
#ICBASuesOCCOverCryptoBankCharters
#BTC70K✈️
$BTC BTC/USD — Fundamental & Technical Analysis
As of 3 October 2026
Technical Analysis
BTC is currently around $84.3K–$84.7K. The recent 30-day data shows a strong recovery from the $75–76K area, followed by consolidation around $84K–$86K.
Key levels:
Support: ~$84.1K
Next support: ~$82.5K–$83K
Resistance: ~$85.5K
Major resistance: ~$86.1K
Recent high: ~$87.1K
Current indicators are mixed. One BTC/USD technical snapshot shows RSI around 46, while the short moving averages are above price and the 50/100/200-day averages are lower. This indicates short-term consolidation rather than a clean one-directional setup.
Fundamental Analysis
Bitcoin's fundamental structure remains based on:
Fixed maximum supply of 21 million BTC
Current block subsidy of 3.125 BTC
Next halving is estimated for 2028, reducing the subsidy to 1.5625 BTC.
Network security remains substantial: recent estimates put Bitcoin's hashrate roughly around 900–1,000 EH/s.
Institutional/ETF demand is an important market factor. Reuters reported renewed ETF inflows as one reason cited by Citi for its October 2026 revision to its Bitcoin outlook.
Market Structure
The chart shows a sharp move from approximately $76K → $87K, followed by a pullback/consolidation around $84K–$85K.
Important levels to watch:
84.1K → 85.5K → 86.1K → 87.1K
A sustained move above a resistance level would change the technical structure; conversely, losing the $84K area would make the lower support zones more relevant. These are technical scenarios, not guaranteed price predictions.
#G7PlansToReleaseUpTo100MBarrelsOilDiesel
#ICBASuesOCCOverCryptoBankCharters
#BTC70K✈️
As of 3 October 2026
Technical Analysis
BTC is currently around $84.3K–$84.7K. The recent 30-day data shows a strong recovery from the $75–76K area, followed by consolidation around $84K–$86K.
Key levels:
Support: ~$84.1K
Next support: ~$82.5K–$83K
Resistance: ~$85.5K
Major resistance: ~$86.1K
Recent high: ~$87.1K
Current indicators are mixed. One BTC/USD technical snapshot shows RSI around 46, while the short moving averages are above price and the 50/100/200-day averages are lower. This indicates short-term consolidation rather than a clean one-directional setup.
Fundamental Analysis
Bitcoin's fundamental structure remains based on:
Fixed maximum supply of 21 million BTC
Current block subsidy of 3.125 BTC
Next halving is estimated for 2028, reducing the subsidy to 1.5625 BTC.
Network security remains substantial: recent estimates put Bitcoin's hashrate roughly around 900–1,000 EH/s.
Institutional/ETF demand is an important market factor. Reuters reported renewed ETF inflows as one reason cited by Citi for its October 2026 revision to its Bitcoin outlook.
Market Structure
The chart shows a sharp move from approximately $76K → $87K, followed by a pullback/consolidation around $84K–$85K.
Important levels to watch:
84.1K → 85.5K → 86.1K → 87.1K
A sustained move above a resistance level would change the technical structure; conversely, losing the $84K area would make the lower support zones more relevant. These are technical scenarios, not guaranteed price predictions.
#G7PlansToReleaseUpTo100MBarrelsOilDiesel
#ICBASuesOCCOverCryptoBankCharters
#BTC70K✈️
63
·
--
Übersetzung ansehen
$BTC
BTC/USD — Fundamental & Technical Analysis
Technical Analysis
BTC is currently around $84.3K–$84.7K. The recent 30-day data shows a strong recovery from the $75–76K area, followed by consolidation around $84K–$86K.
Key levels:
Support: ~$84.1K
Next support: ~$82.5K–$83K
Resistance: ~$85.5K
Major resistance: ~$86.1K
Recent high: ~$87.1K
Current indicators are mixed. One BTC/USD technical snapshot shows RSI around 46, while the short moving averages are above price and the 50/100/200-day averages are lower. This indicates short-term consolidation rather than a clean one-directional setup.
Fundamental Analysis
Bitcoin's fundamental structure remains based on:
Fixed maximum supply of 21 million BTC
Current block subsidy of 3.125 BTC
Next halving is estimated for 2028, reducing the subsidy to 1.5625 BTC.
Network security remains substantial: recent estimates put Bitcoin's hashrate roughly around 900–1,000 EH/s.
Institutional/ETF demand is an important market factor. Reuters reported renewed ETF inflows as one reason cited by Citi for its October 2026 revision to its Bitcoin outlook.
Market Structure
The chart shows a sharp move from approximately $76K → $87K, followed by a pullback/consolidation around $84K–$85K.
Important levels to watch:
84.1K → 85.5K → 86.1K → 87.1K
A sustained move above a resistance level would change the technical structure; conversely, losing the $84K area would make the lower support zones more relevant. These are technical scenarios, not guaranteed price predictions.
#NFPWatch
#BitcoinFundingRateTriplesTo10%
#BTC☀️
#USSeptemberPayrollsAdd29KUnemploymentRises4.2%
$BTC
BTC/USD — Fundamental & Technical Analysis
Technical Analysis
BTC is currently around $84.3K–$84.7K. The recent 30-day data shows a strong recovery from the $75–76K area, followed by consolidation around $84K–$86K.
Key levels:
Support: ~$84.1K
Next support: ~$82.5K–$83K
Resistance: ~$85.5K
Major resistance: ~$86.1K
Recent high: ~$87.1K
Current indicators are mixed. One BTC/USD technical snapshot shows RSI around 46, while the short moving averages are above price and the 50/100/200-day averages are lower. This indicates short-term consolidation rather than a clean one-directional setup.
Fundamental Analysis
Bitcoin's fundamental structure remains based on:
Fixed maximum supply of 21 million BTC
Current block subsidy of 3.125 BTC
Next halving is estimated for 2028, reducing the subsidy to 1.5625 BTC.
Network security remains substantial: recent estimates put Bitcoin's hashrate roughly around 900–1,000 EH/s.
Institutional/ETF demand is an important market factor. Reuters reported renewed ETF inflows as one reason cited by Citi for its October 2026 revision to its Bitcoin outlook.
Market Structure
The chart shows a sharp move from approximately $76K → $87K, followed by a pullback/consolidation around $84K–$85K.
Important levels to watch:
84.1K → 85.5K → 86.1K → 87.1K
A sustained move above a resistance level would change the technical structure; conversely, losing the $84K area would make the lower support zones more relevant. These are technical scenarios, not guaranteed price predictions.
#NFPWatch
#BitcoinFundingRateTriplesTo10%
#BTC☀️
#USSeptemberPayrollsAdd29KUnemploymentRises4.2%
BTC/USD — Fundamental & Technical Analysis
Technical Analysis
BTC is currently around $84.3K–$84.7K. The recent 30-day data shows a strong recovery from the $75–76K area, followed by consolidation around $84K–$86K.
Key levels:
Support: ~$84.1K
Next support: ~$82.5K–$83K
Resistance: ~$85.5K
Major resistance: ~$86.1K
Recent high: ~$87.1K
Current indicators are mixed. One BTC/USD technical snapshot shows RSI around 46, while the short moving averages are above price and the 50/100/200-day averages are lower. This indicates short-term consolidation rather than a clean one-directional setup.
Fundamental Analysis
Bitcoin's fundamental structure remains based on:
Fixed maximum supply of 21 million BTC
Current block subsidy of 3.125 BTC
Next halving is estimated for 2028, reducing the subsidy to 1.5625 BTC.
Network security remains substantial: recent estimates put Bitcoin's hashrate roughly around 900–1,000 EH/s.
Institutional/ETF demand is an important market factor. Reuters reported renewed ETF inflows as one reason cited by Citi for its October 2026 revision to its Bitcoin outlook.
Market Structure
The chart shows a sharp move from approximately $76K → $87K, followed by a pullback/consolidation around $84K–$85K.
Important levels to watch:
84.1K → 85.5K → 86.1K → 87.1K
A sustained move above a resistance level would change the technical structure; conversely, losing the $84K area would make the lower support zones more relevant. These are technical scenarios, not guaranteed price predictions.
#NFPWatch
#BitcoinFundingRateTriplesTo10%
#BTC☀️
#USSeptemberPayrollsAdd29KUnemploymentRises4.2%
109
Anmelden und weiter Inhalte entdecken
Krypto-Nutzer weltweit auf Binance Square kennenlernen
⚡️ Bleib in Sachen Krypto stets am Puls.
💬 Die weltgrößte Kryptobörse vertraut darauf.
👍 Erhalte verlässliche Einblicke von verifizierten Creators.
E-Mail-Adresse/Telefonnummer
Trendthemen
ZcashETFPostsFirstWeeklyOutflow$93.6M
26,367 Aufrufe
71 Kommentare
ZCASH-ETF-UPDATE
Der Zcash-ETF verzeichnete seit dem Start im August erstmals einen wöchentlichen Nettoabfluss.
Anleger zogen 93,6 Mio. $ ab, da <a>$ZEC </a> in Richtung 1.300 $ fiel. Grayscale’s ZCSH hatte zwei Wochen zuvor 98,2 Mio. $ angezogen, doch laut SoSoValue wurden seit dem 22. September keine täglichen Nettozuflüsse mehr erfasst.
ZEC lag am 3. Oktober bei etwa 1.308 $, ein Rückgang von rund 17,5% für die Woche und etwa 23% im Vergleich zu seinem jüngsten Hoch bei 1.690 $.
$ZEC
Vicky-143
·2 Likes
·2.2k Aufrufe
GreekPoliceBustCryptoScamRingArrest17
41,540 Aufrufe
390 Kommentare
BitcoinRejectedAt$87K
104,625 Aufrufe
132 Kommentare