
Dark king The noob
67 Beiträge

Dark king The noob
Melden
Nutzer blockieren

Top-Trader nach Handelsvolumen in den letzten 30 Tagen
6 Following
54 Follower
170 Like gegeben
1 Abzeichen
Beiträge
Alle
Zitierungen
Übersetzung ansehen
$SOL Perfect example how to spot good entry point see market 97.95 to 99.23 maintain sequence den stayed there market sometimes suddenly up for 99.72 then again came back to area . There is high chance to revisit 97.95 area whether a bit up or more down . den we will know our long entry point.
$SOL Perfect example how to spot good entry point see market 97.95 to 99.23 maintain sequence den stayed there market sometimes suddenly up for 99.72 then again came back to area . There is high chance to revisit 97.95 area whether a bit up or more down . den we will know our long entry point.
4
1
161
$SOL Der Markt ist 4-5 Stunden im Bereich um 101,50 bis 100 geblieben – das ist der Hinweis. Danach wirst du eine große Kursbewegung mit einer roten Kerze bei 97,98 sehen – ein weiterer Hinweis. Das ist der Bereich, den wir genau beobachten werden. Es besteht die Chance, auf das Niveau 97-96 zu gehen oder bei etwa 97 zu bleiben und dann erneut einen Push Richtung 103 zu versuchen
$SOL Der Markt ist 4-5 Stunden im Bereich um 101,50 bis 100 geblieben – das ist der Hinweis. Danach wirst du eine große Kursbewegung mit einer roten Kerze bei 97,98 sehen – ein weiterer Hinweis. Das ist der Bereich, den wir genau beobachten werden. Es besteht die Chance, auf das Niveau 97-96 zu gehen oder bei etwa 97 zu bleiben und dann erneut einen Push Richtung 103 zu versuchen
102
Übersetzung ansehen
damn 104 area long entry that was damn late long . now market will try from 99-97 area. if you can hold thats fine if not this is chanceto close
damn 104 area long entry that was damn late long . now market will try from 99-97 area. if you can hold thats fine if not this is chanceto close

Rozanne Rotando HSjM
·
--
$SOL
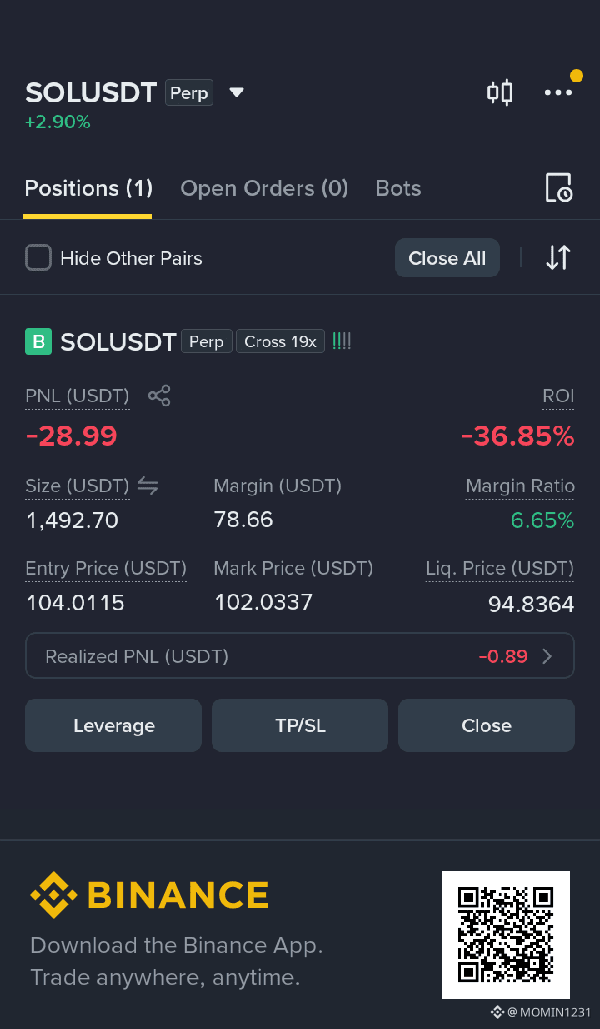
😭😭😭😭😭😭😭😭hold or close?
help plz
😭😭😭😭😭😭😭😭hold or close?
help plz
2
34
$SOL — Warum ich 97–99 beobachte 👀
Schau dir die Reaktion aus demselben Bereich an.
Zuvor:
105.77 → 100.30
Dann hat die erste Reaktion zurückgestoßen auf etwa 103.10.
Das war eine starke Gegenreaktion.
Diesmal:
104.81 → 100.50
Dann erreichte die erste Reaktion nur noch etwa 101.54, bevor der Verkaufsdruck wieder zurückkam.
Gleicher allgemeiner Bereich.
Ähnlicher Rückgang.
Aber die Gegenreaktion ist viel kleiner.
Für mich ist das eine Information.
Es deutet darauf hin, dass Käufer nicht dieselbe Stärke zeigen wie zuvor, also wird die Wahrscheinlichkeit eines tieferen Besuchs Richtung 99–98 interessanter.
Wenn SOL 99–98 erreicht, dann möchte ich mir die dort verbrachte Zeit ansehen.
Wenn der Preis etwa 8–10+ Stunden in diesem Bereich aufbaut, gefolgt von einer weiteren Abwärtsverschiebung von $1–$2, und dann beginnt, abzulehnen/ zurückzuerobern statt tieferes Akzeptieren, dann könnte das zu einem wichtigen Hinweis werden.
Zum Beispiel:
99–98 → Zeitaufbau → Abwärtsdruck → fehlende Akzeptanz → Rückeroberung
Wenn sich diese Struktur entwickelt, würde ich anfangen, auf einen möglichen Aufwärtsimpuls Richtung 102 → 103–104 zu achten.
Der Punkt ist nicht:
„SOL muss auf 97.“
Der Punkt ist:
Die schwächere Reaktion von 100.50 verändert die Wahrscheinlichkeit, dass ein tieferer Zwischenstopp nötig wird.
Ich beobachte die Reaktion, die verbrachte Zeit und die Akzeptanz — ich versuche nicht, jede Kerze vorherzusagen.
Keine Finanzberatung. Nur meine Beobachtung zur Marktstruktur.
$SOL — Warum ich 97–99 beobachte 👀
Schau dir die Reaktion aus demselben Bereich an.
Zuvor:
105.77 → 100.30
Dann hat die erste Reaktion zurückgestoßen auf etwa 103.10.
Das war eine starke Gegenreaktion.
Diesmal:
104.81 → 100.50
Dann erreichte die erste Reaktion nur noch etwa 101.54, bevor der Verkaufsdruck wieder zurückkam.
Gleicher allgemeiner Bereich.
Ähnlicher Rückgang.
Aber die Gegenreaktion ist viel kleiner.
Für mich ist das eine Information.
Es deutet darauf hin, dass Käufer nicht dieselbe Stärke zeigen wie zuvor, also wird die Wahrscheinlichkeit eines tieferen Besuchs Richtung 99–98 interessanter.
Wenn SOL 99–98 erreicht, dann möchte ich mir die dort verbrachte Zeit ansehen.
Wenn der Preis etwa 8–10+ Stunden in diesem Bereich aufbaut, gefolgt von einer weiteren Abwärtsverschiebung von $1–$2, und dann beginnt, abzulehnen/ zurückzuerobern statt tieferes Akzeptieren, dann könnte das zu einem wichtigen Hinweis werden.
Zum Beispiel:
99–98 → Zeitaufbau → Abwärtsdruck → fehlende Akzeptanz → Rückeroberung
Wenn sich diese Struktur entwickelt, würde ich anfangen, auf einen möglichen Aufwärtsimpuls Richtung 102 → 103–104 zu achten.
Der Punkt ist nicht:
„SOL muss auf 97.“
Der Punkt ist:
Die schwächere Reaktion von 100.50 verändert die Wahrscheinlichkeit, dass ein tieferer Zwischenstopp nötig wird.
Ich beobachte die Reaktion, die verbrachte Zeit und die Akzeptanz — ich versuche nicht, jede Kerze vorherzusagen.
Keine Finanzberatung. Nur meine Beobachtung zur Marktstruktur.
Schau dir die Reaktion aus demselben Bereich an.
Zuvor:
105.77 → 100.30
Dann hat die erste Reaktion zurückgestoßen auf etwa 103.10.
Das war eine starke Gegenreaktion.
Diesmal:
104.81 → 100.50
Dann erreichte die erste Reaktion nur noch etwa 101.54, bevor der Verkaufsdruck wieder zurückkam.
Gleicher allgemeiner Bereich.
Ähnlicher Rückgang.
Aber die Gegenreaktion ist viel kleiner.
Für mich ist das eine Information.
Es deutet darauf hin, dass Käufer nicht dieselbe Stärke zeigen wie zuvor, also wird die Wahrscheinlichkeit eines tieferen Besuchs Richtung 99–98 interessanter.
Wenn SOL 99–98 erreicht, dann möchte ich mir die dort verbrachte Zeit ansehen.
Wenn der Preis etwa 8–10+ Stunden in diesem Bereich aufbaut, gefolgt von einer weiteren Abwärtsverschiebung von $1–$2, und dann beginnt, abzulehnen/ zurückzuerobern statt tieferes Akzeptieren, dann könnte das zu einem wichtigen Hinweis werden.
Zum Beispiel:
99–98 → Zeitaufbau → Abwärtsdruck → fehlende Akzeptanz → Rückeroberung
Wenn sich diese Struktur entwickelt, würde ich anfangen, auf einen möglichen Aufwärtsimpuls Richtung 102 → 103–104 zu achten.
Der Punkt ist nicht:
„SOL muss auf 97.“
Der Punkt ist:
Die schwächere Reaktion von 100.50 verändert die Wahrscheinlichkeit, dass ein tieferer Zwischenstopp nötig wird.
Ich beobachte die Reaktion, die verbrachte Zeit und die Akzeptanz — ich versuche nicht, jede Kerze vorherzusagen.
Keine Finanzberatung. Nur meine Beobachtung zur Marktstruktur.
2
160
$SOL Jetzt keine Handelszone, das ist die Baustellenzone jetzt – behalte den Markt im Blick, wenn er im Bereich von 100.80 bis 102.50 bleibt, um ca. 7–8 Uhr oder länger, und dann plötzlich fällt mit einer großen roten Kerze oder anhaltend roten Kerzen für 99.80–100.30.
das kann ein Hinweis für einen Long-Einstieg sein”
Am besten am Rand einsteigen. Wenn der Markt erneut 102 erreicht, kann es stoppen oder sich verlangsamen – gerate nicht in Panik oder schließe den Trade. Selbst wenn der Markt wieder für den Bereich um 100 fällt, hab Geduld, halte und nimm den TP – 104–106.
$SOL Jetzt keine Handelszone, das ist die Baustellenzone jetzt – behalte den Markt im Blick, wenn er im Bereich von 100.80 bis 102.50 bleibt, um ca. 7–8 Uhr oder länger, und dann plötzlich fällt mit einer großen roten Kerze oder anhaltend roten Kerzen für 99.80–100.30.
das kann ein Hinweis für einen Long-Einstieg sein”
Am besten am Rand einsteigen. Wenn der Markt erneut 102 erreicht, kann es stoppen oder sich verlangsamen – gerate nicht in Panik oder schließe den Trade. Selbst wenn der Markt wieder für den Bereich um 100 fällt, hab Geduld, halte und nimm den TP – 104–106.
das kann ein Hinweis für einen Long-Einstieg sein”
Am besten am Rand einsteigen. Wenn der Markt erneut 102 erreicht, kann es stoppen oder sich verlangsamen – gerate nicht in Panik oder schließe den Trade. Selbst wenn der Markt wieder für den Bereich um 100 fällt, hab Geduld, halte und nimm den TP – 104–106.
2
7
6.5k
$SOL Langer Eintrag: Gebietsuche 100,50 bis 101,50 Bereich. Wenn der Markt plötzlich eine Verlagerung macht und mit ein paar roten Kerzen nach unten fällt, ist das ein Zeichen für einen möglichen Flip des Marktes.
Wenn du siehst, dass der Markt das Gleiche gemacht hat, als der Markt nach oben ging von 98,91 auf 104,81–103,88 Bereich, dann ist der Markt in derselben Reihenfolge gelaufen, aber plötzlich ging es bei 104,81 nach oben – das ist das Flip-Zeichen. Wir werden es in Zukunft für den Einstiegspunkt verwenden.
Jetzt geht der Markt auf exakt die gleiche Weise nach unten, bis auf 103,08. Jetzt müssen wir sehen, dass es plötzlich fällt – das ist das Zeichen.
$SOL Langer Eintrag: Gebietsuche 100,50 bis 101,50 Bereich. Wenn der Markt plötzlich eine Verlagerung macht und mit ein paar roten Kerzen nach unten fällt, ist das ein Zeichen für einen möglichen Flip des Marktes.
Wenn du siehst, dass der Markt das Gleiche gemacht hat, als der Markt nach oben ging von 98,91 auf 104,81–103,88 Bereich, dann ist der Markt in derselben Reihenfolge gelaufen, aber plötzlich ging es bei 104,81 nach oben – das ist das Flip-Zeichen. Wir werden es in Zukunft für den Einstiegspunkt verwenden.
Jetzt geht der Markt auf exakt die gleiche Weise nach unten, bis auf 103,08. Jetzt müssen wir sehen, dass es plötzlich fällt – das ist das Zeichen.
Wenn du siehst, dass der Markt das Gleiche gemacht hat, als der Markt nach oben ging von 98,91 auf 104,81–103,88 Bereich, dann ist der Markt in derselben Reihenfolge gelaufen, aber plötzlich ging es bei 104,81 nach oben – das ist das Flip-Zeichen. Wir werden es in Zukunft für den Einstiegspunkt verwenden.
Jetzt geht der Markt auf exakt die gleiche Weise nach unten, bis auf 103,08. Jetzt müssen wir sehen, dass es plötzlich fällt – das ist das Zeichen.
2
2
4.5k
Übersetzung ansehen
$SOL Long Entry set up 103.50- 103.80 area if more deep down better for long entry and SL 102.50 TP 105.80-106.50
$SOL Long Entry set up 103.50- 103.80 area if more deep down better for long entry and SL 102.50 TP 105.80-106.50
1
18
Übersetzung ansehen
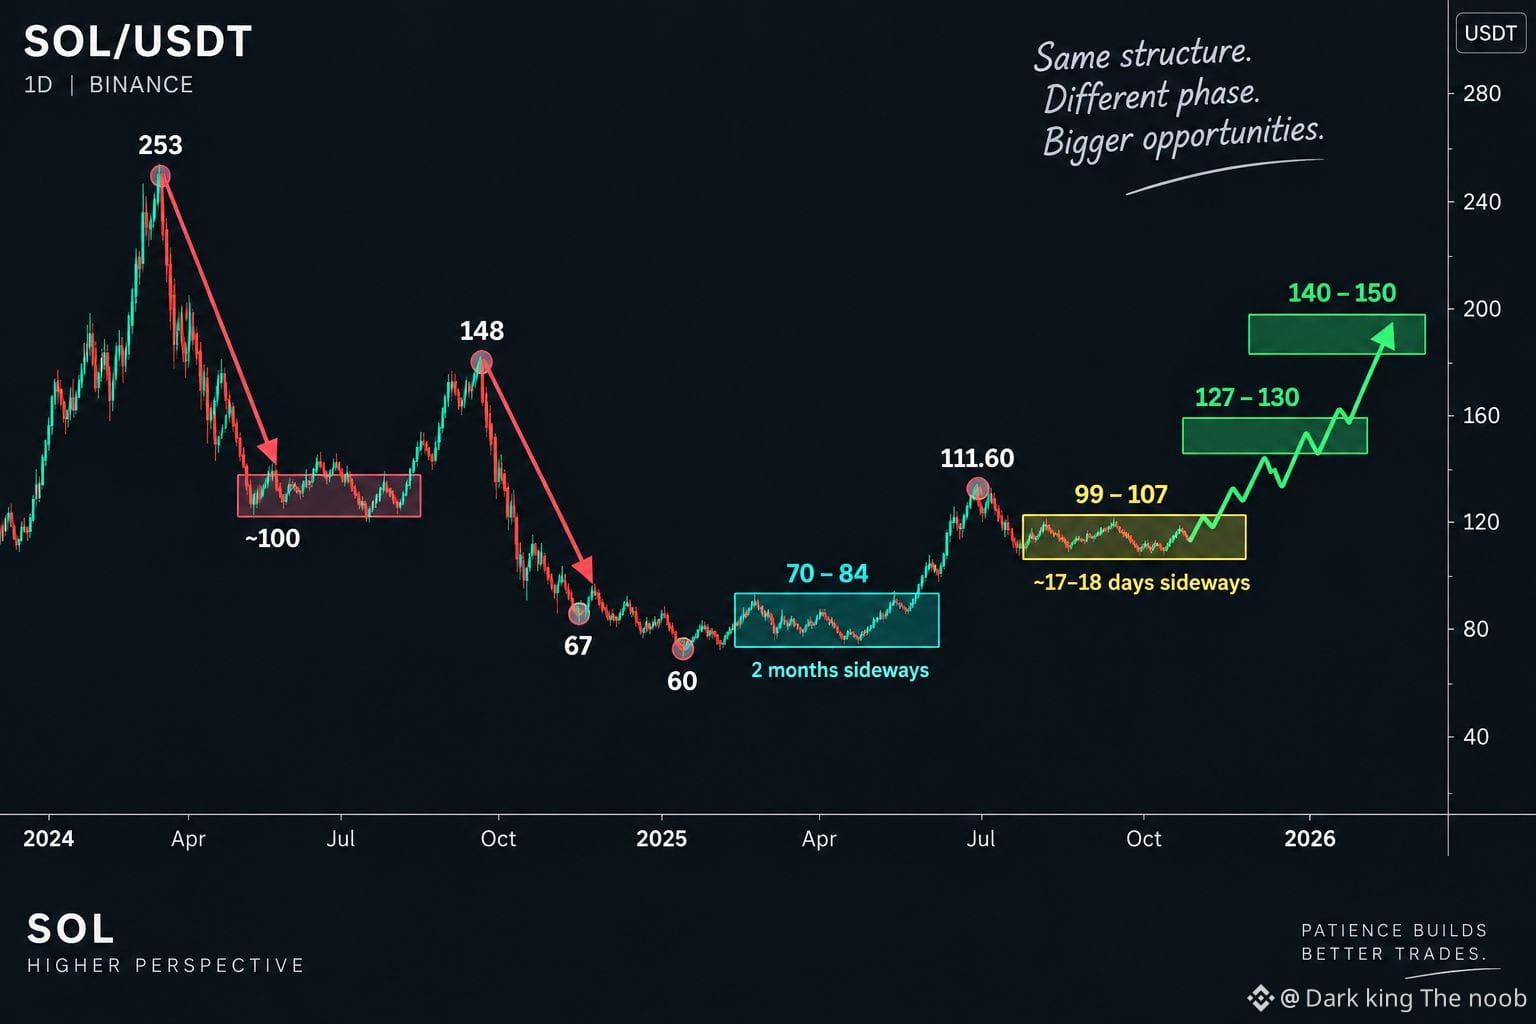
$SOL — The Bigger Picture
SOL has already shown this pattern before:
60 → 70–84 sideways for 2+ months → 111.60
Now, after 111.60, price has been spending around 17–18 days sideways near 99–107.
That’s what has my attention.
Sideways doesn’t automatically mean bullish — it can prepare for either direction. The key is how the range resolves.
If 99–107 holds, sellers fail to get acceptance below the range, and bulls continue defending the lower side, then I see a potential path:
107/108 → 111.60 → 127–130 → 140–150
A wick toward 95 or even 90 is possible, but what matters is whether price accepts there or quickly reclaims.
For me, the bigger question is simple:
Is 99–107 another power-building zone like 70–84 was?
If yes, the next expansion could be much bigger than the small reactions we're seeing inside the range.
Not a prediction. Just the structure I’m watching.
$SOL — The Bigger Picture
SOL has already shown this pattern before:
60 → 70–84 sideways for 2+ months → 111.60
Now, after 111.60, price has been spending around 17–18 days sideways near 99–107.
That’s what has my attention.
Sideways doesn’t automatically mean bullish — it can prepare for either direction. The key is how the range resolves.
If 99–107 holds, sellers fail to get acceptance below the range, and bulls continue defending the lower side, then I see a potential path:
107/108 → 111.60 → 127–130 → 140–150
A wick toward 95 or even 90 is possible, but what matters is whether price accepts there or quickly reclaims.
For me, the bigger question is simple:
Is 99–107 another power-building zone like 70–84 was?
If yes, the next expansion could be much bigger than the small reactions we're seeing inside the range.
Not a prediction. Just the structure I’m watching.
SOL has already shown this pattern before:
60 → 70–84 sideways for 2+ months → 111.60
Now, after 111.60, price has been spending around 17–18 days sideways near 99–107.
That’s what has my attention.
Sideways doesn’t automatically mean bullish — it can prepare for either direction. The key is how the range resolves.
If 99–107 holds, sellers fail to get acceptance below the range, and bulls continue defending the lower side, then I see a potential path:
107/108 → 111.60 → 127–130 → 140–150
A wick toward 95 or even 90 is possible, but what matters is whether price accepts there or quickly reclaims.
For me, the bigger question is simple:
Is 99–107 another power-building zone like 70–84 was?
If yes, the next expansion could be much bigger than the small reactions we're seeing inside the range.
Not a prediction. Just the structure I’m watching.
1
2
77
$SOL behalte um 103.28 herum ein Auge darauf . vielleicht ist es noch zu früh, aber behalte ein Auge darauf . wir könnten hier einen kurzen Einstieg bekommen, guter
$SOL behalte um 103.28 herum ein Auge darauf . vielleicht ist es noch zu früh, aber behalte ein Auge darauf . wir könnten hier einen kurzen Einstieg bekommen, guter
5
5
7k
$SOL Jungs, keine weiteren Shorts im Moment. Es sieht so aus, als würde der Markt auf 105.77 zusteuern. Wenn du es mit Shorts versuchen willst, warte bis 105.77 oder in den Bereich um 106.50.
$SOL Jungs, keine weiteren Shorts im Moment. Es sieht so aus, als würde der Markt auf 105.77 zusteuern. Wenn du es mit Shorts versuchen willst, warte bis 105.77 oder in den Bereich um 106.50.
8
26
30.7k
Übersetzung ansehen
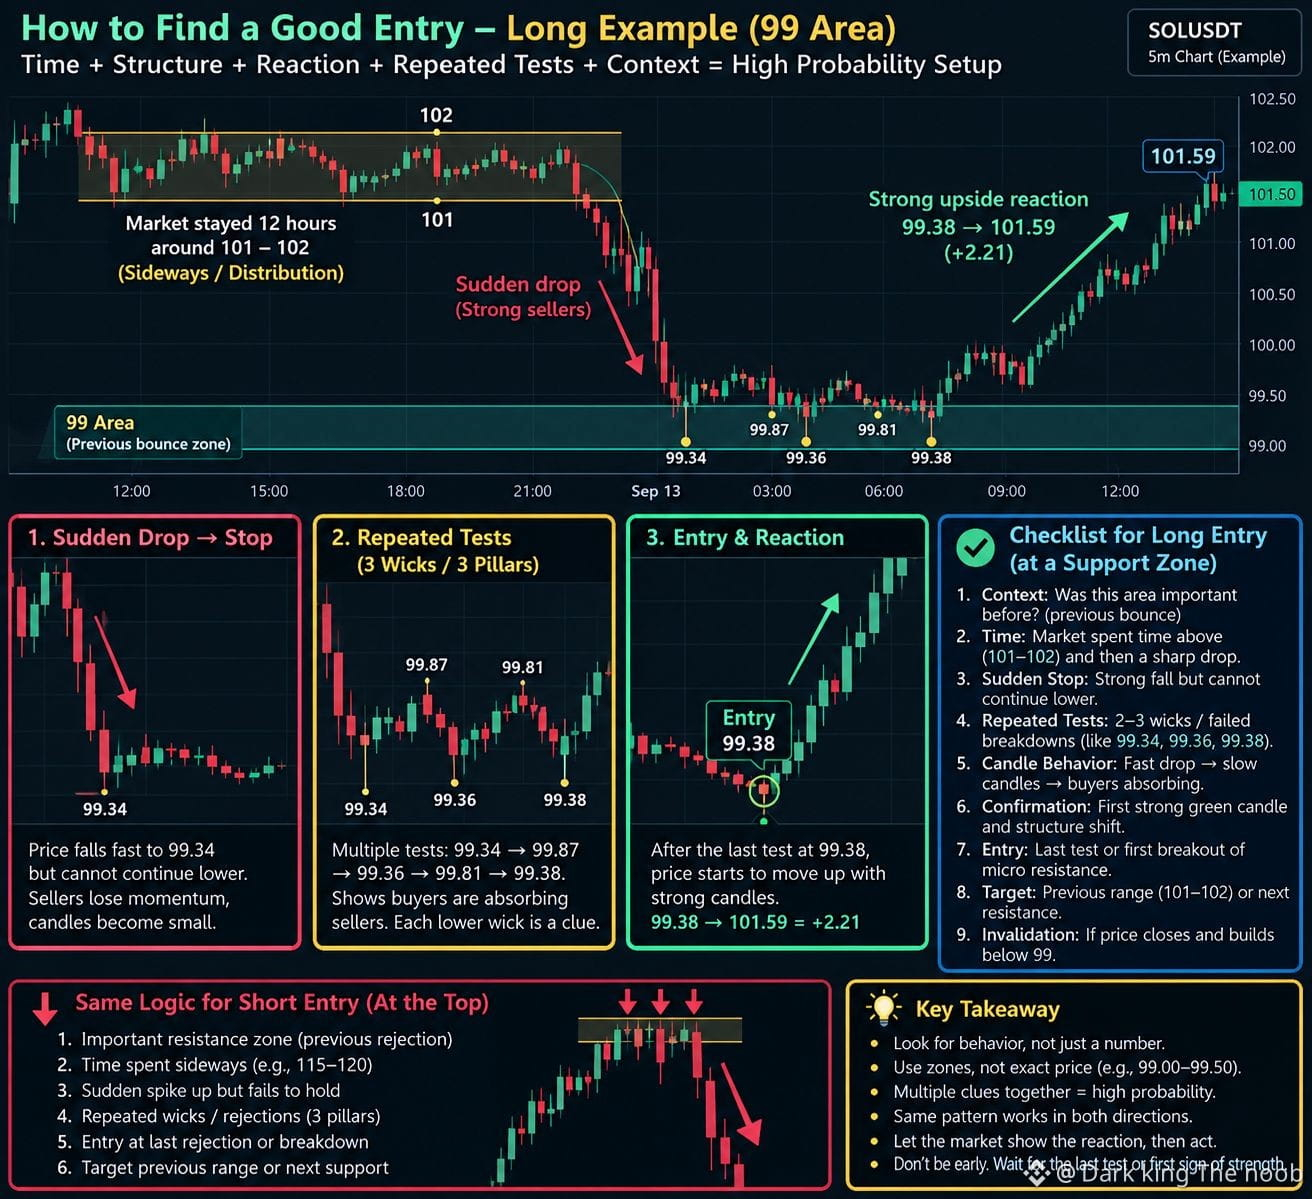
$SOL How to Find a Good Long Entry — Example: The 99 Area
Let me explain how I look for a good long entry.
The market spent around 12 hours between 101–102, then suddenly dropped hard toward 99.34.
But here’s what caught my attention:
1️⃣ Sudden drop → sudden slowdown
The market fell quickly, but once it reached the 99 area, the candles became much smaller. The downside momentum started disappearing.
2️⃣ Repeated tests / failed breakdowns
Look at the sequence:
99.34 → 99.87 → 99.36 → 99.81 → 99.38
The market kept testing the same area but couldn't properly expand lower.
3️⃣ Three clear “pillars” on the 1m/5m chart
You could see the market trying to push down, but every attempt was getting absorbed. Fast red candles suddenly became slow and weak.
4️⃣ Previous reaction zone
The 99 area was also a place where price had previously bounced back toward the upper range. That gives the zone additional context.
So now we have multiple clues together:
Big drop → sudden slowdown → repeated tests → failed breakdown → previous bounce zone.
That is where I start looking for a long.
The final clue was around 99.38. Once the market stopped making meaningful downside progress and started showing strength, that became the entry area.
And look what happened:
99.38 → 101.59 = +$2.21 🔥
The important lesson is:
Don't enter just because price reaches 99. Look at what price does when it gets there.
You want to see time + structure + reaction + repeated tests + location.
And the same logic works in reverse for shorts:
Important resistance → time spent → sudden spike up → slowdown → repeated failed pushes → rejection → short entry.
The exact price will always change.
The behavior is what matters.
$SOL How to Find a Good Long Entry — Example: The 99 Area
Let me explain how I look for a good long entry.
The market spent around 12 hours between 101–102, then suddenly dropped hard toward 99.34.
But here’s what caught my attention:
1️⃣ Sudden drop → sudden slowdown
The market fell quickly, but once it reached the 99 area, the candles became much smaller. The downside momentum started disappearing.
2️⃣ Repeated tests / failed breakdowns
Look at the sequence:
99.34 → 99.87 → 99.36 → 99.81 → 99.38
The market kept testing the same area but couldn't properly expand lower.
3️⃣ Three clear “pillars” on the 1m/5m chart
You could see the market trying to push down, but every attempt was getting absorbed. Fast red candles suddenly became slow and weak.
4️⃣ Previous reaction zone
The 99 area was also a place where price had previously bounced back toward the upper range. That gives the zone additional context.
So now we have multiple clues together:
Big drop → sudden slowdown → repeated tests → failed breakdown → previous bounce zone.
That is where I start looking for a long.
The final clue was around 99.38. Once the market stopped making meaningful downside progress and started showing strength, that became the entry area.
And look what happened:
99.38 → 101.59 = +$2.21 🔥
The important lesson is:
Don't enter just because price reaches 99. Look at what price does when it gets there.
You want to see time + structure + reaction + repeated tests + location.
And the same logic works in reverse for shorts:
Important resistance → time spent → sudden spike up → slowdown → repeated failed pushes → rejection → short entry.
The exact price will always change.
The behavior is what matters.
Let me explain how I look for a good long entry.
The market spent around 12 hours between 101–102, then suddenly dropped hard toward 99.34.
But here’s what caught my attention:
1️⃣ Sudden drop → sudden slowdown
The market fell quickly, but once it reached the 99 area, the candles became much smaller. The downside momentum started disappearing.
2️⃣ Repeated tests / failed breakdowns
Look at the sequence:
99.34 → 99.87 → 99.36 → 99.81 → 99.38
The market kept testing the same area but couldn't properly expand lower.
3️⃣ Three clear “pillars” on the 1m/5m chart
You could see the market trying to push down, but every attempt was getting absorbed. Fast red candles suddenly became slow and weak.
4️⃣ Previous reaction zone
The 99 area was also a place where price had previously bounced back toward the upper range. That gives the zone additional context.
So now we have multiple clues together:
Big drop → sudden slowdown → repeated tests → failed breakdown → previous bounce zone.
That is where I start looking for a long.
The final clue was around 99.38. Once the market stopped making meaningful downside progress and started showing strength, that became the entry area.
And look what happened:
99.38 → 101.59 = +$2.21 🔥
The important lesson is:
Don't enter just because price reaches 99. Look at what price does when it gets there.
You want to see time + structure + reaction + repeated tests + location.
And the same logic works in reverse for shorts:
Important resistance → time spent → sudden spike up → slowdown → repeated failed pushes → rejection → short entry.
The exact price will always change.
The behavior is what matters.
121
Artikel
Übersetzung ansehen
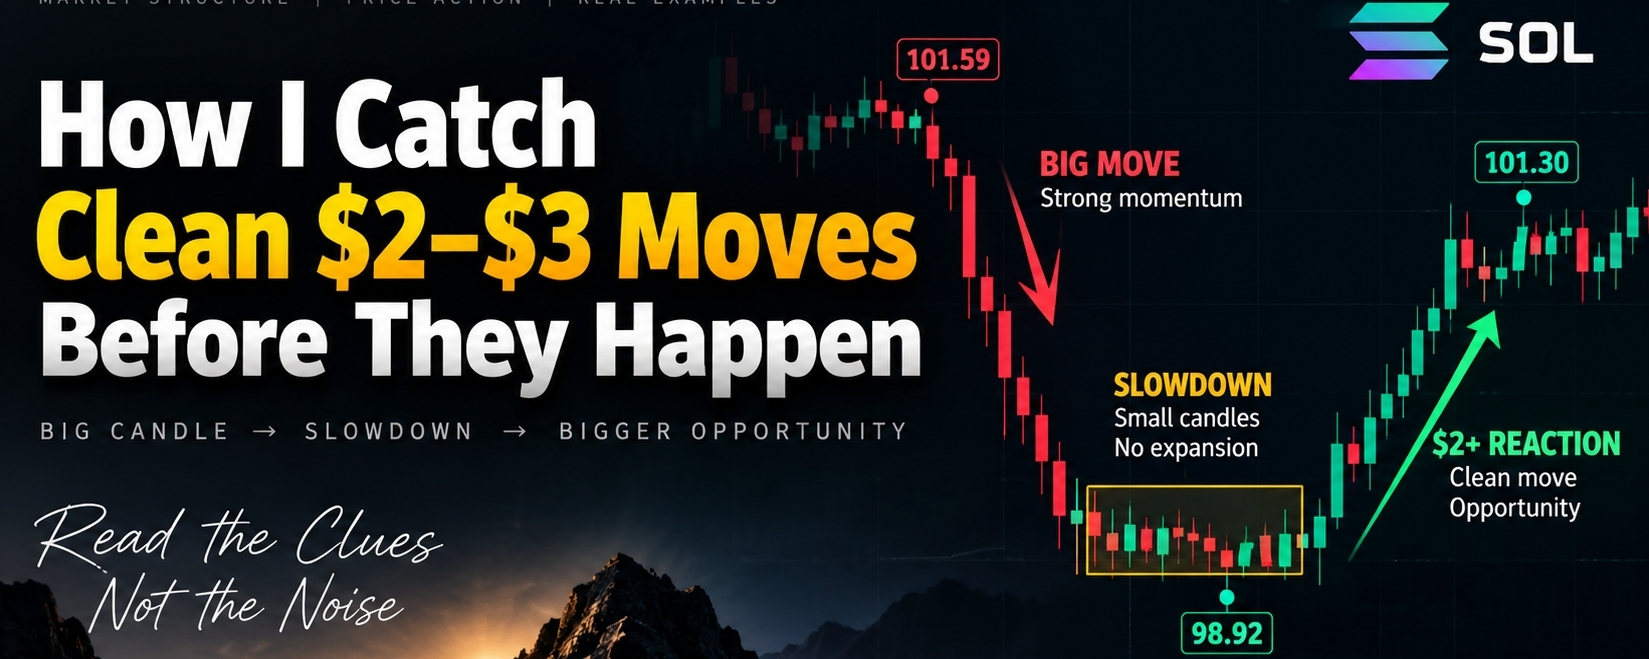
How I Catch Clean $2–$3 Moves Before They Happen$SOL One thing I’ve been learning from watching SOL is that catching a clean $2–$3 move is not always about predicting the direction.
Sometimes the biggest clue is what happens after a big move.
For example, SOL made a strong downside move from around 101.59 and came down toward the 99 area with big candles.
At first, everything looked bearish.
The market was going down, so naturally the brain starts thinking:
“It’s going lower. It’s going lower.”
But then something changed.
Around 99.30–99.50, the market became extremely slow.
Instead of continuing with strong downside candles, it started moving only around $0.10–$0.20 at a time:
99.35 → 99.45 → 99.24 → 99.10
This is where the real clue appeared.
The market was still moving down, but the expansion was disappearing.
That distinction is extremely important.
Big displacement → sudden slowdown
When a market makes a large move and then suddenly becomes very slow, I don't automatically assume that the same move will continue.
I start asking:
“Is the current move actually still working?”
Because if sellers were truly in control, I would expect continued expansion.
Instead, we saw:
101.59 → 99.8/99.9
Big move.
Then:
99.xx → extremely slow → stuck
That slowdown was telling us something.
Eventually the market reached around 98.92 and stayed there for roughly two hours.
No meaningful downside expansion.
Then the market started moving back upward.
And from:
98.92 → 100.80 → 101.30+
That became a clean $2+ reaction.
This is how I think about the $2–$3 move
I don't want to trade every small movement.
I want to find the moments where the market gives me a clean structural clue.
For example:
Big displacement
↓
Movement starts shrinking
↓
Market becomes slow
↓
Price spends time at the location
↓
No further expansion in the original direction
↓
Reaction starts
That is where I start looking for the next $2–$3 opportunity.
And there is another important lesson here.
The overall market can still be bearish.
That doesn't mean every move has to be down.
A bearish market can still give you a $2–$3 upside reaction from a lower zone.
Likewise, a bullish market can still give you a sharp downside reaction.
So I try to separate:
Overall direction
from
the reaction available at the current location.
The biggest mistake I made
The funny part is that I actually mapped the possibility around 98–99 before the move happened. 🤣
I had the feeling:
“If this gets stuck around 98–99, it can come back toward 100.80 or even higher.”
But I didn't fully trust myself because the market still felt bearish.
That was the noise.
The structure was saying one thing.
My brain was saying:
“But it's going down!”
And that's exactly where I need to improve.
Not by trying to predict every move.
But by trusting a clear structural clue when it appears.
My main takeaway
When a market comes down with a big candle, then suddenly becomes very slow and stuck, I don't automatically chase the continuation.
I watch for whether the move has finished for now.
Because sometimes:
Big move → stop → slow → reaction
is the beginning of the next juicy $2–$3 move.
And that's what makes trading interesting.
You don't need to catch everything.
You just need to recognize the clean moves when the market actually gives them.
Map the move.
Wait for the clue.
Ignore the noise.
Catch the juicy $2–$3. 🔥
$SOL
How I Catch Clean $2–$3 Moves Before They Happen
$SOL One thing I’ve been learning from watching SOL is that catching a clean $2–$3 move is not always about predicting the direction.
Sometimes the biggest clue is what happens after a big move.
For example, SOL made a strong downside move from around 101.59 and came down toward the 99 area with big candles.
At first, everything looked bearish.
The market was going down, so naturally the brain starts thinking:
“It’s going lower. It’s going lower.”
But then something changed.
Around 99.30–99.50, the market became extremely slow.
Instead of continuing with strong downside candles, it started moving only around $0.10–$0.20 at a time:
99.35 → 99.45 → 99.24 → 99.10
This is where the real clue appeared.
The market was still moving down, but the expansion was disappearing.
That distinction is extremely important.
Big displacement → sudden slowdown
When a market makes a large move and then suddenly becomes very slow, I don't automatically assume that the same move will continue.
I start asking:
“Is the current move actually still working?”
Because if sellers were truly in control, I would expect continued expansion.
Instead, we saw:
101.59 → 99.8/99.9
Big move.
Then:
99.xx → extremely slow → stuck
That slowdown was telling us something.
Eventually the market reached around 98.92 and stayed there for roughly two hours.
No meaningful downside expansion.
Then the market started moving back upward.
And from:
98.92 → 100.80 → 101.30+
That became a clean $2+ reaction.
This is how I think about the $2–$3 move
I don't want to trade every small movement.
I want to find the moments where the market gives me a clean structural clue.
For example:
Big displacement
↓
Movement starts shrinking
↓
Market becomes slow
↓
Price spends time at the location
↓
No further expansion in the original direction
↓
Reaction starts
That is where I start looking for the next $2–$3 opportunity.
And there is another important lesson here.
The overall market can still be bearish.
That doesn't mean every move has to be down.
A bearish market can still give you a $2–$3 upside reaction from a lower zone.
Likewise, a bullish market can still give you a sharp downside reaction.
So I try to separate:
Overall direction
from
the reaction available at the current location.
The biggest mistake I made
The funny part is that I actually mapped the possibility around 98–99 before the move happened. 🤣
I had the feeling:
“If this gets stuck around 98–99, it can come back toward 100.80 or even higher.”
But I didn't fully trust myself because the market still felt bearish.
That was the noise.
The structure was saying one thing.
My brain was saying:
“But it's going down!”
And that's exactly where I need to improve.
Not by trying to predict every move.
But by trusting a clear structural clue when it appears.
My main takeaway
When a market comes down with a big candle, then suddenly becomes very slow and stuck, I don't automatically chase the continuation.
I watch for whether the move has finished for now.
Because sometimes:
Big move → stop → slow → reaction
is the beginning of the next juicy $2–$3 move.
And that's what makes trading interesting.
You don't need to catch everything.
You just need to recognize the clean moves when the market actually gives them.
Map the move.
Wait for the clue.
Ignore the noise.
Catch the juicy $2–$3. 🔥
$SOL
Sometimes the biggest clue is what happens after a big move.
For example, SOL made a strong downside move from around 101.59 and came down toward the 99 area with big candles.
At first, everything looked bearish.
The market was going down, so naturally the brain starts thinking:
“It’s going lower. It’s going lower.”
But then something changed.
Around 99.30–99.50, the market became extremely slow.
Instead of continuing with strong downside candles, it started moving only around $0.10–$0.20 at a time:
99.35 → 99.45 → 99.24 → 99.10
This is where the real clue appeared.
The market was still moving down, but the expansion was disappearing.
That distinction is extremely important.
Big displacement → sudden slowdown
When a market makes a large move and then suddenly becomes very slow, I don't automatically assume that the same move will continue.
I start asking:
“Is the current move actually still working?”
Because if sellers were truly in control, I would expect continued expansion.
Instead, we saw:
101.59 → 99.8/99.9
Big move.
Then:
99.xx → extremely slow → stuck
That slowdown was telling us something.
Eventually the market reached around 98.92 and stayed there for roughly two hours.
No meaningful downside expansion.
Then the market started moving back upward.
And from:
98.92 → 100.80 → 101.30+
That became a clean $2+ reaction.
This is how I think about the $2–$3 move
I don't want to trade every small movement.
I want to find the moments where the market gives me a clean structural clue.
For example:
Big displacement
↓
Movement starts shrinking
↓
Market becomes slow
↓
Price spends time at the location
↓
No further expansion in the original direction
↓
Reaction starts
That is where I start looking for the next $2–$3 opportunity.
And there is another important lesson here.
The overall market can still be bearish.
That doesn't mean every move has to be down.
A bearish market can still give you a $2–$3 upside reaction from a lower zone.
Likewise, a bullish market can still give you a sharp downside reaction.
So I try to separate:
Overall direction
from
the reaction available at the current location.
The biggest mistake I made
The funny part is that I actually mapped the possibility around 98–99 before the move happened. 🤣
I had the feeling:
“If this gets stuck around 98–99, it can come back toward 100.80 or even higher.”
But I didn't fully trust myself because the market still felt bearish.
That was the noise.
The structure was saying one thing.
My brain was saying:
“But it's going down!”
And that's exactly where I need to improve.
Not by trying to predict every move.
But by trusting a clear structural clue when it appears.
My main takeaway
When a market comes down with a big candle, then suddenly becomes very slow and stuck, I don't automatically chase the continuation.
I watch for whether the move has finished for now.
Because sometimes:
Big move → stop → slow → reaction
is the beginning of the next juicy $2–$3 move.
And that's what makes trading interesting.
You don't need to catch everything.
You just need to recognize the clean moves when the market actually gives them.
Map the move.
Wait for the clue.
Ignore the noise.
Catch the juicy $2–$3. 🔥
$SOL
1
1
285
Übersetzung ansehen
$SOL How to Catch a Clean $2–$3 Move
When the market came down from 101.59, it came down with a big candle and strong momentum.
It reached around 99.80–99.90, and then something very important happened.
The market became extremely slow.
Instead of continuing with big candles, it started moving down only $0.10–$0.20 at a time:
99.35 → 99.45 → 99.24 → 99.10
At that moment, it still looked like:
“Market is going down, down, down.”
But the important clue was not the direction.
The important clue was:
The downside expansion had stopped.
Think about it:
If the market came from 101.59 with a big move, and then suddenly becomes slow and stuck around 99.xx, sellers are no longer getting the same expansion.
That can be the first sign that the current move is finished for now.
And that's exactly what happened.
The market stopped around 98.92, stayed there for roughly 2 hours, and then started moving back up.
From 98.92 → 101.30+.
Almost a $2.40 reaction.
So when you're looking for a clean $2–$3 trade, don't only look at direction.
Look at:
Big displacement → sudden slowdown → no further expansion → time spent → reaction back toward the origin.
The market was telling us something at 99.xx.
I saw it, but at the time I didn't fully trust it. 🤣
The lesson: When a big move suddenly becomes extremely slow, don't automatically assume continuation. Sometimes the market has already finished that leg — for now.
$SOL How to Catch a Clean $2–$3 Move
When the market came down from 101.59, it came down with a big candle and strong momentum.
It reached around 99.80–99.90, and then something very important happened.
The market became extremely slow.
Instead of continuing with big candles, it started moving down only $0.10–$0.20 at a time:
99.35 → 99.45 → 99.24 → 99.10
At that moment, it still looked like:
“Market is going down, down, down.”
But the important clue was not the direction.
The important clue was:
The downside expansion had stopped.
Think about it:
If the market came from 101.59 with a big move, and then suddenly becomes slow and stuck around 99.xx, sellers are no longer getting the same expansion.
That can be the first sign that the current move is finished for now.
And that's exactly what happened.
The market stopped around 98.92, stayed there for roughly 2 hours, and then started moving back up.
From 98.92 → 101.30+.
Almost a $2.40 reaction.
So when you're looking for a clean $2–$3 trade, don't only look at direction.
Look at:
Big displacement → sudden slowdown → no further expansion → time spent → reaction back toward the origin.
The market was telling us something at 99.xx.
I saw it, but at the time I didn't fully trust it. 🤣
The lesson: When a big move suddenly becomes extremely slow, don't automatically assume continuation. Sometimes the market has already finished that leg — for now.
When the market came down from 101.59, it came down with a big candle and strong momentum.
It reached around 99.80–99.90, and then something very important happened.
The market became extremely slow.
Instead of continuing with big candles, it started moving down only $0.10–$0.20 at a time:
99.35 → 99.45 → 99.24 → 99.10
At that moment, it still looked like:
“Market is going down, down, down.”
But the important clue was not the direction.
The important clue was:
The downside expansion had stopped.
Think about it:
If the market came from 101.59 with a big move, and then suddenly becomes slow and stuck around 99.xx, sellers are no longer getting the same expansion.
That can be the first sign that the current move is finished for now.
And that's exactly what happened.
The market stopped around 98.92, stayed there for roughly 2 hours, and then started moving back up.
From 98.92 → 101.30+.
Almost a $2.40 reaction.
So when you're looking for a clean $2–$3 trade, don't only look at direction.
Look at:
Big displacement → sudden slowdown → no further expansion → time spent → reaction back toward the origin.
The market was telling us something at 99.xx.
I saw it, but at the time I didn't fully trust it. 🤣
The lesson: When a big move suddenly becomes extremely slow, don't automatically assume continuation. Sometimes the market has already finished that leg — for now.
1
108
$SOL Es besteht eine gute Chance, dieses Mal um 102–103 oder mehr herum zu laufen und dann wieder abzufallen – ungefähr in den 99er Bereich. Der Markt ist ziemlich langsam. Auch wenn, nimm das nicht einfach blind: oberhalb von 101 prüfen. Achte auf Short-Setups und auch auf Longs um 99.
$SOL Es besteht eine gute Chance, dieses Mal um 102–103 oder mehr herum zu laufen und dann wieder abzufallen – ungefähr in den 99er Bereich. Der Markt ist ziemlich langsam. Auch wenn, nimm das nicht einfach blind: oberhalb von 101 prüfen. Achte auf Short-Setups und auch auf Longs um 99.
1
1.8k
Übersetzung ansehen
$SOL Dont fall in trap thats just ranging market will visit around 95-96 area
$SOL Dont fall in trap thats just ranging market will visit around 95-96 area
85
Übersetzung ansehen
$SOL who has taken short as per my entry point 🤣🤣
$SOL who has taken short as per my entry point 🤣🤣
23
Übersetzung ansehen
$SOL How I Find the “Juicy” $2–$3 Move
A lot of people ask me:
“After a big move, how do you know where the next $2–$3 reaction can come from?”
For me, I don't start by guessing the target.
I start by looking at where the market actually fought.
Here is a simple example from $SOL:
100 was a clear fight zone.
The market was spending time around 100.
Then we saw:
99 → 100.42 → 97.36
From around 100.42, the market suddenly dropped to 97.36.
Then something interesting happened:
97.36 → 105.77
A huge upside move.
Now the question becomes:
From 105.77, where can we expect a meaningful reaction?
For me, the first place I look is back toward the 100 area.
Why?
Because 100 was the original fight zone, and the major downside displacement started from around that area.
And we actually saw:
105.77 → 100.30
Then buyers tried again:
100.30 → 103.11
This is why I don't randomly choose a $2–$3 target.
I look at the history of the location.
If the market spent time fighting at a certain area, and then made a strong displacement away from it, that area can become important when price returns from the opposite side.
So my thought process is:
Fight zone → strong displacement → price travels away → price returns → look for the reaction.
The goal isn't to predict every candle.
The goal is to understand where the market previously spent its energy.
That's where the juicy reaction can appear. 👀🔥
Trade the structure, not the noise.
$SOL
$SOL How I Find the “Juicy” $2–$3 Move
A lot of people ask me:
“After a big move, how do you know where the next $2–$3 reaction can come from?”
For me, I don't start by guessing the target.
I start by looking at where the market actually fought.
Here is a simple example from $SOL :
100 was a clear fight zone.
The market was spending time around 100.
Then we saw:
99 → 100.42 → 97.36
From around 100.42, the market suddenly dropped to 97.36.
Then something interesting happened:
97.36 → 105.77
A huge upside move.
Now the question becomes:
From 105.77, where can we expect a meaningful reaction?
For me, the first place I look is back toward the 100 area.
Why?
Because 100 was the original fight zone, and the major downside displacement started from around that area.
And we actually saw:
105.77 → 100.30
Then buyers tried again:
100.30 → 103.11
This is why I don't randomly choose a $2–$3 target.
I look at the history of the location.
If the market spent time fighting at a certain area, and then made a strong displacement away from it, that area can become important when price returns from the opposite side.
So my thought process is:
Fight zone → strong displacement → price travels away → price returns → look for the reaction.
The goal isn't to predict every candle.
The goal is to understand where the market previously spent its energy.
That's where the juicy reaction can appear. 👀🔥
Trade the structure, not the noise.
$SOL
A lot of people ask me:
“After a big move, how do you know where the next $2–$3 reaction can come from?”
For me, I don't start by guessing the target.
I start by looking at where the market actually fought.
Here is a simple example from $SOL :
100 was a clear fight zone.
The market was spending time around 100.
Then we saw:
99 → 100.42 → 97.36
From around 100.42, the market suddenly dropped to 97.36.
Then something interesting happened:
97.36 → 105.77
A huge upside move.
Now the question becomes:
From 105.77, where can we expect a meaningful reaction?
For me, the first place I look is back toward the 100 area.
Why?
Because 100 was the original fight zone, and the major downside displacement started from around that area.
And we actually saw:
105.77 → 100.30
Then buyers tried again:
100.30 → 103.11
This is why I don't randomly choose a $2–$3 target.
I look at the history of the location.
If the market spent time fighting at a certain area, and then made a strong displacement away from it, that area can become important when price returns from the opposite side.
So my thought process is:
Fight zone → strong displacement → price travels away → price returns → look for the reaction.
The goal isn't to predict every candle.
The goal is to understand where the market previously spent its energy.
That's where the juicy reaction can appear. 👀🔥
Trade the structure, not the noise.
$SOL
21
Übersetzung ansehen
$SOL Short set up - Entry point 100.80-101.50 SL 101.80 TP 95-96
$SOL Short set up - Entry point 100.80-101.50 SL 101.80 TP 95-96
18
$SOL long entry zone wenn der Markt bei 99.80-100.20 ankommt. Wenn du siehst, dass es stoppt und eine Docht-/Wick-Kerze erscheint oder plötzlich eine große rote Kerze erscheint, dann Entry für Long bei 101.10, SL 99.30. Wenn du siehst, dass es um 101 herum feststeckt, dann nimm bitte TP. Denn das ist das Ziel
$SOL long entry zone wenn der Markt bei 99.80-100.20 ankommt. Wenn du siehst, dass es stoppt und eine Docht-/Wick-Kerze erscheint oder plötzlich eine große rote Kerze erscheint, dann Entry für Long bei 101.10, SL 99.30. Wenn du siehst, dass es um 101 herum feststeckt, dann nimm bitte TP. Denn das ist das Ziel
3
5
7.5k
Übersetzung ansehen
$SOL guys see the rejection from 101.31 to 101.83 that's the sign of weakness - ready for short
$SOL guys see the rejection from 101.31 to 101.83 that's the sign of weakness - ready for short
12
Anmelden und weiter Inhalte entdecken
Krypto-Nutzer weltweit auf Binance Square kennenlernen
⚡️ Bleib in Sachen Krypto stets am Puls.
💬 Die weltgrößte Kryptobörse vertraut darauf.
👍 Erhalte verlässliche Einblicke von verifizierten Creators.
E-Mail-Adresse/Telefonnummer
Trendthemen
FedRateWatch
379,271 Aufrufe
2,191 Kommentare
Teile & gewinne Traffic-Belohnungen in unserer Kampagne mit angesagtem Hashtag
✨Thema: FOMC September, Was ist der nächste Schritt der Fed?
👉So nimmst du teil:
Veröffentliche einen kurzen Beitrag oder Artikel mit dem Hashtag #FedRateWatch
Erstelle Inhalte basierend auf den folgenden Blickwinkeln:
- Der August-Core-CPI stieg um 0,3% im Monatsvergleich, und die Wahrscheinlichkeit für eine 25bp-Erhöhung diese Woche liegt nun bei fast 90%. Erwartest du diese Woche eine Zinserhöhung? Handelt es sich um einen einmaligen Schritt oder den Beginn eines längeren Zinserhöhungszyklus?
- Wenn die Erhöhung erfolgt: Wie entwickelt sich das für BTC, Tech-Aktien und Gold? Aufwärts- oder abwärtsgerichtet?
- Wie planst du als Nächstes zu handeln? Teile deinen BTC-, Aktien- oder Gold-Trade/Bestände mit unserem Trade-Sharing-Widget.
⏰Kampagnenzeitraum:
- 2026-09-15 11:00 - 2026-09-17 3:00 UTC
🎁Belohnung:
- Qualifizierte Beiträge, die die oben genannten Richtlinien erfüllen und mehr als 100 Wörter enthalten, werden überprüft und erhalten möglicherweise einen zufälligen Traffic-Boost von 500 bis 3.000 Aufrufen. Du erhältst eine Benachrichtigung von deiner Feed-Secretary, wenn dein Beitrag ausgewählt wird.
- Erhalte die Chance, dass dein Artikel auf Binance Square Official vorgestellt wird
Du brauchst Ideen für deinen Beitrag? Besuche die Themenseite #FedRateWatch oder die Square Guide on How to Post for Better Reach.
Binance Square Official
·345 Likes
·687.1k Aufrufe
BitcoinSlidesTo$76000
8,279 Aufrufe
86 Kommentare
BitcoinReboundsTo$79K
55,709 Aufrufe
384 Kommentare