
Square-Creator-398db5429
715 Beiträge

Square-Creator-398db5429
Melden
Nutzer blockieren
Consensus-as-a-Service platform. Advanced parent - child chain architecture. Scalability, no #blockchain bloat, #ProofOfStake.
0 Following
278 Follower
283 Like gegeben
Beiträge
Übersetzung ansehen
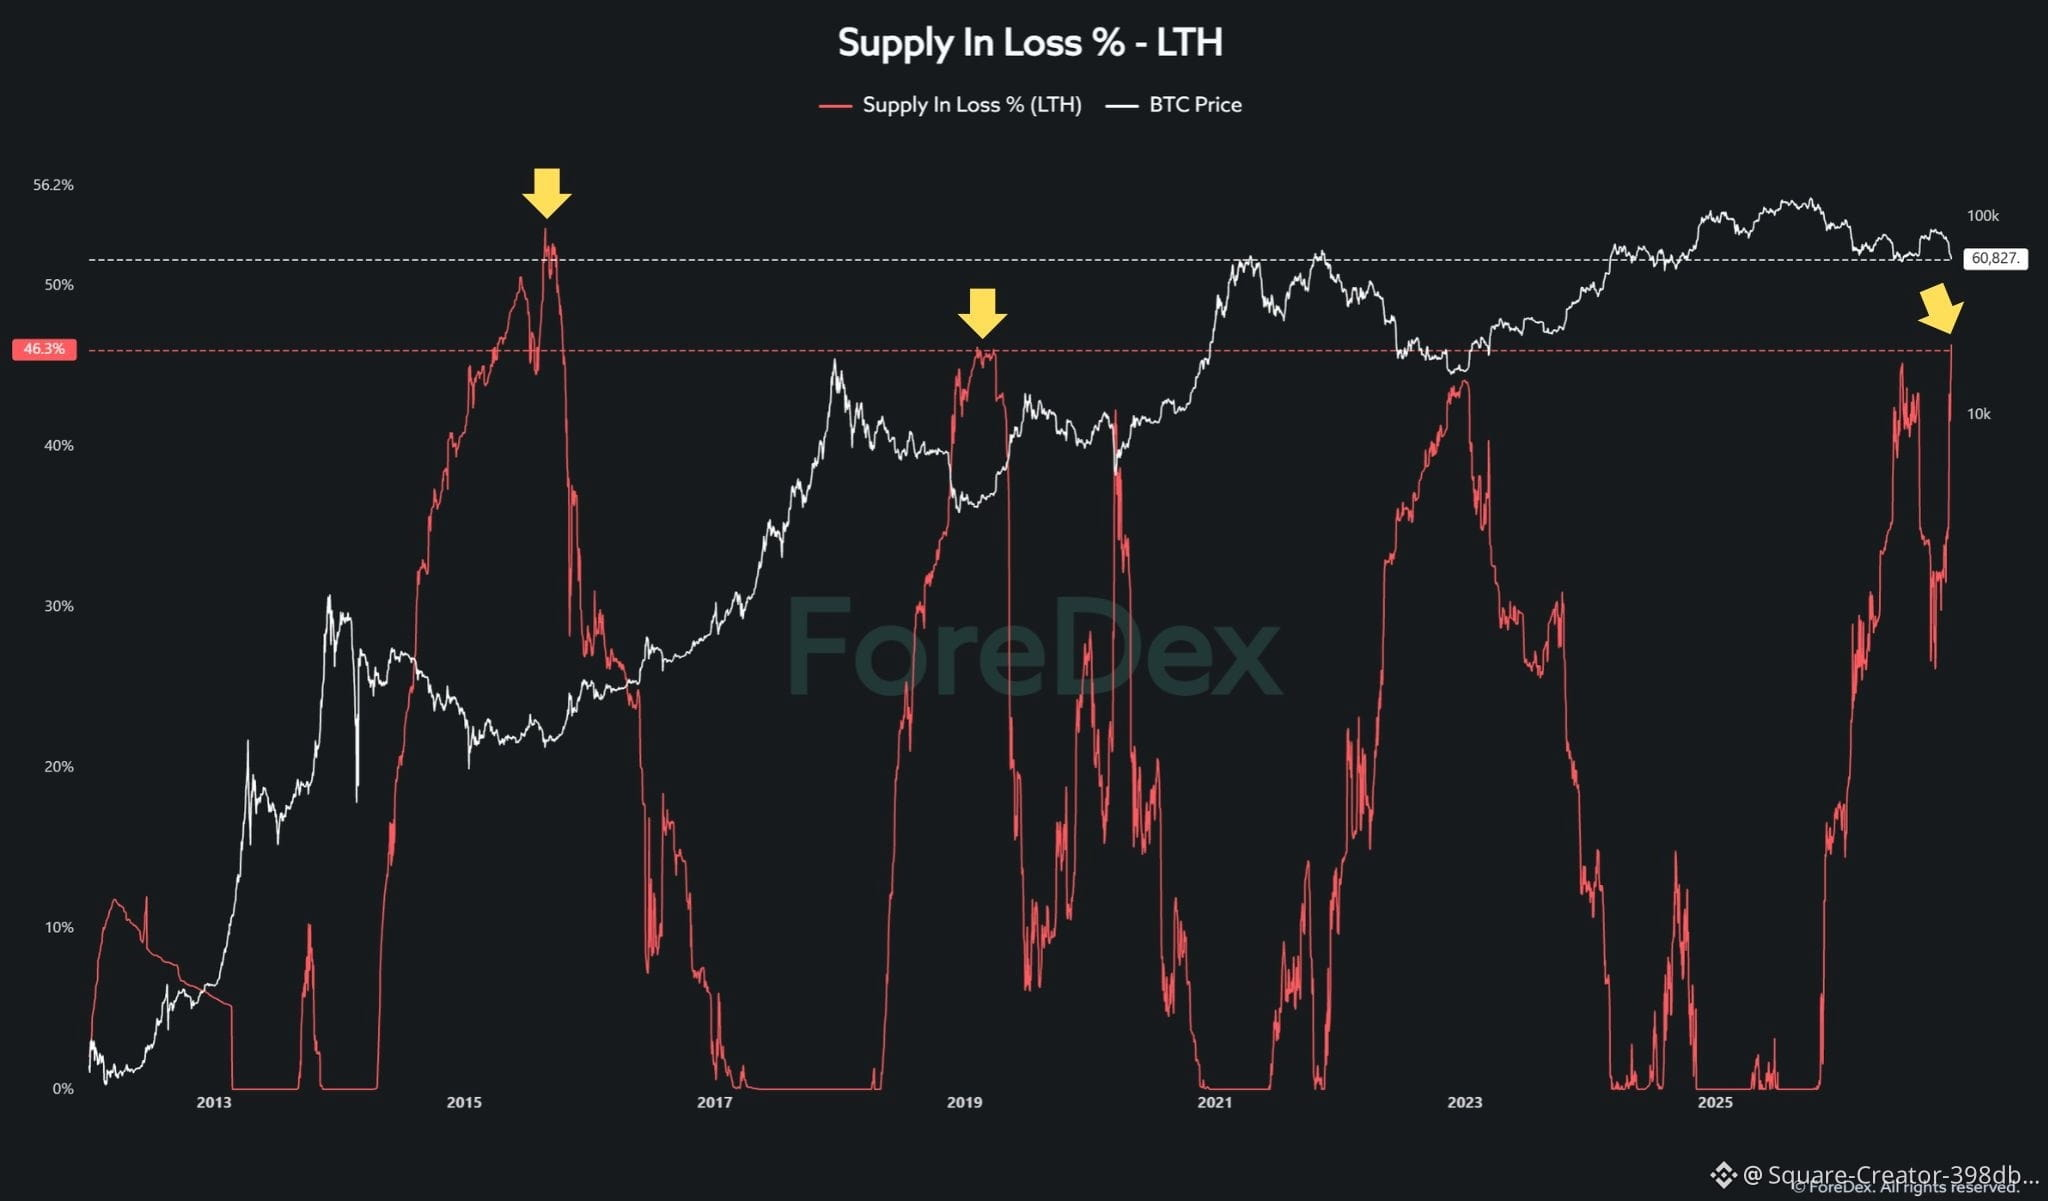
Supply in Loss LTH #Bitcoin hits a new high in 2026 at 46.3%
About 2pp above the 2022 peak
The magnitude of loss supply is comparable to 2018 bear market
It is the third-largest capitulation peak in the market's history. #BTC Price Analysis#
#BTC #OnChainAnalysis $BTC
Supply in Loss LTH #Bitcoin hits a new high in 2026 at 46.3%
About 2pp above the 2022 peak
The magnitude of loss supply is comparable to 2018 bear market
It is the third-largest capitulation peak in the market's history. #BTC Price Analysis#
#BTC #OnChainAnalysis $BTC
About 2pp above the 2022 peak
The magnitude of loss supply is comparable to 2018 bear market
It is the third-largest capitulation peak in the market's history. #BTC Price Analysis#
#BTC #OnChainAnalysis $BTC
72
Übersetzung ansehen
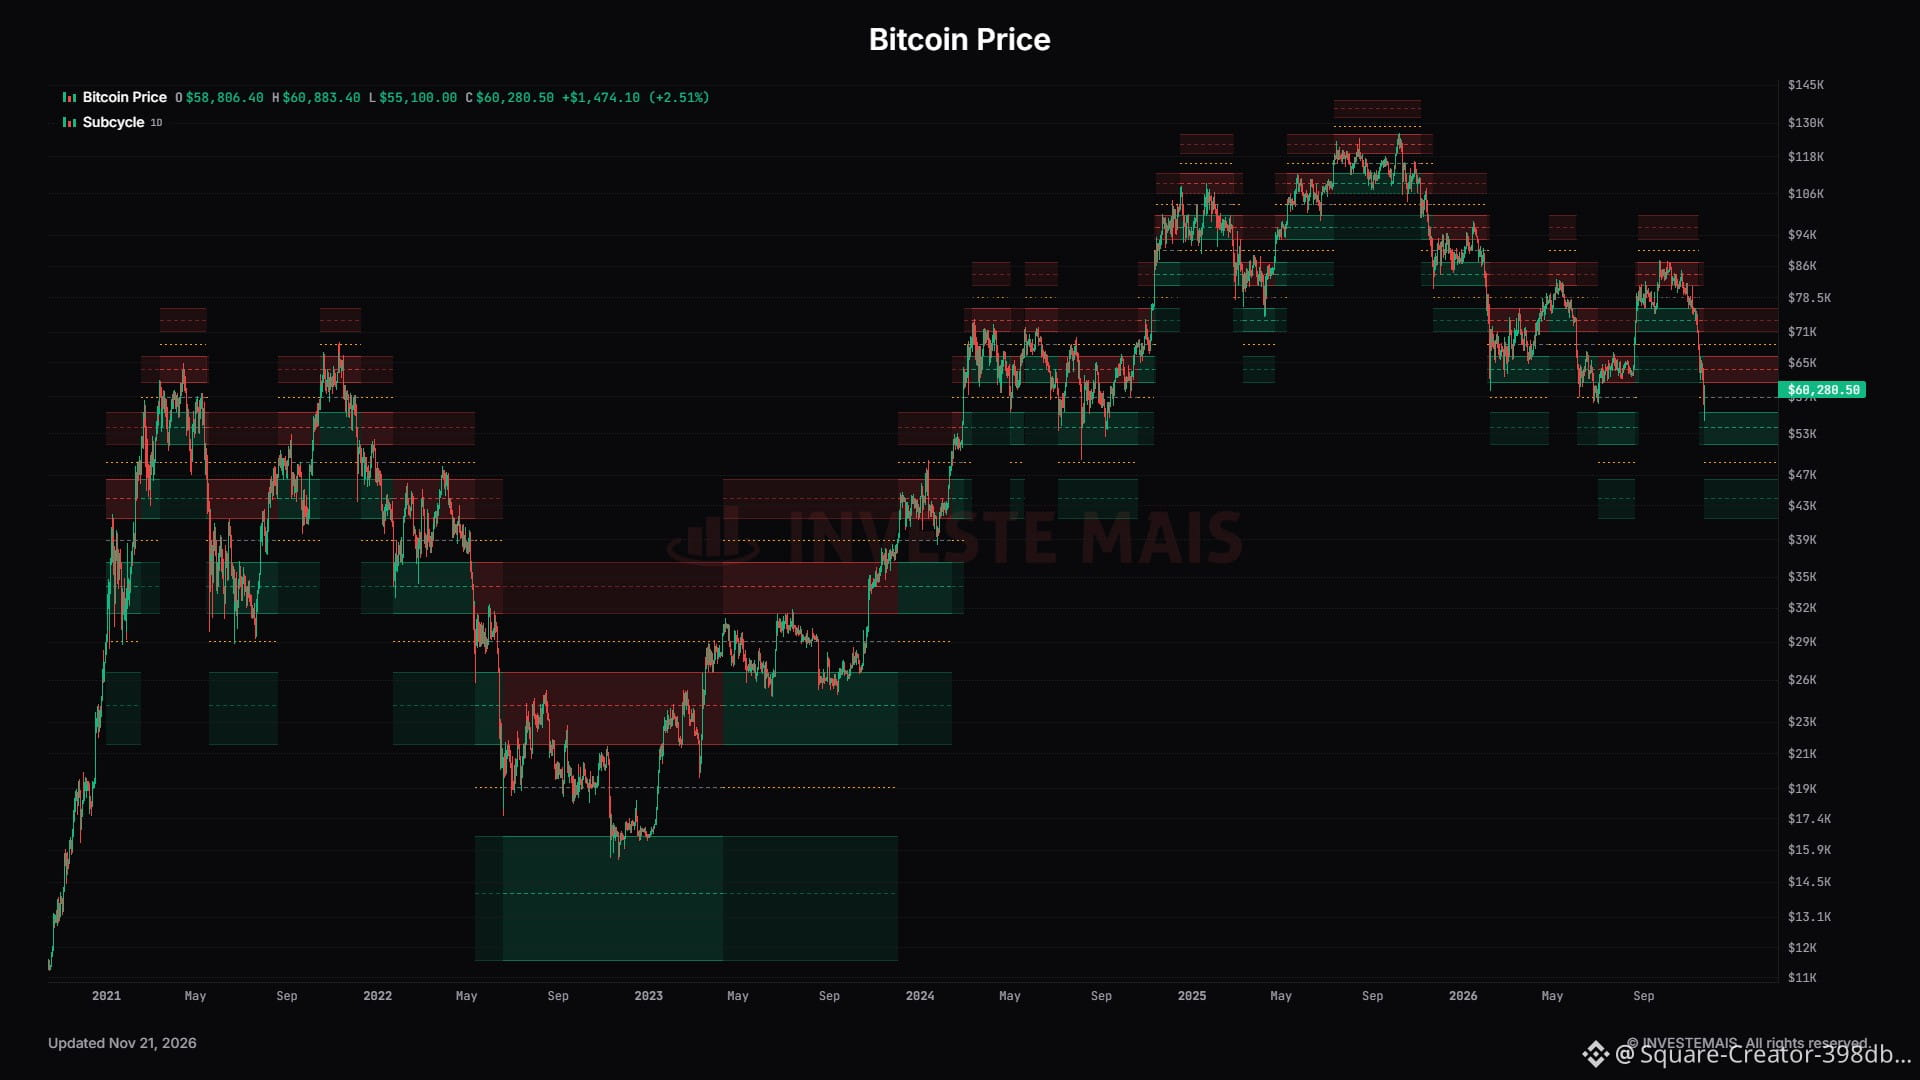
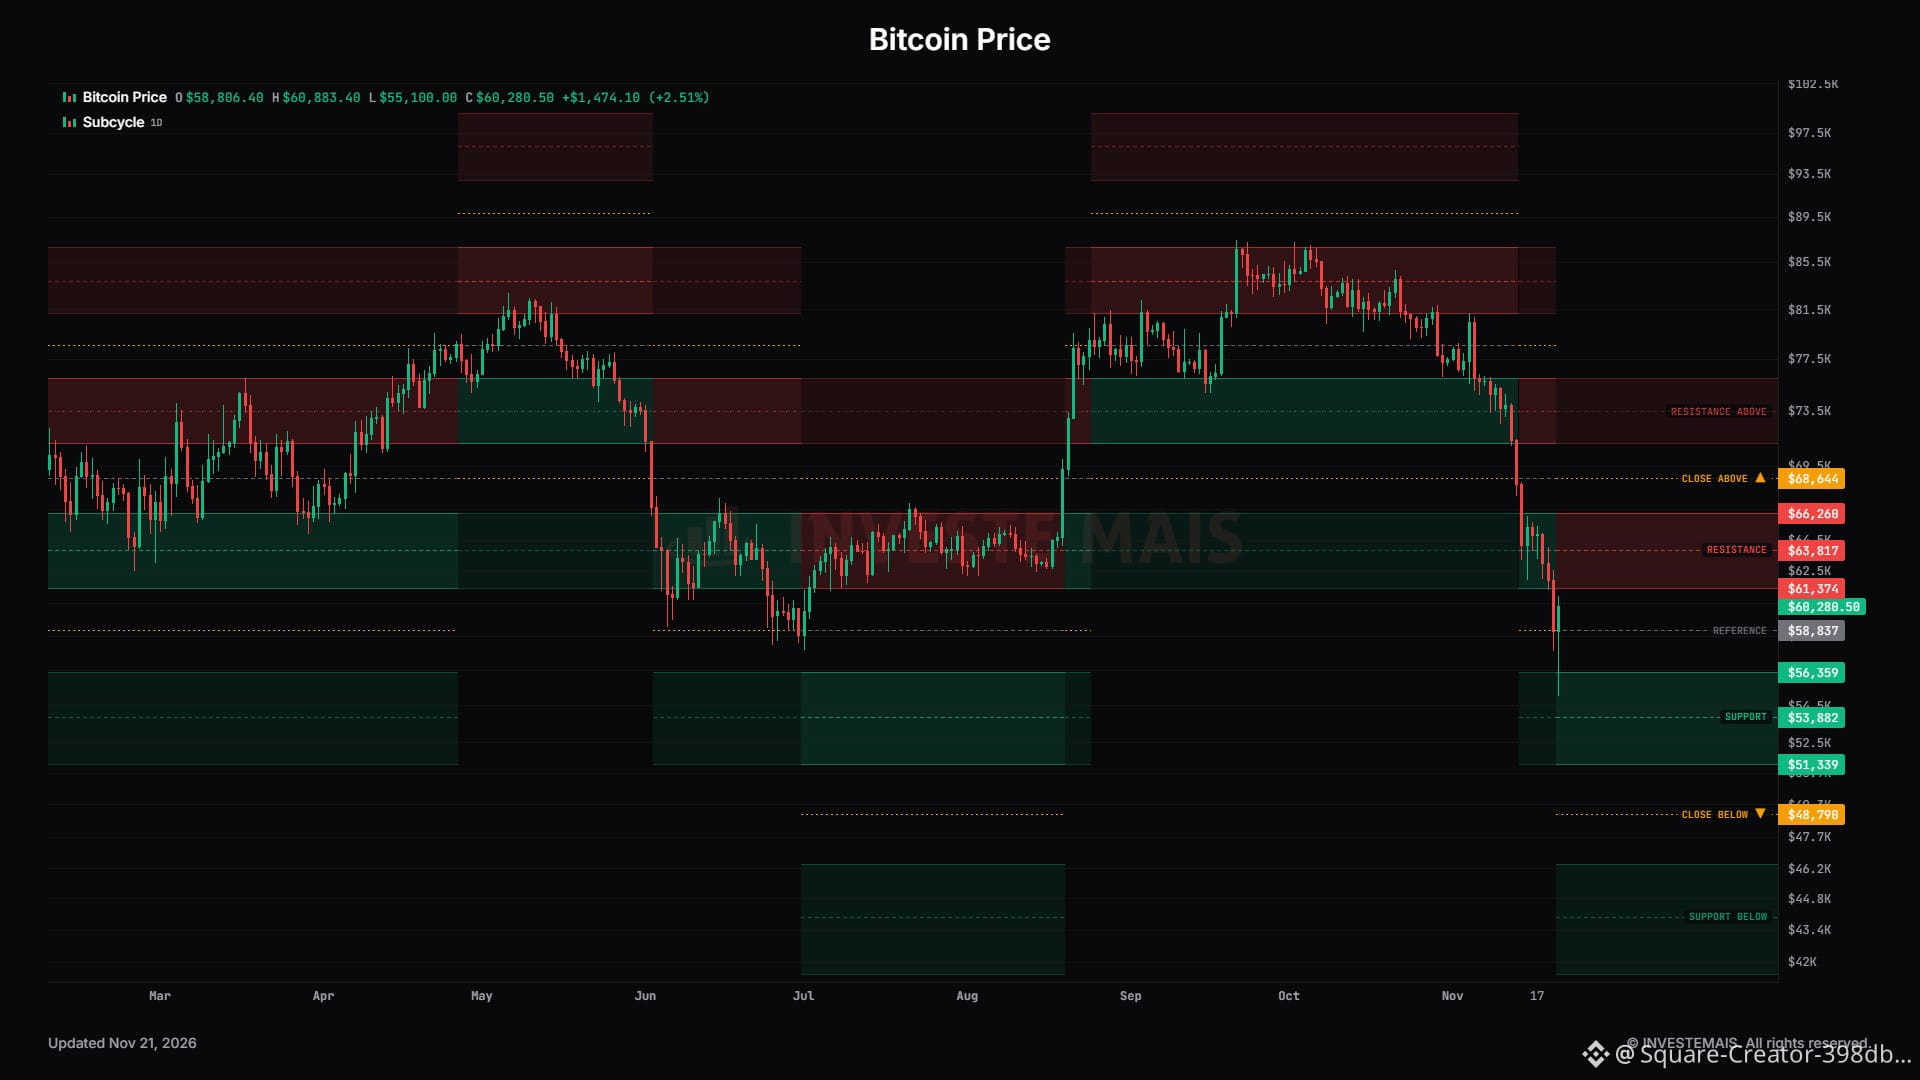
#Bitcoin broke below $58k, which signals an expansion of subcycle in line with the trend — now the former support channel has become resistance.
Control point at $58k (reference) and buy orders (for long positions) within the support channel, with a target for full liquidation of position at $63,8k within the resistance channel — this exit target may change if #BTC price advances and expands into another subcycle.
We use a 3T for long positions and a 5T for short positions — this strategy will be available on www.investemais.net in 2027 as an automated system.
This is one of our main trading strategies — we’ve been using it for at least 6 years and rely solely on price data in its execution.
Currently available in the system only for BTC — with plans to expand to other assets in future. We’re now using this chart to track Bitcoin subcycles.
New design, new layout for easier reading.
What do you think? #BTC Price Analysis# #Macro Insights# #TradingSetup $BTC
#Bitcoin broke below $58k, which signals an expansion of subcycle in line with the trend — now the former support channel has become resistance.
Control point at $58k (reference) and buy orders (for long positions) within the support channel, with a target for full liquidation of position at $63,8k within the resistance channel — this exit target may change if #BTC price advances and expands into another subcycle.
We use a 3T for long positions and a 5T for short positions — this strategy will be available on www.investemais.net in 2027 as an automated system.
This is one of our main trading strategies — we’ve been using it for at least 6 years and rely solely on price data in its execution.
Currently available in the system only for BTC — with plans to expand to other assets in future. We’re now using this chart to track Bitcoin subcycles.
New design, new layout for easier reading.
What do you think? #BTC Price Analysis# #Macro Insights# #TradingSetup $BTC
Control point at $58k (reference) and buy orders (for long positions) within the support channel, with a target for full liquidation of position at $63,8k within the resistance channel — this exit target may change if #BTC price advances and expands into another subcycle.
We use a 3T for long positions and a 5T for short positions — this strategy will be available on www.investemais.net in 2027 as an automated system.
This is one of our main trading strategies — we’ve been using it for at least 6 years and rely solely on price data in its execution.
Currently available in the system only for BTC — with plans to expand to other assets in future. We’re now using this chart to track Bitcoin subcycles.
New design, new layout for easier reading.
What do you think? #BTC Price Analysis# #Macro Insights# #TradingSetup $BTC
Übersetzung ansehen
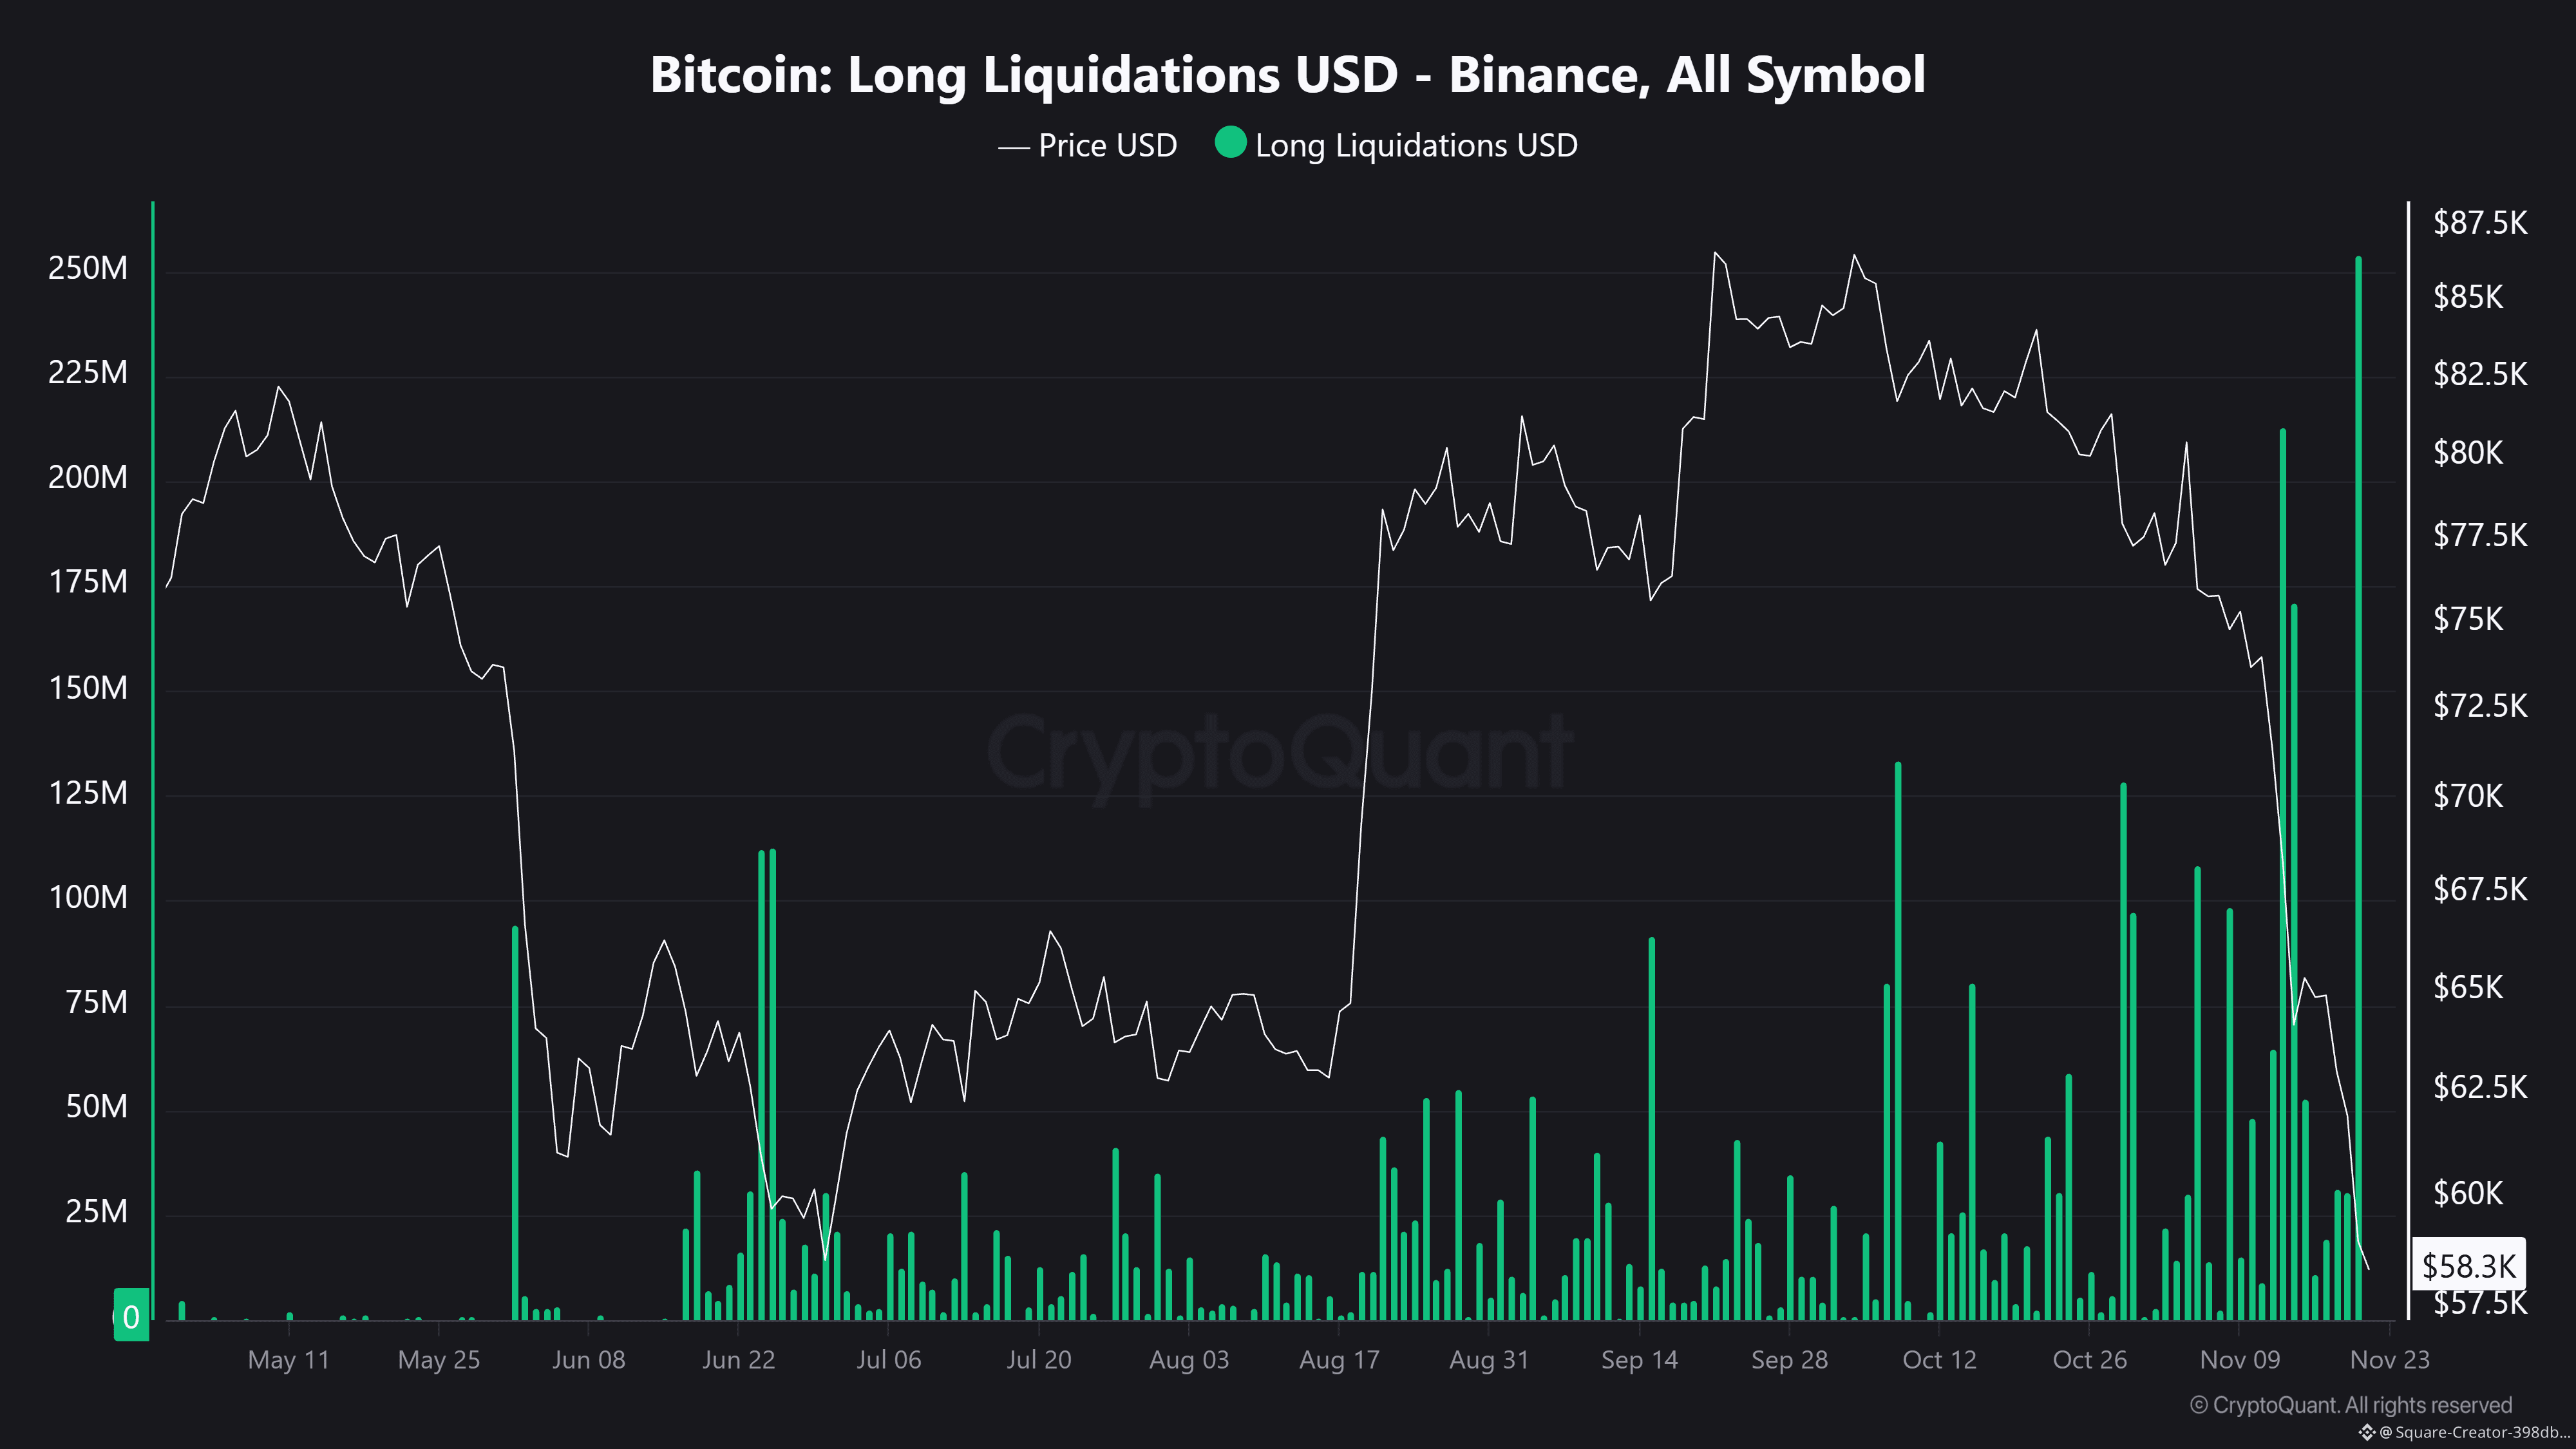
$254 million in #Binance Longs Liquidated in one Day
Binance had its heaviest day of the year for long liquidations on November 20.
About $254m in #Bitcoin longs were forced out as #BTC price fell from $61,9k to $59k touching $55k intraday.
That is roughly 17 times the daily average of the past twelve months, and longs made up 93% of everything liquidated.
It wasn't an isolated day either. November 13 ($213m) and November 14 ($171m) now rank second and third, so the three largest long flushes of the year on Binance all came within eight days.
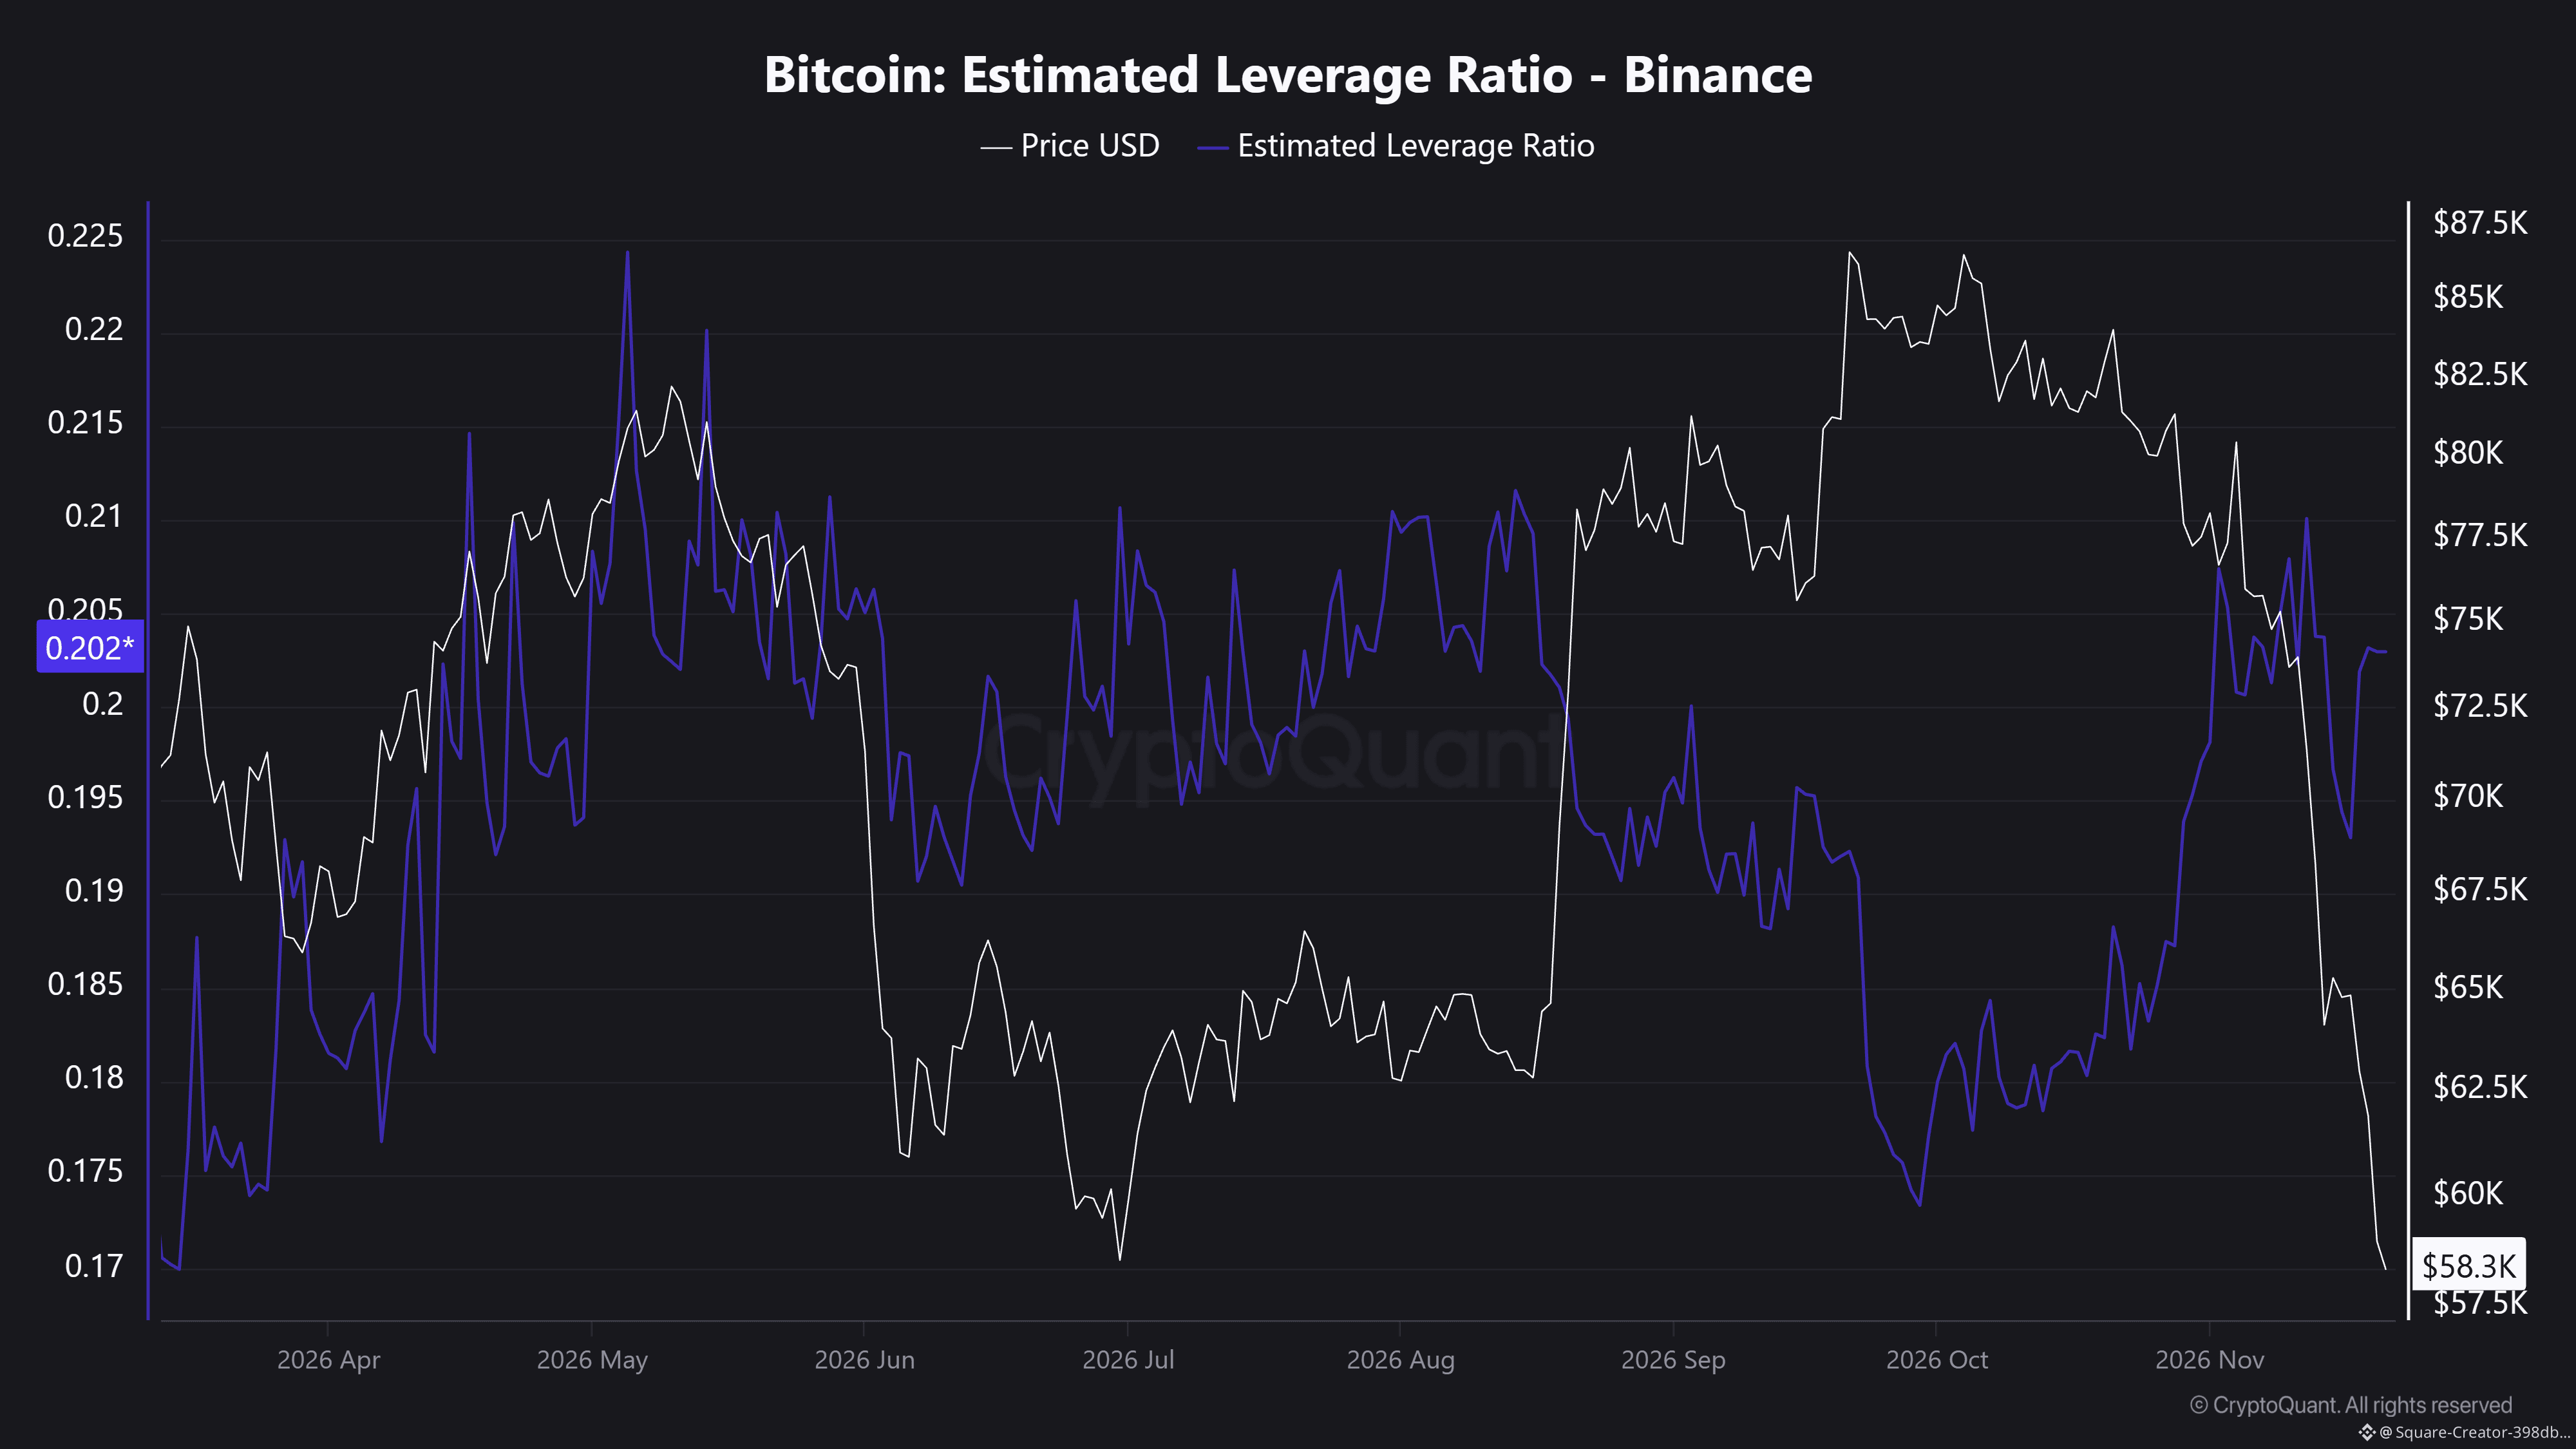
Since November 9, about $920m in longs have been liquidated, against $180m in shorts. You would expect that much forced selling to bring leverage down — on Binance, it barely has.
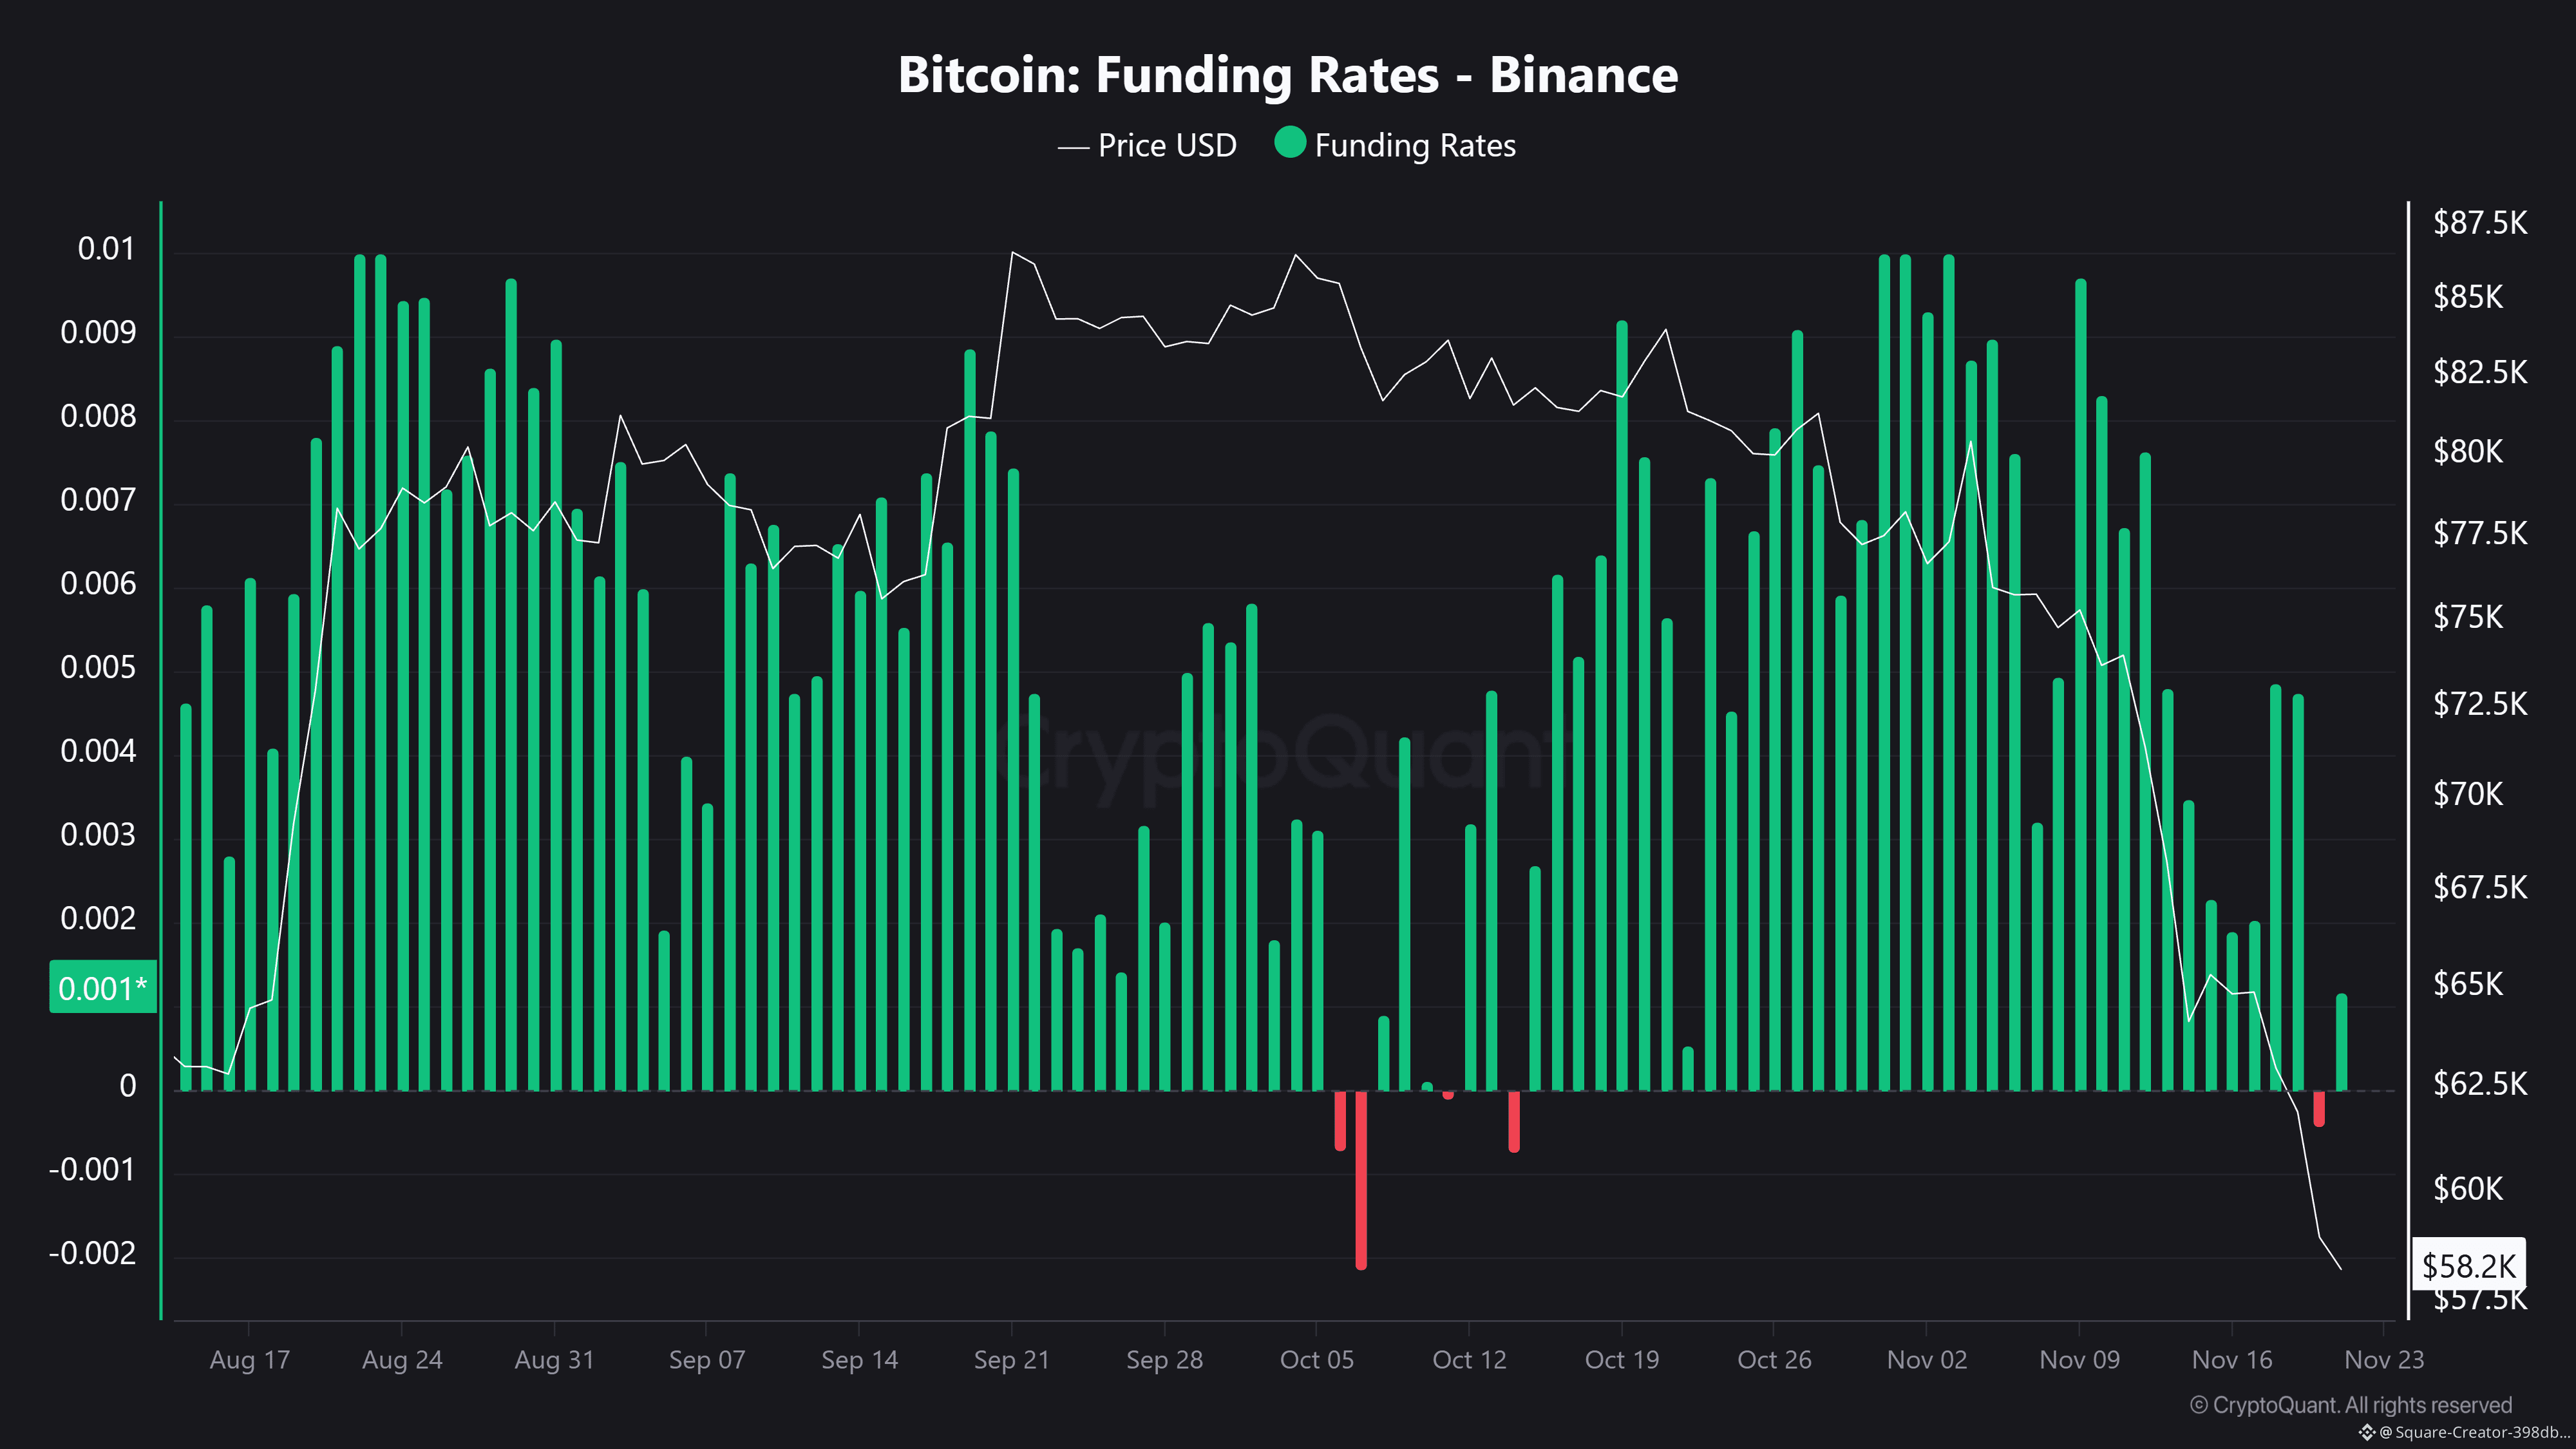
The estimated leverage ratio was 0.205 on November 9 and 0.203 on November 20 Funding is the part that changed — After more than a month above zero, it slipped to -0.0004 on November 20, the first negative reading since October 14. #BTC Price Analysis# #FuturesTrading $BTC
$254 million in #Binance Longs Liquidated in one Day
Binance had its heaviest day of the year for long liquidations on November 20.
About $254m in #Bitcoin longs were forced out as #BTC price fell from $61,9k to $59k touching $55k intraday.
That is roughly 17 times the daily average of the past twelve months, and longs made up 93% of everything liquidated.
It wasn't an isolated day either. November 13 ($213m) and November 14 ($171m) now rank second and third, so the three largest long flushes of the year on Binance all came within eight days.
Since November 9, about $920m in longs have been liquidated, against $180m in shorts. You would expect that much forced selling to bring leverage down — on Binance, it barely has.
The estimated leverage ratio was 0.205 on November 9 and 0.203 on November 20 Funding is the part that changed — After more than a month above zero, it slipped to -0.0004 on November 20, the first negative reading since October 14. #BTC Price Analysis# #FuturesTrading $BTC
Binance had its heaviest day of the year for long liquidations on November 20.
About $254m in #Bitcoin longs were forced out as #BTC price fell from $61,9k to $59k touching $55k intraday.
That is roughly 17 times the daily average of the past twelve months, and longs made up 93% of everything liquidated.
It wasn't an isolated day either. November 13 ($213m) and November 14 ($171m) now rank second and third, so the three largest long flushes of the year on Binance all came within eight days.
Since November 9, about $920m in longs have been liquidated, against $180m in shorts. You would expect that much forced selling to bring leverage down — on Binance, it barely has.
The estimated leverage ratio was 0.205 on November 9 and 0.203 on November 20 Funding is the part that changed — After more than a month above zero, it slipped to -0.0004 on November 20, the first negative reading since October 14. #BTC Price Analysis# #FuturesTrading $BTC
Übersetzung ansehen
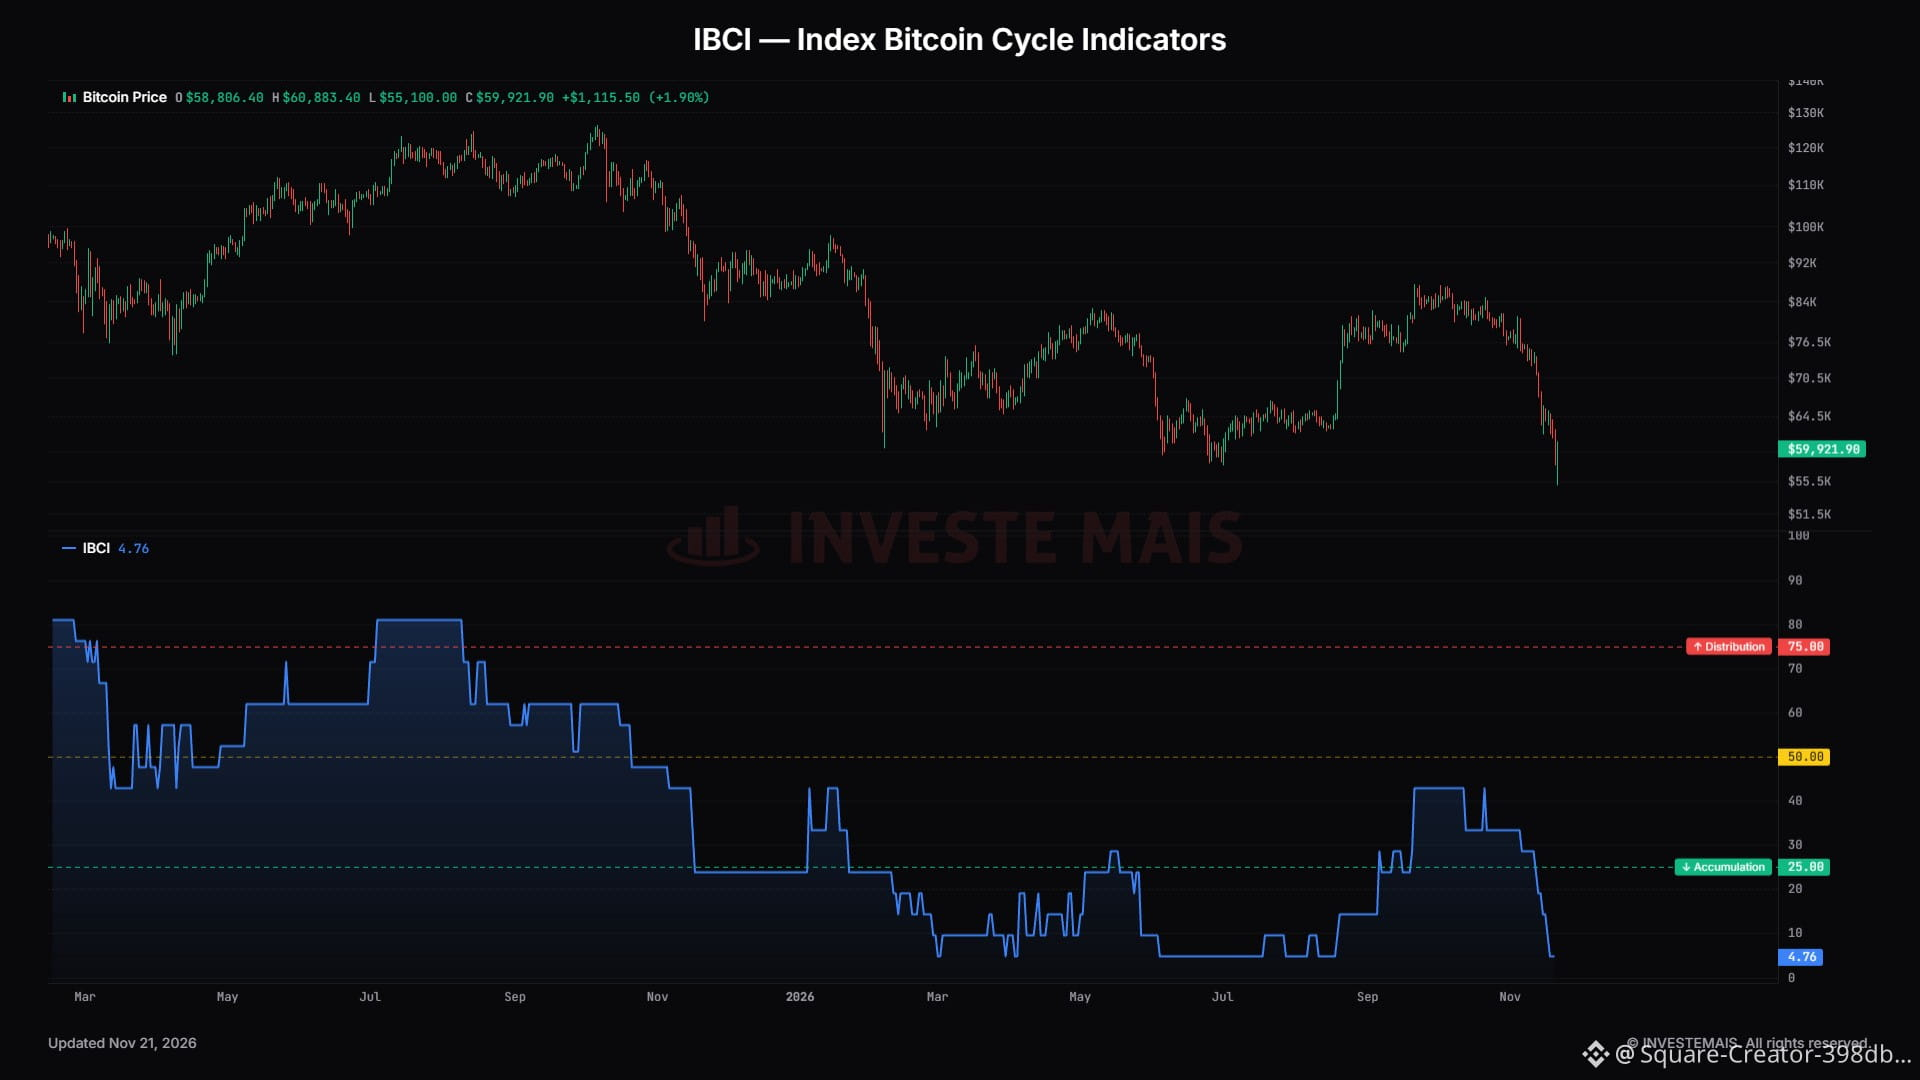
IBCI at 4.76 points🟩
#Bitcoin price $59k🔻🔺 #BTC Price Analysis# #Macro Insights# #OnChainAnalysis #BTC $BTC
IBCI at 4.76 points🟩
#Bitcoin price $59k🔻🔺 #BTC Price Analysis# #Macro Insights# #OnChainAnalysis #BTC $BTC
#Bitcoin price $59k🔻🔺 #BTC Price Analysis# #Macro Insights# #OnChainAnalysis #BTC $BTC
26
Übersetzung ansehen
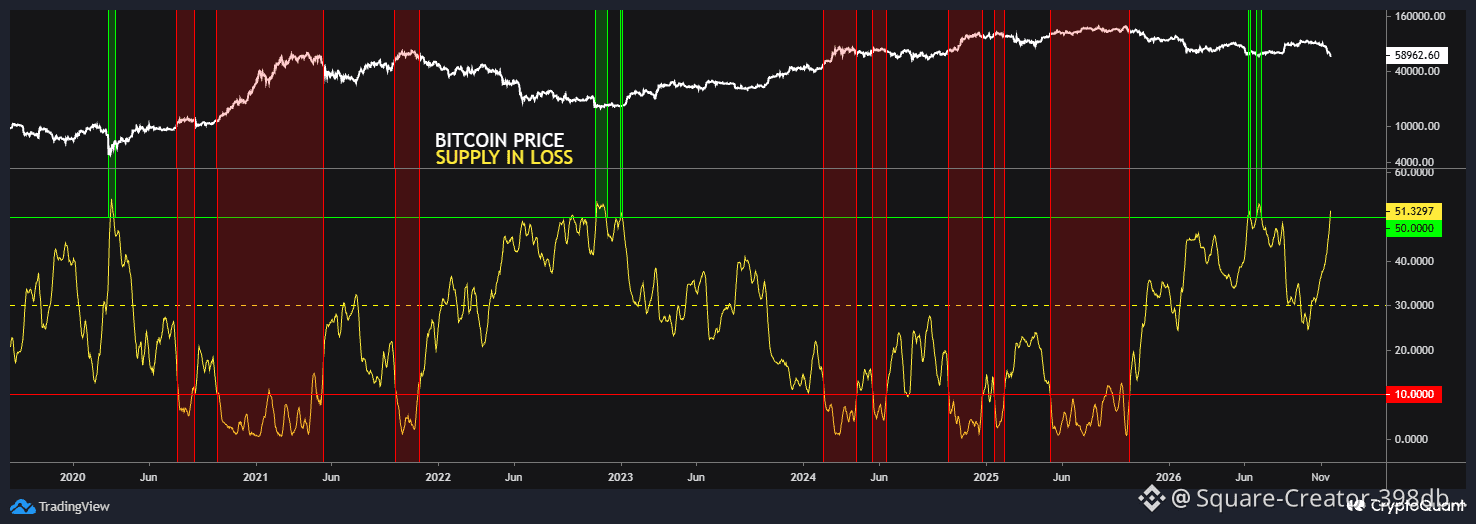
Supply in Loss MA7d in historic bottom🟩 region
The indicator reached 140-day high — re-entering historic bottom zone in 2026, located above 50%.
Most of #BTC supply is now in the red — this is a pattern that historically coincides with the formation of #Bitcoin bottom #BTC Price Analysis# #Macro Insights# #OnChainAnalysis $BTC
Supply in Loss MA7d in historic bottom🟩 region
The indicator reached 140-day high — re-entering historic bottom zone in 2026, located above 50%.
Most of #BTC supply is now in the red — this is a pattern that historically coincides with the formation of #Bitcoin bottom #BTC Price Analysis# #Macro Insights# #OnChainAnalysis $BTC
The indicator reached 140-day high — re-entering historic bottom zone in 2026, located above 50%.
Most of #BTC supply is now in the red — this is a pattern that historically coincides with the formation of #Bitcoin bottom #BTC Price Analysis# #Macro Insights# #OnChainAnalysis $BTC
28
Übersetzung ansehen
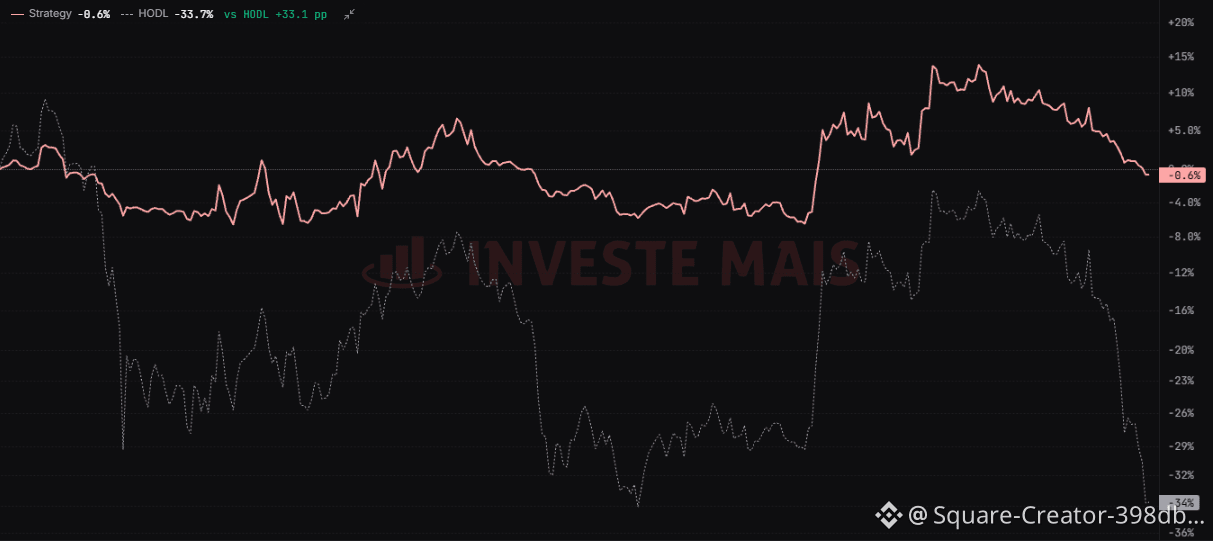
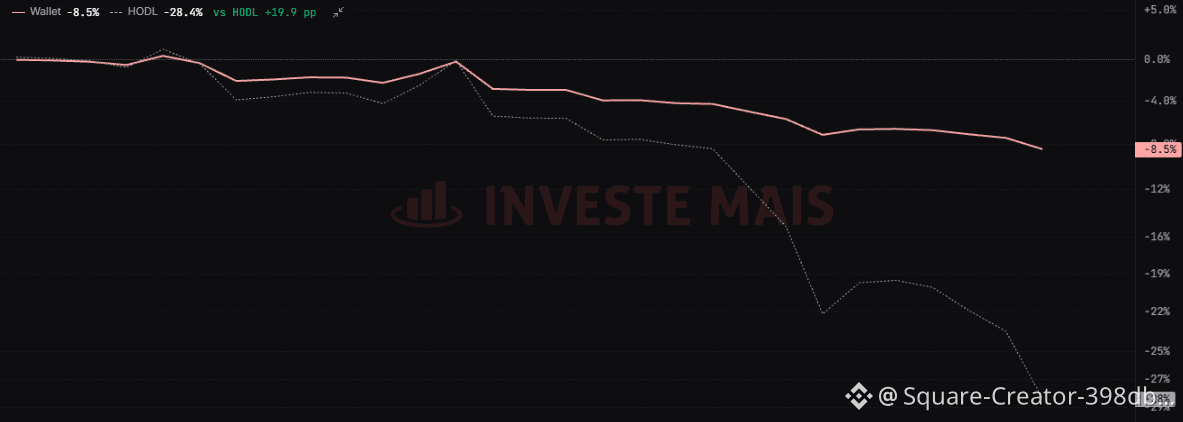
This is one of our management strategies based on more than 60 different composite data points, including technical data on prices, on-chain metrics, derivatives and macro.
Here, we prioritize maintaining a maximum of 10% exposure in sell mode and 90% exposure in buy mode — we are never completely in or completely out — and this parameter can be adjusted by the user depending on their plan.
While #Bitcoin drops more than -28.4% during same period, the strategy executed its last exit at $73,870 when it switched to sell mode and has remained 20% exposed to the present, with a return of just -8.5%.
This represents a difference of 19.9pp between the price performance and the strategy’s performance over same period.
As #BTC fluctuates and data updates the market landscape across all fronts, capital management is handled automatically by the system, allowing for a considerably lower drawdown with performance that outperforms price, historical data with backtesting since January 2018. YTD in 2026, our capital managed under the strategy remained essentially unchanged, while Bitcoin fell by -33.7% over the same period.
In a bear market year, our capital remained practically unchanged while the price BTC plummeted.
With these strategies, users can focus on increasing the amount BTC or USD in their wallet — in my case, I always prioritize having more satoshis at the end day.
Regardless of the direction price takes over the course of weeks or months, we will always trade based on data and using defined strategies to mitigate losses and maximize profits.
Available in 2027 on www.investemais.net
We have much more to show — stay tuned🫡
Coming soon... ⌛️ #BTC Price Analysis# #Macro Insights# #Strategy $BTC
This is one of our management strategies based on more than 60 different composite data points, including technical data on prices, on-chain metrics, derivatives and macro.
Here, we prioritize maintaining a maximum of 10% exposure in sell mode and 90% exposure in buy mode — we are never completely in or completely out — and this parameter can be adjusted by the user depending on their plan.
While #Bitcoin drops more than -28.4% during same period, the strategy executed its last exit at $73,870 when it switched to sell mode and has remained 20% exposed to the present, with a return of just -8.5%.
This represents a difference of 19.9pp between the price performance and the strategy’s performance over same period.
As #BTC fluctuates and data updates the market landscape across all fronts, capital management is handled automatically by the system, allowing for a considerably lower drawdown with performance that outperforms price, historical data with backtesting since January 2018. YTD in 2026, our capital managed under the strategy remained essentially unchanged, while Bitcoin fell by -33.7% over the same period.
In a bear market year, our capital remained practically unchanged while the price BTC plummeted.
With these strategies, users can focus on increasing the amount BTC or USD in their wallet — in my case, I always prioritize having more satoshis at the end day.
Regardless of the direction price takes over the course of weeks or months, we will always trade based on data and using defined strategies to mitigate losses and maximize profits.
Available in 2027 on www.investemais.net
We have much more to show — stay tuned🫡
Coming soon... ⌛️ #BTC Price Analysis# #Macro Insights# #Strategy $BTC
Here, we prioritize maintaining a maximum of 10% exposure in sell mode and 90% exposure in buy mode — we are never completely in or completely out — and this parameter can be adjusted by the user depending on their plan.
While #Bitcoin drops more than -28.4% during same period, the strategy executed its last exit at $73,870 when it switched to sell mode and has remained 20% exposed to the present, with a return of just -8.5%.
This represents a difference of 19.9pp between the price performance and the strategy’s performance over same period.
As #BTC fluctuates and data updates the market landscape across all fronts, capital management is handled automatically by the system, allowing for a considerably lower drawdown with performance that outperforms price, historical data with backtesting since January 2018. YTD in 2026, our capital managed under the strategy remained essentially unchanged, while Bitcoin fell by -33.7% over the same period.
In a bear market year, our capital remained practically unchanged while the price BTC plummeted.
With these strategies, users can focus on increasing the amount BTC or USD in their wallet — in my case, I always prioritize having more satoshis at the end day.
Regardless of the direction price takes over the course of weeks or months, we will always trade based on data and using defined strategies to mitigate losses and maximize profits.
Available in 2027 on www.investemais.net
We have much more to show — stay tuned🫡
Coming soon... ⌛️ #BTC Price Analysis# #Macro Insights# #Strategy $BTC
41
Übersetzung ansehen
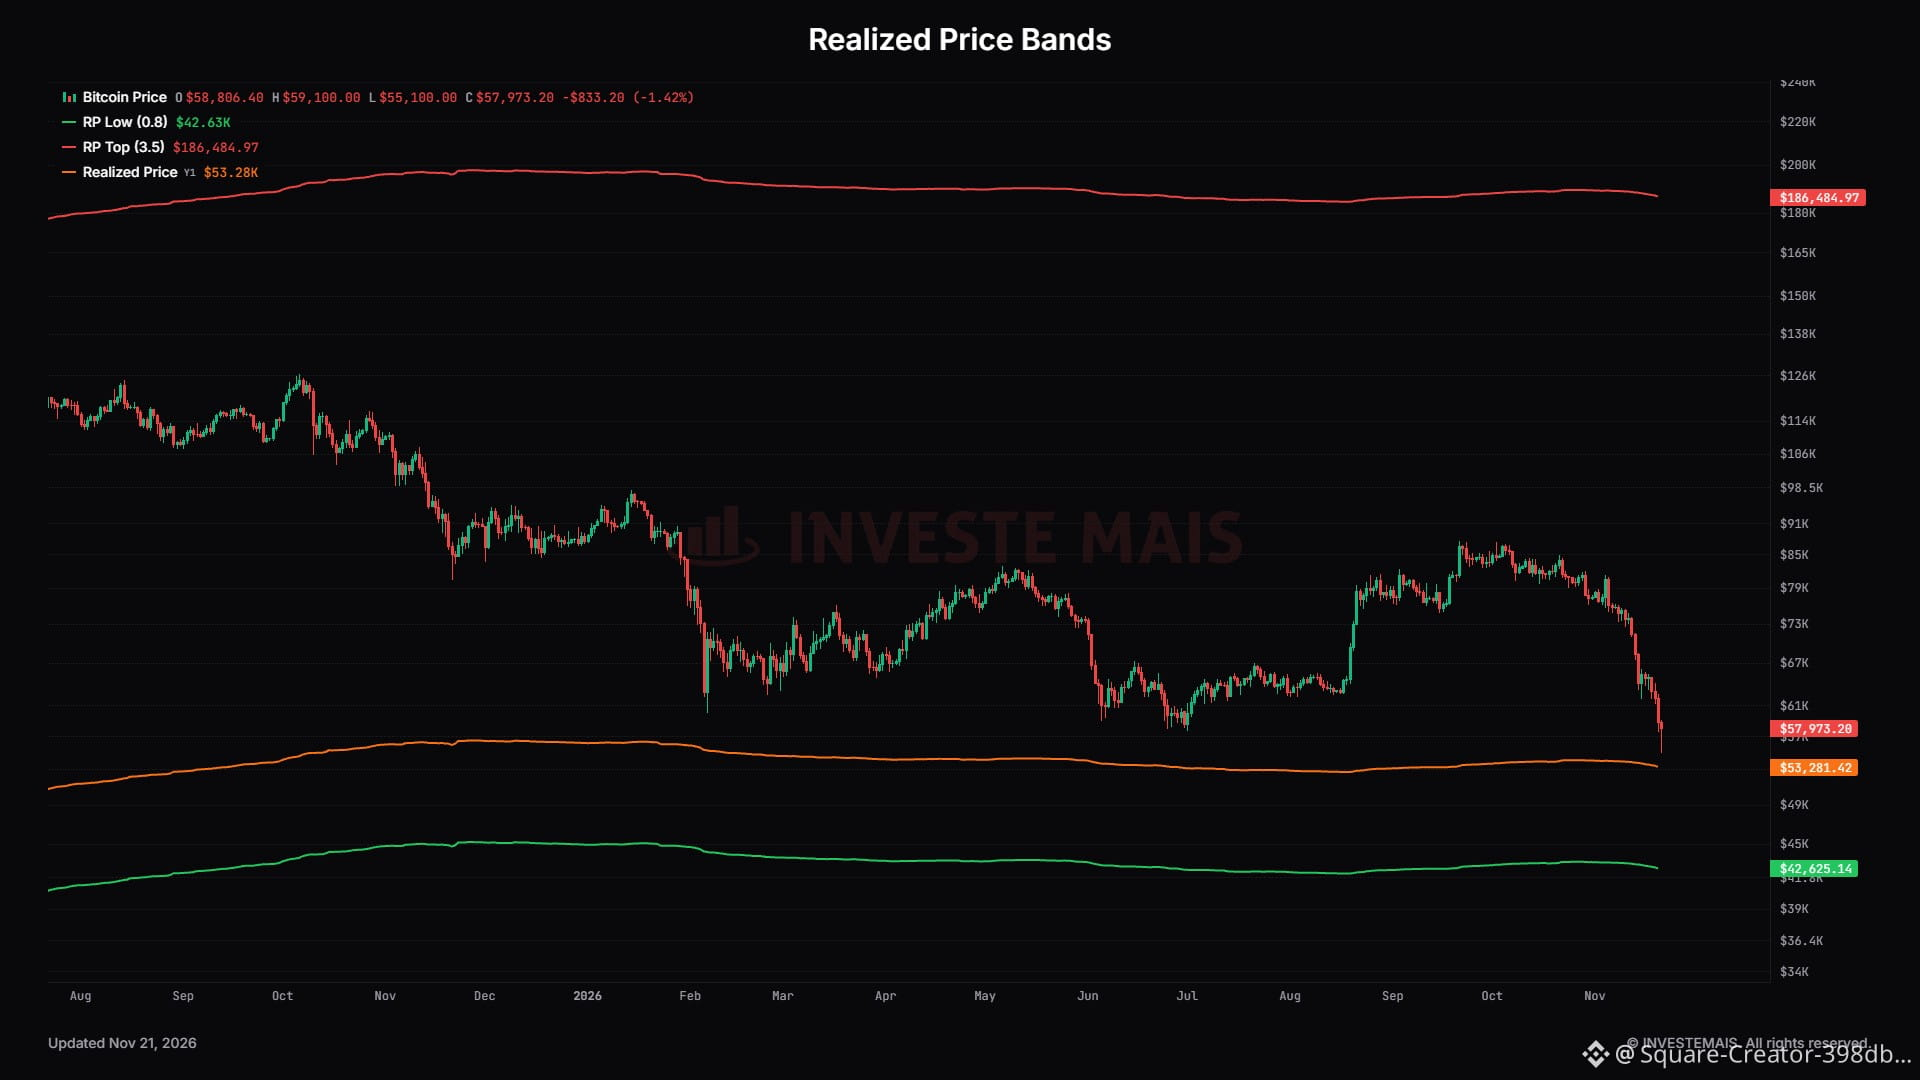
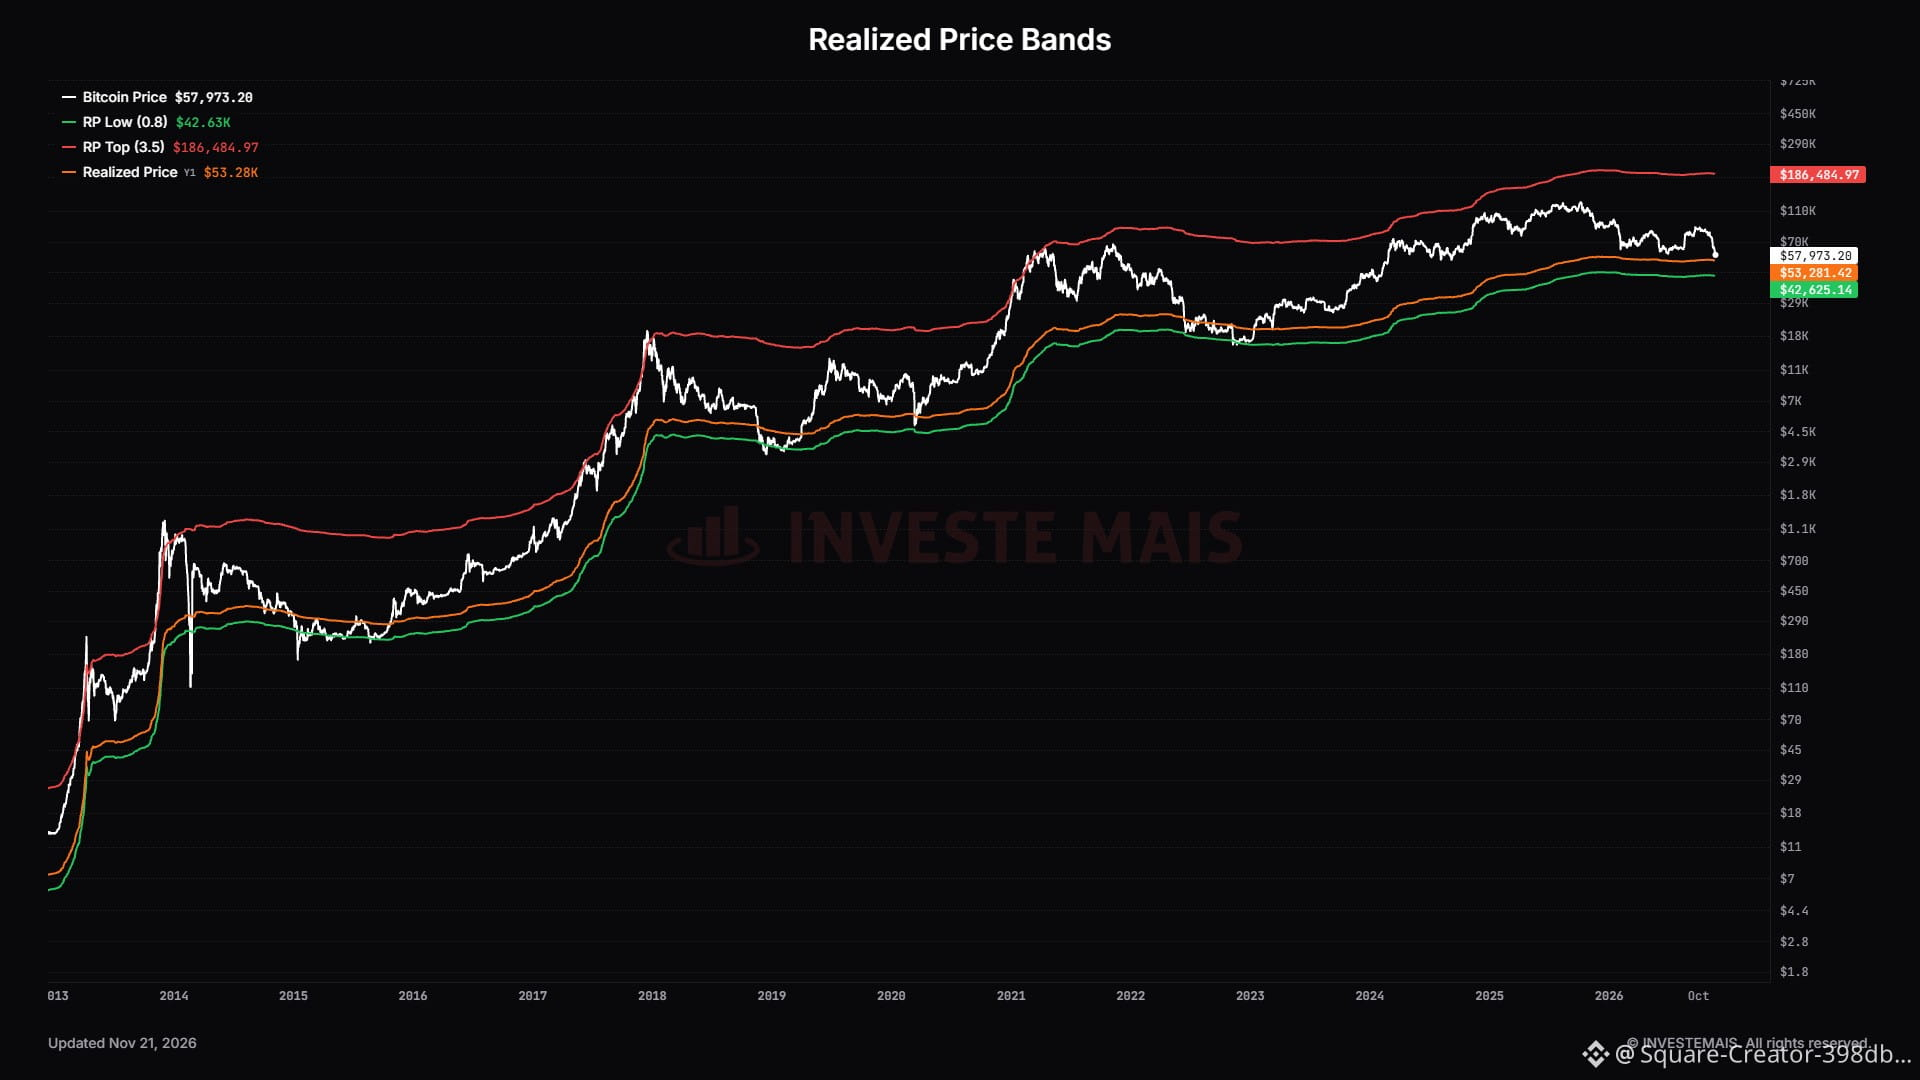
#Bitcoin approaches Realized Price The range between RP and the lower band is $53k–$42k
Historically this region acts as a floor #BTC #BTC Price Analysis# #Macro Insights# #OnChainAnalysis $BTC
#Bitcoin approaches Realized Price The range between RP and the lower band is $53k–$42k
Historically this region acts as a floor #BTC #BTC Price Analysis# #Macro Insights# #OnChainAnalysis $BTC
Historically this region acts as a floor #BTC #BTC Price Analysis# #Macro Insights# #OnChainAnalysis $BTC
54
Übersetzung ansehen
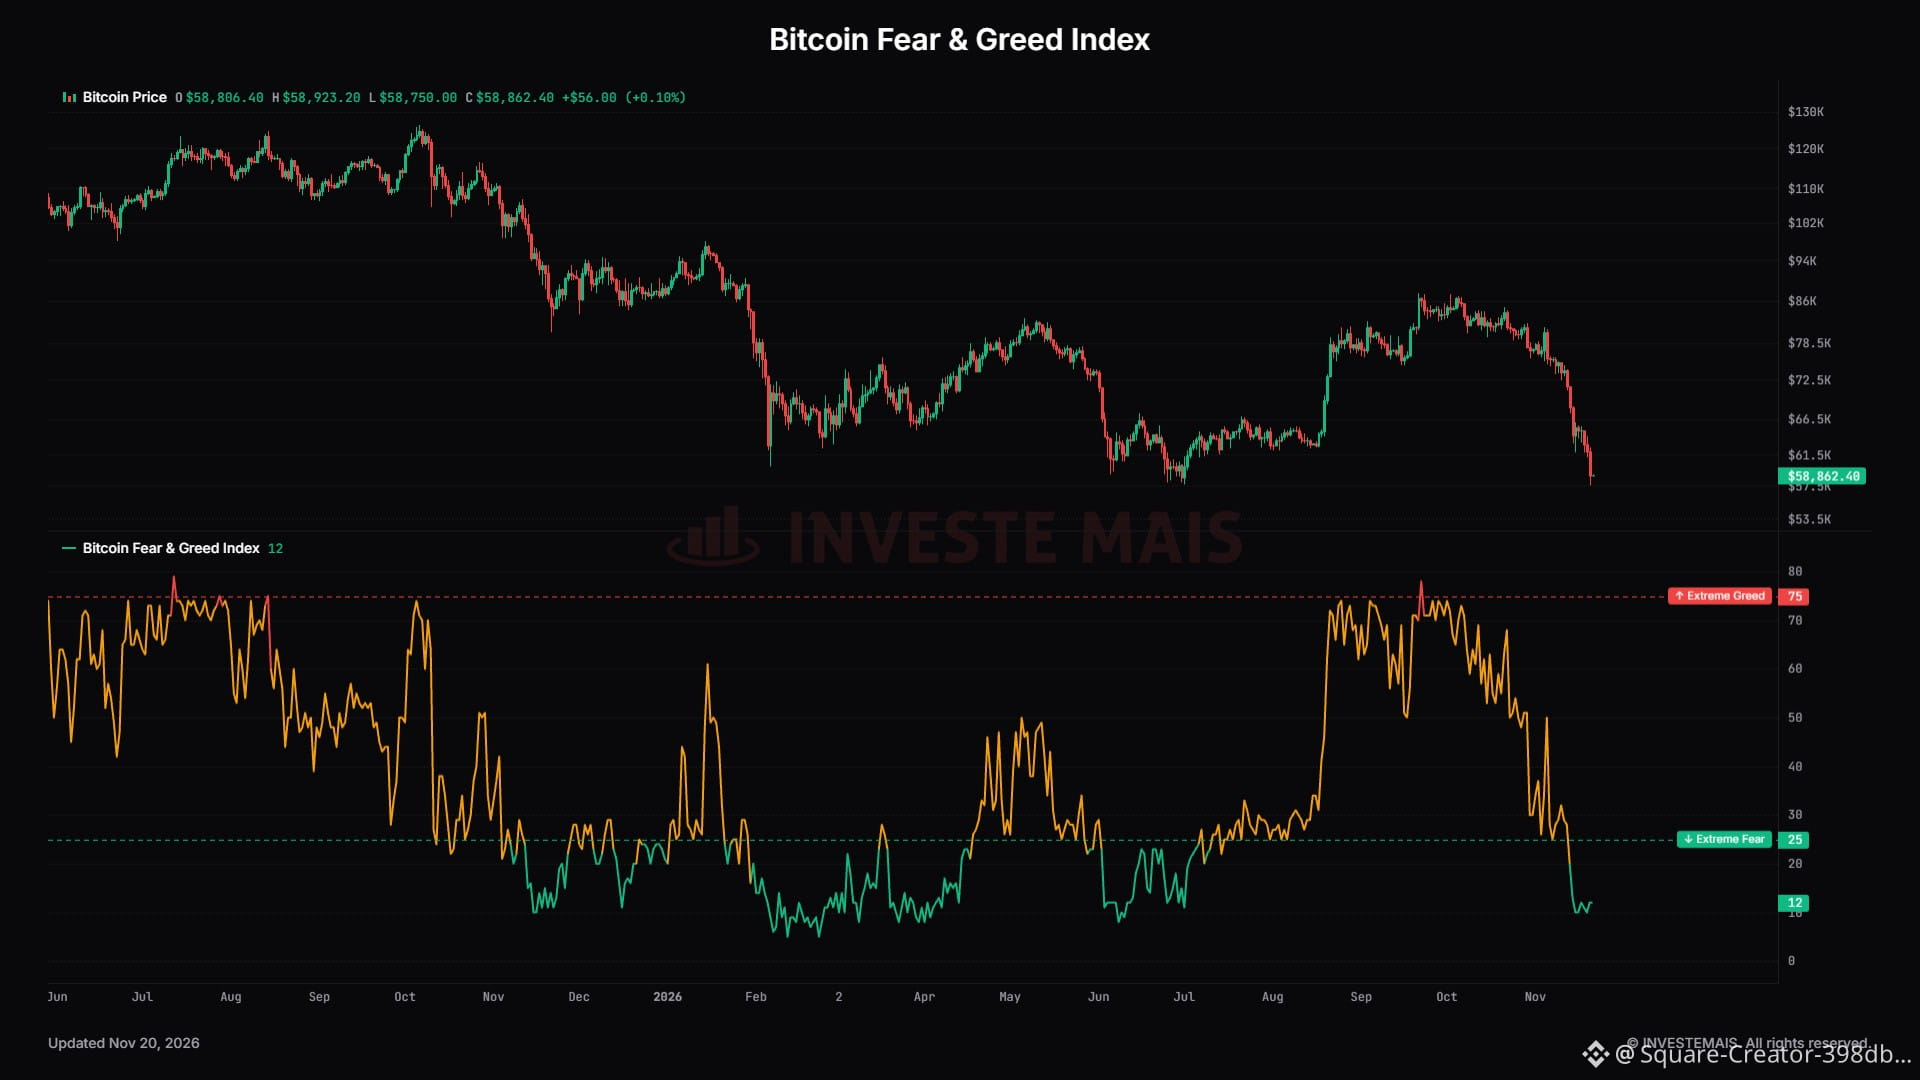
12 🟩 Extreme Fear #Bitcoin #BTC Price Analysis# #Macro Insights# #TechnicalAnalysis #Bullish $BTC
12 🟩 Extreme Fear #Bitcoin #BTC Price Analysis# #Macro Insights# #TechnicalAnalysis #Bullish $BTC
106
Übersetzung ansehen
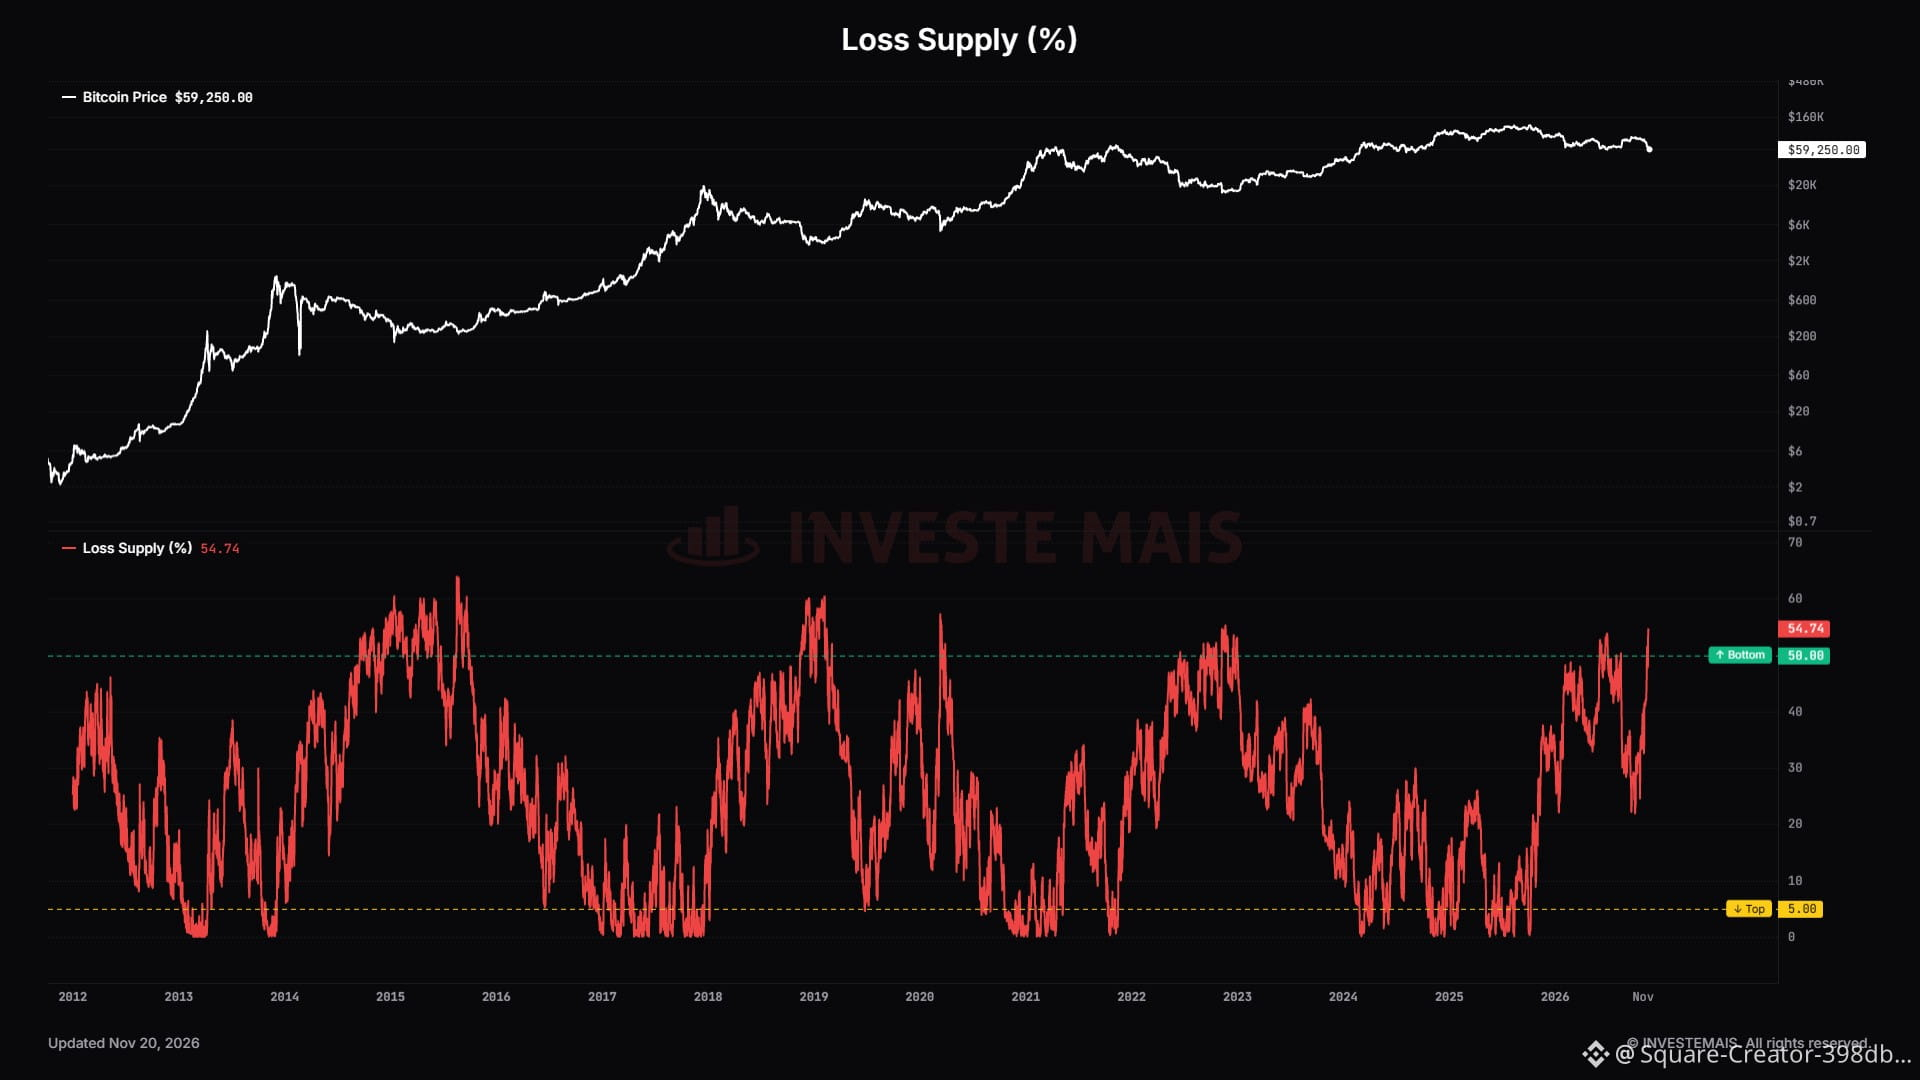
#Bitcoin supply at loss hits a new high for year 54.74% #BTC Price Analysis# #Macro Insights# #OnChainAnalysis #BTC $BTC
#Bitcoin supply at loss hits a new high for year 54.74% #BTC Price Analysis# #Macro Insights# #OnChainAnalysis #BTC $BTC
28
Übersetzung ansehen
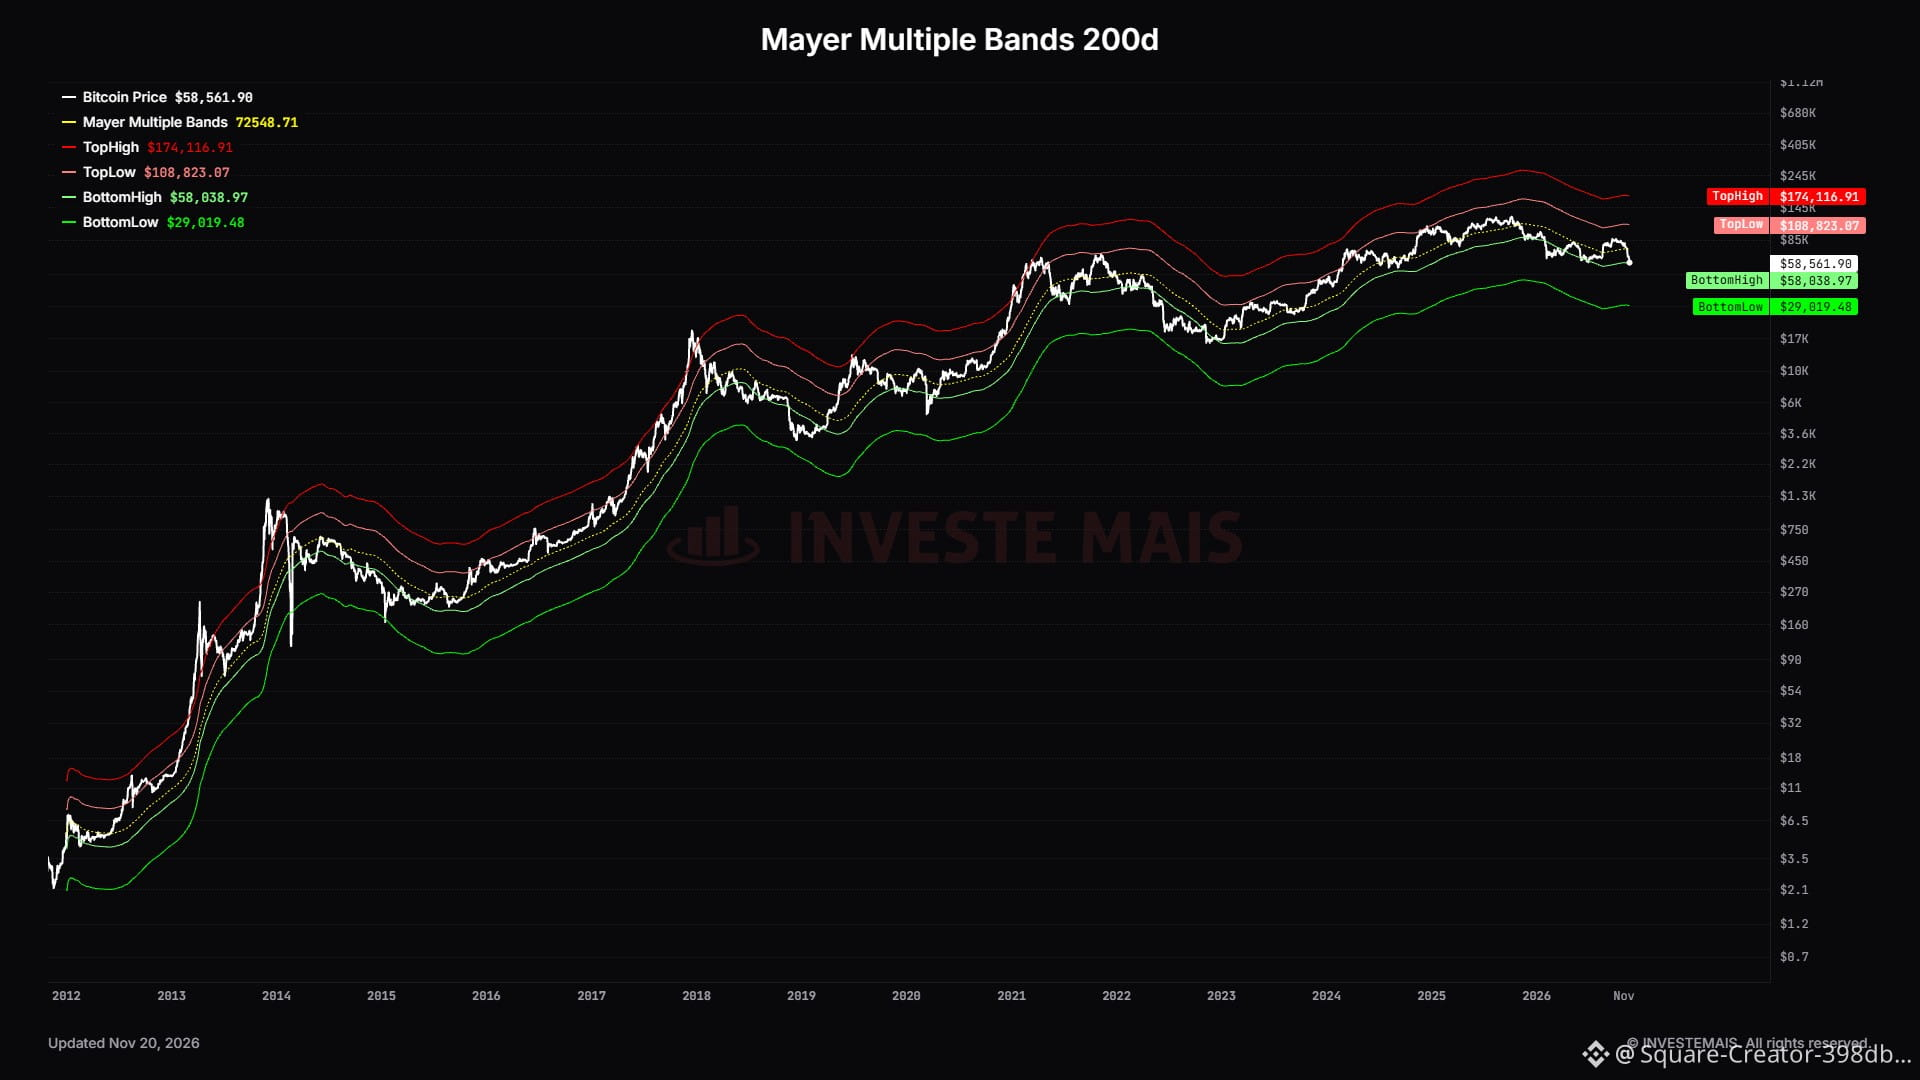
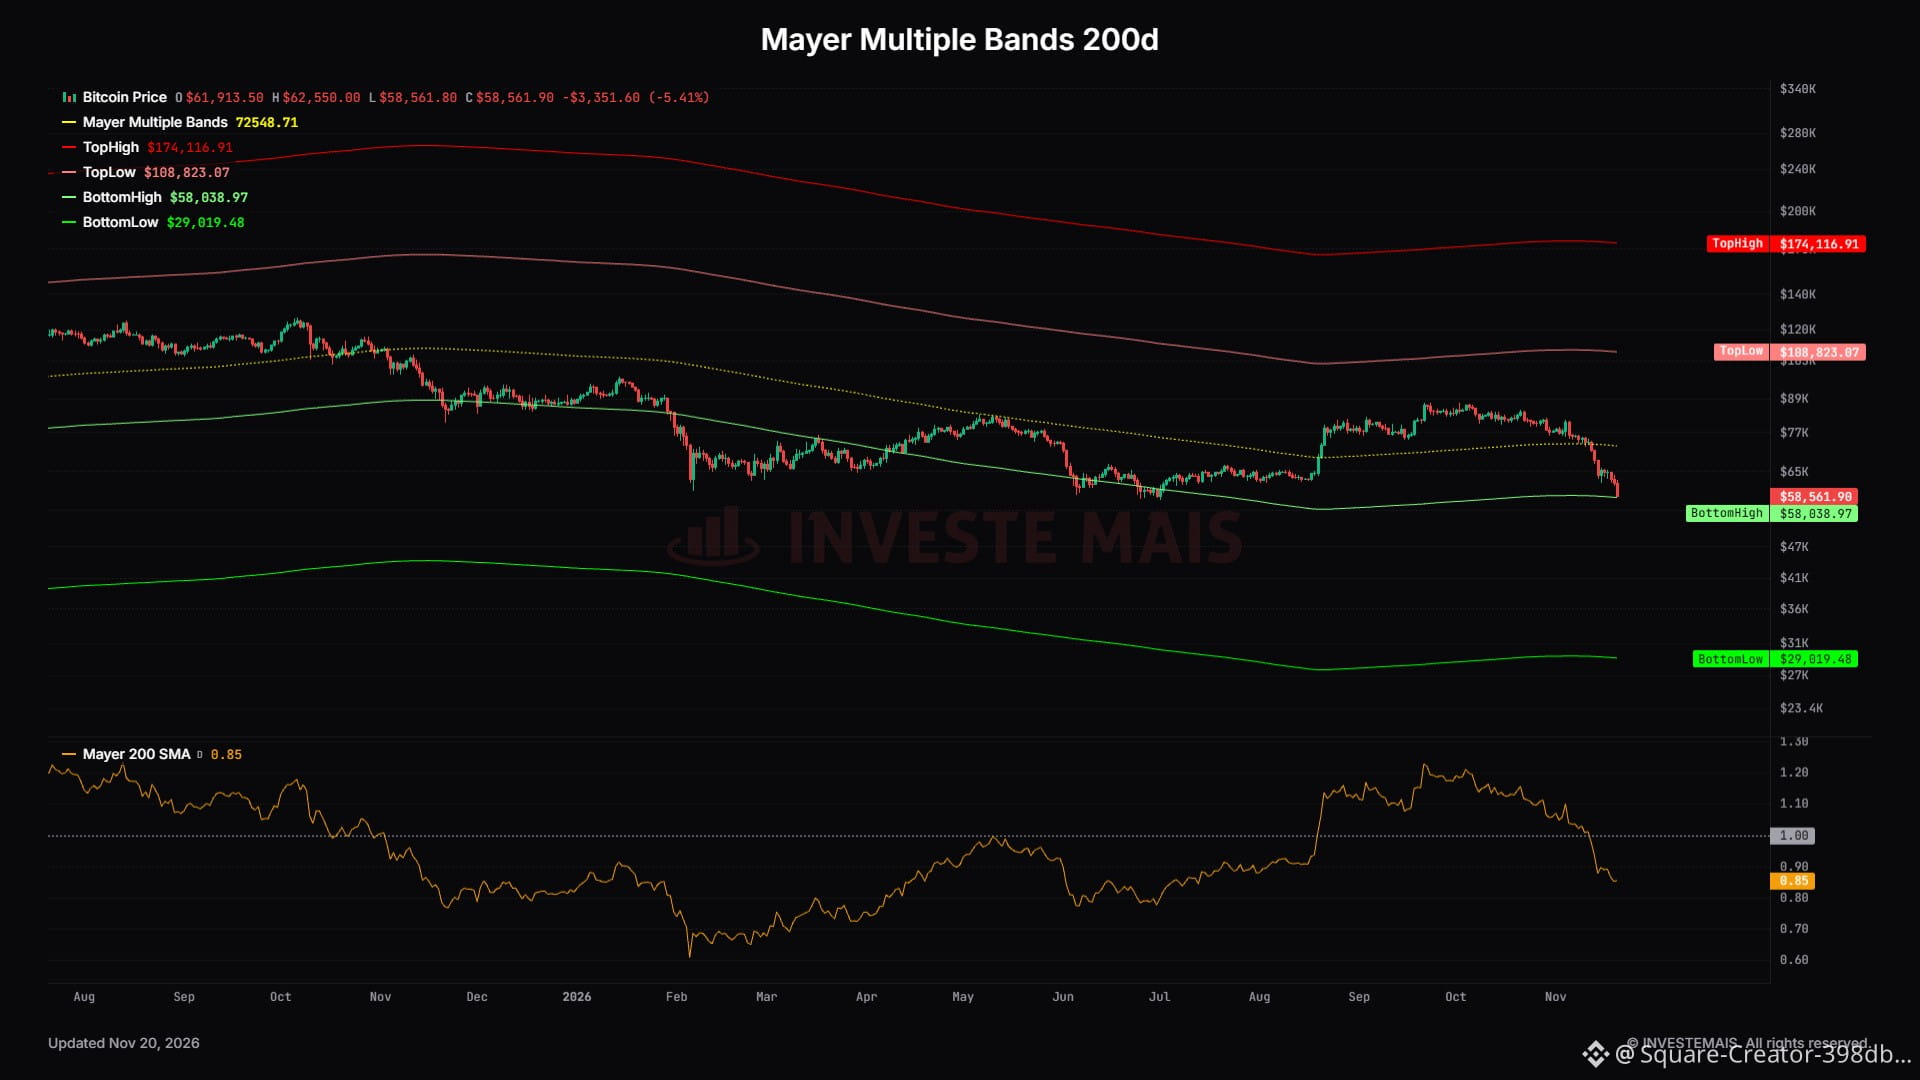
#Bitcoin approaches the BottomHigh band
Currently at $58,038
The last time #BTC price tested below this band was in June 2026 between $62k-$60k
There have been two periods this year when trading occurred below this band.
After testing below this area, the price tends to return to yellow line. Historically Bitcoin bottoms have formed within the Bottom High-Low range #BTC Price Analysis# #Macro Insights# #OnChainAnalysis $BTC
#Bitcoin approaches the BottomHigh band
Currently at $58,038
The last time #BTC price tested below this band was in June 2026 between $62k-$60k
There have been two periods this year when trading occurred below this band.
After testing below this area, the price tends to return to yellow line. Historically Bitcoin bottoms have formed within the Bottom High-Low range #BTC Price Analysis# #Macro Insights# #OnChainAnalysis $BTC
Currently at $58,038
The last time #BTC price tested below this band was in June 2026 between $62k-$60k
There have been two periods this year when trading occurred below this band.
After testing below this area, the price tends to return to yellow line. Historically Bitcoin bottoms have formed within the Bottom High-Low range #BTC Price Analysis# #Macro Insights# #OnChainAnalysis $BTC
30
Übersetzung ansehen
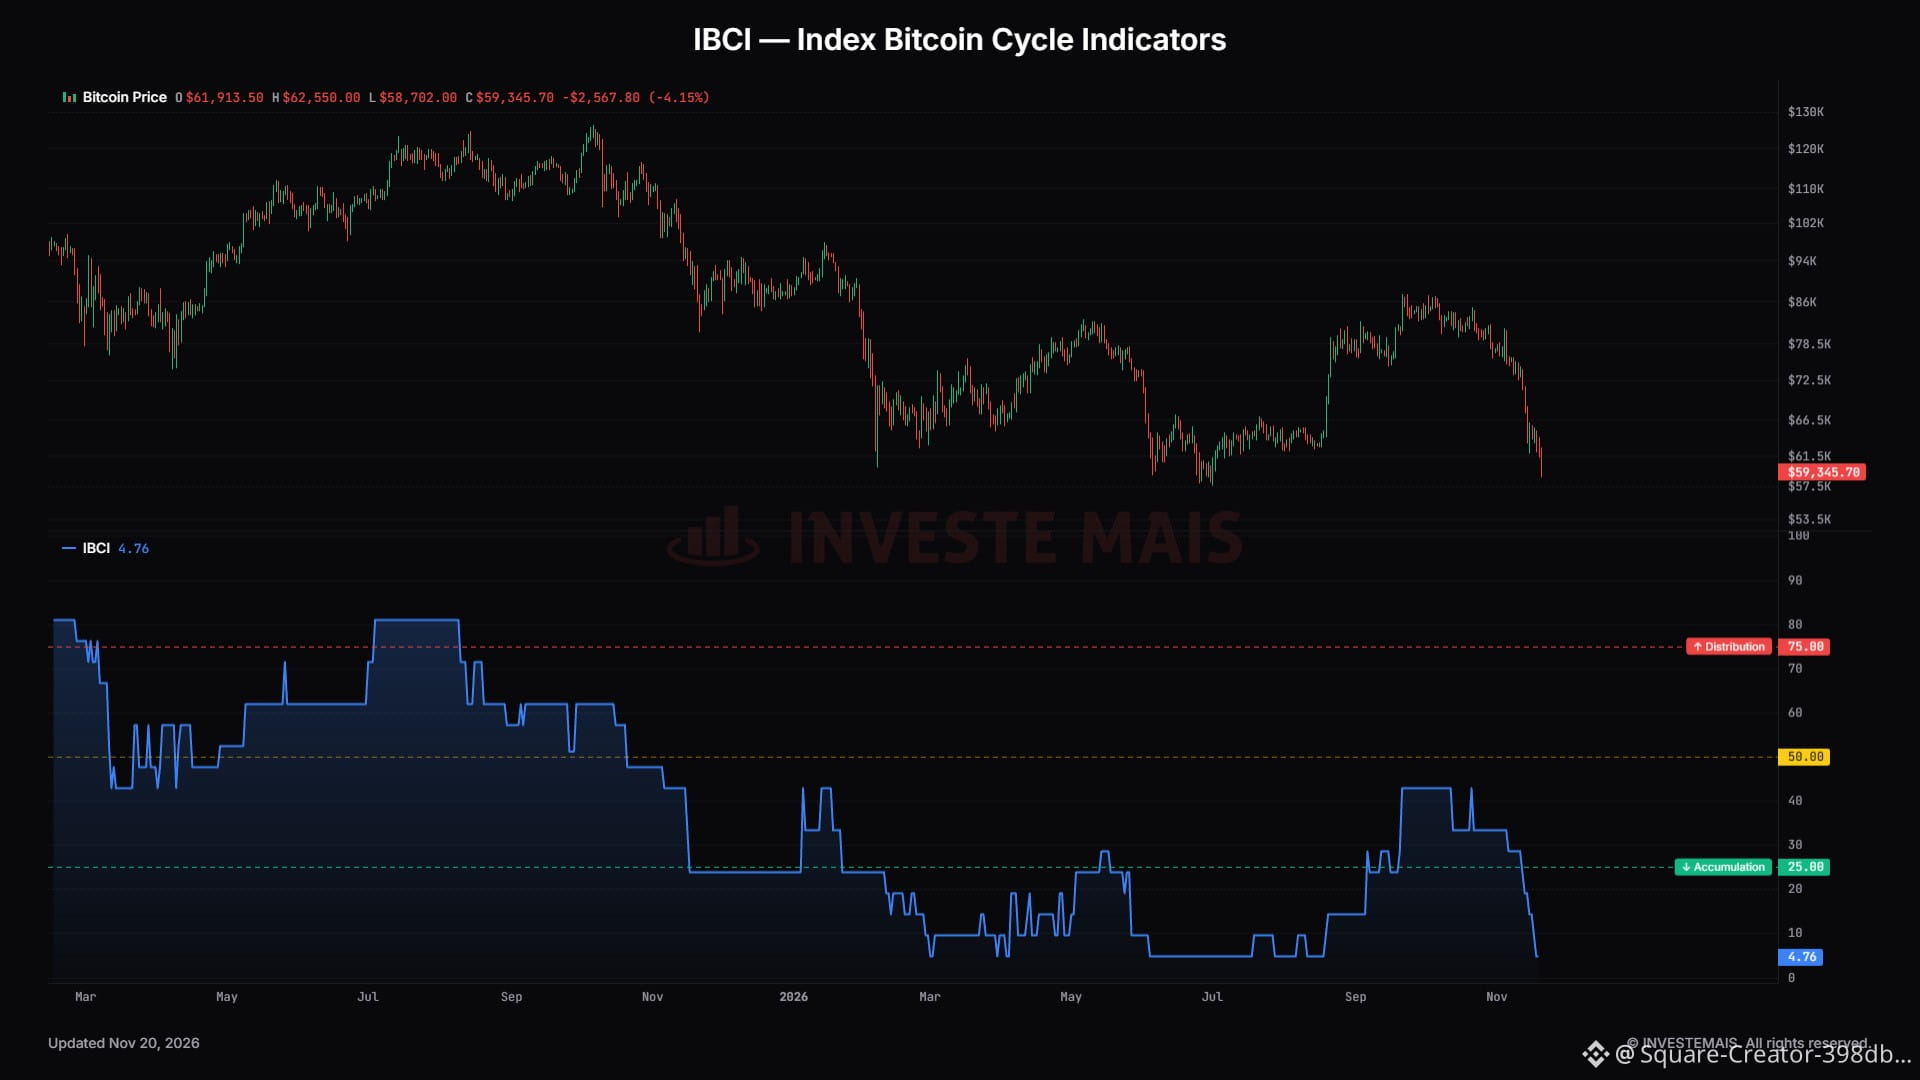
IBCI at 4.76 points🟩
#Bitcoin price $59k🔻 #BTC Price Analysis# #Macro Insights# #OnChainAnalysis #BTC $BTC
IBCI at 4.76 points🟩
#Bitcoin price $59k🔻 #BTC Price Analysis# #Macro Insights# #OnChainAnalysis #BTC $BTC
#Bitcoin price $59k🔻 #BTC Price Analysis# #Macro Insights# #OnChainAnalysis #BTC $BTC
37
Übersetzung ansehen
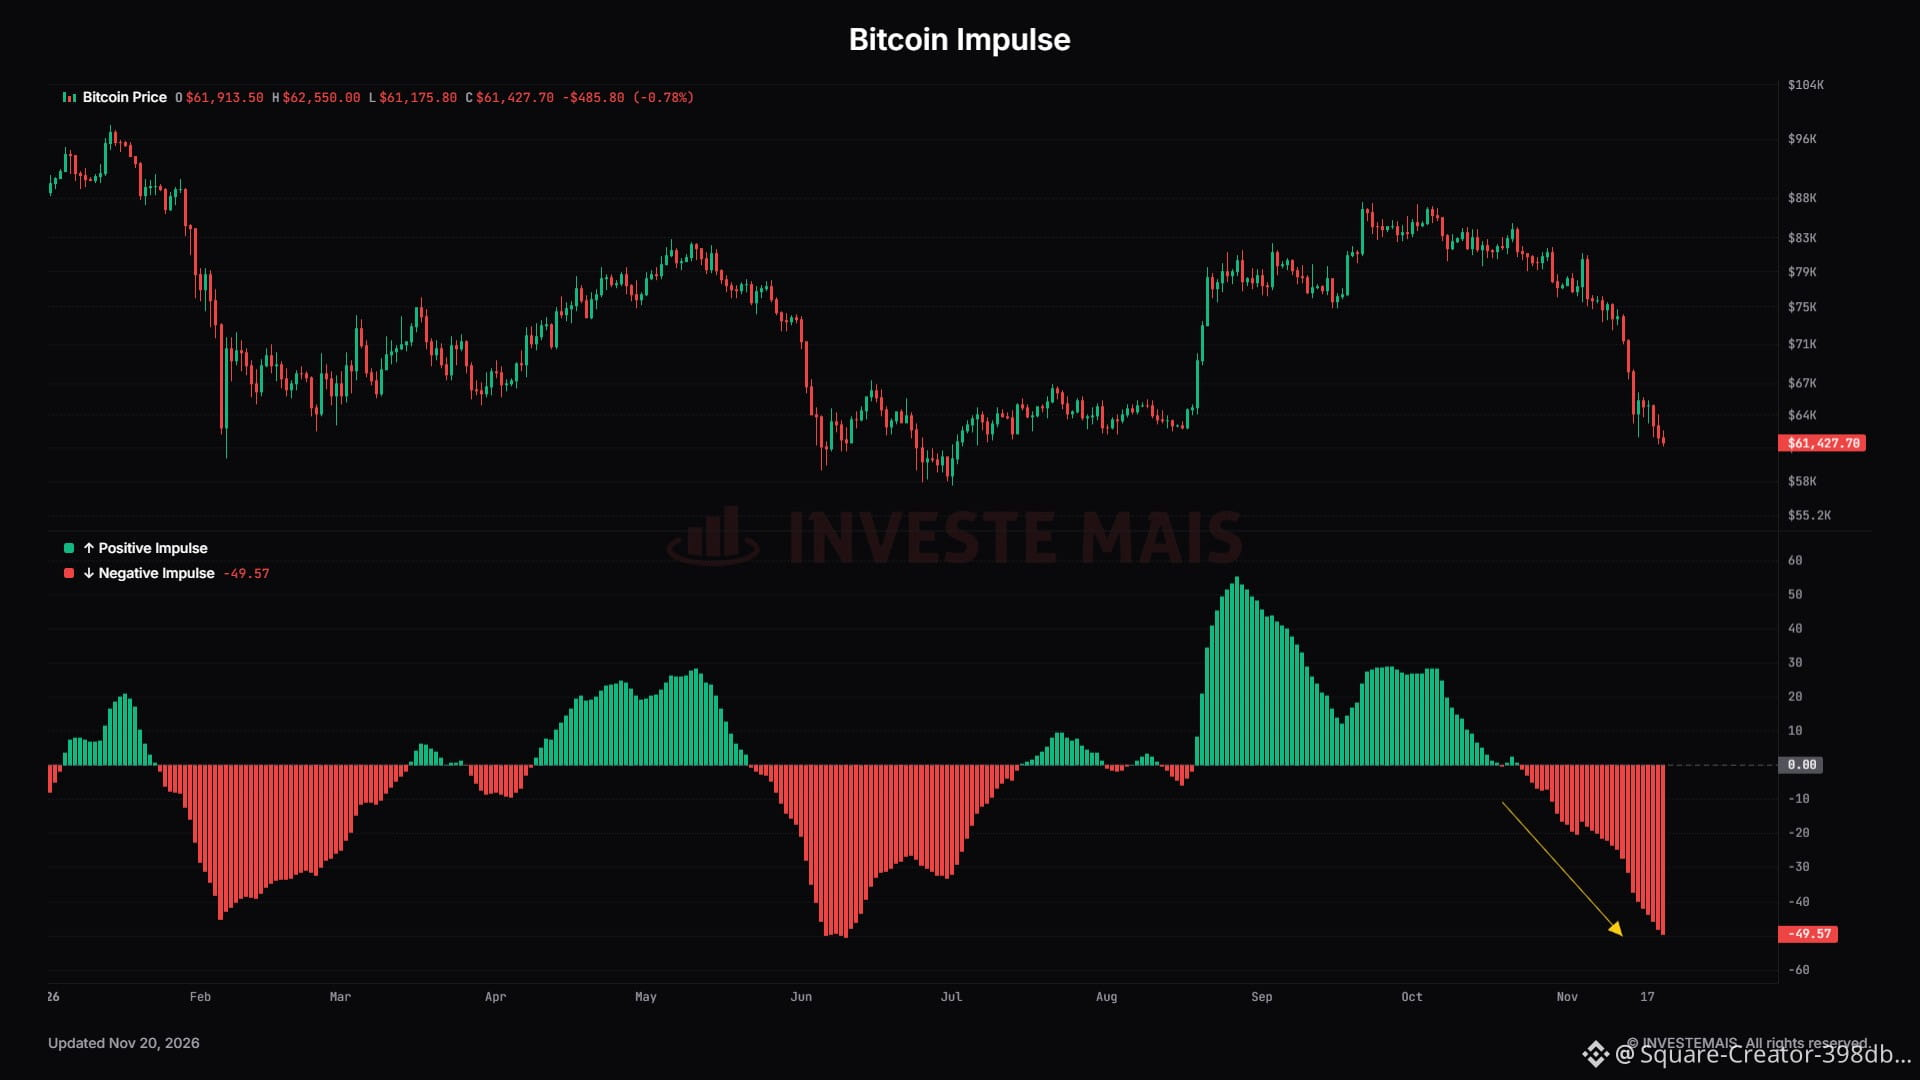
#Bitcoin Impulse approaches the year's low #BTC Price Analysis# #Macro Insights# #TechnicalAnalysis #BTC $BTC
#Bitcoin Impulse approaches the year's low #BTC Price Analysis# #Macro Insights# #TechnicalAnalysis #BTC $BTC
83
Übersetzung ansehen
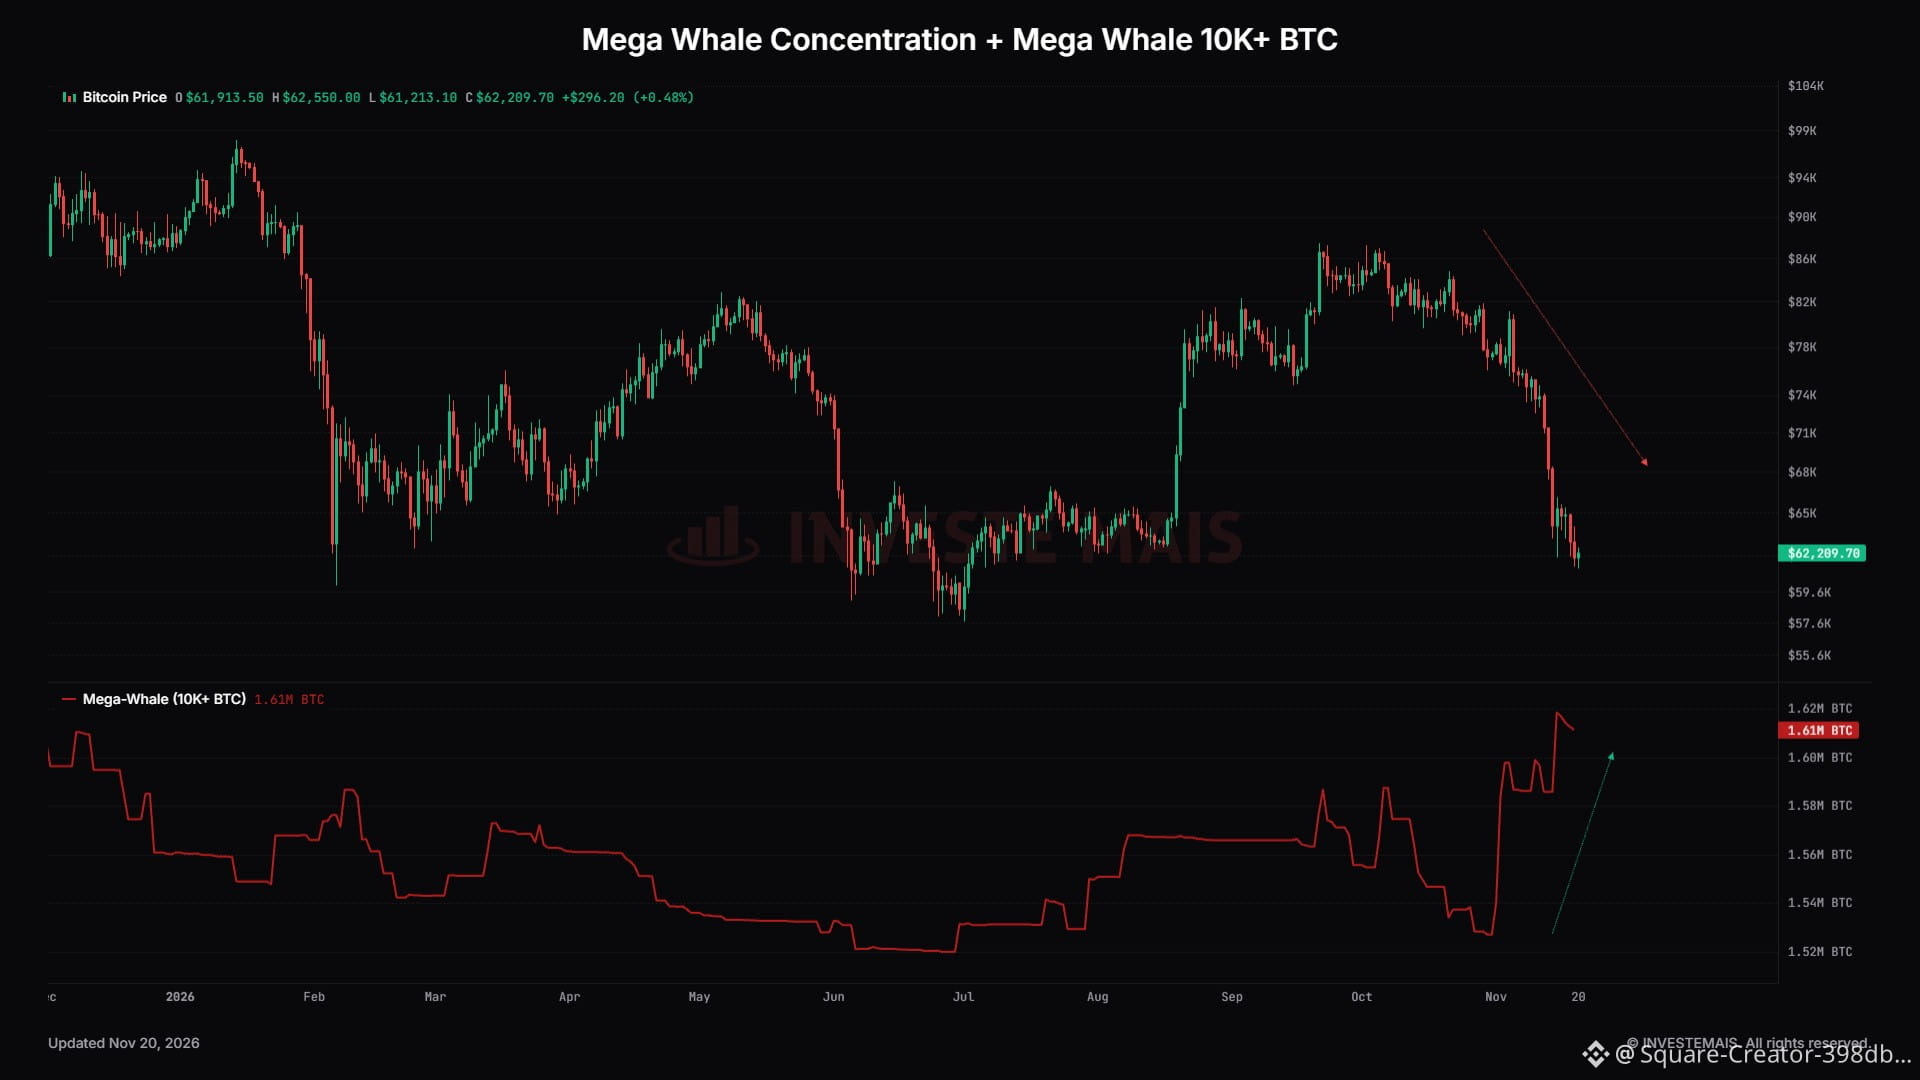
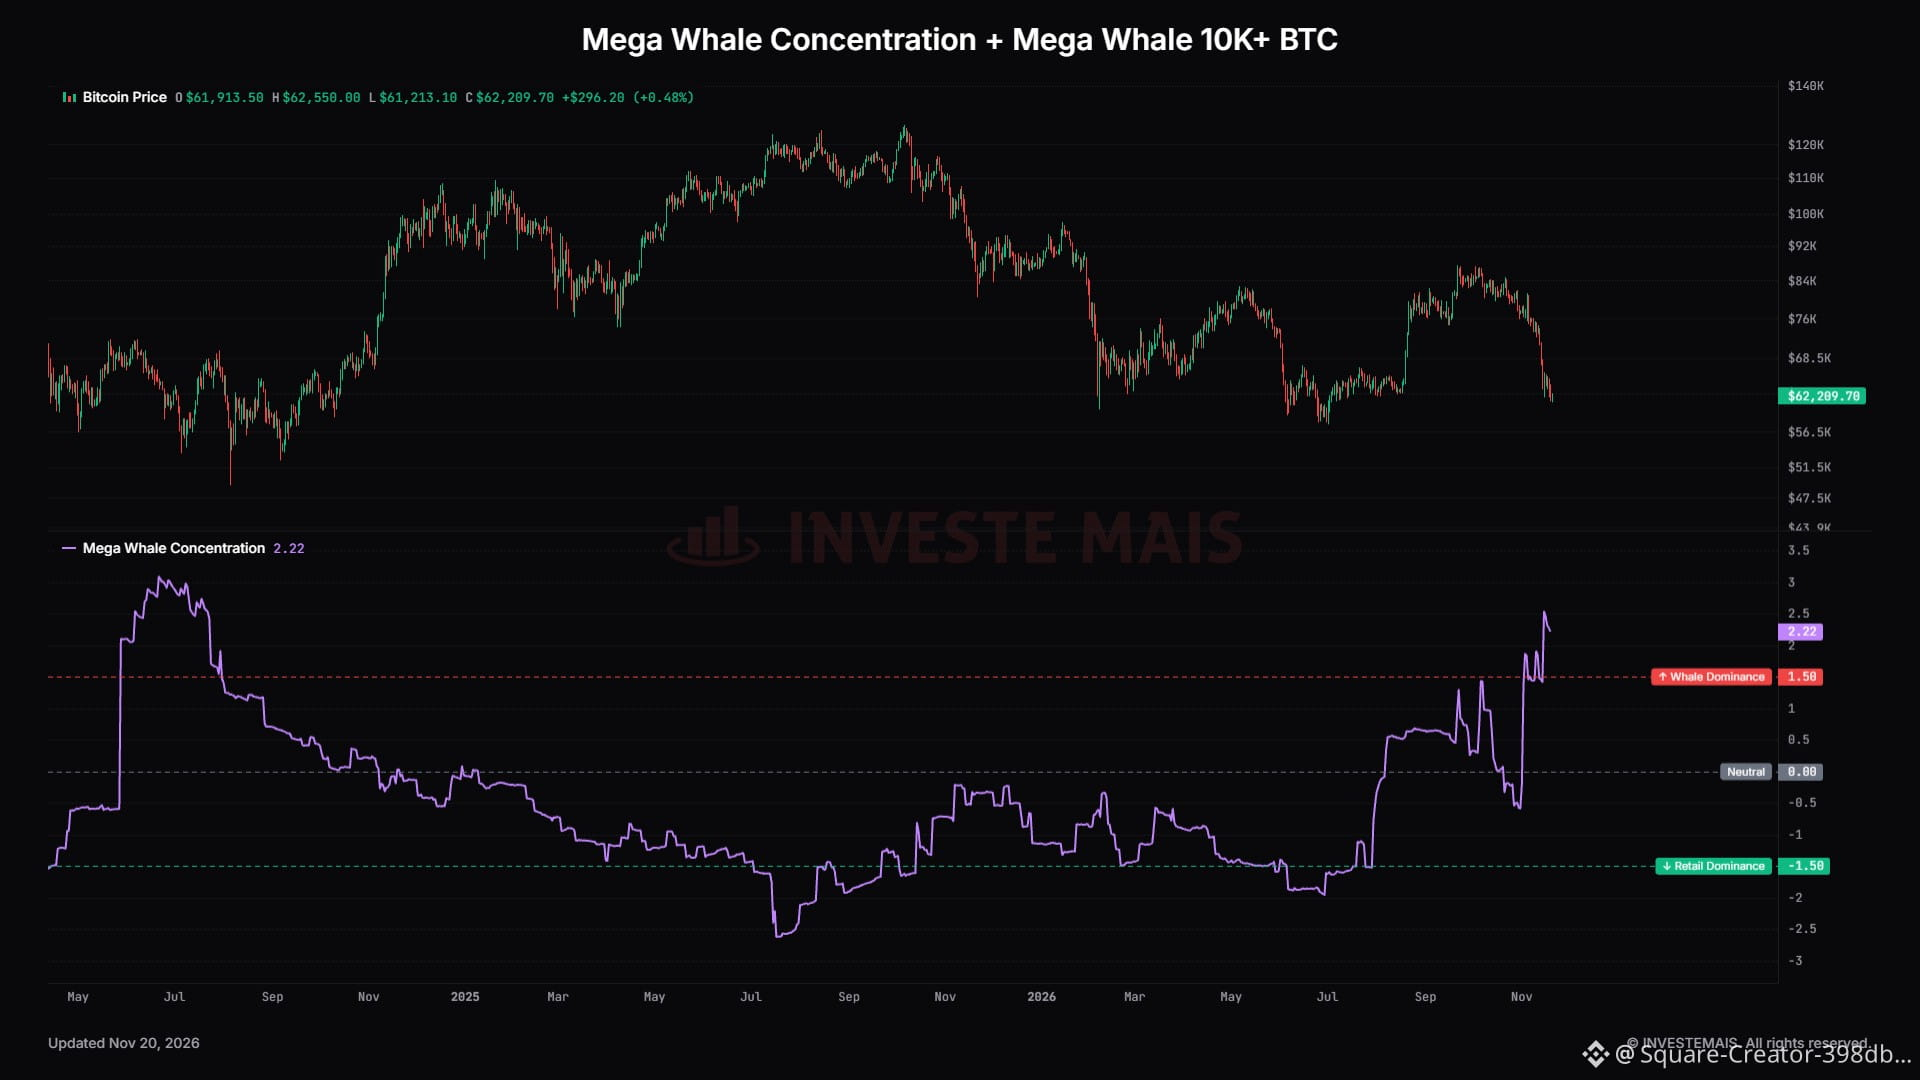
Mega Whales🐳 (10K+ BTC) have accumulated 80,000 #Bitcoin over past 18 days.
A 6% increase in supply absorbed by these holders since the beginning of month — while #BTC price drops -20% over that period. While retail investors sell with fear. Whales buy and dominate the market. #BTC Price Analysis# #Macro Insights# #WhaleAlert $BTC
Mega Whales🐳 (10K+ BTC) have accumulated 80,000 #Bitcoin over past 18 days.
A 6% increase in supply absorbed by these holders since the beginning of month — while #BTC price drops -20% over that period. While retail investors sell with fear. Whales buy and dominate the market. #BTC Price Analysis# #Macro Insights# #WhaleAlert $BTC
A 6% increase in supply absorbed by these holders since the beginning of month — while #BTC price drops -20% over that period. While retail investors sell with fear. Whales buy and dominate the market. #BTC Price Analysis# #Macro Insights# #WhaleAlert $BTC
71
Übersetzung ansehen
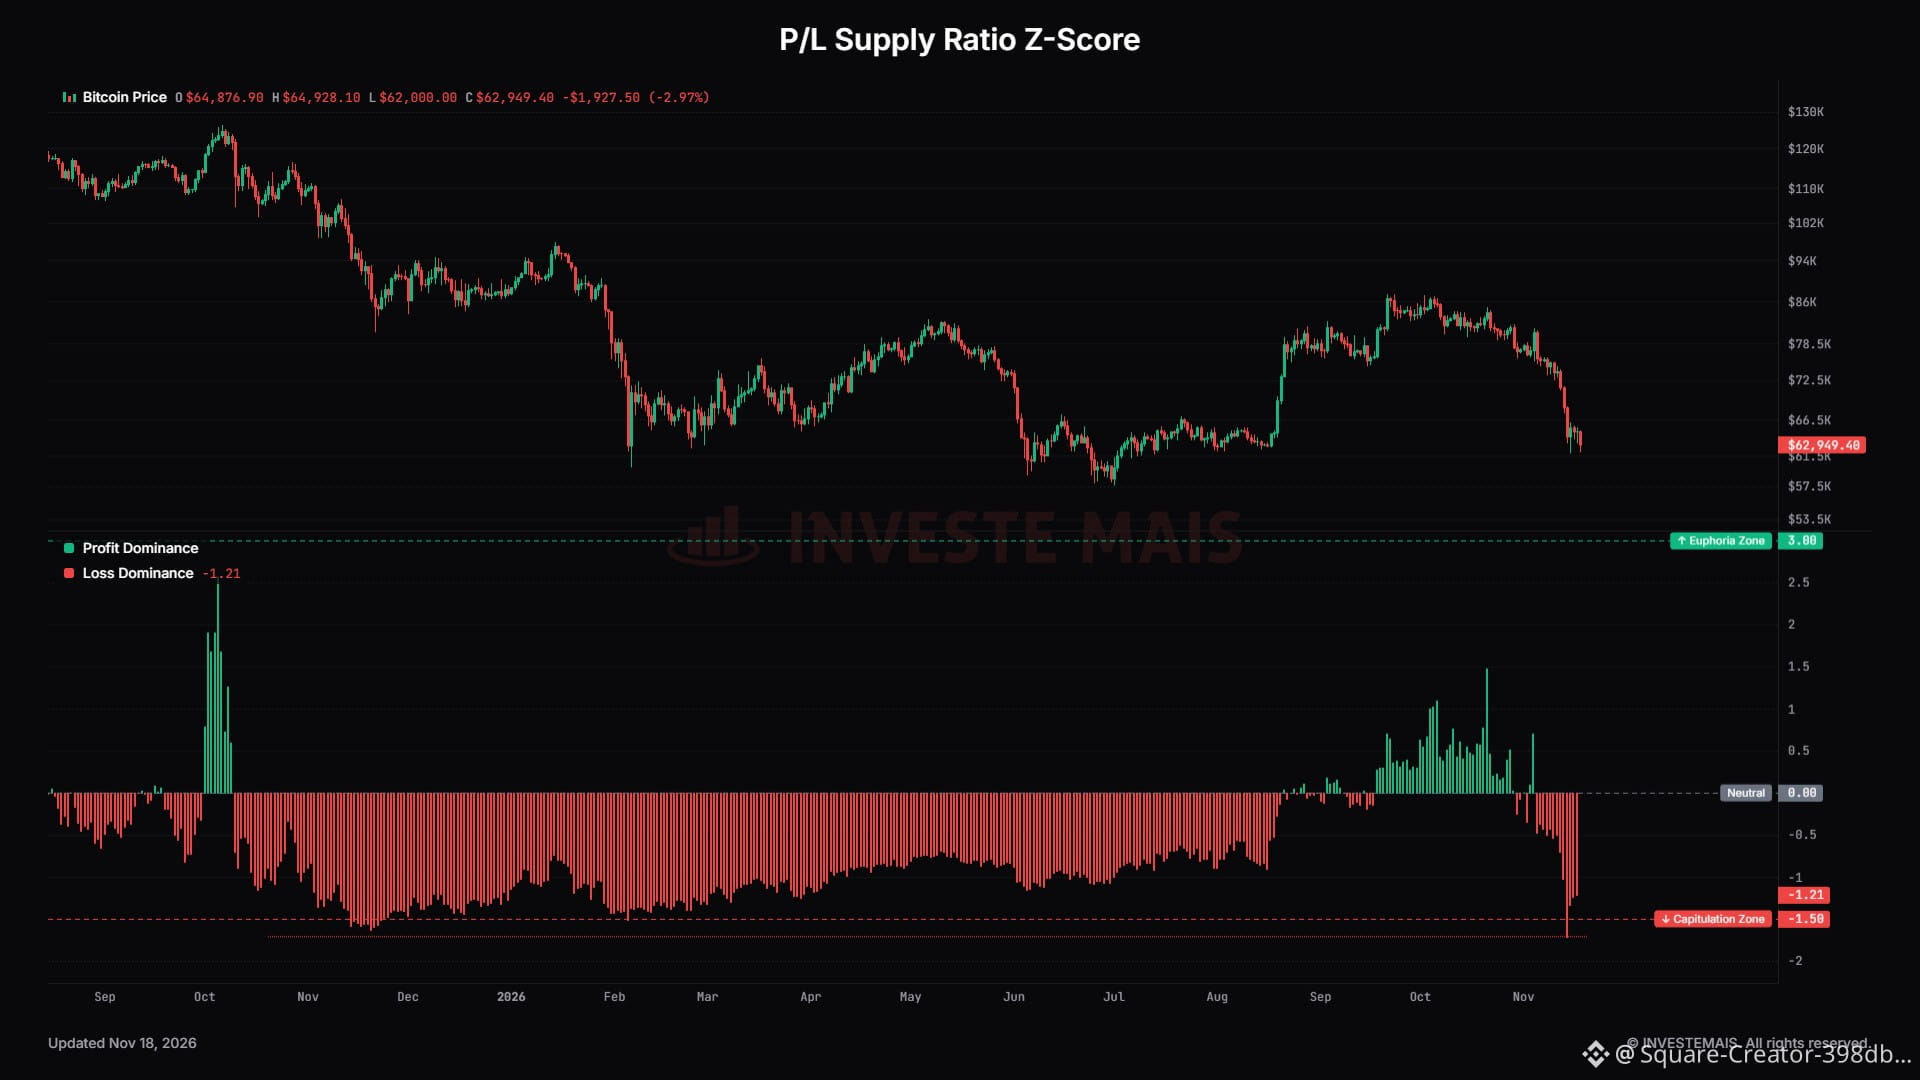
P/L Supply Ratio Z-Score #Bitcoin hits Capitulation🟥 zone
The indicator hit a new low for year #BTC Price Analysis# #Macro Insights# #BTC #OnChainAnalysis $BTC
P/L Supply Ratio Z-Score #Bitcoin hits Capitulation🟥 zone
The indicator hit a new low for year #BTC Price Analysis# #Macro Insights# #BTC #OnChainAnalysis $BTC
The indicator hit a new low for year #BTC Price Analysis# #Macro Insights# #BTC #OnChainAnalysis $BTC
76
Übersetzung ansehen
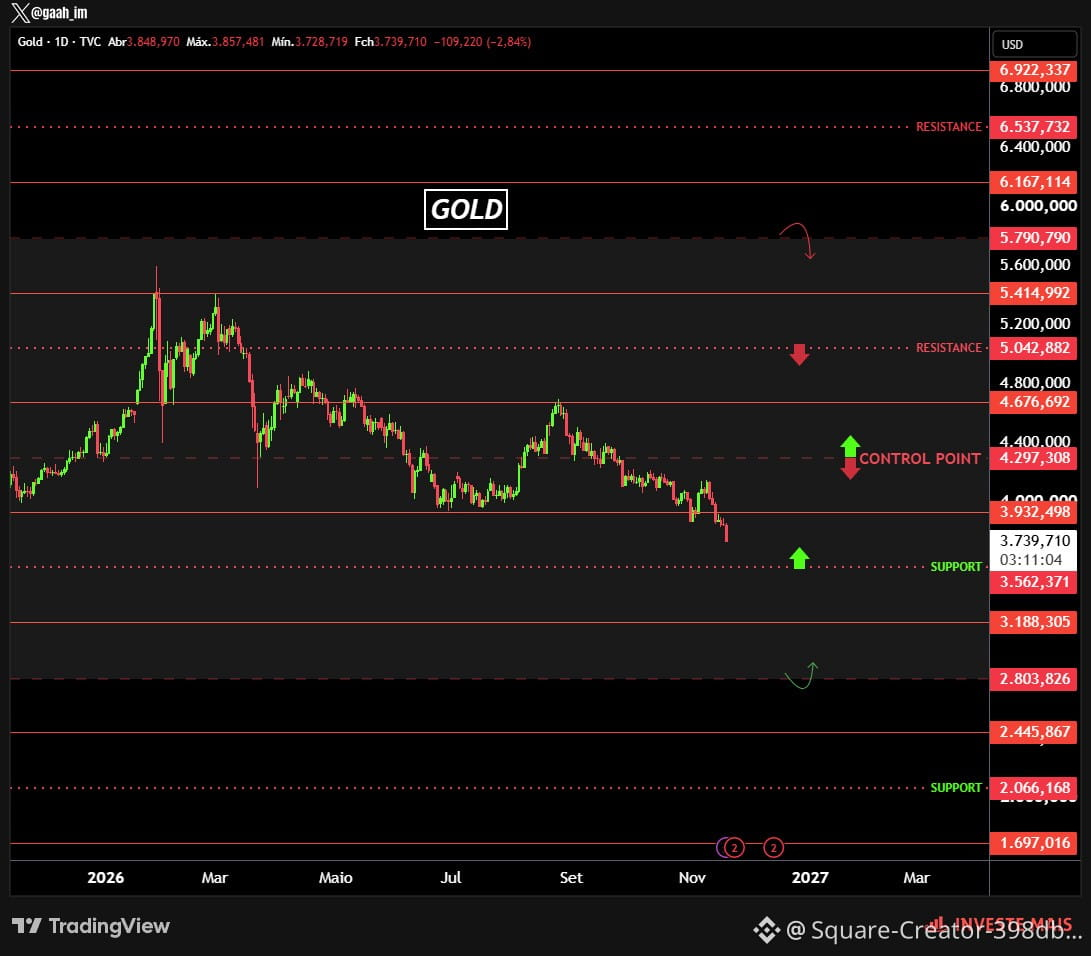
$GOLD has entered the support channel — the area where I want to start building a Long position. #Macro #Macro Insights# #MacroInsights #Gold
$GOLD has entered the support channel — the area where I want to start building a Long position. #Macro #Macro Insights# #MacroInsights #Gold
258
Übersetzung ansehen
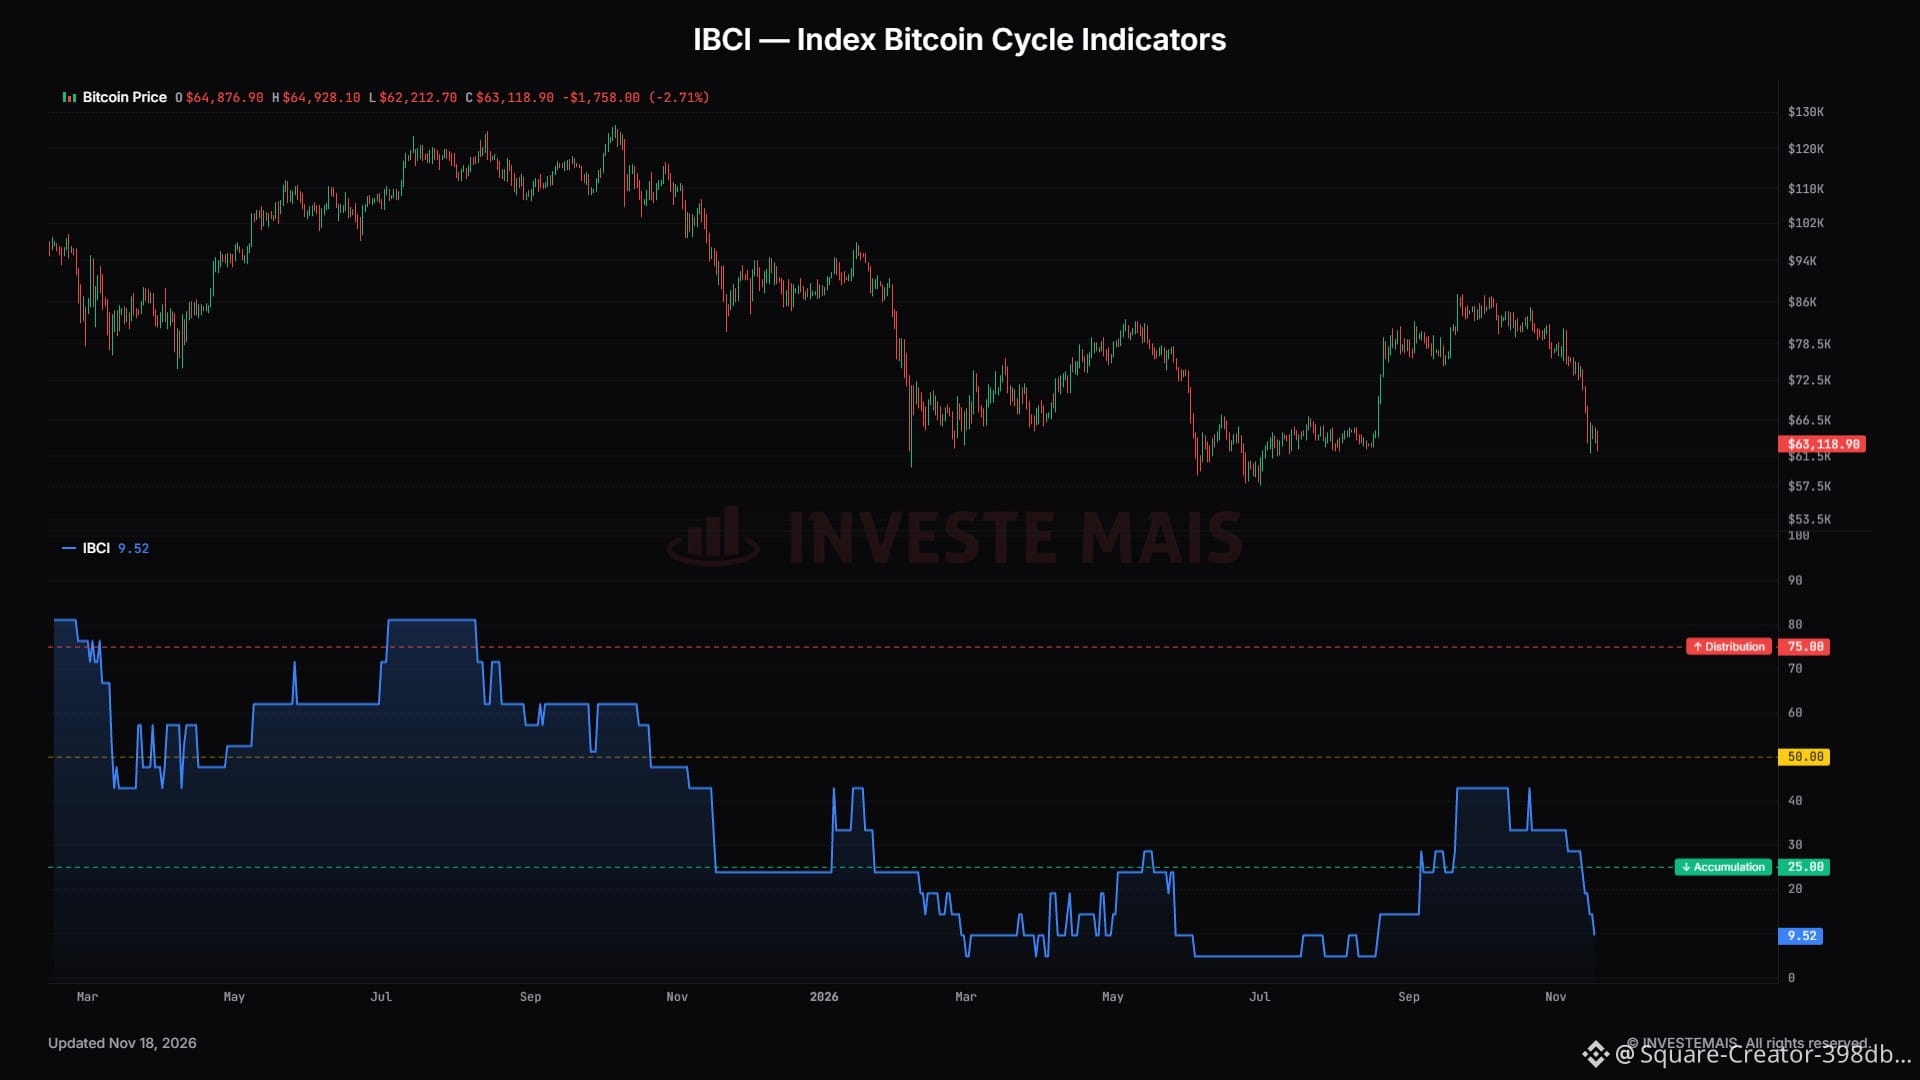
IBCI Daily drops to 9.52 points 🟩
Lowest level in 3 months
#Bitcoin price $62k #BTC Price Analysis# #Macro Insights# #OnChainAnalysis $BTC #BTC
IBCI Daily drops to 9.52 points 🟩
Lowest level in 3 months
#Bitcoin price $62k #BTC Price Analysis# #Macro Insights# #OnChainAnalysis $BTC #BTC
Lowest level in 3 months
#Bitcoin price $62k #BTC Price Analysis# #Macro Insights# #OnChainAnalysis $BTC #BTC
39
Übersetzung ansehen
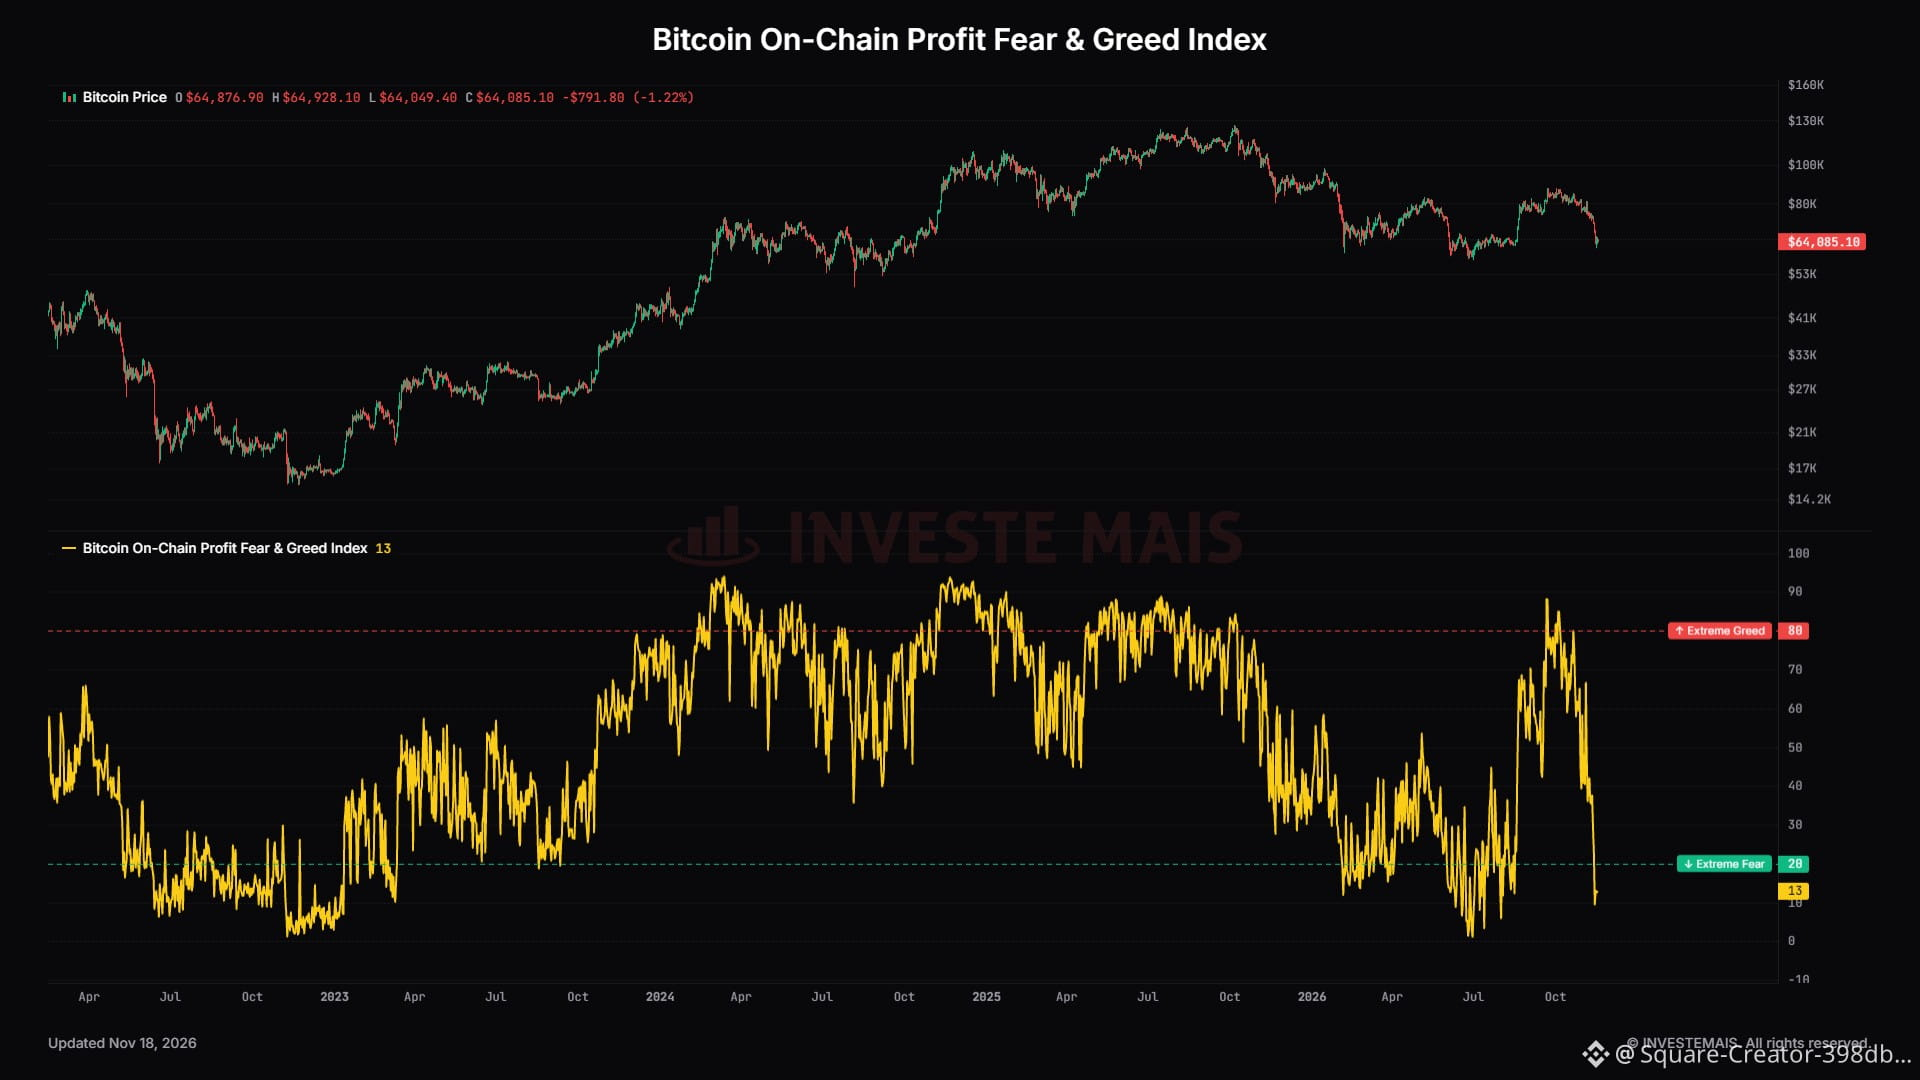
#Bitcoin On-Chain Profit Fear & Greed Index returns to the Extreme Fear🟩 zone
This is the lowest reading in 92 days.
These are best times to accumulate #BTC — here we are again with the market offering yet another great opportunity. #BTC Price Analysis# #Macro Insights# #OnChainAnalysis $BTC
#Bitcoin On-Chain Profit Fear & Greed Index returns to the Extreme Fear🟩 zone
This is the lowest reading in 92 days.
These are best times to accumulate #BTC — here we are again with the market offering yet another great opportunity. #BTC Price Analysis# #Macro Insights# #OnChainAnalysis $BTC
This is the lowest reading in 92 days.
These are best times to accumulate #BTC — here we are again with the market offering yet another great opportunity. #BTC Price Analysis# #Macro Insights# #OnChainAnalysis $BTC
61
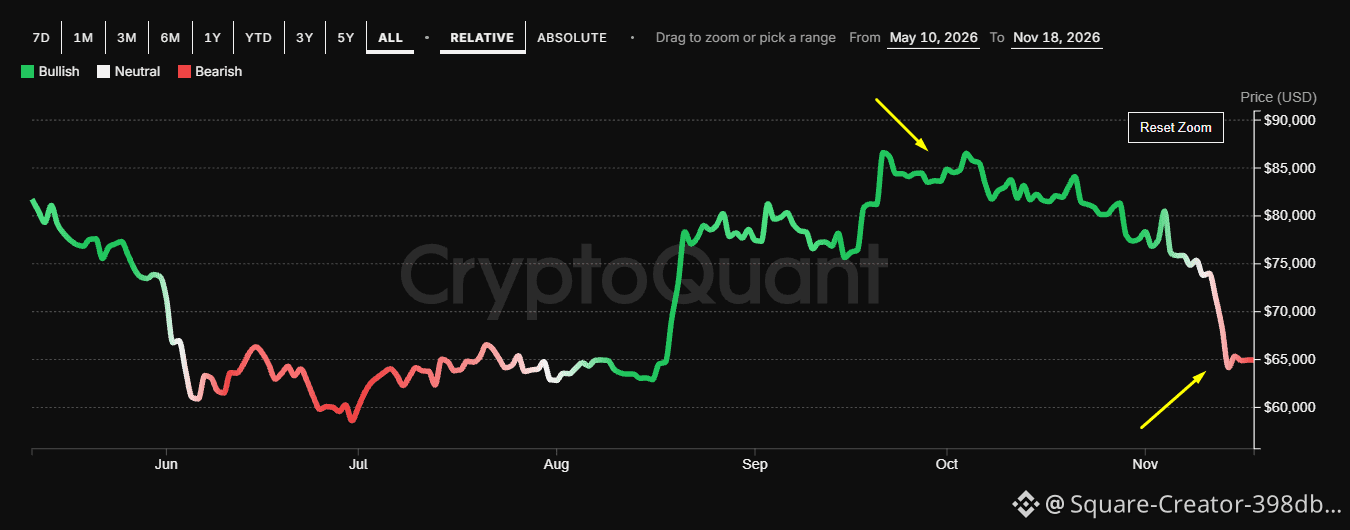
Die meisten Analysten waren extrem bullish, als der #BTC-Preis über 80.000 $ lag, und jetzt sind sie bearish?
Viele große Accounts verhalten sich wie Sardinen, weshalb die Herde ihnen folgt.
Du kannst die Stimmung von Analysten aus aller Welt in Echtzeit verfolgen. #BTC-Preisanalyse# #Makro-Einblicke# #Bitcoin $BTC
https://consensus.cryptoquant.com/consensus/btc
Die meisten Analysten waren extrem bullish, als der #BTC-Preis über 80.000 $ lag, und jetzt sind sie bearish?
Viele große Accounts verhalten sich wie Sardinen, weshalb die Herde ihnen folgt.
Du kannst die Stimmung von Analysten aus aller Welt in Echtzeit verfolgen. #BTC-Preisanalyse# #Makro-Einblicke# #Bitcoin $BTC
https://consensus.cryptoquant.com/consensus/btc
Viele große Accounts verhalten sich wie Sardinen, weshalb die Herde ihnen folgt.
Du kannst die Stimmung von Analysten aus aller Welt in Echtzeit verfolgen. #BTC-Preisanalyse# #Makro-Einblicke# #Bitcoin $BTC
https://consensus.cryptoquant.com/consensus/btc
95
Übersetzung ansehen
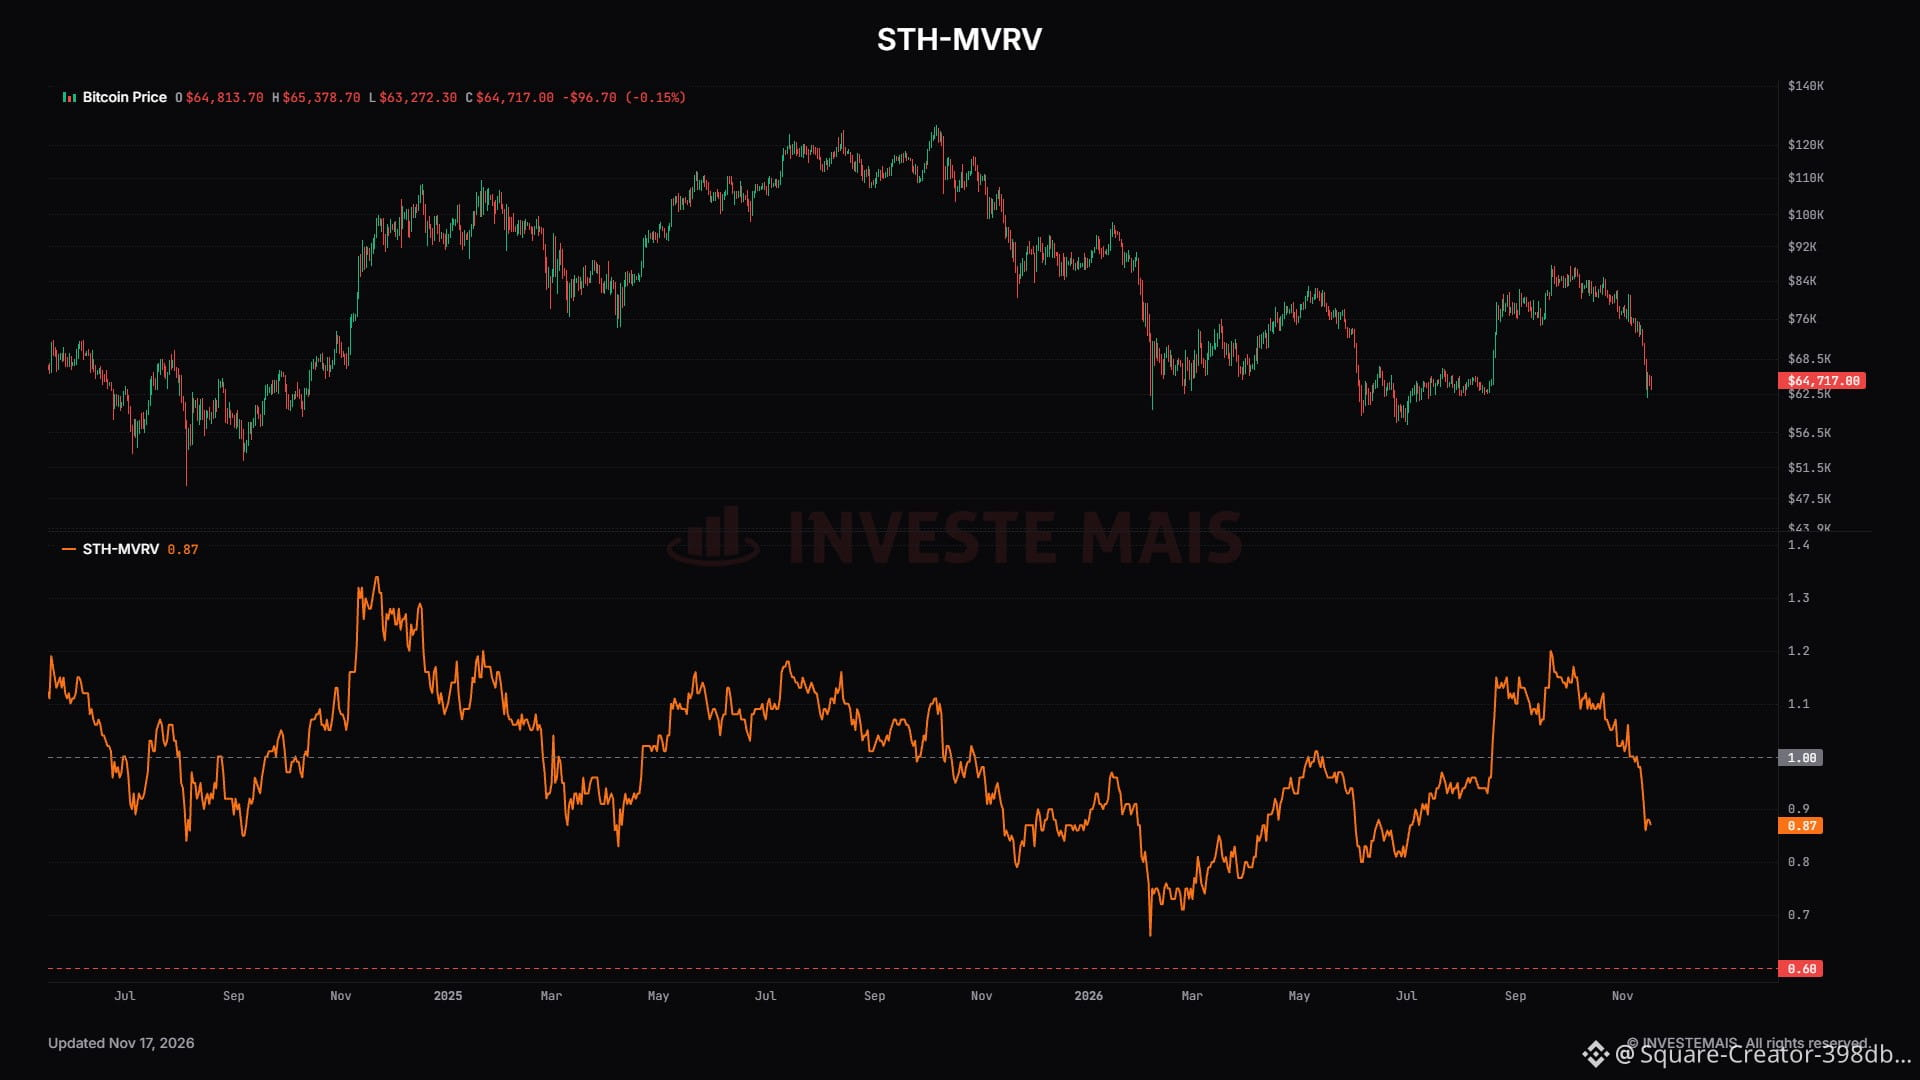
Short-term holders #Bitcoin are the ones under pressure
The stress is concentrated in recent buyers.
STH MVRV, the ratio between price and the average cost of coins moved in last 155 days, fell to 0.86 — #BTC price is about 14% below the short-term holder cost basis, which sits near $74,500.
In February, at the most acute point of this year's correction, the same ratio reached 0.66. #BTC Price Analysis# #Macro Insights# #OnChainAnalysis $BTC
Short-term holders #Bitcoin are the ones under pressure
The stress is concentrated in recent buyers.
STH MVRV, the ratio between price and the average cost of coins moved in last 155 days, fell to 0.86 — #BTC price is about 14% below the short-term holder cost basis, which sits near $74,500.
In February, at the most acute point of this year's correction, the same ratio reached 0.66. #BTC Price Analysis# #Macro Insights# #OnChainAnalysis $BTC
The stress is concentrated in recent buyers.
STH MVRV, the ratio between price and the average cost of coins moved in last 155 days, fell to 0.86 — #BTC price is about 14% below the short-term holder cost basis, which sits near $74,500.
In February, at the most acute point of this year's correction, the same ratio reached 0.66. #BTC Price Analysis# #Macro Insights# #OnChainAnalysis $BTC
14
Übersetzung ansehen
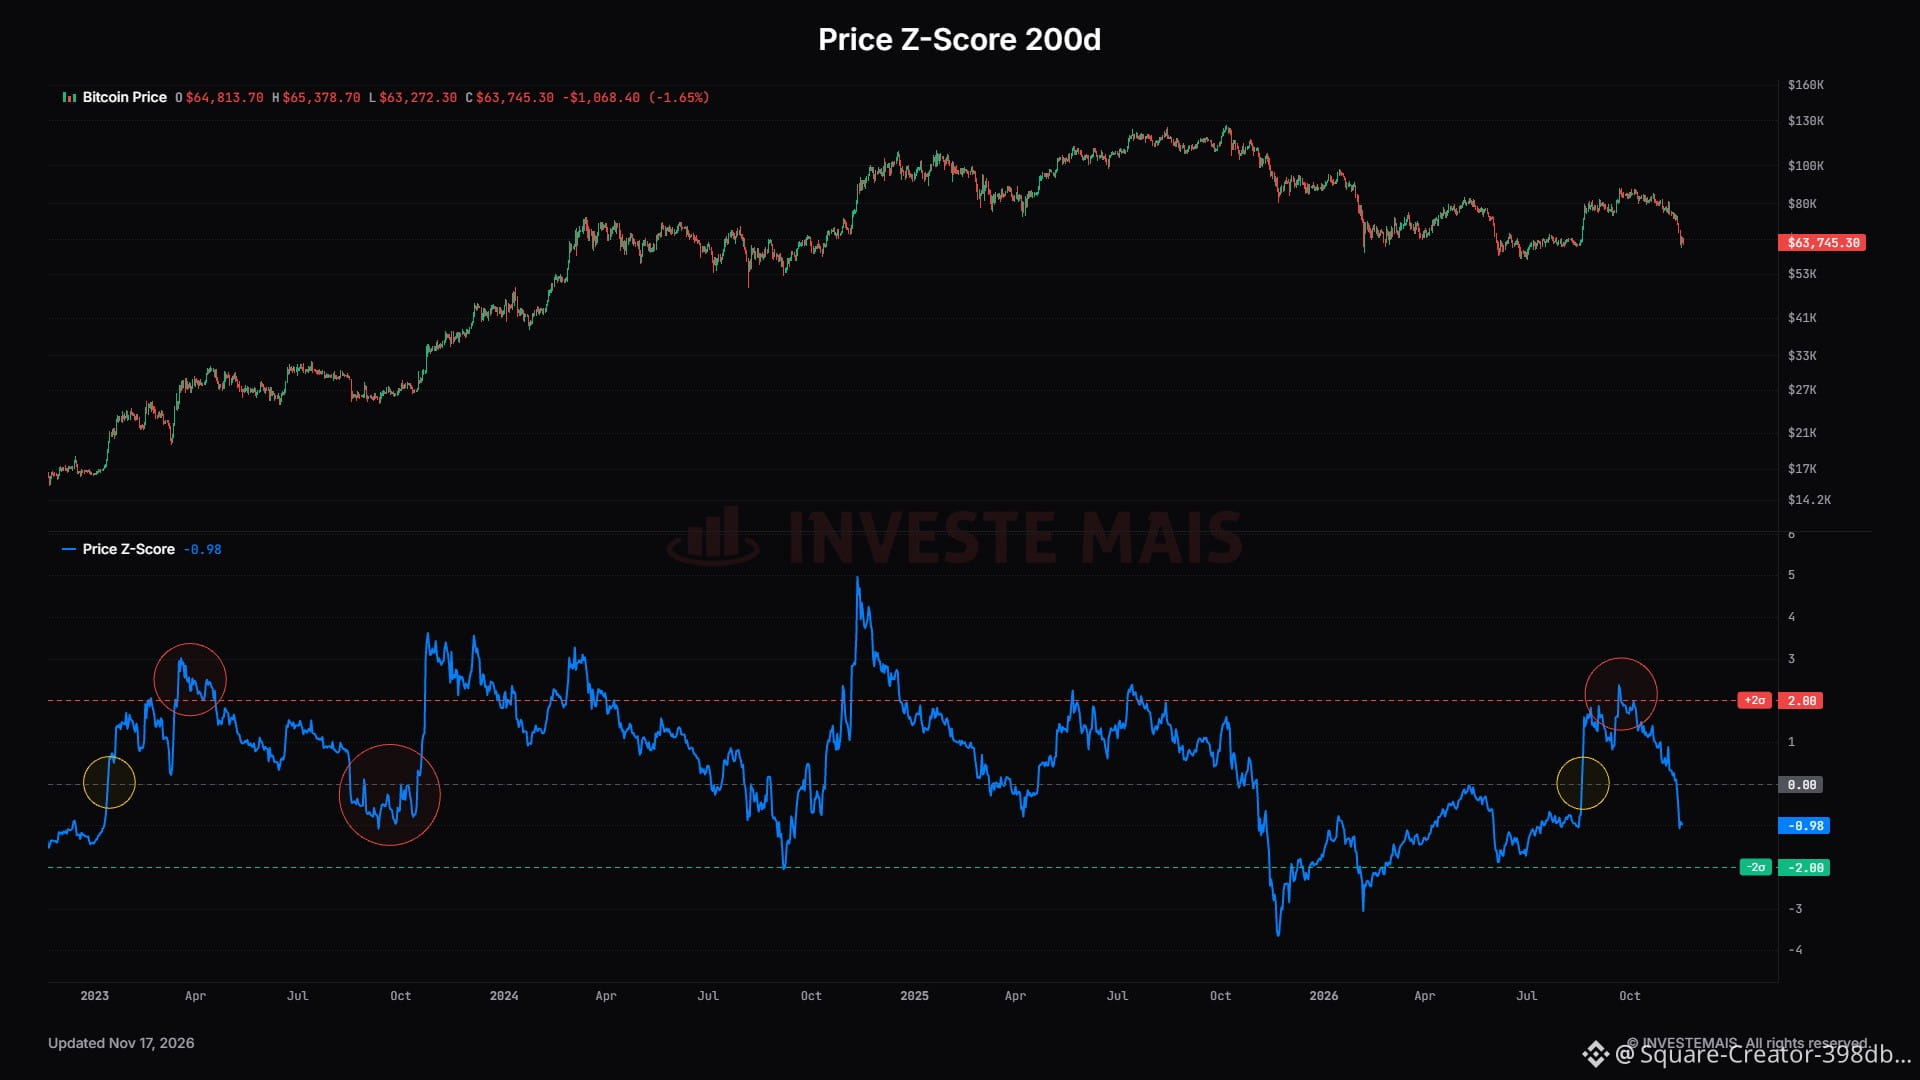
We're here #Bitcoin #BTC Price Analysis# #Macro Insights# #TechnicalAnalysis #BTC $BTC
We're here #Bitcoin #BTC Price Analysis# #Macro Insights# #TechnicalAnalysis #BTC $BTC
60
Anmelden und weiter Inhalte entdecken
Krypto-Nutzer weltweit auf Binance Square kennenlernen
⚡️ Bleib in Sachen Krypto stets am Puls.
💬 Die weltgrößte Kryptobörse vertraut darauf.
👍 Erhalte verlässliche Einblicke von verifizierten Creators.
E-Mail-Adresse/Telefonnummer
Trendthemen
BTCReboundsAbove$60KAmidWhaleDipBuying
15 Aufrufe
3 Kommentare
Abraxas Capital und andere Großanleger kaufen den BTC-Kursrückgang, während Bitcoin kurzzeitig wieder 60.000 US-Dollar erreicht
Binance News
·0 Likes
·176 Aufrufe
NvidiaLoses$2.7TrillionInMonthAndAHalf
33,215 Aufrufe
172 Kommentare
GlobalStocksFaceLongestLosingStreakSince2023
345,195 Aufrufe
2,226 Kommentare