
ChFarooq11
10 Beiträge

ChFarooq11
Melden
Nutzer blockieren
2 Following
15 Follower
13 Like gegeben
Beiträge
·
--
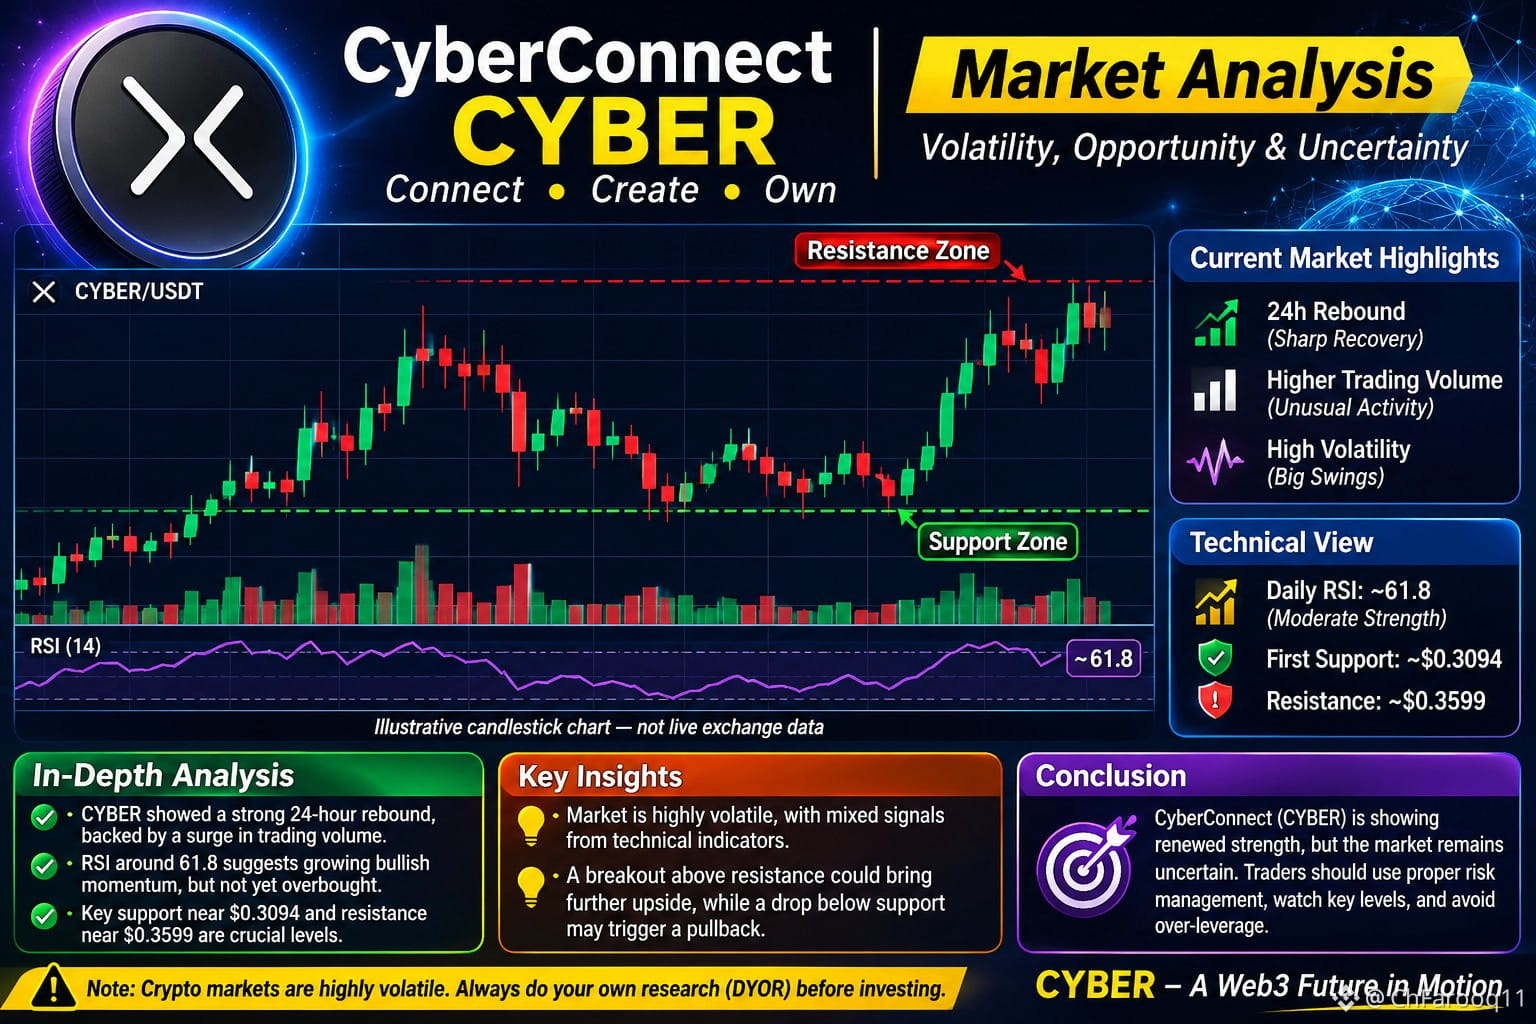
$CYBER CyberConnect (CYBER) Coin – Detaillierte Marktanalyse
CyberConnect (CYBER) ist eine Kryptowährung, die mit einem dezentralen Ökosystem für soziale Netzwerke verbunden ist. Die Technologie konzentriert sich auf digitale Identität, soziale Verbindungen, Web3-Anwendungen und nutzereigene Daten.
Der CYBER-Token ist mit der Governance und den Netzwerkaktivitäten des Ökosystems verknüpft.
2. Aktueller Marktüberblick
Laut den am 6. November 2026 verfügbaren Marktdaten:
Kennzahl Gemeldeter Wert
CYBER-Preis Etwa 0,34–0,36 $.
24-Stunden-Veränderung Stark positiv
24-Stunden-Volumen Erhöht
Täglicher RSI 61,8
Erste Unterstützung 0,3094 $
Erster Widerstand 0,3599 $
Langer unterer Docht: Käufer griffen ein, nachdem die Kurse gefallen waren.
Hohes Volumen: Weist auf eine erhöhte Marktaktivität hin.
Die oben dargestellte CYBER-Infografik ist beispielhaft und kein Live-Börsenchart.
4. Technische Analyse
A. Unterstützungsniveaus
0,3094 $ – Erste wichtige Unterstützung.
0,2991 $ – Zweite Unterstützung.
0,2795 $ – Weitere Unterstützung.
B. Widerstandsniveaus
0,3599 $ – Erster Widerstand.
0,3804 $ – Zweiter Widerstand.
0,4097 $ – Dritter Widerstand.
Diese Niveaus sind angegebene technische Bezugspunkte und keine garantierten Kursziele.
C. RSI-Analyse
Die technischen Indikatoren verschiedener Quellen stimmen nicht vollständig überein. Die kurzfristige Dynamik scheint stärker zu sein als der längerfristige Trend.
6. Fundamentale Faktoren
Zu den wichtigen Faktoren, die die längerfristigen Aussichten von CYBER beeinflussen, gehören:
Verbreitung der CyberConnect-Technologie.
Wachstum sozialer Web3-Anwendungen.
Entwickleraktivität und Ausbau des Ökosystems.
Token-Angebot und künftige Token-Freigaben.
Allgemeine Bedingungen am Kryptowährungsmarkt.
CoinGecko meldet eine geplante Token-Freigabe von etwa 511.120 CYBER am 13. November 2026.
{spot}(CYBERUSDT)
#cyber #BinanceReopensWithdrawalsForMoreAssets #AnthropicIPOValuationDoubts #SouthKoreaDelaysCryptoTaxationUntil2029
$CYBER CyberConnect (CYBER) Coin – Detaillierte Marktanalyse
CyberConnect (CYBER) ist eine Kryptowährung, die mit einem dezentralen Ökosystem für soziale Netzwerke verbunden ist. Die Technologie konzentriert sich auf digitale Identität, soziale Verbindungen, Web3-Anwendungen und nutzereigene Daten.
Der CYBER-Token ist mit der Governance und den Netzwerkaktivitäten des Ökosystems verknüpft.
2. Aktueller Marktüberblick
Laut den am 6. November 2026 verfügbaren Marktdaten:
Kennzahl Gemeldeter Wert
CYBER-Preis Etwa 0,34–0,36 $.
24-Stunden-Veränderung Stark positiv
24-Stunden-Volumen Erhöht
Täglicher RSI 61,8
Erste Unterstützung 0,3094 $
Erster Widerstand 0,3599 $
Langer unterer Docht: Käufer griffen ein, nachdem die Kurse gefallen waren.
Hohes Volumen: Weist auf eine erhöhte Marktaktivität hin.
Die oben dargestellte CYBER-Infografik ist beispielhaft und kein Live-Börsenchart.
4. Technische Analyse
A. Unterstützungsniveaus
0,3094 $ – Erste wichtige Unterstützung.
0,2991 $ – Zweite Unterstützung.
0,2795 $ – Weitere Unterstützung.
B. Widerstandsniveaus
0,3599 $ – Erster Widerstand.
0,3804 $ – Zweiter Widerstand.
0,4097 $ – Dritter Widerstand.
Diese Niveaus sind angegebene technische Bezugspunkte und keine garantierten Kursziele.
C. RSI-Analyse
Die technischen Indikatoren verschiedener Quellen stimmen nicht vollständig überein. Die kurzfristige Dynamik scheint stärker zu sein als der längerfristige Trend.
6. Fundamentale Faktoren
Zu den wichtigen Faktoren, die die längerfristigen Aussichten von CYBER beeinflussen, gehören:
Verbreitung der CyberConnect-Technologie.
Wachstum sozialer Web3-Anwendungen.
Entwickleraktivität und Ausbau des Ökosystems.
Token-Angebot und künftige Token-Freigaben.
Allgemeine Bedingungen am Kryptowährungsmarkt.
CoinGecko meldet eine geplante Token-Freigabe von etwa 511.120 CYBER am 13. November 2026.
#cyber #BinanceReopensWithdrawalsForMoreAssets #AnthropicIPOValuationDoubts #SouthKoreaDelaysCryptoTaxationUntil2029
CyberConnect (CYBER) ist eine Kryptowährung, die mit einem dezentralen Ökosystem für soziale Netzwerke verbunden ist. Die Technologie konzentriert sich auf digitale Identität, soziale Verbindungen, Web3-Anwendungen und nutzereigene Daten.
Der CYBER-Token ist mit der Governance und den Netzwerkaktivitäten des Ökosystems verknüpft.
2. Aktueller Marktüberblick
Laut den am 6. November 2026 verfügbaren Marktdaten:
Kennzahl Gemeldeter Wert
CYBER-Preis Etwa 0,34–0,36 $.
24-Stunden-Veränderung Stark positiv
24-Stunden-Volumen Erhöht
Täglicher RSI 61,8
Erste Unterstützung 0,3094 $
Erster Widerstand 0,3599 $
Langer unterer Docht: Käufer griffen ein, nachdem die Kurse gefallen waren.
Hohes Volumen: Weist auf eine erhöhte Marktaktivität hin.
Die oben dargestellte CYBER-Infografik ist beispielhaft und kein Live-Börsenchart.
4. Technische Analyse
A. Unterstützungsniveaus
0,3094 $ – Erste wichtige Unterstützung.
0,2991 $ – Zweite Unterstützung.
0,2795 $ – Weitere Unterstützung.
B. Widerstandsniveaus
0,3599 $ – Erster Widerstand.
0,3804 $ – Zweiter Widerstand.
0,4097 $ – Dritter Widerstand.
Diese Niveaus sind angegebene technische Bezugspunkte und keine garantierten Kursziele.
C. RSI-Analyse
Die technischen Indikatoren verschiedener Quellen stimmen nicht vollständig überein. Die kurzfristige Dynamik scheint stärker zu sein als der längerfristige Trend.
6. Fundamentale Faktoren
Zu den wichtigen Faktoren, die die längerfristigen Aussichten von CYBER beeinflussen, gehören:
Verbreitung der CyberConnect-Technologie.
Wachstum sozialer Web3-Anwendungen.
Entwickleraktivität und Ausbau des Ökosystems.
Token-Angebot und künftige Token-Freigaben.
Allgemeine Bedingungen am Kryptowährungsmarkt.
CoinGecko meldet eine geplante Token-Freigabe von etwa 511.120 CYBER am 13. November 2026.
#cyber #BinanceReopensWithdrawalsForMoreAssets #AnthropicIPOValuationDoubts #SouthKoreaDelaysCryptoTaxationUntil2029
86
·
--
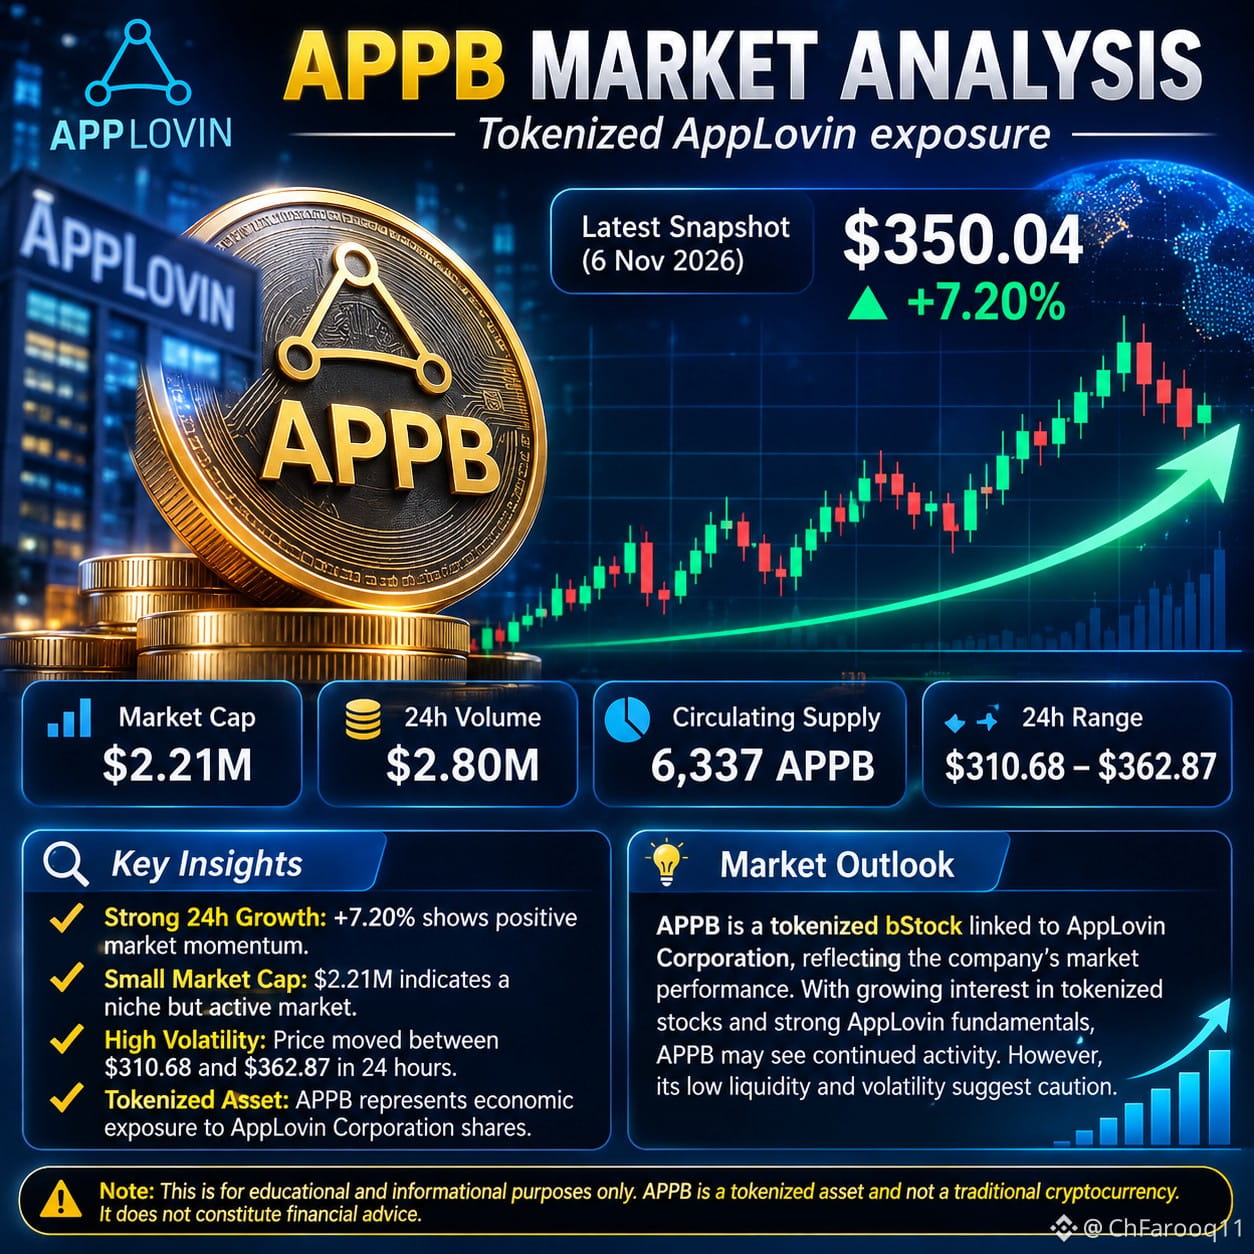
$APPB (AppLovin Corp Tokenized bStocks) ist ein tokenisierter Vermögenswert, der ein wirtschaftliches Engagement in Aktien der AppLovin Corporation ermöglichen soll. Er unterscheidet sich von einer herkömmlichen Kryptowährung, da sein Wert an eine zugrunde liegende Aktie gekoppelt ist.
Marktübersicht
Laut dem neuesten verfügbaren CoinMarketCap-Snapshot:
Kennzahl Wert
APPB-Preis $350.04
24-Stunden-Änderung +7.20%
Marktkapitalisierung $2.21 Millionen
24-Stunden-Handelsvolumen $2.8 Millionen
Umlaufangebot 6,337 APPB
24-Stunden-Preisspanne $310.68–$362.8
Positive Dynamik: Der gemeldete 24-Stunden-Anstieg deutet auf ein starkes jüngstes Kaufinteresse hin.
Volatilität: Die große tägliche Handelsspanne weist auf erhebliche Preisschwankungen hin.
Widerstand: Das jüngste Hoch von $362.87 ist ein wichtiger Wert, den es zu beobachten gilt.
Unterstützung: Der Bereich um $310.68 ist ein jüngstes Tief, jedoch kein bestätigtes Unterstützungsniveau.
Marktausblick
Die Entwicklung von APPB hängt vom zugrunde liegenden Aktienkurs von AppLovin, der Marktstimmung und der Nachfrage nach tokenisierten Aktien ab. Die relativ geringe Marktkapitalisierung und Handelsliquidität können die Preisvolatilität erhöhen.
Fazit: APPB hat kurzfristig eine positive Dynamik gezeigt, doch die Kursentwicklung bleibt volatil. Der verfügbare Snapshot allein kann keinen anhaltenden Aufwärtstrend belegen.
Hinweis: Dies sind Marktinformationen zu Bildungszwecken und keine Finanzberatung. Preise können sich schnell ändern.
{spot}(APPBUSDT)
#USStocksSlipandCryptoMarketUnderBroadPressure #USStocksSufferSteepestRoutSince2020 #StrategySTRCResumesIssuanceAfterOver170Days #Nasdaq100Tumbles6% #GreekParliamentPasses10%CryptoCapitalGainsTaxBill
$APPB (AppLovin Corp Tokenized bStocks) ist ein tokenisierter Vermögenswert, der ein wirtschaftliches Engagement in Aktien der AppLovin Corporation ermöglichen soll. Er unterscheidet sich von einer herkömmlichen Kryptowährung, da sein Wert an eine zugrunde liegende Aktie gekoppelt ist.
Marktübersicht
Laut dem neuesten verfügbaren CoinMarketCap-Snapshot:
Kennzahl Wert
APPB-Preis $350.04
24-Stunden-Änderung +7.20%
Marktkapitalisierung $2.21 Millionen
24-Stunden-Handelsvolumen $2.8 Millionen
Umlaufangebot 6,337 APPB
24-Stunden-Preisspanne $310.68–$362.8
Positive Dynamik: Der gemeldete 24-Stunden-Anstieg deutet auf ein starkes jüngstes Kaufinteresse hin.
Volatilität: Die große tägliche Handelsspanne weist auf erhebliche Preisschwankungen hin.
Widerstand: Das jüngste Hoch von $362.87 ist ein wichtiger Wert, den es zu beobachten gilt.
Unterstützung: Der Bereich um $310.68 ist ein jüngstes Tief, jedoch kein bestätigtes Unterstützungsniveau.
Marktausblick
Die Entwicklung von APPB hängt vom zugrunde liegenden Aktienkurs von AppLovin, der Marktstimmung und der Nachfrage nach tokenisierten Aktien ab. Die relativ geringe Marktkapitalisierung und Handelsliquidität können die Preisvolatilität erhöhen.
Fazit: APPB hat kurzfristig eine positive Dynamik gezeigt, doch die Kursentwicklung bleibt volatil. Der verfügbare Snapshot allein kann keinen anhaltenden Aufwärtstrend belegen.
Hinweis: Dies sind Marktinformationen zu Bildungszwecken und keine Finanzberatung. Preise können sich schnell ändern.
#USStocksSlipandCryptoMarketUnderBroadPressure #USStocksSufferSteepestRoutSince2020 #StrategySTRCResumesIssuanceAfterOver170Days #Nasdaq100Tumbles6% #GreekParliamentPasses10%CryptoCapitalGainsTaxBill
Marktübersicht
Laut dem neuesten verfügbaren CoinMarketCap-Snapshot:
Kennzahl Wert
APPB-Preis $350.04
24-Stunden-Änderung +7.20%
Marktkapitalisierung $2.21 Millionen
24-Stunden-Handelsvolumen $2.8 Millionen
Umlaufangebot 6,337 APPB
24-Stunden-Preisspanne $310.68–$362.8
Positive Dynamik: Der gemeldete 24-Stunden-Anstieg deutet auf ein starkes jüngstes Kaufinteresse hin.
Volatilität: Die große tägliche Handelsspanne weist auf erhebliche Preisschwankungen hin.
Widerstand: Das jüngste Hoch von $362.87 ist ein wichtiger Wert, den es zu beobachten gilt.
Unterstützung: Der Bereich um $310.68 ist ein jüngstes Tief, jedoch kein bestätigtes Unterstützungsniveau.
Marktausblick
Die Entwicklung von APPB hängt vom zugrunde liegenden Aktienkurs von AppLovin, der Marktstimmung und der Nachfrage nach tokenisierten Aktien ab. Die relativ geringe Marktkapitalisierung und Handelsliquidität können die Preisvolatilität erhöhen.
Fazit: APPB hat kurzfristig eine positive Dynamik gezeigt, doch die Kursentwicklung bleibt volatil. Der verfügbare Snapshot allein kann keinen anhaltenden Aufwärtstrend belegen.
Hinweis: Dies sind Marktinformationen zu Bildungszwecken und keine Finanzberatung. Preise können sich schnell ändern.
#USStocksSlipandCryptoMarketUnderBroadPressure #USStocksSufferSteepestRoutSince2020 #StrategySTRCResumesIssuanceAfterOver170Days #Nasdaq100Tumbles6% #GreekParliamentPasses10%CryptoCapitalGainsTaxBill
56
·
--
$ETH
ist eine der weltweit führenden Kryptowährungen. Es handelt sich um eine dezentrale Blockchain-Plattform, die Smart Contracts, dezentrale Anwendungen (DApps) und digitale Finanzdienstleistungen unterstützt.
Aktueller Marktüberblick
Am 6. November 2026 wird Ethereum zu einem Kurs von etwa 2.236–2.240 $ gehandelt und verzeichnete in den vergangenen 24 Stunden einen Rückgang von ungefähr 7,8 %.
Technische Analyse
Markttrend: Kurzfristig rückläufig.
Unterstützungsniveau: Etwa 2.200–2.220 $.
Widerstandsniveau: Etwa 2.279–2.330 $.
Momentum: Der Verkaufsdruck bleibt erhöht.
Marktausblick: Ethereum muss wichtige Widerstandsniveaus zurückerobern, um Anzeichen einer Erholung zu zeigen.
Fazit
Ethereum ist aufgrund seines Blockchain-Ökosystems, seiner Smart Contracts und seiner DeFi-Anwendungen langfristig von großer technologischer Bedeutung. Die aktuellen Marktbedingungen zeigen jedoch Schwäche und eine hohe Volatilität. Die künftige Entwicklung wird von der Marktnachfrage, der Anlegerstimmung, der Netzwerkentwicklung und den globalen wirtschaftlichen Bedingungen abhängen.
Wichtig: Dies ist eine informative Marktanalyse und keine Finanzberatung. Kryptowährungskurse können sich schnell ändern.
{spot}(ETHUSDT)
#AnthropicIPOValuationDoubts #USStocksSlipandCryptoMarketUnderBroadPressure #BinanceReopensWithdrawalsForMoreAssets #USStocksSufferSteepestRoutSince2020 #StrategySTRCResumesIssuanceAfterOver170Days
$ETH
ist eine der weltweit führenden Kryptowährungen. Es handelt sich um eine dezentrale Blockchain-Plattform, die Smart Contracts, dezentrale Anwendungen (DApps) und digitale Finanzdienstleistungen unterstützt.
Aktueller Marktüberblick
Am 6. November 2026 wird Ethereum zu einem Kurs von etwa 2.236–2.240 $ gehandelt und verzeichnete in den vergangenen 24 Stunden einen Rückgang von ungefähr 7,8 %.
Technische Analyse
Markttrend: Kurzfristig rückläufig.
Unterstützungsniveau: Etwa 2.200–2.220 $.
Widerstandsniveau: Etwa 2.279–2.330 $.
Momentum: Der Verkaufsdruck bleibt erhöht.
Marktausblick: Ethereum muss wichtige Widerstandsniveaus zurückerobern, um Anzeichen einer Erholung zu zeigen.
Fazit
Ethereum ist aufgrund seines Blockchain-Ökosystems, seiner Smart Contracts und seiner DeFi-Anwendungen langfristig von großer technologischer Bedeutung. Die aktuellen Marktbedingungen zeigen jedoch Schwäche und eine hohe Volatilität. Die künftige Entwicklung wird von der Marktnachfrage, der Anlegerstimmung, der Netzwerkentwicklung und den globalen wirtschaftlichen Bedingungen abhängen.
Wichtig: Dies ist eine informative Marktanalyse und keine Finanzberatung. Kryptowährungskurse können sich schnell ändern.
#AnthropicIPOValuationDoubts #USStocksSlipandCryptoMarketUnderBroadPressure #BinanceReopensWithdrawalsForMoreAssets #USStocksSufferSteepestRoutSince2020 #StrategySTRCResumesIssuanceAfterOver170Days
ist eine der weltweit führenden Kryptowährungen. Es handelt sich um eine dezentrale Blockchain-Plattform, die Smart Contracts, dezentrale Anwendungen (DApps) und digitale Finanzdienstleistungen unterstützt.
Aktueller Marktüberblick
Am 6. November 2026 wird Ethereum zu einem Kurs von etwa 2.236–2.240 $ gehandelt und verzeichnete in den vergangenen 24 Stunden einen Rückgang von ungefähr 7,8 %.
Technische Analyse
Markttrend: Kurzfristig rückläufig.
Unterstützungsniveau: Etwa 2.200–2.220 $.
Widerstandsniveau: Etwa 2.279–2.330 $.
Momentum: Der Verkaufsdruck bleibt erhöht.
Marktausblick: Ethereum muss wichtige Widerstandsniveaus zurückerobern, um Anzeichen einer Erholung zu zeigen.
Fazit
Ethereum ist aufgrund seines Blockchain-Ökosystems, seiner Smart Contracts und seiner DeFi-Anwendungen langfristig von großer technologischer Bedeutung. Die aktuellen Marktbedingungen zeigen jedoch Schwäche und eine hohe Volatilität. Die künftige Entwicklung wird von der Marktnachfrage, der Anlegerstimmung, der Netzwerkentwicklung und den globalen wirtschaftlichen Bedingungen abhängen.
Wichtig: Dies ist eine informative Marktanalyse und keine Finanzberatung. Kryptowährungskurse können sich schnell ändern.
#AnthropicIPOValuationDoubts #USStocksSlipandCryptoMarketUnderBroadPressure #BinanceReopensWithdrawalsForMoreAssets #USStocksSufferSteepestRoutSince2020 #StrategySTRCResumesIssuanceAfterOver170Days

81
·
--
Übersetzung ansehen
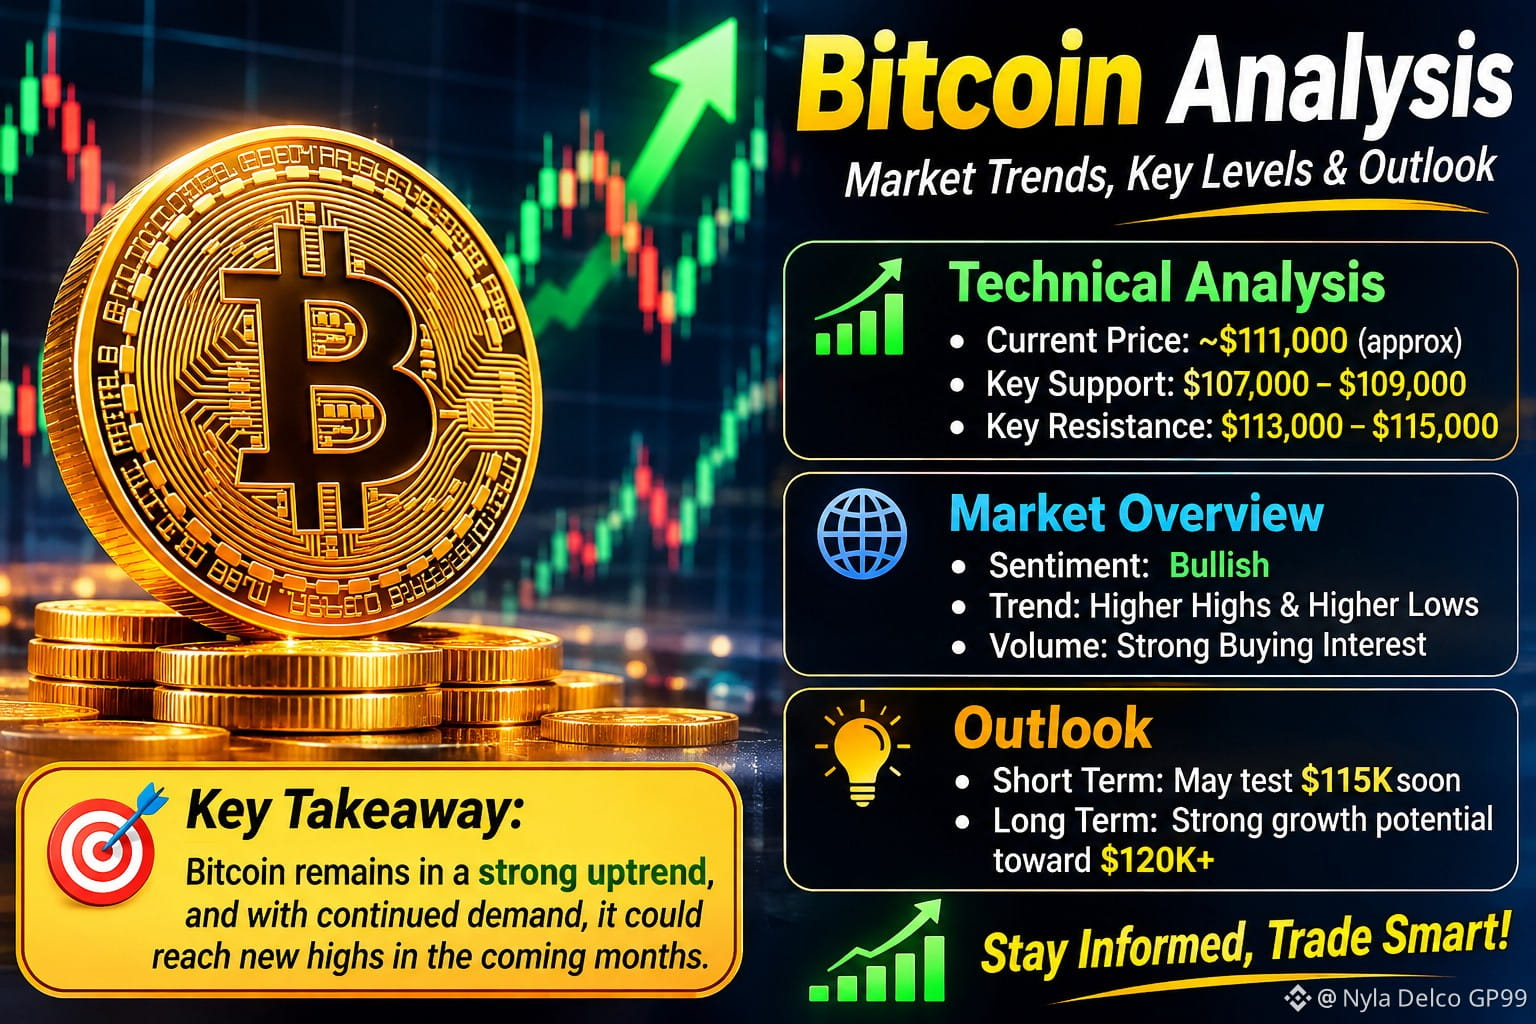
$BTC is the world's leading cryptocurrency. Its price is influenced by market demand, investor sentiment, global economic conditions, and trading activity.
Key points of Bitcoin analysis:
Market Trend: Bitcoin prices can move upward or downward depending on market conditions.
Technical Analysis: Traders study support, resistance, charts, and trading volume.
Market Volatility: Bitcoin is highly volatile, so prices can change quickly.
Future Outlook: Bitcoin has long-term growth potential, but future prices are uncertain.
Conclusion: Bitcoin is an important digital asset with opportunities and risks. Always research carefully before making financial decisions.
{spot}(BTCUSDT)
#BinanceReopensWithdrawalsForMoreAssets #AnthropicIPOValuationDoubts #USStocksSlipandCryptoMarketUnderBroadPressure #USStocksSufferSteepestRoutSince2020 #USStocksSufferSteepestRoutSince2020
$BTC is the world's leading cryptocurrency. Its price is influenced by market demand, investor sentiment, global economic conditions, and trading activity.
Key points of Bitcoin analysis:
Market Trend: Bitcoin prices can move upward or downward depending on market conditions.
Technical Analysis: Traders study support, resistance, charts, and trading volume.
Market Volatility: Bitcoin is highly volatile, so prices can change quickly.
Future Outlook: Bitcoin has long-term growth potential, but future prices are uncertain.
Conclusion: Bitcoin is an important digital asset with opportunities and risks. Always research carefully before making financial decisions.
#BinanceReopensWithdrawalsForMoreAssets #AnthropicIPOValuationDoubts #USStocksSlipandCryptoMarketUnderBroadPressure #USStocksSufferSteepestRoutSince2020 #USStocksSufferSteepestRoutSince2020
Key points of Bitcoin analysis:
Market Trend: Bitcoin prices can move upward or downward depending on market conditions.
Technical Analysis: Traders study support, resistance, charts, and trading volume.
Market Volatility: Bitcoin is highly volatile, so prices can change quickly.
Future Outlook: Bitcoin has long-term growth potential, but future prices are uncertain.
Conclusion: Bitcoin is an important digital asset with opportunities and risks. Always research carefully before making financial decisions.
#BinanceReopensWithdrawalsForMoreAssets #AnthropicIPOValuationDoubts #USStocksSlipandCryptoMarketUnderBroadPressure #USStocksSufferSteepestRoutSince2020 #USStocksSufferSteepestRoutSince2020
95
·
--
Übersetzung ansehen
BlackRock’s iShares bitcoin fund sees record exodus as crypto heads for worst month since 2022
Key Points
The iShares Bitcoin Trust ETF has recorded $2.2 billion in outflows this month, as of Monday, FactSet data shows.
That’s nearly eight times the $291 million in losses suffered by the investment vehicle last October, or its second-worst month on record since its debut in early 2024.
The outflows come as bitcoin is down more than 20% over the past month.
traders are now pricing in more than 80% odds that the Federal Reserve will slash rates at its December meeting, such a cut remains far from sure bet.
Amid all the uncertainty, bitcoin is bleeding. And, investors in spot bitcoin ETFs, particularly newer holders, are feeling pressure to sell their shares — a reality that could extend the asset’s downside in the near term, Frank Chaparro, head of content and special projects at crypto-focused trading firm GSR, told CNBC.
“With the macro environment becoming less certain, investors tend to de-risk across assets, which often means trimming exposure to crypto and other risk-sensitive stocks,” Chaparro said. “And for newer entrants who came in through the funds, any downturn can be unsettling – they can sell just as quickly as they bought.”
But while it’s true that spot bitcoin ETFs have brought in hoards of new retail investors who may be flighty during volatile times, the funds have also attracted a range of long-term investors such as institutions who can hold through the downturn, according to Joshua Levine, chairman at bitcoin treasury firm OranjeBTC, told CNBC.
That institutional base could “dampen some of the extreme downside, but also smooth upside, reducing bitcoin’s volatility as the asset class matures,” Levine said.
BlackRock’s iShares bitcoin fund sees record exodus as crypto heads for worst month since 2022
Key Points
The iShares Bitcoin Trust ETF has recorded $2.2 billion in outflows this month, as of Monday, FactSet data shows.
That’s nearly eight times the $291 million in losses suffered by the investment vehicle last October, or its second-worst month on record since its debut in early 2024.
The outflows come as bitcoin is down more than 20% over the past month.
traders are now pricing in more than 80% odds that the Federal Reserve will slash rates at its December meeting, such a cut remains far from sure bet.
Amid all the uncertainty, bitcoin is bleeding. And, investors in spot bitcoin ETFs, particularly newer holders, are feeling pressure to sell their shares — a reality that could extend the asset’s downside in the near term, Frank Chaparro, head of content and special projects at crypto-focused trading firm GSR, told CNBC.
“With the macro environment becoming less certain, investors tend to de-risk across assets, which often means trimming exposure to crypto and other risk-sensitive stocks,” Chaparro said. “And for newer entrants who came in through the funds, any downturn can be unsettling – they can sell just as quickly as they bought.”
But while it’s true that spot bitcoin ETFs have brought in hoards of new retail investors who may be flighty during volatile times, the funds have also attracted a range of long-term investors such as institutions who can hold through the downturn, according to Joshua Levine, chairman at bitcoin treasury firm OranjeBTC, told CNBC.
That institutional base could “dampen some of the extreme downside, but also smooth upside, reducing bitcoin’s volatility as the asset class matures,” Levine said.
The iShares Bitcoin Trust ETF has recorded $2.2 billion in outflows this month, as of Monday, FactSet data shows.
That’s nearly eight times the $291 million in losses suffered by the investment vehicle last October, or its second-worst month on record since its debut in early 2024.
The outflows come as bitcoin is down more than 20% over the past month.
traders are now pricing in more than 80% odds that the Federal Reserve will slash rates at its December meeting, such a cut remains far from sure bet.
Amid all the uncertainty, bitcoin is bleeding. And, investors in spot bitcoin ETFs, particularly newer holders, are feeling pressure to sell their shares — a reality that could extend the asset’s downside in the near term, Frank Chaparro, head of content and special projects at crypto-focused trading firm GSR, told CNBC.
“With the macro environment becoming less certain, investors tend to de-risk across assets, which often means trimming exposure to crypto and other risk-sensitive stocks,” Chaparro said. “And for newer entrants who came in through the funds, any downturn can be unsettling – they can sell just as quickly as they bought.”
But while it’s true that spot bitcoin ETFs have brought in hoards of new retail investors who may be flighty during volatile times, the funds have also attracted a range of long-term investors such as institutions who can hold through the downturn, according to Joshua Levine, chairman at bitcoin treasury firm OranjeBTC, told CNBC.
That institutional base could “dampen some of the extreme downside, but also smooth upside, reducing bitcoin’s volatility as the asset class matures,” Levine said.
1
·
--
Übersetzung ansehen
Pi Network’s Chart Resembles Ethereum’sPi Network’s Chart Resembles Ethereum’s Early Days — Is History Repeating?
In the cryptocurrency market, history doesn’t always repeat—but it often rhymes. Pi Network (PI), after six years of development, officially launched its mainnet on February 20, 2024. Since then, the project has been closely watched by the crypto community, not just for its unique mobile-first mining model, but also for its intriguing price movement.
Following its debut, PI saw a strong surge, briefly touching $3 before facing a correction that brought it back to the current trading range of around $1. While price volatility is common in early-stage listings, what’s capturing attention now is something far more interesting—a possible repetition of a historical pattern seen in Ethereum’s (ETH) early days.
PI Mirrors Ethereum’s Early Listing Phase
Our recent comparative chart analysis between Ethereum’s early listing period and Pi Network’s current listing period price behavior shows striking similarities. Both assets display a falling wedge pattern, a well-known bullish reversal formation in technical analysis.
ETH-PI Chart Comparison/Coinsprobe (Source: Tradingview)
Looking back at Ethereum in 2015–2016, the coin entered exchanges at a price close to $1 and moved into a low-volatility phase, clearly marked by a falling wedge structure. After several weeks of consolidation, ETH broke out of this wedge, and a move above its 15-day moving average (15D MA) triggered a sharp bullish rally. This breakout didn’t just signal momentum—it delivered results. ETH surged over 1,400%, climbing from around $0.85 to over $14 within a couple of months.
Fast forward to 2025, Pi Network appears to be painting a similar picture. On the right side of the chart, PI is consolidating in a falling wedge pattern, with its current price hovering around $1—the same level ETH was trading before its breakout. The 15D MA is also hovering just above the price, much like ETH’s setup before its surge.
If Pi follows the same path as Ethereum, it doesn’t take a technical analyst to imagine what could come next.
Is History Repeating?
Of course, it’s important to approach chart similarities with caution. Ethereum’s rise was powered by groundbreaking smart contract technology and early developer adoption. Pi Network, while growing rapidly in user numbers, is still in the process of defining its core utilities and building tangible use cases in the ecosystem.
However, markets often move in patterns, reflecting collective psychology more than just fundamentals. And if the current chart structure is any indication, Pi Network could be quietly preparing for a similar breakout phase.
The momentum may depend on several factors—market sentiment, utility rollout, exchange integrations, and broader crypto trends. But from a pure technical perspective, all eyes are now on whether Pi can break above the wedge and its 15D MA, just as Ethereum once did.
Disclaimer: This article is for informational purposes only and does not constitute financial advice. Always conduct your own research before making any investment decisions.
Pi Network’s Chart Resembles Ethereum’s
Pi Network’s Chart Resembles Ethereum’s Early Days — Is History Repeating?
In the cryptocurrency market, history doesn’t always repeat—but it often rhymes. Pi Network (PI), after six years of development, officially launched its mainnet on February 20, 2024. Since then, the project has been closely watched by the crypto community, not just for its unique mobile-first mining model, but also for its intriguing price movement.
Following its debut, PI saw a strong surge, briefly touching $3 before facing a correction that brought it back to the current trading range of around $1. While price volatility is common in early-stage listings, what’s capturing attention now is something far more interesting—a possible repetition of a historical pattern seen in Ethereum’s (ETH) early days.
PI Mirrors Ethereum’s Early Listing Phase
Our recent comparative chart analysis between Ethereum’s early listing period and Pi Network’s current listing period price behavior shows striking similarities. Both assets display a falling wedge pattern, a well-known bullish reversal formation in technical analysis.
ETH-PI Chart Comparison/Coinsprobe (Source: Tradingview)
Looking back at Ethereum in 2015–2016, the coin entered exchanges at a price close to $1 and moved into a low-volatility phase, clearly marked by a falling wedge structure. After several weeks of consolidation, ETH broke out of this wedge, and a move above its 15-day moving average (15D MA) triggered a sharp bullish rally. This breakout didn’t just signal momentum—it delivered results. ETH surged over 1,400%, climbing from around $0.85 to over $14 within a couple of months.
Fast forward to 2025, Pi Network appears to be painting a similar picture. On the right side of the chart, PI is consolidating in a falling wedge pattern, with its current price hovering around $1—the same level ETH was trading before its breakout. The 15D MA is also hovering just above the price, much like ETH’s setup before its surge.
If Pi follows the same path as Ethereum, it doesn’t take a technical analyst to imagine what could come next.
Is History Repeating?
Of course, it’s important to approach chart similarities with caution. Ethereum’s rise was powered by groundbreaking smart contract technology and early developer adoption. Pi Network, while growing rapidly in user numbers, is still in the process of defining its core utilities and building tangible use cases in the ecosystem.
However, markets often move in patterns, reflecting collective psychology more than just fundamentals. And if the current chart structure is any indication, Pi Network could be quietly preparing for a similar breakout phase.
The momentum may depend on several factors—market sentiment, utility rollout, exchange integrations, and broader crypto trends. But from a pure technical perspective, all eyes are now on whether Pi can break above the wedge and its 15D MA, just as Ethereum once did.
Disclaimer: This article is for informational purposes only and does not constitute financial advice. Always conduct your own research before making any investment decisions.
In the cryptocurrency market, history doesn’t always repeat—but it often rhymes. Pi Network (PI), after six years of development, officially launched its mainnet on February 20, 2024. Since then, the project has been closely watched by the crypto community, not just for its unique mobile-first mining model, but also for its intriguing price movement.
Following its debut, PI saw a strong surge, briefly touching $3 before facing a correction that brought it back to the current trading range of around $1. While price volatility is common in early-stage listings, what’s capturing attention now is something far more interesting—a possible repetition of a historical pattern seen in Ethereum’s (ETH) early days.
PI Mirrors Ethereum’s Early Listing Phase
Our recent comparative chart analysis between Ethereum’s early listing period and Pi Network’s current listing period price behavior shows striking similarities. Both assets display a falling wedge pattern, a well-known bullish reversal formation in technical analysis.
ETH-PI Chart Comparison/Coinsprobe (Source: Tradingview)
Looking back at Ethereum in 2015–2016, the coin entered exchanges at a price close to $1 and moved into a low-volatility phase, clearly marked by a falling wedge structure. After several weeks of consolidation, ETH broke out of this wedge, and a move above its 15-day moving average (15D MA) triggered a sharp bullish rally. This breakout didn’t just signal momentum—it delivered results. ETH surged over 1,400%, climbing from around $0.85 to over $14 within a couple of months.
Fast forward to 2025, Pi Network appears to be painting a similar picture. On the right side of the chart, PI is consolidating in a falling wedge pattern, with its current price hovering around $1—the same level ETH was trading before its breakout. The 15D MA is also hovering just above the price, much like ETH’s setup before its surge.
If Pi follows the same path as Ethereum, it doesn’t take a technical analyst to imagine what could come next.
Is History Repeating?
Of course, it’s important to approach chart similarities with caution. Ethereum’s rise was powered by groundbreaking smart contract technology and early developer adoption. Pi Network, while growing rapidly in user numbers, is still in the process of defining its core utilities and building tangible use cases in the ecosystem.
However, markets often move in patterns, reflecting collective psychology more than just fundamentals. And if the current chart structure is any indication, Pi Network could be quietly preparing for a similar breakout phase.
The momentum may depend on several factors—market sentiment, utility rollout, exchange integrations, and broader crypto trends. But from a pure technical perspective, all eyes are now on whether Pi can break above the wedge and its 15D MA, just as Ethereum once did.
Disclaimer: This article is for informational purposes only and does not constitute financial advice. Always conduct your own research before making any investment decisions.
61
·
--
Übersetzung ansehen
#RamadanGiveaway
The holy month of Ramadan is a time of reflection, gratitude, and generosity. To celebrate this blessed season, we’re excited to announce our #RamadanGiveaway! Share your favorite Ramadan traditions, memories, or acts of kindness for a chance to win amazing prizes. Whether it’s preparing iftar with loved ones, reading Quran, or helping those in need, let’s spread the spirit of Ramadan together. Follow us, tag friends, and use #RamadanGiveaway to enter. Winners will be announced at the end of the month. May this Ramadan bring peace, joy, and countless blessings to all. Good luck! 🌙✨ #Blessings #Community #Giveback
#RamadanGiveaway
The holy month of Ramadan is a time of reflection, gratitude, and generosity. To celebrate this blessed season, we’re excited to announce our #RamadanGiveaway! Share your favorite Ramadan traditions, memories, or acts of kindness for a chance to win amazing prizes. Whether it’s preparing iftar with loved ones, reading Quran, or helping those in need, let’s spread the spirit of Ramadan together. Follow us, tag friends, and use #RamadanGiveaway to enter. Winners will be announced at the end of the month. May this Ramadan bring peace, joy, and countless blessings to all. Good luck! 🌙✨ #Blessings #Community #Giveback
The holy month of Ramadan is a time of reflection, gratitude, and generosity. To celebrate this blessed season, we’re excited to announce our #RamadanGiveaway! Share your favorite Ramadan traditions, memories, or acts of kindness for a chance to win amazing prizes. Whether it’s preparing iftar with loved ones, reading Quran, or helping those in need, let’s spread the spirit of Ramadan together. Follow us, tag friends, and use #RamadanGiveaway to enter. Winners will be announced at the end of the month. May this Ramadan bring peace, joy, and countless blessings to all. Good luck! 🌙✨ #Blessings #Community #Giveback
59
·
--
Übersetzung ansehen
The power of the community is stronger than ever! 🚀 Binance is giving users the chance to decide which project gets listed next, and your vote can make all the difference. Supporting your favorite token means increased visibility, liquidity, and massive growth potential. A Binance listing can take a project to the next level, attracting new investors and boosting adoption. Now is the time to come together, spread the word, and rally behind the project you believe in. Don’t miss this opportunity to shape the future of crypto—every vote counts! Cast your vote today! 🔥 #VoteToListOnBinance
The power of the community is stronger than ever! 🚀 Binance is giving users the chance to decide which project gets listed next, and your vote can make all the difference. Supporting your favorite token means increased visibility, liquidity, and massive growth potential. A Binance listing can take a project to the next level, attracting new investors and boosting adoption. Now is the time to come together, spread the word, and rally behind the project you believe in. Don’t miss this opportunity to shape the future of crypto—every vote counts! Cast your vote today! 🔥 #VoteToListOnBinance
92
·
--
Übersetzung ansehen
#pi pi coin prediction 2025 & 2026
March 2025: PI Prediction
Analysts expect PI's price to rise in March, with a projected change of 112.06% compared to current rates. The asset may reach a high of $ 3.92 and a low of $ 1.163461, averaging around $ 2.34. This prediction comes after a poor market performance in the last 30 days – during which time lost -21.43% – indicating a possible reversal of the trend. The potential ROI stands at 255.72%, suggesting a profitable opportunity for long traders.
In 2026, Pi Network is forecasted to trade in a price channel between $ 1.098607 and $ 3.20. On average, PI is expected to change hands at $ 2.26 during the year. The most bullish month for PI could be January, when the currency is anticipated to trade 190.04% higher than today.
#pi pi coin prediction 2025 & 2026
March 2025: PI Prediction
Analysts expect PI's price to rise in March, with a projected change of 112.06% compared to current rates. The asset may reach a high of $ 3.92 and a low of $ 1.163461, averaging around $ 2.34. This prediction comes after a poor market performance in the last 30 days – during which time lost -21.43% – indicating a possible reversal of the trend. The potential ROI stands at 255.72%, suggesting a profitable opportunity for long traders.
In 2026, Pi Network is forecasted to trade in a price channel between $ 1.098607 and $ 3.20. On average, PI is expected to change hands at $ 2.26 during the year. The most bullish month for PI could be January, when the currency is anticipated to trade 190.04% higher than today.
March 2025: PI Prediction
Analysts expect PI's price to rise in March, with a projected change of 112.06% compared to current rates. The asset may reach a high of $ 3.92 and a low of $ 1.163461, averaging around $ 2.34. This prediction comes after a poor market performance in the last 30 days – during which time lost -21.43% – indicating a possible reversal of the trend. The potential ROI stands at 255.72%, suggesting a profitable opportunity for long traders.
In 2026, Pi Network is forecasted to trade in a price channel between $ 1.098607 and $ 3.20. On average, PI is expected to change hands at $ 2.26 during the year. The most bullish month for PI could be January, when the currency is anticipated to trade 190.04% higher than today.
13
145
Anmelden und weiter Inhalte entdecken
Krypto-Nutzer weltweit auf Binance Square kennenlernen
⚡️ Bleib in Sachen Krypto stets am Puls.
💬 Die weltgrößte Kryptobörse vertraut darauf.
👍 Erhalte verlässliche Einblicke von verifizierten Creators.
E-Mail-Adresse/Telefonnummer
Trendthemen
BinanceReopensWithdrawalsForMoreAssets
1.1M Aufrufe
5,937 Kommentare
Update zur Wiederherstellung Nr. 9: Auszahlungen für weitere Vermögenswerte werden wieder ermöglicht (2026-11-06)
Binance Announcement
·198 Likes
·784.5k Aufrufe
$2TWipedOutHedgeFundsFaceLiquidation
1,620 Aufrufe
35 Kommentare
AnthropicIPOValuationDoubts
19,167 Aufrufe
450 Kommentare