

Square-Creator-065d1f892bf92f2d97a1
3 Beiträge

Square-Creator-065d1f892bf92f2d97a1
Melden
Nutzer blockieren
1 Following
0 Follower
0 Like gegeben
Beiträge
$QNT #QNTFallsOver40%FromMorningHigh #QNT/USDT
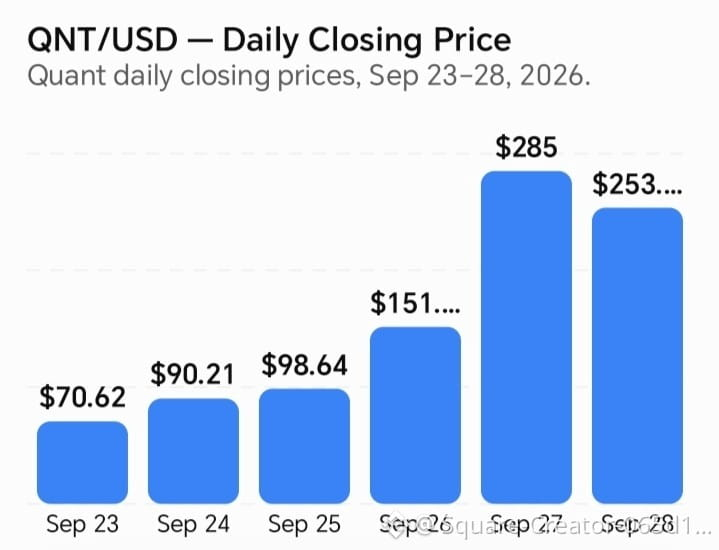
Aktuelle Zone: um $260–$280; die Preise variieren je nach Börse und Zeitpunkt. QNT hat eine außergewöhnlich starke Bewegung erlebt: Laut Investing.com lag der Schlusskurs am 27. Sep. bei rund $285 nach einem täglichen Plus von 88%, gefolgt von einer volatilen Sitzung am 28. Sep. Der 27. Sep. war die größte Bewegung: QNT schloss bei etwa $285 nach einem Anstieg von 88% am selben Tag. Der 28. Sep. war deutlich volatiler: Die Binance-Daten zeigen ein Intraday-Hoch nahe $320 und ein Tief bei etwa $242.
$QNT #QNTFallsOver40%FromMorningHigh #QNT/USDT
Aktuelle Zone: um $260–$280; die Preise variieren je nach Börse und Zeitpunkt. QNT hat eine außergewöhnlich starke Bewegung erlebt: Laut Investing.com lag der Schlusskurs am 27. Sep. bei rund $285 nach einem täglichen Plus von 88%, gefolgt von einer volatilen Sitzung am 28. Sep. Der 27. Sep. war die größte Bewegung: QNT schloss bei etwa $285 nach einem Anstieg von 88% am selben Tag. Der 28. Sep. war deutlich volatiler: Die Binance-Daten zeigen ein Intraday-Hoch nahe $320 und ein Tief bei etwa $242.
Aktuelle Zone: um $260–$280; die Preise variieren je nach Börse und Zeitpunkt. QNT hat eine außergewöhnlich starke Bewegung erlebt: Laut Investing.com lag der Schlusskurs am 27. Sep. bei rund $285 nach einem täglichen Plus von 88%, gefolgt von einer volatilen Sitzung am 28. Sep. Der 27. Sep. war die größte Bewegung: QNT schloss bei etwa $285 nach einem Anstieg von 88% am selben Tag. Der 28. Sep. war deutlich volatiler: Die Binance-Daten zeigen ein Intraday-Hoch nahe $320 und ein Tief bei etwa $242.
120
$ETH #EathirumToday #ETH🔥🔥🔥🔥🔥🔥 $ETH - Kurzanalyse | 28. Sep. 2026
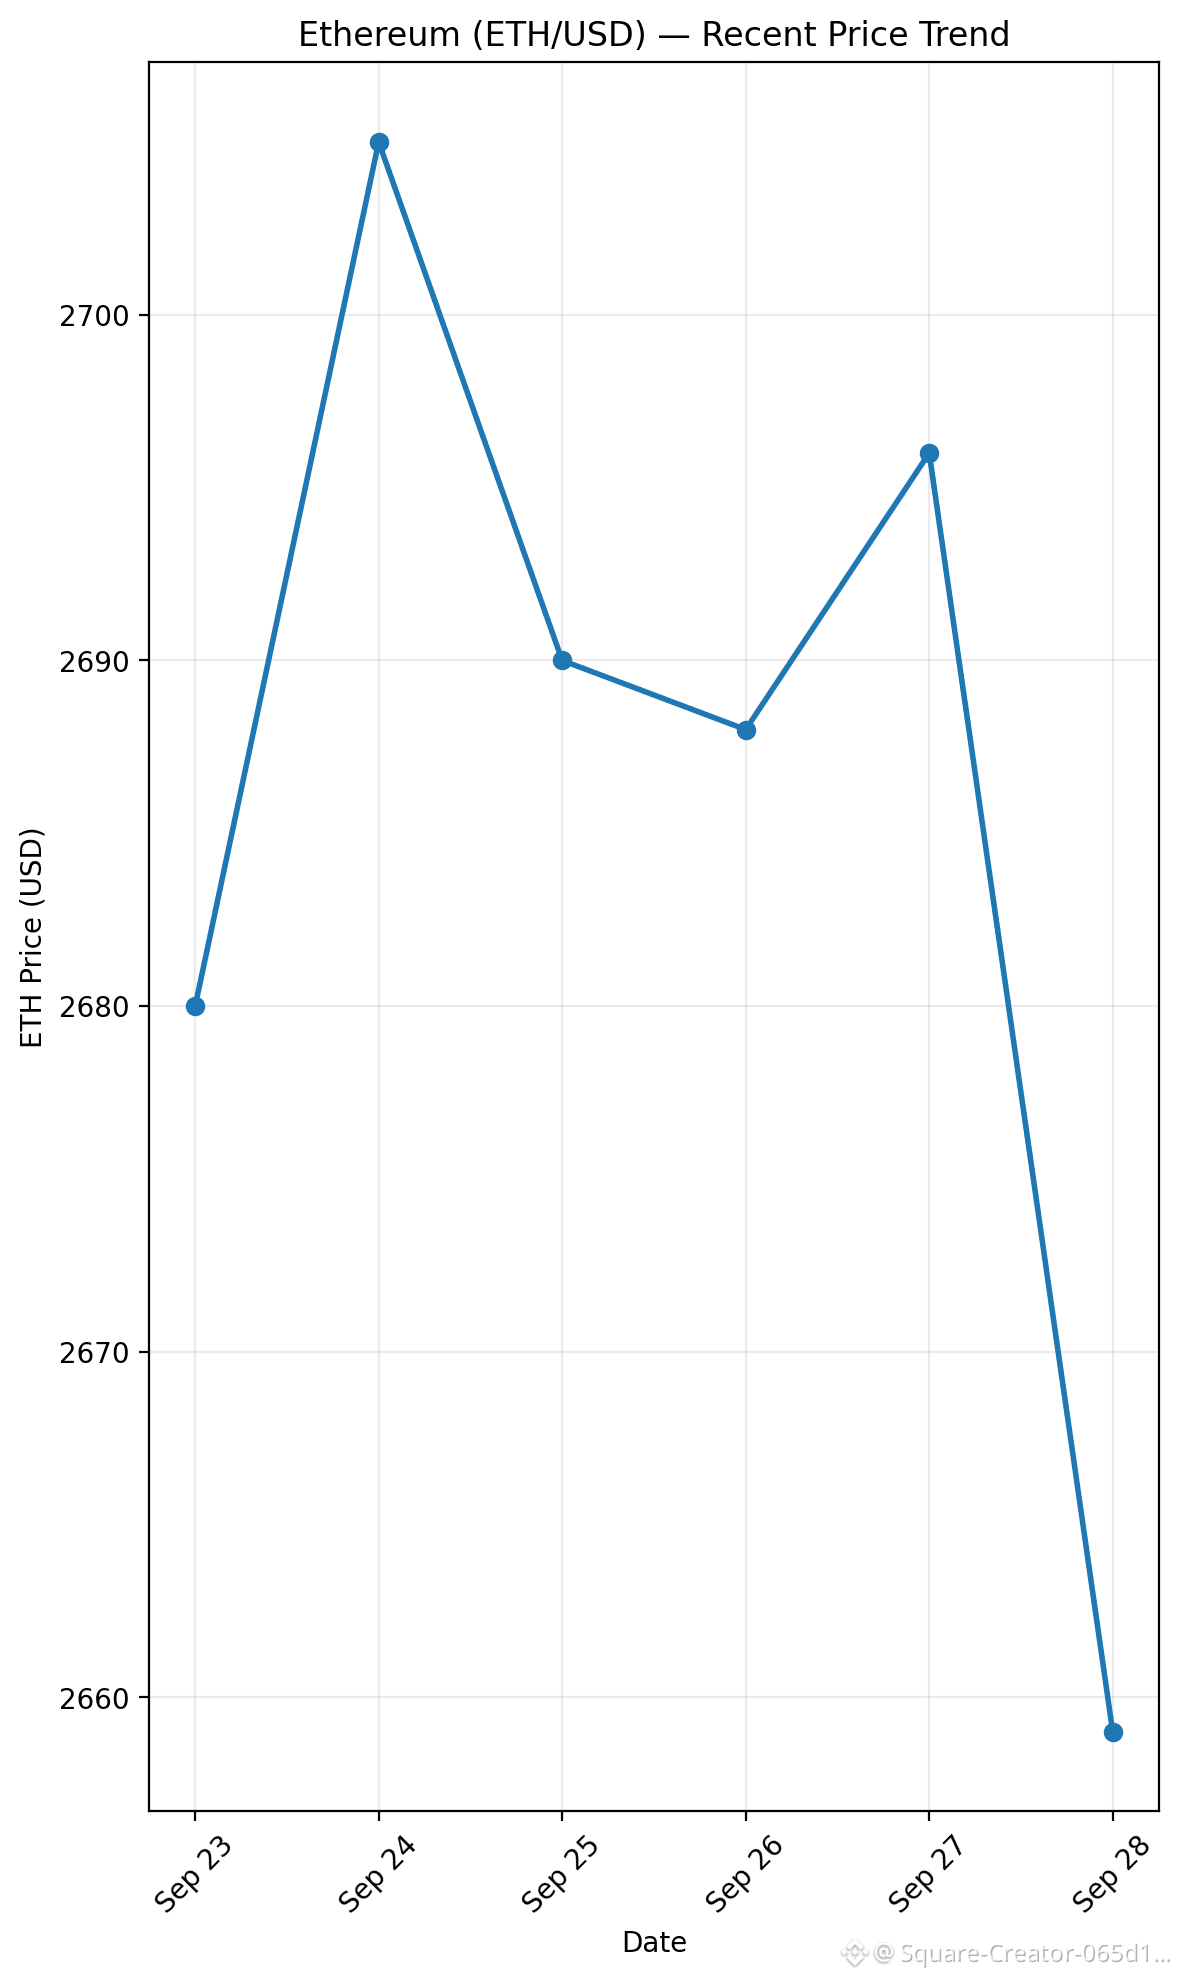
Aktueller Preis: ca. 2.659 $
24h: etwa -1,6 %. �
CoinMarketCap +1
ETH/USD — Jüngster Kursverlauf
Jüngste Bewegung des Ethereum-Kurses und wichtige Kursmarken.
ETH-Preis
$2,7T
Kursmarken
🟢 Unterstützung: $2.580–$2.600
🔴 Widerstand: $2.750–$2.800
⬆️ Über $2.800: In der jüngsten technischen Analyse wurde ein nächster Bereich um $3.050 identifiziert. �
⬇️ Unter $2.580: $2.450 wird zur wichtigen Abwärtsmarke. �
reuters.com
CoinMarketCap
Kurzfazit: ETH zieht derzeit zurück, nachdem ein Bereich um $2.800 nicht gehalten werden konnte. Die Unterstützungszone $2.580–$2.600 ist der wichtigste Bereich, den es im Blick zu behalten gilt. �
$ETH #EathirumToday #ETH🔥🔥🔥🔥🔥🔥 $ETH - Kurzanalyse | 28. Sep. 2026
Aktueller Preis: ca. 2.659 $
24h: etwa -1,6 %. �
CoinMarketCap +1
ETH/USD — Jüngster Kursverlauf
Jüngste Bewegung des Ethereum-Kurses und wichtige Kursmarken.
ETH-Preis
$2,7T
Kursmarken
🟢 Unterstützung: $2.580–$2.600
🔴 Widerstand: $2.750–$2.800
⬆️ Über $2.800: In der jüngsten technischen Analyse wurde ein nächster Bereich um $3.050 identifiziert. �
⬇️ Unter $2.580: $2.450 wird zur wichtigen Abwärtsmarke. �
reuters.com
CoinMarketCap
Kurzfazit: ETH zieht derzeit zurück, nachdem ein Bereich um $2.800 nicht gehalten werden konnte. Die Unterstützungszone $2.580–$2.600 ist der wichtigste Bereich, den es im Blick zu behalten gilt. �
Aktueller Preis: ca. 2.659 $
24h: etwa -1,6 %. �
CoinMarketCap +1
ETH/USD — Jüngster Kursverlauf
Jüngste Bewegung des Ethereum-Kurses und wichtige Kursmarken.
ETH-Preis
$2,7T
Kursmarken
🟢 Unterstützung: $2.580–$2.600
🔴 Widerstand: $2.750–$2.800
⬆️ Über $2.800: In der jüngsten technischen Analyse wurde ein nächster Bereich um $3.050 identifiziert. �
⬇️ Unter $2.580: $2.450 wird zur wichtigen Abwärtsmarke. �
reuters.com
CoinMarketCap
Kurzfazit: ETH zieht derzeit zurück, nachdem ein Bereich um $2.800 nicht gehalten werden konnte. Die Unterstützungszone $2.580–$2.600 ist der wichtigste Bereich, den es im Blick zu behalten gilt. �
52
Übersetzung ansehen
$BTC #bitcoin #BinanceSquareTalks #BTSAnalysis Latest Market Analysis
As of September 28, 2026
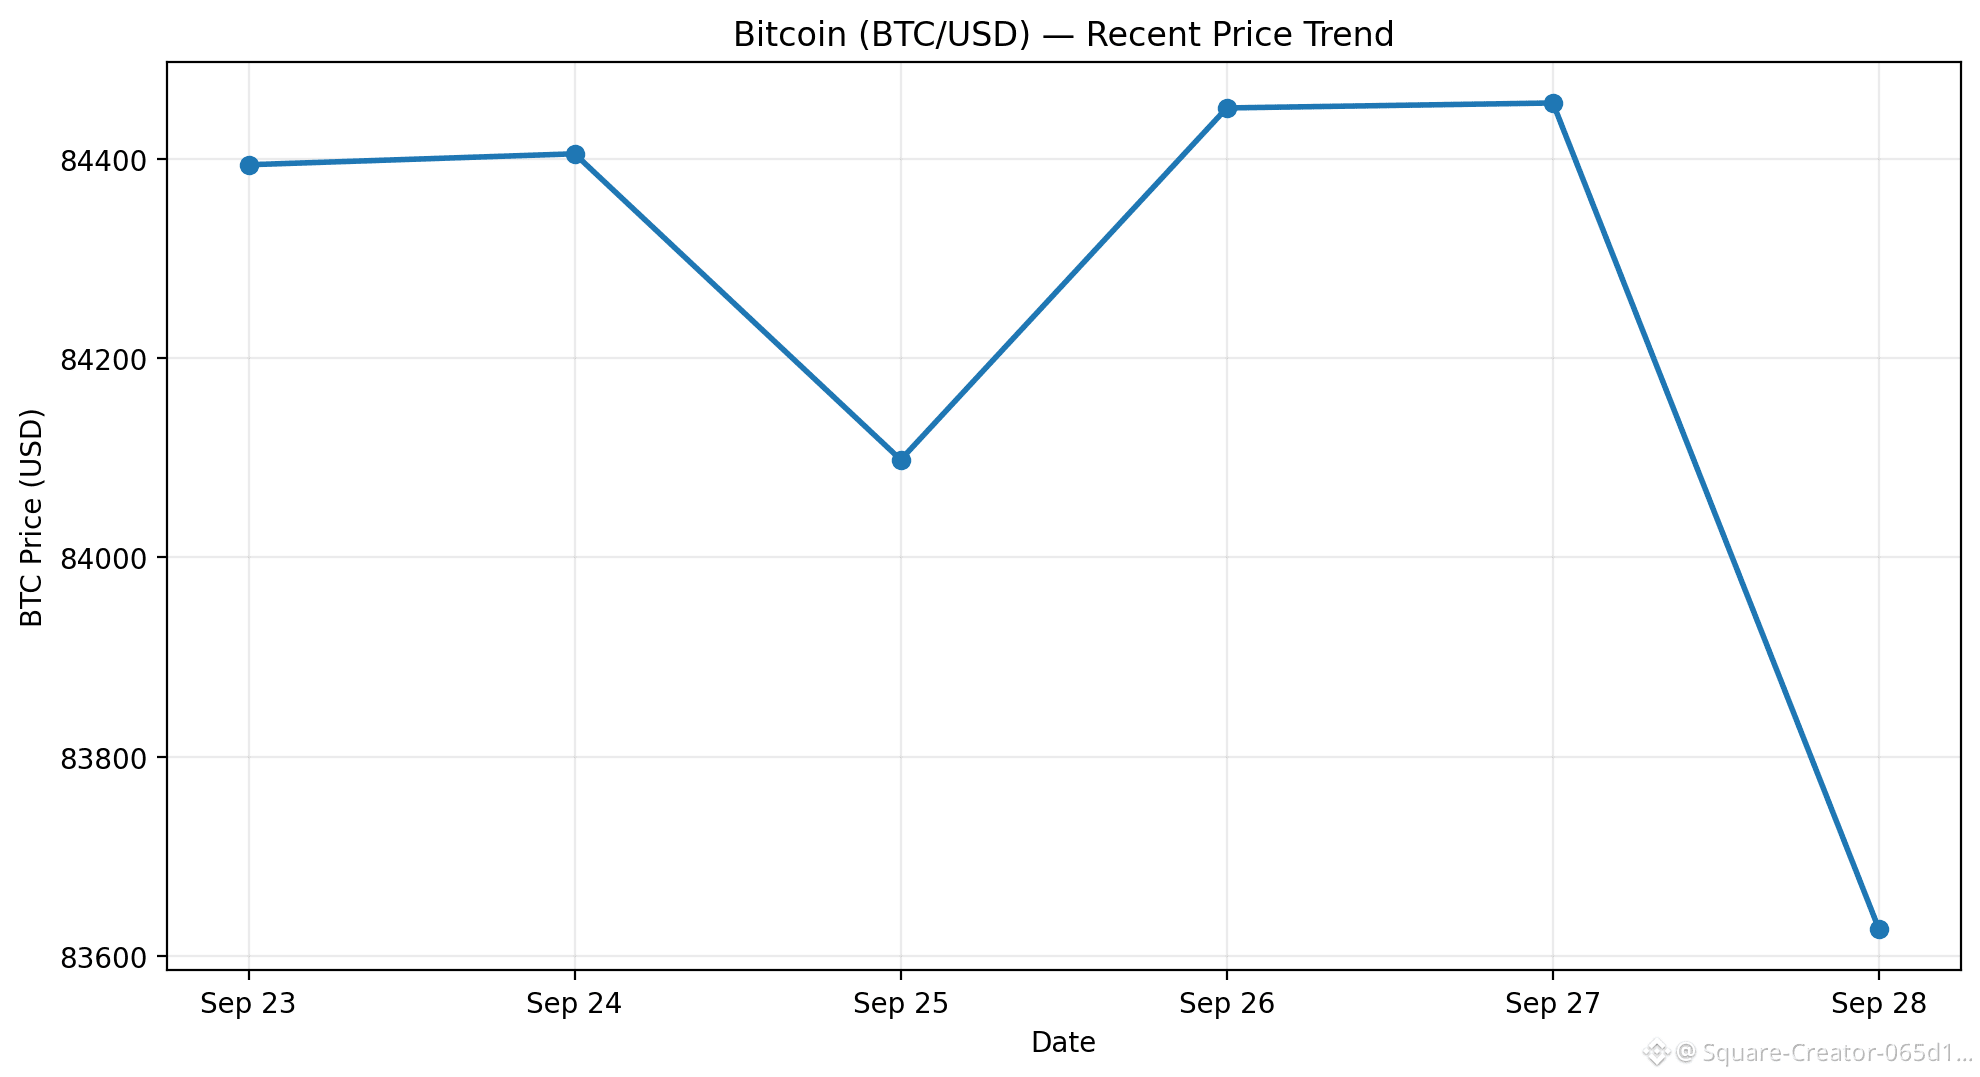
BTC is currently around $83,400, down about 1.2% today, while still roughly +2.7% over the past week. Today's trading range is approximately $83,400–$85,000. �
Investing.com Nigeria +1
BTC/USD — Recent Daily Price Trend
Bitcoin daily closing prices from September 23–28, 2026.
BTC price
$84.4K
Source: Investing.com historical BTC data.
📊 Key technical levels
Level
BTC zone
Importance
Resistance
$85,000–$86,000
Recent selling area
Major resistance
$87,000–$90,000
Breakout area to watch
Current
~$83,400
Current market zone
Support
$83,000–$83,200
Near-term support
Stronger support
$80,000–$81,000
Important psychological/technical zone
BTC recently reached around $86,000–$87,000, an eight-month high, before pulling back. Recent reporting links the rally partly to strong U.S. spot-BTC ETF inflows and short covering. �
MarketWatch +1
🔎 What matters now
Bullish factors
BTC remains above the $80K area.
Recent ETF flows have improved significantly; U.S. spot Bitcoin ETFs reportedly recorded about $3B of inflows across seven consecutive sessions through September 26. �
Decrypt
Momentum strengthened after the move above $85K.
Risk factors
BTC has been rejected from the $85K–$87K area recently.
Today's decline shows sellers are still active around the recent highs.
ETF flows, Treasury yields, dollar strength and broader risk-market conditions remain important catalysts. �
Moneycontrol +1
🧭 Scenarios to watch
If BTC holds $83K: the market remains in the current consolidation zone, with $85K–$87K as the next major area to monitor.
If BTC breaks and sustains above $87K: traders would likely watch the $90K area as the next major psychological level.
If BTC loses $83K decisively: attention shifts toward $80K–$81K support; a sustained break below that zone would weaken the current structure.
These are technical scenarios, not guaranteed price.
$BTC #bitcoin #BinanceSquareTalks #BTSAnalysis Latest Market Analysis
As of September 28, 2026
BTC is currently around $83,400, down about 1.2% today, while still roughly +2.7% over the past week. Today's trading range is approximately $83,400–$85,000. �
Investing.com Nigeria +1
BTC/USD — Recent Daily Price Trend
Bitcoin daily closing prices from September 23–28, 2026.
BTC price
$84.4K
Source: Investing.com historical BTC data.
📊 Key technical levels
Level
BTC zone
Importance
Resistance
$85,000–$86,000
Recent selling area
Major resistance
$87,000–$90,000
Breakout area to watch
Current
~$83,400
Current market zone
Support
$83,000–$83,200
Near-term support
Stronger support
$80,000–$81,000
Important psychological/technical zone
BTC recently reached around $86,000–$87,000, an eight-month high, before pulling back. Recent reporting links the rally partly to strong U.S. spot-BTC ETF inflows and short covering. �
MarketWatch +1
🔎 What matters now
Bullish factors
BTC remains above the $80K area.
Recent ETF flows have improved significantly; U.S. spot Bitcoin ETFs reportedly recorded about $3B of inflows across seven consecutive sessions through September 26. �
Decrypt
Momentum strengthened after the move above $85K.
Risk factors
BTC has been rejected from the $85K–$87K area recently.
Today's decline shows sellers are still active around the recent highs.
ETF flows, Treasury yields, dollar strength and broader risk-market conditions remain important catalysts. �
Moneycontrol +1
🧭 Scenarios to watch
If BTC holds $83K: the market remains in the current consolidation zone, with $85K–$87K as the next major area to monitor.
If BTC breaks and sustains above $87K: traders would likely watch the $90K area as the next major psychological level.
If BTC loses $83K decisively: attention shifts toward $80K–$81K support; a sustained break below that zone would weaken the current structure.
These are technical scenarios, not guaranteed price.
As of September 28, 2026
BTC is currently around $83,400, down about 1.2% today, while still roughly +2.7% over the past week. Today's trading range is approximately $83,400–$85,000. �
Investing.com Nigeria +1
BTC/USD — Recent Daily Price Trend
Bitcoin daily closing prices from September 23–28, 2026.
BTC price
$84.4K
Source: Investing.com historical BTC data.
📊 Key technical levels
Level
BTC zone
Importance
Resistance
$85,000–$86,000
Recent selling area
Major resistance
$87,000–$90,000
Breakout area to watch
Current
~$83,400
Current market zone
Support
$83,000–$83,200
Near-term support
Stronger support
$80,000–$81,000
Important psychological/technical zone
BTC recently reached around $86,000–$87,000, an eight-month high, before pulling back. Recent reporting links the rally partly to strong U.S. spot-BTC ETF inflows and short covering. �
MarketWatch +1
🔎 What matters now
Bullish factors
BTC remains above the $80K area.
Recent ETF flows have improved significantly; U.S. spot Bitcoin ETFs reportedly recorded about $3B of inflows across seven consecutive sessions through September 26. �
Decrypt
Momentum strengthened after the move above $85K.
Risk factors
BTC has been rejected from the $85K–$87K area recently.
Today's decline shows sellers are still active around the recent highs.
ETF flows, Treasury yields, dollar strength and broader risk-market conditions remain important catalysts. �
Moneycontrol +1
🧭 Scenarios to watch
If BTC holds $83K: the market remains in the current consolidation zone, with $85K–$87K as the next major area to monitor.
If BTC breaks and sustains above $87K: traders would likely watch the $90K area as the next major psychological level.
If BTC loses $83K decisively: attention shifts toward $80K–$81K support; a sustained break below that zone would weaken the current structure.
These are technical scenarios, not guaranteed price.
107
Anmelden und weiter Inhalte entdecken
Krypto-Nutzer weltweit auf Binance Square kennenlernen
⚡️ Bleib in Sachen Krypto stets am Puls.
💬 Die weltgrößte Kryptobörse vertraut darauf.
👍 Erhalte verlässliche Einblicke von verifizierten Creators.
E-Mail-Adresse/Telefonnummer
Trendthemen
UKFCAWinsCourtOrderToRecover851400Pounds
37,747 Aufrufe
823 Kommentare
🚨 KRYPTOREGULIERUNG BETRITT JETZT EINE NEUE PHASE: SIE SCHREIBEN NICHT NUR REGELN — SIE HOLEN GELD ZURÜCK.
Die britische FCA hat eine weitere gerichtlich gestützte Vermögensrückgewinnung gesichert und verstärkt damit einen breiteren Durchsetzungsansatz gegen unbefugte Finanz- und Kryptoaktivitäten.
Und schau dir an, was gleichzeitig passiert:
🇬🇧 FCA → Durchsetzung + Vermögensrückgewinnung
🇺🇸 SEC → klarere Regeln für funktionale Krypto-Assets
🇺🇸 Fed → formale Stablecoin-Aufsicht unter dem GENIUS Act
Diese Kombination ist entscheidend.
Regulierungsbehörden debattieren nicht länger, ob Krypto in das Finanzsystem gehört.
Stattdessen entscheiden sie zunehmend, wer Zugang bekommt, welche Regeln gilt, und was passiert, wenn diese Regeln gebrochen werden.
Der nächste Krypto-Zyklus könnte nicht „Regulierung vs. Innovation“ sein.
Er könnte reguliertes Krypto sein — im Gegensatz zu allen, die den Standard nicht erfüllen können. 👀
$COIN $CRCL $BTC
#ukfcawinscourtordertorecover851400pounds #ChainlinkLaunchesCCIP2WithEnterpriseVerification #GoldFallsTo$4144 #QNTFallsOver40%FromMorningHigh #USDTAdds845900HoldersInPast7Days
KimHotbae
·3 Likes
·4.4k Aufrufe
ChainlinkLaunchesCCIP2WithEnterpriseVerification
50,041 Aufrufe
990 Kommentare
GoldFallsTo$4144
17,071 Aufrufe
165 Kommentare