

Dark Trader08
4 Beiträge

Dark Trader08
Melden
Nutzer blockieren
0 Following
1 Follower
0 Like gegeben
Beiträge
Übersetzung ansehen
🔥 $WLFI (World Liberty Financial) — Latest Market Analysis
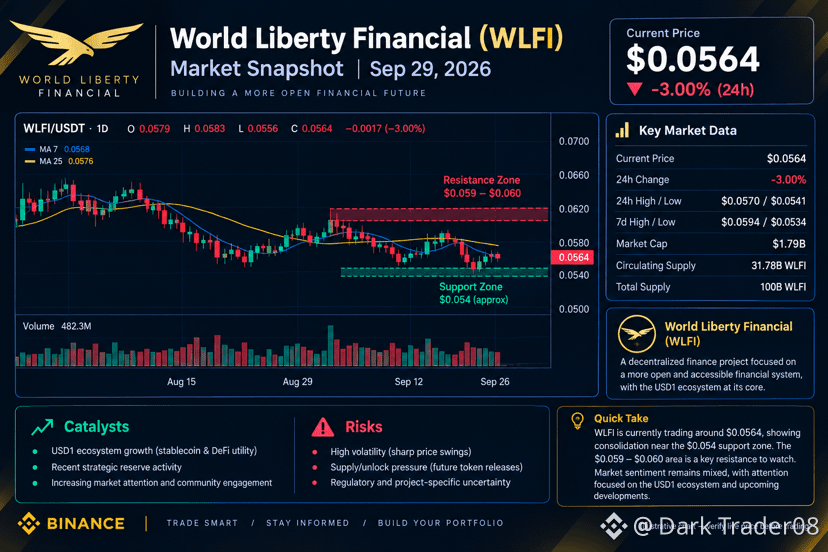
WLFI is trading around $0.0564, with recent price action showing consolidation after significant volatility. The $0.054 area is an important support zone, while $0.059–$0.060 is a key resistance area based on the recent 7-day range. (CoinMarketCap)
📈 Bullish scenario: A sustained move above $0.060 could signal stronger momentum.
📉 Bearish scenario: Losing the $0.054 support area could increase selling pressure.
🔥 Catalysts: Growth of the USD1 ecosystem, recent strategic-reserve activity and continued market attention around WLFI. (CoinGecko)
⚠️ Risk: WLFI remains highly volatile, and its large total supply of 100B tokens means supply/unlock dynamics are important to monitor. (CoinMarketCap)
Bottom line: WLFI is currently at a key technical area. Traders should watch $0.054 support and $0.060 resistance for the next significant move.#ChainlinkLaunchesCCIP2WithEnterpriseVerification #UKFCAWinsCourtOrderToRecover851400Pounds
{spot}(WLFIUSDT)
🔥 $WLFI (World Liberty Financial) — Latest Market Analysis
WLFI is trading around $0.0564, with recent price action showing consolidation after significant volatility. The $0.054 area is an important support zone, while $0.059–$0.060 is a key resistance area based on the recent 7-day range. (CoinMarketCap)
📈 Bullish scenario: A sustained move above $0.060 could signal stronger momentum.
📉 Bearish scenario: Losing the $0.054 support area could increase selling pressure.
🔥 Catalysts: Growth of the USD1 ecosystem, recent strategic-reserve activity and continued market attention around WLFI. (CoinGecko)
⚠️ Risk: WLFI remains highly volatile, and its large total supply of 100B tokens means supply/unlock dynamics are important to monitor. (CoinMarketCap)
Bottom line: WLFI is currently at a key technical area. Traders should watch $0.054 support and $0.060 resistance for the next significant move.#ChainlinkLaunchesCCIP2WithEnterpriseVerification #UKFCAWinsCourtOrderToRecover851400Pounds
WLFI is trading around $0.0564, with recent price action showing consolidation after significant volatility. The $0.054 area is an important support zone, while $0.059–$0.060 is a key resistance area based on the recent 7-day range. (CoinMarketCap)
📈 Bullish scenario: A sustained move above $0.060 could signal stronger momentum.
📉 Bearish scenario: Losing the $0.054 support area could increase selling pressure.
🔥 Catalysts: Growth of the USD1 ecosystem, recent strategic-reserve activity and continued market attention around WLFI. (CoinGecko)
⚠️ Risk: WLFI remains highly volatile, and its large total supply of 100B tokens means supply/unlock dynamics are important to monitor. (CoinMarketCap)
Bottom line: WLFI is currently at a key technical area. Traders should watch $0.054 support and $0.060 resistance for the next significant move.#ChainlinkLaunchesCCIP2WithEnterpriseVerification #UKFCAWinsCourtOrderToRecover851400Pounds
226
Übersetzung ansehen
🚀 $ETH — Short-Term Market Outlook
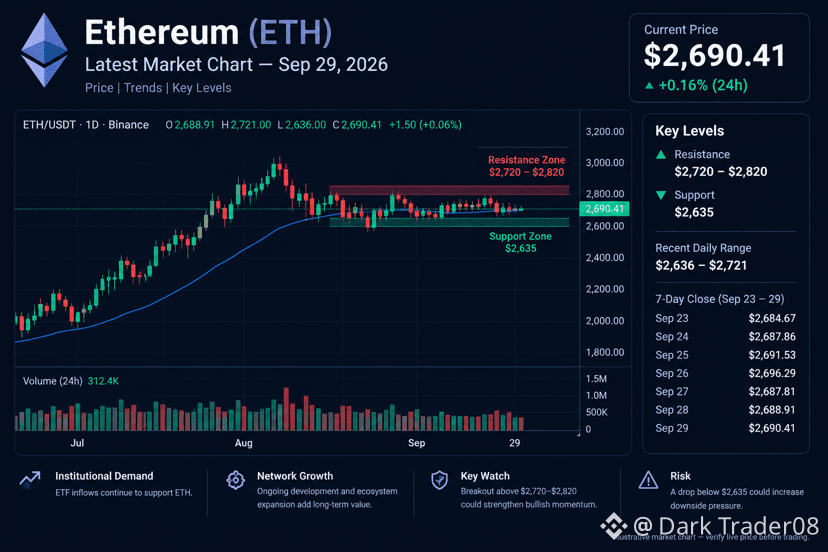
ETH is currently trading near $2,690 and has shown resilience despite the recent crypto-market correction. Recent Ethereum ETF inflows suggest continued institutional interest, while ETH has been holding around the $2,635 support area.
📊 Key levels:
• Support: ~$2,635
• Resistance: ~$2,720–$2,820
• A confirmed breakout above resistance could strengthen bullish momentum.
• A break below support could increase downside pressure.
🔥 Watch ETH closely: the combination of ETF demand and upcoming Ethereum developments makes ETH one of the major altcoins worth monitoring.#BitMineETHHoldingsTop6Million #StrategyAdds1666BTCHoldingsReach847666 #NvidiaApproves$150BBuyback #OpenAIDelaysGPT6.1OverSafetyIssues
{spot}(ETHUSDT)
🚀 $ETH — Short-Term Market Outlook
ETH is currently trading near $2,690 and has shown resilience despite the recent crypto-market correction. Recent Ethereum ETF inflows suggest continued institutional interest, while ETH has been holding around the $2,635 support area.
📊 Key levels:
• Support: ~$2,635
• Resistance: ~$2,720–$2,820
• A confirmed breakout above resistance could strengthen bullish momentum.
• A break below support could increase downside pressure.
🔥 Watch ETH closely: the combination of ETF demand and upcoming Ethereum developments makes ETH one of the major altcoins worth monitoring.#BitMineETHHoldingsTop6Million #StrategyAdds1666BTCHoldingsReach847666 #NvidiaApproves$150BBuyback #OpenAIDelaysGPT6.1OverSafetyIssues
ETH is currently trading near $2,690 and has shown resilience despite the recent crypto-market correction. Recent Ethereum ETF inflows suggest continued institutional interest, while ETH has been holding around the $2,635 support area.
📊 Key levels:
• Support: ~$2,635
• Resistance: ~$2,720–$2,820
• A confirmed breakout above resistance could strengthen bullish momentum.
• A break below support could increase downside pressure.
🔥 Watch ETH closely: the combination of ETF demand and upcoming Ethereum developments makes ETH one of the major altcoins worth monitoring.#BitMineETHHoldingsTop6Million #StrategyAdds1666BTCHoldingsReach847666 #NvidiaApproves$150BBuyback #OpenAIDelaysGPT6.1OverSafetyIssues
78
$SOL 🔥🔥🔥— neueste Kurzüberprüfung
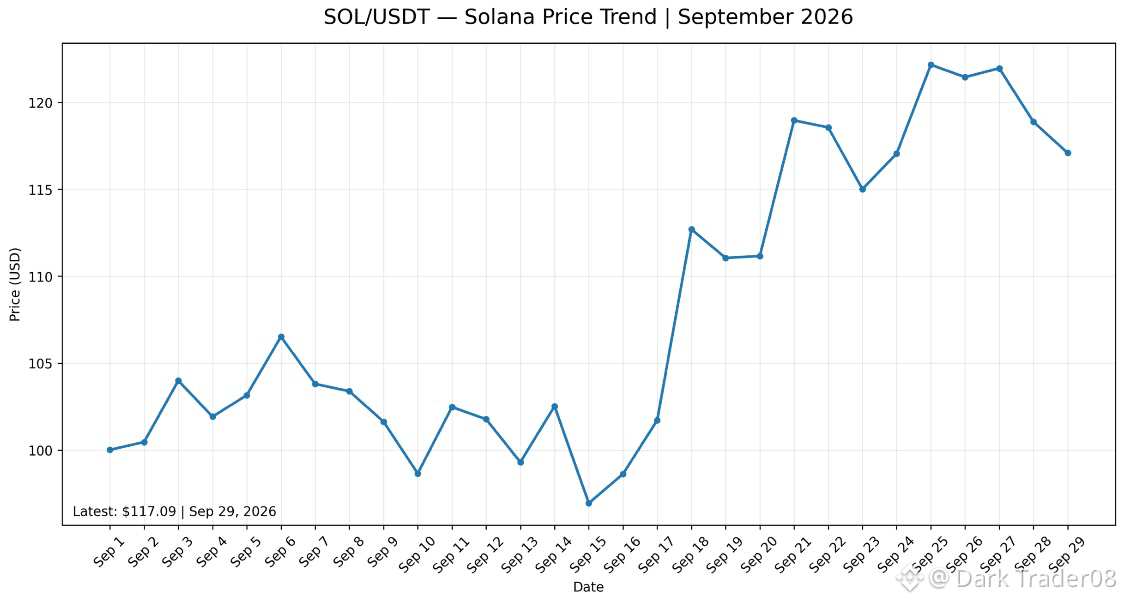
Stand 29. September 2026 liegt SOL bei etwa 116,60 US-Dollar, rund 4% niedriger in 24 Stunden, bei einer Marktkapitalisierung von ungefähr 68,5 Mrd. US-Dollar.
Solana-ETFs verzeichneten am 25. September etwa 86,7 Mio. US-Dollar an Zuflüssen; kumulierte Nettozuflüsse liegen laut dem Tracker von SolanaFloor bei rund 1,62 Mrd. US-Dollar.
* ⚡ Netzwerk-Upgrades: Solanas Alpenglow-Upgrade zielt auf eine deutlich schnellere Transaktionsfinalität ab, möglicherweise bei etwa 150 Millisekunden, obwohl der genaue Zeitplan für das Mainnet noch geklärt werden muss.
* 🔥 Netzwerk-Nutzung: Jüngste Berichte deuten darauf hin, dass die monatlichen Solana-Transaktionen 5 Milliarden überstiegen haben und damit eine erhebliche Aktivität im Netzwerk zeigen.
* ⚠️ Kurzfristiges Risiko: SOL ist von seinen jüngsten Hochs zurückgekommen, während breitere Krypto-Märkte unter Druck stehen, ausgelöst durch erhöhte US-Staatsanleiherenditen und Ölpreise.
Fazit: SOL vereint derzeit eine Kombination aus hoher Netzwerkaktivität, institutioneller ETF-Nachfrage und wichtigen Protokoll-Upgrades, doch der Rückgang von ~4% pro Tag zeigt, dass die Volatilität weiterhin hoch ist. Der Bereich von 100–120 US-Dollar ist es wert, im Blick zu behalten, um zu sehen, wie sich der Markt als Nächstes entwickelt. #solanAnalysis #ChainlinkLaunchesCCIP2WithEnterpriseVerification
{spot}(SOLUSDT)
$SOL 🔥🔥🔥— neueste Kurzüberprüfung
Stand 29. September 2026 liegt SOL bei etwa 116,60 US-Dollar, rund 4% niedriger in 24 Stunden, bei einer Marktkapitalisierung von ungefähr 68,5 Mrd. US-Dollar.
Solana-ETFs verzeichneten am 25. September etwa 86,7 Mio. US-Dollar an Zuflüssen; kumulierte Nettozuflüsse liegen laut dem Tracker von SolanaFloor bei rund 1,62 Mrd. US-Dollar.
* ⚡ Netzwerk-Upgrades: Solanas Alpenglow-Upgrade zielt auf eine deutlich schnellere Transaktionsfinalität ab, möglicherweise bei etwa 150 Millisekunden, obwohl der genaue Zeitplan für das Mainnet noch geklärt werden muss.
* 🔥 Netzwerk-Nutzung: Jüngste Berichte deuten darauf hin, dass die monatlichen Solana-Transaktionen 5 Milliarden überstiegen haben und damit eine erhebliche Aktivität im Netzwerk zeigen.
* ⚠️ Kurzfristiges Risiko: SOL ist von seinen jüngsten Hochs zurückgekommen, während breitere Krypto-Märkte unter Druck stehen, ausgelöst durch erhöhte US-Staatsanleiherenditen und Ölpreise.
Fazit: SOL vereint derzeit eine Kombination aus hoher Netzwerkaktivität, institutioneller ETF-Nachfrage und wichtigen Protokoll-Upgrades, doch der Rückgang von ~4% pro Tag zeigt, dass die Volatilität weiterhin hoch ist. Der Bereich von 100–120 US-Dollar ist es wert, im Blick zu behalten, um zu sehen, wie sich der Markt als Nächstes entwickelt. #solanAnalysis #ChainlinkLaunchesCCIP2WithEnterpriseVerification
Stand 29. September 2026 liegt SOL bei etwa 116,60 US-Dollar, rund 4% niedriger in 24 Stunden, bei einer Marktkapitalisierung von ungefähr 68,5 Mrd. US-Dollar.
Solana-ETFs verzeichneten am 25. September etwa 86,7 Mio. US-Dollar an Zuflüssen; kumulierte Nettozuflüsse liegen laut dem Tracker von SolanaFloor bei rund 1,62 Mrd. US-Dollar.
* ⚡ Netzwerk-Upgrades: Solanas Alpenglow-Upgrade zielt auf eine deutlich schnellere Transaktionsfinalität ab, möglicherweise bei etwa 150 Millisekunden, obwohl der genaue Zeitplan für das Mainnet noch geklärt werden muss.
* 🔥 Netzwerk-Nutzung: Jüngste Berichte deuten darauf hin, dass die monatlichen Solana-Transaktionen 5 Milliarden überstiegen haben und damit eine erhebliche Aktivität im Netzwerk zeigen.
* ⚠️ Kurzfristiges Risiko: SOL ist von seinen jüngsten Hochs zurückgekommen, während breitere Krypto-Märkte unter Druck stehen, ausgelöst durch erhöhte US-Staatsanleiherenditen und Ölpreise.
Fazit: SOL vereint derzeit eine Kombination aus hoher Netzwerkaktivität, institutioneller ETF-Nachfrage und wichtigen Protokoll-Upgrades, doch der Rückgang von ~4% pro Tag zeigt, dass die Volatilität weiterhin hoch ist. Der Bereich von 100–120 US-Dollar ist es wert, im Blick zu behalten, um zu sehen, wie sich der Markt als Nächstes entwickelt. #solanAnalysis #ChainlinkLaunchesCCIP2WithEnterpriseVerification
91
Übersetzung ansehen
$BTC #BitMineETHHoldingsTop6Million #StrategyAdds1666BTCHoldingsReach847666 #ChainlinkLaunchesCCIP2WithEnterpriseVerification — latest analysis
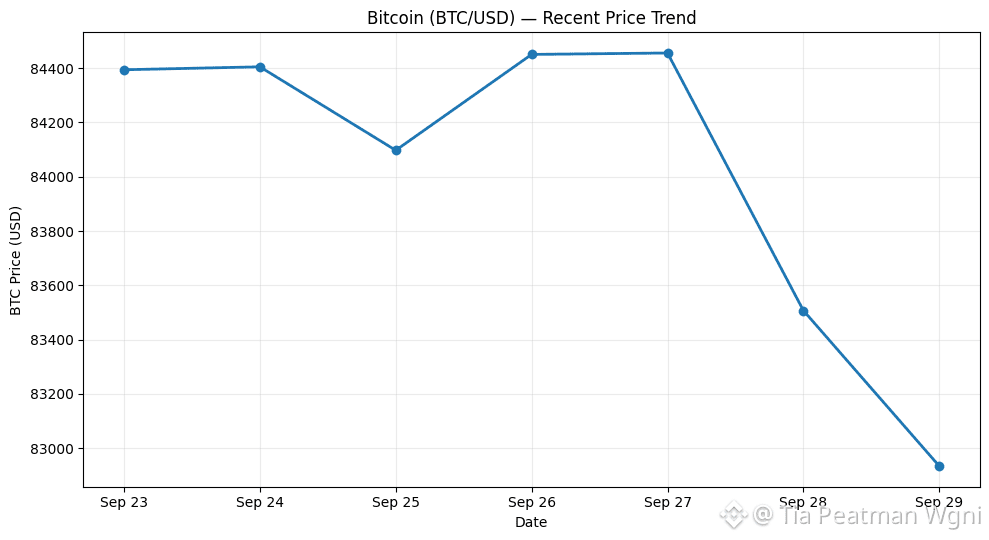
As of September 29, 2026, Bitcoin is trading around $83,000, down roughly 0.7% over 24 hours.
What the chart shows: BTC has pulled back from the $86K+ area reached earlier in September. Higher U.S. Treasury yields are currently putting pressure on risk assets, while BTC’s recent decline has extended to several sessions.
Key levels:
* Support: around $82K–$83K
* Near-term resistance: roughly $84K–$86K
* A sustained move above $86K would change the short-term technical picture; losing the $82K area would indicate additional downside pressure.
There are also constructive factors: Binance Research reports that spot Bitcoin ETF flows have recently turned positive, including a $999M single-day inflow on September 21, while BTC has reclaimed its 50-week moving average.
Bottom line: BTC is currently in a pullback/consolidation phase around $83K, with macro conditions—particularly Treasury yields—and continued ETF demand likely to remain important near-term drivers. This is market analysis, not a prediction or investment recommendation.
$BTC #BitMineETHHoldingsTop6Million #StrategyAdds1666BTCHoldingsReach847666 #ChainlinkLaunchesCCIP2WithEnterpriseVerification — latest analysis
As of September 29, 2026, Bitcoin is trading around $83,000, down roughly 0.7% over 24 hours.
What the chart shows: BTC has pulled back from the $86K+ area reached earlier in September. Higher U.S. Treasury yields are currently putting pressure on risk assets, while BTC’s recent decline has extended to several sessions.
Key levels:
* Support: around $82K–$83K
* Near-term resistance: roughly $84K–$86K
* A sustained move above $86K would change the short-term technical picture; losing the $82K area would indicate additional downside pressure.
There are also constructive factors: Binance Research reports that spot Bitcoin ETF flows have recently turned positive, including a $999M single-day inflow on September 21, while BTC has reclaimed its 50-week moving average.
Bottom line: BTC is currently in a pullback/consolidation phase around $83K, with macro conditions—particularly Treasury yields—and continued ETF demand likely to remain important near-term drivers. This is market analysis, not a prediction or investment recommendation.
As of September 29, 2026, Bitcoin is trading around $83,000, down roughly 0.7% over 24 hours.
What the chart shows: BTC has pulled back from the $86K+ area reached earlier in September. Higher U.S. Treasury yields are currently putting pressure on risk assets, while BTC’s recent decline has extended to several sessions.
Key levels:
* Support: around $82K–$83K
* Near-term resistance: roughly $84K–$86K
* A sustained move above $86K would change the short-term technical picture; losing the $82K area would indicate additional downside pressure.
There are also constructive factors: Binance Research reports that spot Bitcoin ETF flows have recently turned positive, including a $999M single-day inflow on September 21, while BTC has reclaimed its 50-week moving average.
Bottom line: BTC is currently in a pullback/consolidation phase around $83K, with macro conditions—particularly Treasury yields—and continued ETF demand likely to remain important near-term drivers. This is market analysis, not a prediction or investment recommendation.
88
Anmelden und weiter Inhalte entdecken
Krypto-Nutzer weltweit auf Binance Square kennenlernen
⚡️ Bleib in Sachen Krypto stets am Puls.
💬 Die weltgrößte Kryptobörse vertraut darauf.
👍 Erhalte verlässliche Einblicke von verifizierten Creators.
E-Mail-Adresse/Telefonnummer