

Adam Smith
15 Beiträge

Adam Smith
Melden
Nutzer blockieren
Trade eröffnen
Gelegenheitstrader
5.7 Jahre
6 Following
34 Follower
22 Like gegeben
Beiträge
Portfolio
Alle
Zitierungen
·
--
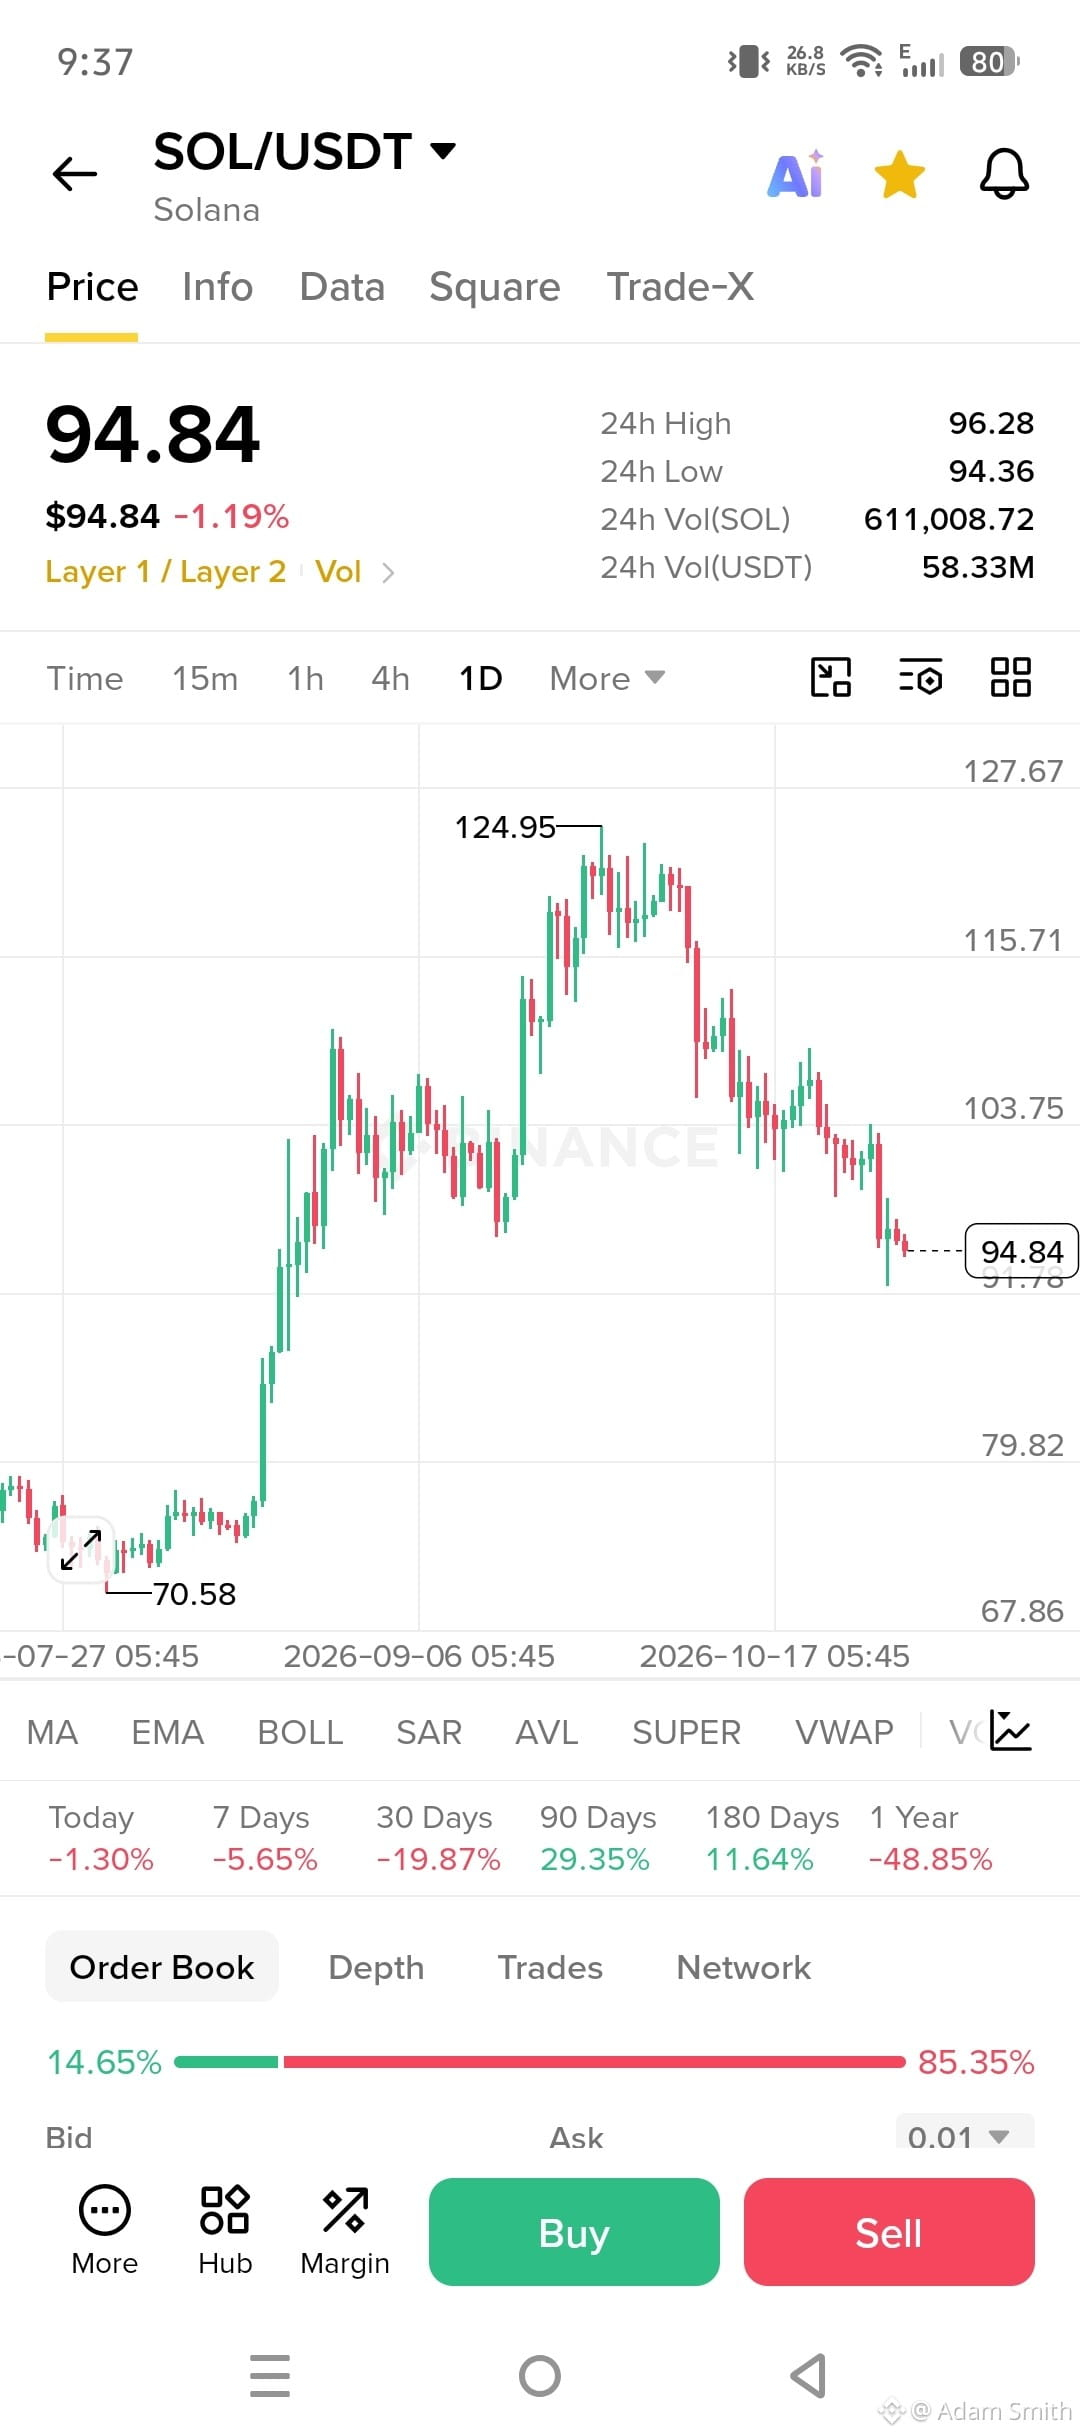
🔥 $SOL / $USDT: Wichtige Marktlevels & Strategie 📊
Ob du SOL/USDT am Spotmarkt oder 1000SOLUSDT-Futures handelst – hier kommt deine kompakte technische Analyse:
🧠 Fundamentaldaten & technische Analyse
* FA: Hoher PoH/PoS-Durchsatz sorgt für Finalität in unter einer Sekunde, ein hohes DeFi-/DApp-Volumen und institutionelle Akzeptanz.
* TA: Behalte die 50er- und 200er-EMAs im Tageschart im Blick. Ein Kurs darüber deutet auf einen starken mittelfristigen Trend hin.
* Derivate: Ein hohes Open Interest (OI) in Verbindung mit stark steigenden Funding-Raten signalisiert ein potenzielles Risiko eines Leverage-Squeezes.
🎯 Wichtige Levels
* 🔴 Widerstand: 120–125 $ (lokale Hürde) | 150 $ (übergeordnetes Ausbruchsziel)
* 🟢 Unterstützung: 85–90 $ (primäre Nachfragezone) | 70 $ (übergeordnete Unterstützung)
🟢 Bullische vs. 🔴 Bärische Trends
* Bullisches Setup: Der Kurs hält sich in den Nachfragezonen und bildet höhere Hochs bei einem RSI > 50.
👉 Strategie: Long-Einstiege bei erneuten Tests der Unterstützung mit Ziel 120 $+; SL unter den Swing-Tiefs.
* Bärisches Setup: Deutlicher Verlust einer wichtigen Unterstützung bei zunehmendem Verkaufsvolumen.
👉 Strategie: Spot-Positionen reduzieren oder Short-Positionen zur Absicherung bei schwachen Erholungsversuchen eröffnen.
🛡️ Risikoregeln
* Positionsgröße so wählen, dass die Intraday-ATR-Schwankungen von SOL verkraftbar sind.
* Immer einen strikten Stop-Loss (SL) vorab festlegen.
* Bei Futures einen niedrigen Hebel verwenden, um Liquidationskaskaden zu vermeiden.
#BinanceSquareTalks #BİNANCE #BinanceSquareFamily
> ⚠️ HAFTUNGSAUSSCHLUSS: Nur zu Bildungszwecken
> Keine Finanzberatung. Der Kryptohandel ist mit erheblichen Marktrisiken verbunden. Recherchiere immer selbst (DYOR).
🔥 $SOL / $USDT: Wichtige Marktlevels & Strategie 📊
Ob du SOL/USDT am Spotmarkt oder 1000SOLUSDT-Futures handelst – hier kommt deine kompakte technische Analyse:
🧠 Fundamentaldaten & technische Analyse
* FA: Hoher PoH/PoS-Durchsatz sorgt für Finalität in unter einer Sekunde, ein hohes DeFi-/DApp-Volumen und institutionelle Akzeptanz.
* TA: Behalte die 50er- und 200er-EMAs im Tageschart im Blick. Ein Kurs darüber deutet auf einen starken mittelfristigen Trend hin.
* Derivate: Ein hohes Open Interest (OI) in Verbindung mit stark steigenden Funding-Raten signalisiert ein potenzielles Risiko eines Leverage-Squeezes.
🎯 Wichtige Levels
* 🔴 Widerstand: 120–125 $ (lokale Hürde) | 150 $ (übergeordnetes Ausbruchsziel)
* 🟢 Unterstützung: 85–90 $ (primäre Nachfragezone) | 70 $ (übergeordnete Unterstützung)
🟢 Bullische vs. 🔴 Bärische Trends
* Bullisches Setup: Der Kurs hält sich in den Nachfragezonen und bildet höhere Hochs bei einem RSI > 50.
👉 Strategie: Long-Einstiege bei erneuten Tests der Unterstützung mit Ziel 120 $+; SL unter den Swing-Tiefs.
* Bärisches Setup: Deutlicher Verlust einer wichtigen Unterstützung bei zunehmendem Verkaufsvolumen.
👉 Strategie: Spot-Positionen reduzieren oder Short-Positionen zur Absicherung bei schwachen Erholungsversuchen eröffnen.
🛡️ Risikoregeln
* Positionsgröße so wählen, dass die Intraday-ATR-Schwankungen von SOL verkraftbar sind.
* Immer einen strikten Stop-Loss (SL) vorab festlegen.
* Bei Futures einen niedrigen Hebel verwenden, um Liquidationskaskaden zu vermeiden.
#BinanceSquareTalks #BİNANCE #BinanceSquareFamily
> ⚠️ HAFTUNGSAUSSCHLUSS: Nur zu Bildungszwecken
> Keine Finanzberatung. Der Kryptohandel ist mit erheblichen Marktrisiken verbunden. Recherchiere immer selbst (DYOR).
Ob du SOL/USDT am Spotmarkt oder 1000SOLUSDT-Futures handelst – hier kommt deine kompakte technische Analyse:
🧠 Fundamentaldaten & technische Analyse
* FA: Hoher PoH/PoS-Durchsatz sorgt für Finalität in unter einer Sekunde, ein hohes DeFi-/DApp-Volumen und institutionelle Akzeptanz.
* TA: Behalte die 50er- und 200er-EMAs im Tageschart im Blick. Ein Kurs darüber deutet auf einen starken mittelfristigen Trend hin.
* Derivate: Ein hohes Open Interest (OI) in Verbindung mit stark steigenden Funding-Raten signalisiert ein potenzielles Risiko eines Leverage-Squeezes.
🎯 Wichtige Levels
* 🔴 Widerstand: 120–125 $ (lokale Hürde) | 150 $ (übergeordnetes Ausbruchsziel)
* 🟢 Unterstützung: 85–90 $ (primäre Nachfragezone) | 70 $ (übergeordnete Unterstützung)
🟢 Bullische vs. 🔴 Bärische Trends
* Bullisches Setup: Der Kurs hält sich in den Nachfragezonen und bildet höhere Hochs bei einem RSI > 50.
👉 Strategie: Long-Einstiege bei erneuten Tests der Unterstützung mit Ziel 120 $+; SL unter den Swing-Tiefs.
* Bärisches Setup: Deutlicher Verlust einer wichtigen Unterstützung bei zunehmendem Verkaufsvolumen.
👉 Strategie: Spot-Positionen reduzieren oder Short-Positionen zur Absicherung bei schwachen Erholungsversuchen eröffnen.
🛡️ Risikoregeln
* Positionsgröße so wählen, dass die Intraday-ATR-Schwankungen von SOL verkraftbar sind.
* Immer einen strikten Stop-Loss (SL) vorab festlegen.
* Bei Futures einen niedrigen Hebel verwenden, um Liquidationskaskaden zu vermeiden.
#BinanceSquareTalks #BİNANCE #BinanceSquareFamily
> ⚠️ HAFTUNGSAUSSCHLUSS: Nur zu Bildungszwecken
> Keine Finanzberatung. Der Kryptohandel ist mit erheblichen Marktrisiken verbunden. Recherchiere immer selbst (DYOR).
44
·
--
Übersetzung ansehen
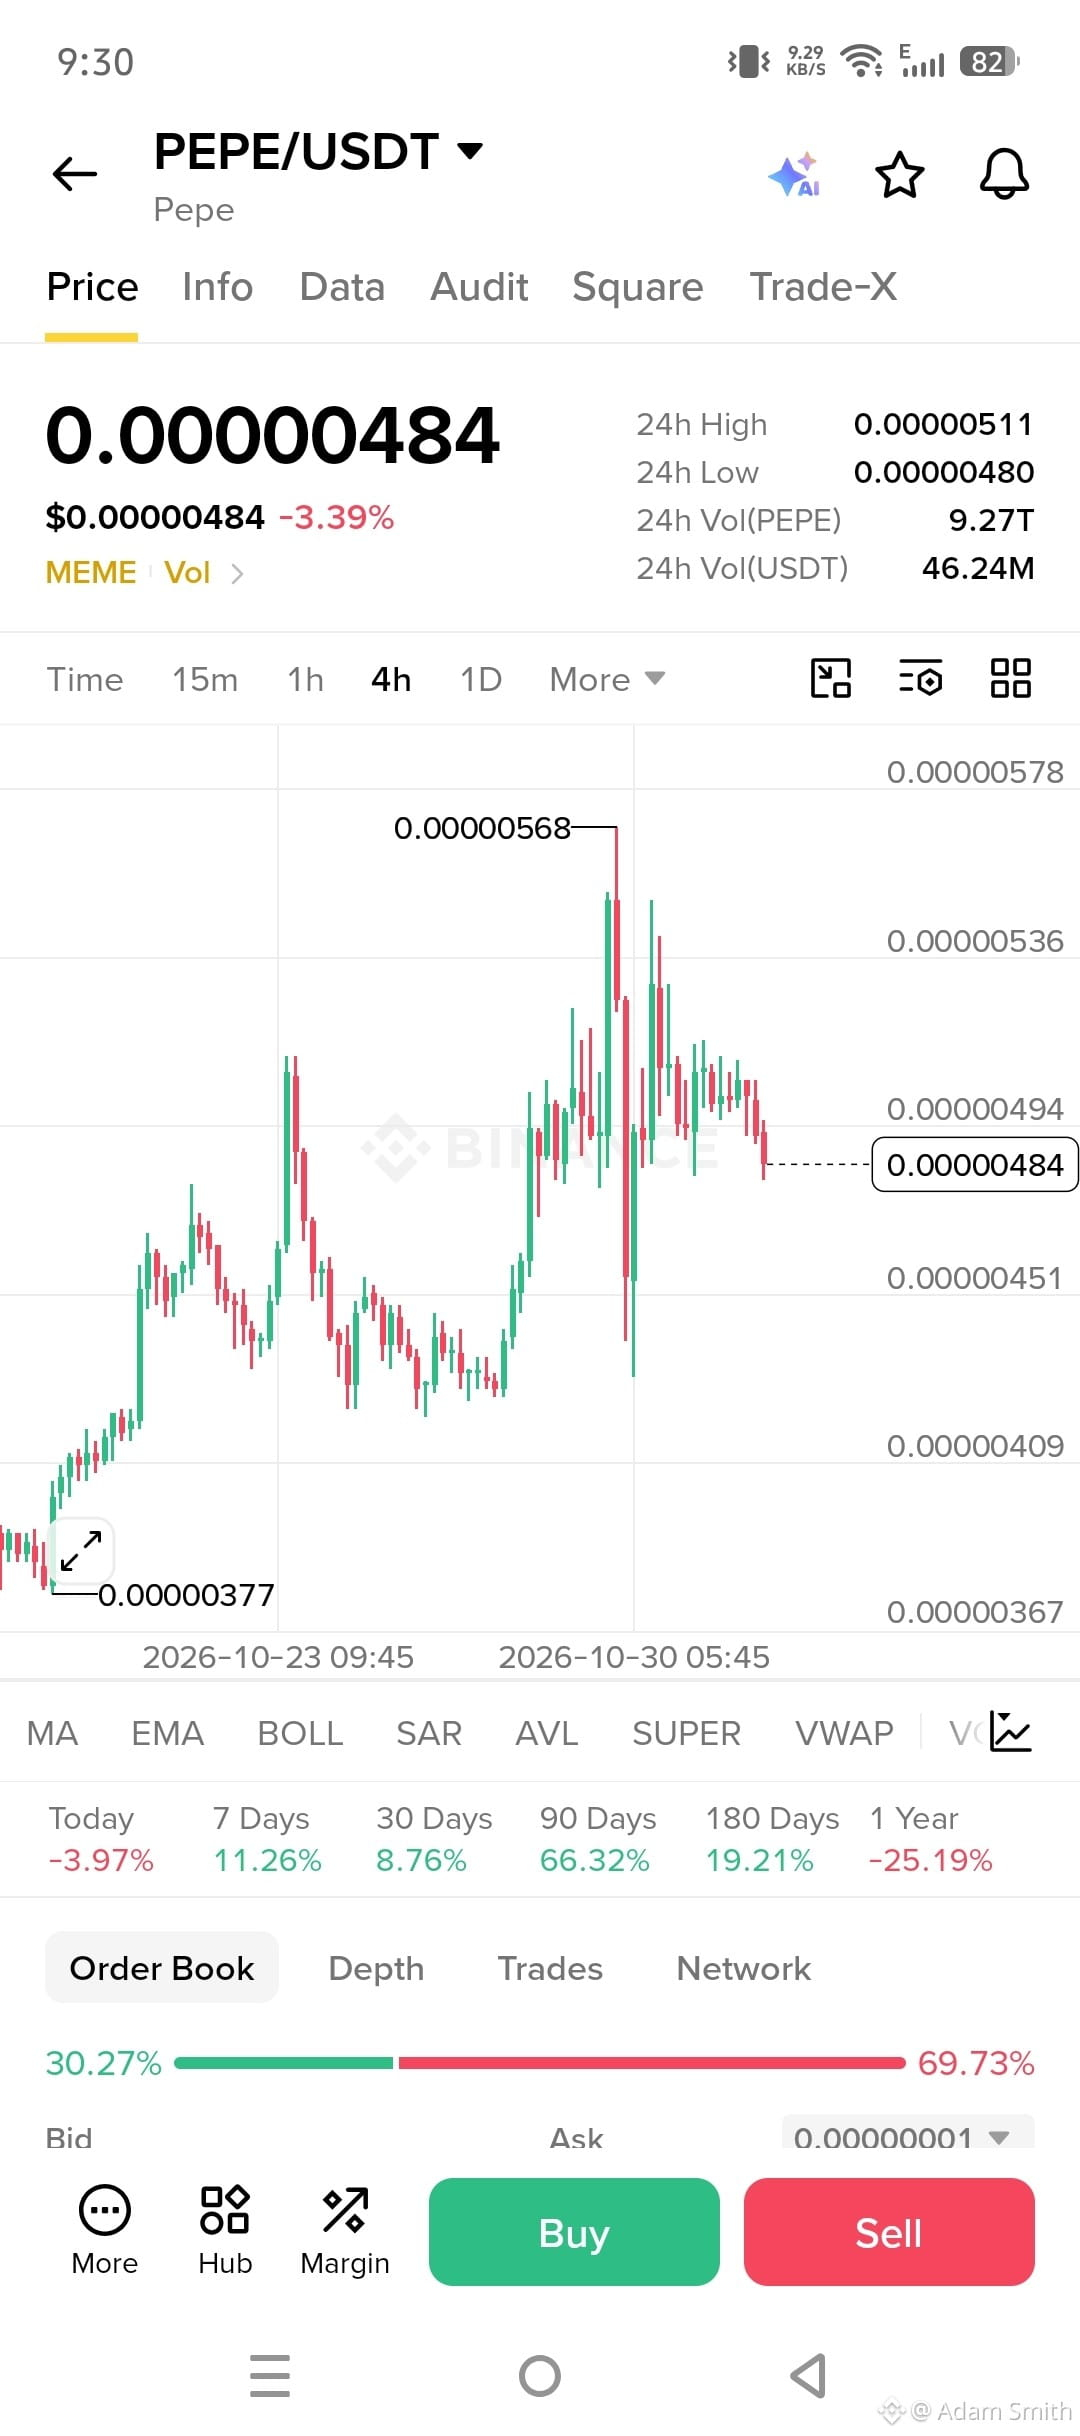
🔥 $PEPE / $USDT: Technical & Fundamental Breakdown 📊
🧠 Fundamental Analysis (FA)
* 0% Transaction Tax: Frictionless trading structure driving high volume from automated arbitrage and market makers.
* Liquid Risk-On Proxy: Trades as a high-beta proxy for broader Ethereum ecosystem sentiment.
* Fixed Circulating Supply: Driven purely by capital flow velocity and social momentum with zero token inflation.
📉 Technical Analysis (TA)
* Moving Averages: Holding above the 50 & 200 EMAs confirms structural bullish momentum; losing them shifts bias to neutral/bearish.
* Derivatives Warning: Rapidly expanding Open Interest (OI) coupled with high positive funding signals overcrowded long exposure.
* Volume Confirmation: Valid breakouts require expanding spot volume to avoid leverage sweeps and mean-reversion traps.
🟢 Bullish Trend vs. 🔴 Bearish Trend
* Bullish Setup: Buyers defend key demand zones, forming higher highs with RSI > 50 and positive MACD crossovers.
* Strategy: Long confirmed support retests with strict stops beneath swing lows.
* Bearish Setup: Breakdown below major support with lower lows, bearish MACD expansion, and long liquidation cascades.
* Strategy: Reduce spot exposure or enter short hedges on weak, low-volume bounce attempts.
🛡️ Risk Management Protocols
* Size to Volatility: Account for PEPE's elevated ATR—size small to handle wide swings.
* Hard Invalidation: Set a non-negotiable Stop-Loss (SL) prior to order entry.
* Low Leverage: Avoid high leverage on perpetual contracts to prevent flash-liquidation events.
> ⚠️ DISCLAIMER: Educational Purpose Only
> This post is strictly for educational and informational purposes only and does not constitute financial or investment advice. Cryptocurrencies are highly volatile and speculative. Always Do Your Own Research (DYOR) and manage your risk strictly.
🔥 $PEPE / $USDT: Technical & Fundamental Breakdown 📊
🧠 Fundamental Analysis (FA)
* 0% Transaction Tax: Frictionless trading structure driving high volume from automated arbitrage and market makers.
* Liquid Risk-On Proxy: Trades as a high-beta proxy for broader Ethereum ecosystem sentiment.
* Fixed Circulating Supply: Driven purely by capital flow velocity and social momentum with zero token inflation.
📉 Technical Analysis (TA)
* Moving Averages: Holding above the 50 & 200 EMAs confirms structural bullish momentum; losing them shifts bias to neutral/bearish.
* Derivatives Warning: Rapidly expanding Open Interest (OI) coupled with high positive funding signals overcrowded long exposure.
* Volume Confirmation: Valid breakouts require expanding spot volume to avoid leverage sweeps and mean-reversion traps.
🟢 Bullish Trend vs. 🔴 Bearish Trend
* Bullish Setup: Buyers defend key demand zones, forming higher highs with RSI > 50 and positive MACD crossovers.
* Strategy: Long confirmed support retests with strict stops beneath swing lows.
* Bearish Setup: Breakdown below major support with lower lows, bearish MACD expansion, and long liquidation cascades.
* Strategy: Reduce spot exposure or enter short hedges on weak, low-volume bounce attempts.
🛡️ Risk Management Protocols
* Size to Volatility: Account for PEPE's elevated ATR—size small to handle wide swings.
* Hard Invalidation: Set a non-negotiable Stop-Loss (SL) prior to order entry.
* Low Leverage: Avoid high leverage on perpetual contracts to prevent flash-liquidation events.
> ⚠️ DISCLAIMER: Educational Purpose Only
> This post is strictly for educational and informational purposes only and does not constitute financial or investment advice. Cryptocurrencies are highly volatile and speculative. Always Do Your Own Research (DYOR) and manage your risk strictly.
🧠 Fundamental Analysis (FA)
* 0% Transaction Tax: Frictionless trading structure driving high volume from automated arbitrage and market makers.
* Liquid Risk-On Proxy: Trades as a high-beta proxy for broader Ethereum ecosystem sentiment.
* Fixed Circulating Supply: Driven purely by capital flow velocity and social momentum with zero token inflation.
📉 Technical Analysis (TA)
* Moving Averages: Holding above the 50 & 200 EMAs confirms structural bullish momentum; losing them shifts bias to neutral/bearish.
* Derivatives Warning: Rapidly expanding Open Interest (OI) coupled with high positive funding signals overcrowded long exposure.
* Volume Confirmation: Valid breakouts require expanding spot volume to avoid leverage sweeps and mean-reversion traps.
🟢 Bullish Trend vs. 🔴 Bearish Trend
* Bullish Setup: Buyers defend key demand zones, forming higher highs with RSI > 50 and positive MACD crossovers.
* Strategy: Long confirmed support retests with strict stops beneath swing lows.
* Bearish Setup: Breakdown below major support with lower lows, bearish MACD expansion, and long liquidation cascades.
* Strategy: Reduce spot exposure or enter short hedges on weak, low-volume bounce attempts.
🛡️ Risk Management Protocols
* Size to Volatility: Account for PEPE's elevated ATR—size small to handle wide swings.
* Hard Invalidation: Set a non-negotiable Stop-Loss (SL) prior to order entry.
* Low Leverage: Avoid high leverage on perpetual contracts to prevent flash-liquidation events.
> ⚠️ DISCLAIMER: Educational Purpose Only
> This post is strictly for educational and informational purposes only and does not constitute financial or investment advice. Cryptocurrencies are highly volatile and speculative. Always Do Your Own Research (DYOR) and manage your risk strictly.
91
·
--
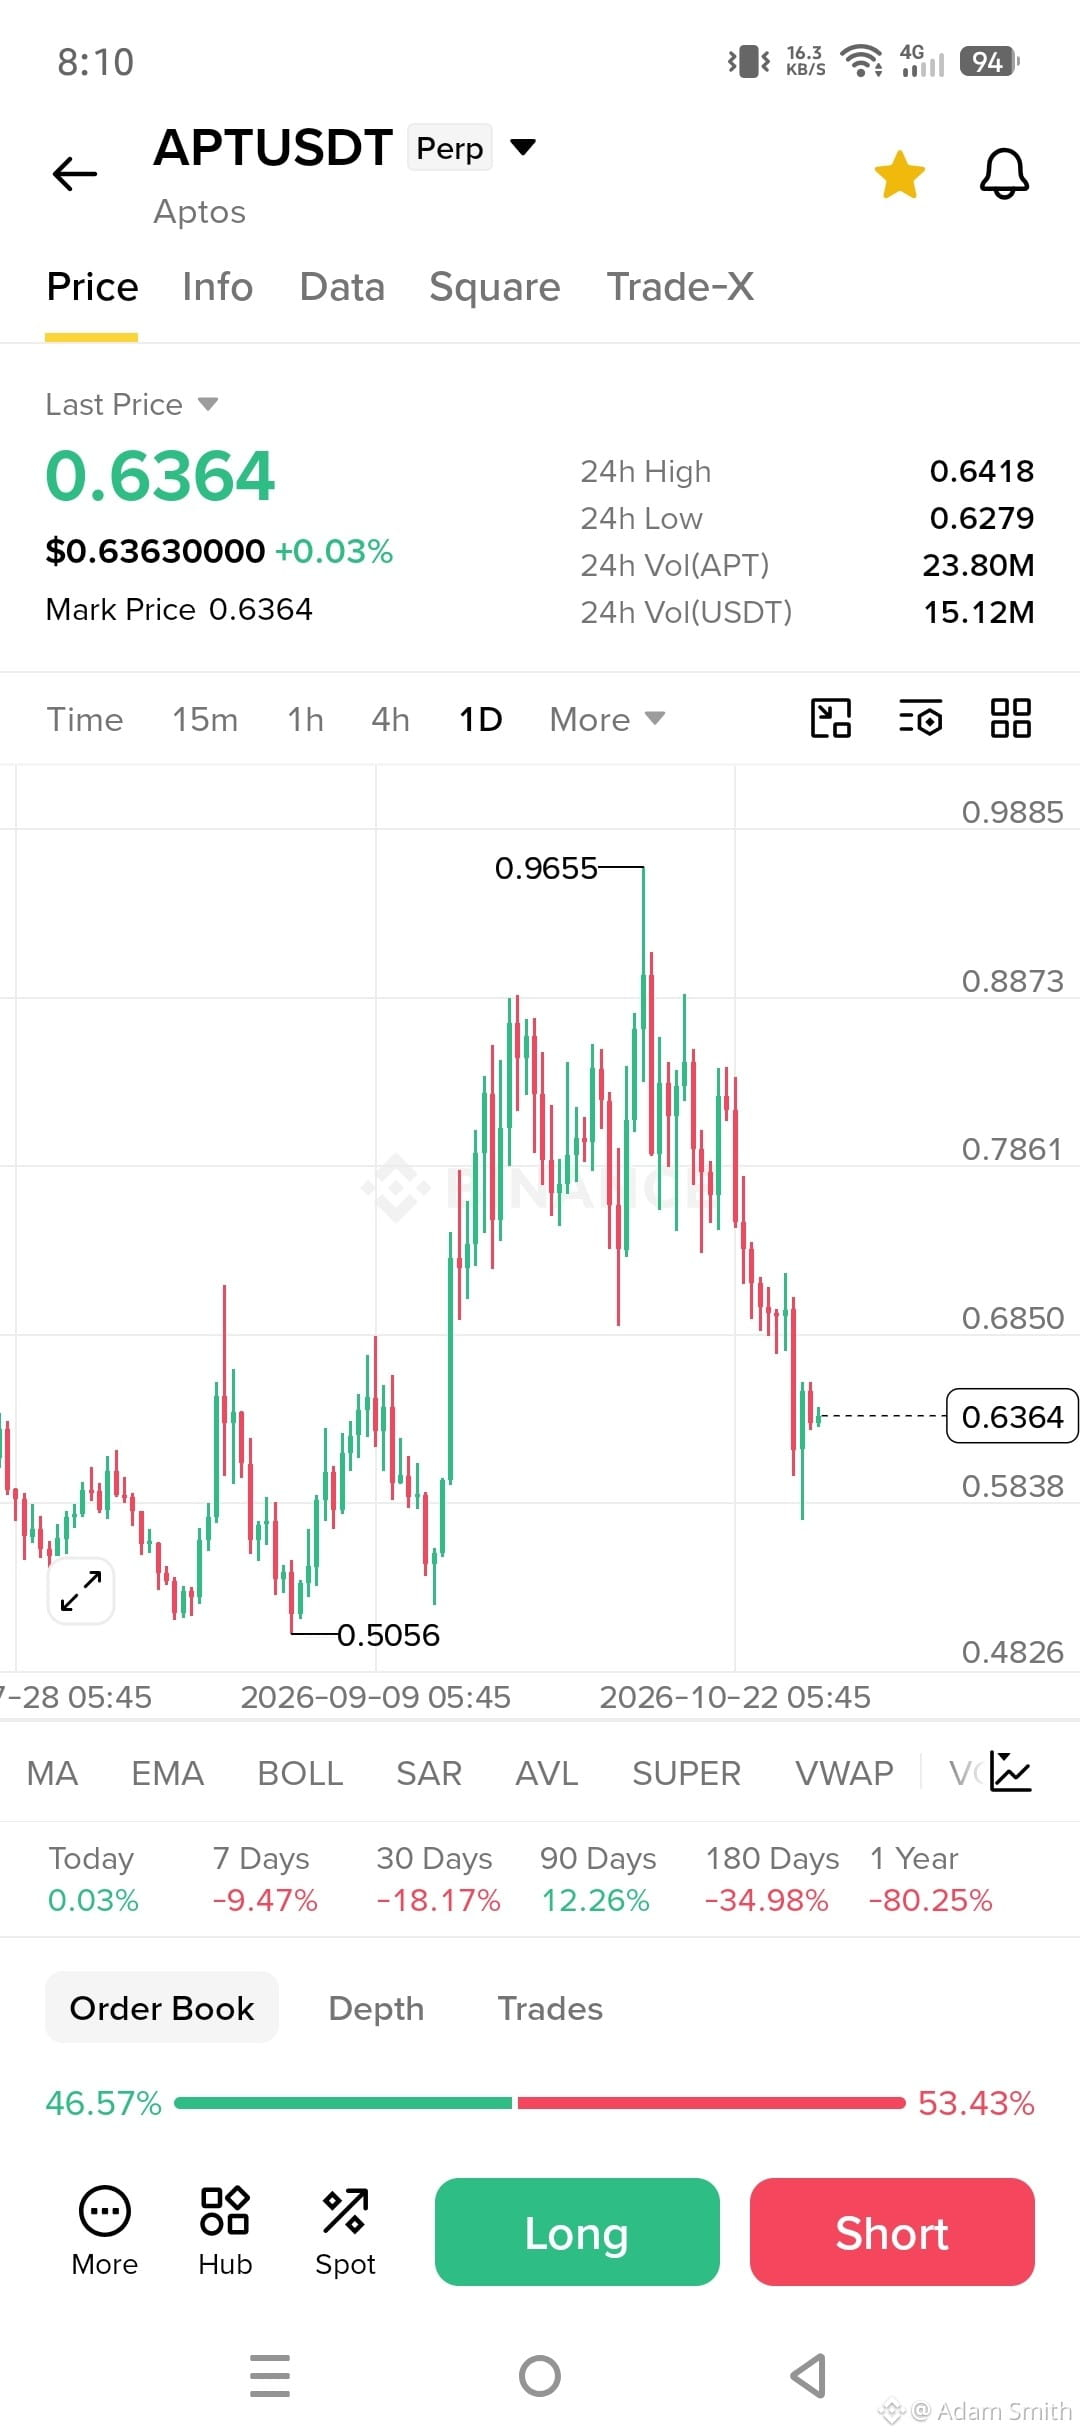
🔍 Marktbeobachtung & gründliche Recherche: Analyse von Aptos ($APT) 📊
Aptos (APT) bleibt eine leistungsstarke Layer-1-Blockchain, die angesichts der sich wandelnden Marktdynamik genau beobachtet werden sollte. Hier findest du eine Übersicht über die wichtigsten Fundamentaldaten, die jüngste Kursentwicklung, entscheidende Kursmarken und strukturelle Impulsgeber.
1. Gründliche Fundamentalanalyse ⛓️
* Move-Architektur: Aptos wurde von ehemaligen Meta-Ingenieuren entwickelt und setzt auf die Programmiersprache Move sowie die Block-STM-Engine, um Transaktionen für hohe Geschwindigkeit parallel auszuführen.
* Wachstum des Ökosystems: Beobachte das Wachstum des TVL, die DEX-Aktivität, Liquid-Staking-Protokolle und RWA-Integrationen (Real-World-Assets) als zentrale Kennzahlen für den Zustand des Ökosystems.
* Angebotsdynamik: Behalte die geplanten Token-Freischaltungen und die monatlichen Staking-Ausgaben im Verhältnis zu den Burn-Raten im Blick, da Veränderungen des Umlaufangebots die langfristige Aufnahme des Angebots durch den Markt beeinflussen.
2. Technische Marktbeobachtung & wichtige Kursmarken 📈📉
* Trend & Momentum: $APT konsolidiert derzeit innerhalb eines wichtigen Unterstützungs- und Widerstandskanals und wird nahe seinen gleitenden 50- und 200-Tage-Durchschnitten gehandelt, während der RSI auf neutrales Momentum hindeutet.
* Entscheidende Unterstützungszonen:
* Primäre Unterstützung: $0.67 – $0.70
* Starke Unterstützung: $0.58 – $0.60
* Entscheidende Widerstandszonen:
* Unmittelbarer Widerstand: $0.75 – $0.80
* Ausbruchsschwelle: $0.85 – $0.90+
3. Marktszenarien 🔮
* 🟢 Bullisches Szenario: Ein anhaltender Ausbruch mit einem täglichen Kerzenschluss über $0.80 und hohem Volumen ebnet den Weg für einen erneuten Test der jüngsten Liquiditätsziele nahe $0.95+.
* 🔴 Bärisches Szenario: Kann die Unterstützung bei $0.70 nicht gehalten werden, droht ein Rückgang in Richtung historischer Konsolidierungszonen nahe $0.58.
💬 Was hältst du von $APT? Kaufst du bei Unterstützung oder wartest du auf die Bestätigung eines Ausbruchs? Teile deine Gedanken unten mit! 👇
#BinanceSquare #Aptos #APT #CryptoAnalysis #Layer1
⚠️ Haftungsausschluss
Dieser Beitrag dient ausschließlich Bildungs- und Informationszwecken und stellt keine Finanz-, Anlage- oder Handelsberatung dar. Kryptowährungen sind hochvolatile Vermögenswerte. Führe vor jeder Transaktion stets eigene Recherchen durch (DYOR) und wende ein angemessenes Risikomanagement an.
🔍 Marktbeobachtung & gründliche Recherche: Analyse von Aptos ($APT) 📊
Aptos (APT) bleibt eine leistungsstarke Layer-1-Blockchain, die angesichts der sich wandelnden Marktdynamik genau beobachtet werden sollte. Hier findest du eine Übersicht über die wichtigsten Fundamentaldaten, die jüngste Kursentwicklung, entscheidende Kursmarken und strukturelle Impulsgeber.
1. Gründliche Fundamentalanalyse ⛓️
* Move-Architektur: Aptos wurde von ehemaligen Meta-Ingenieuren entwickelt und setzt auf die Programmiersprache Move sowie die Block-STM-Engine, um Transaktionen für hohe Geschwindigkeit parallel auszuführen.
* Wachstum des Ökosystems: Beobachte das Wachstum des TVL, die DEX-Aktivität, Liquid-Staking-Protokolle und RWA-Integrationen (Real-World-Assets) als zentrale Kennzahlen für den Zustand des Ökosystems.
* Angebotsdynamik: Behalte die geplanten Token-Freischaltungen und die monatlichen Staking-Ausgaben im Verhältnis zu den Burn-Raten im Blick, da Veränderungen des Umlaufangebots die langfristige Aufnahme des Angebots durch den Markt beeinflussen.
2. Technische Marktbeobachtung & wichtige Kursmarken 📈📉
* Trend & Momentum: $APT konsolidiert derzeit innerhalb eines wichtigen Unterstützungs- und Widerstandskanals und wird nahe seinen gleitenden 50- und 200-Tage-Durchschnitten gehandelt, während der RSI auf neutrales Momentum hindeutet.
* Entscheidende Unterstützungszonen:
* Primäre Unterstützung: $0.67 – $0.70
* Starke Unterstützung: $0.58 – $0.60
* Entscheidende Widerstandszonen:
* Unmittelbarer Widerstand: $0.75 – $0.80
* Ausbruchsschwelle: $0.85 – $0.90+
3. Marktszenarien 🔮
* 🟢 Bullisches Szenario: Ein anhaltender Ausbruch mit einem täglichen Kerzenschluss über $0.80 und hohem Volumen ebnet den Weg für einen erneuten Test der jüngsten Liquiditätsziele nahe $0.95+.
* 🔴 Bärisches Szenario: Kann die Unterstützung bei $0.70 nicht gehalten werden, droht ein Rückgang in Richtung historischer Konsolidierungszonen nahe $0.58.
💬 Was hältst du von $APT? Kaufst du bei Unterstützung oder wartest du auf die Bestätigung eines Ausbruchs? Teile deine Gedanken unten mit! 👇
#BinanceSquare #Aptos #APT #CryptoAnalysis #Layer1
⚠️ Haftungsausschluss
Dieser Beitrag dient ausschließlich Bildungs- und Informationszwecken und stellt keine Finanz-, Anlage- oder Handelsberatung dar. Kryptowährungen sind hochvolatile Vermögenswerte. Führe vor jeder Transaktion stets eigene Recherchen durch (DYOR) und wende ein angemessenes Risikomanagement an.
Aptos (APT) bleibt eine leistungsstarke Layer-1-Blockchain, die angesichts der sich wandelnden Marktdynamik genau beobachtet werden sollte. Hier findest du eine Übersicht über die wichtigsten Fundamentaldaten, die jüngste Kursentwicklung, entscheidende Kursmarken und strukturelle Impulsgeber.
1. Gründliche Fundamentalanalyse ⛓️
* Move-Architektur: Aptos wurde von ehemaligen Meta-Ingenieuren entwickelt und setzt auf die Programmiersprache Move sowie die Block-STM-Engine, um Transaktionen für hohe Geschwindigkeit parallel auszuführen.
* Wachstum des Ökosystems: Beobachte das Wachstum des TVL, die DEX-Aktivität, Liquid-Staking-Protokolle und RWA-Integrationen (Real-World-Assets) als zentrale Kennzahlen für den Zustand des Ökosystems.
* Angebotsdynamik: Behalte die geplanten Token-Freischaltungen und die monatlichen Staking-Ausgaben im Verhältnis zu den Burn-Raten im Blick, da Veränderungen des Umlaufangebots die langfristige Aufnahme des Angebots durch den Markt beeinflussen.
2. Technische Marktbeobachtung & wichtige Kursmarken 📈📉
* Trend & Momentum: $APT konsolidiert derzeit innerhalb eines wichtigen Unterstützungs- und Widerstandskanals und wird nahe seinen gleitenden 50- und 200-Tage-Durchschnitten gehandelt, während der RSI auf neutrales Momentum hindeutet.
* Entscheidende Unterstützungszonen:
* Primäre Unterstützung: $0.67 – $0.70
* Starke Unterstützung: $0.58 – $0.60
* Entscheidende Widerstandszonen:
* Unmittelbarer Widerstand: $0.75 – $0.80
* Ausbruchsschwelle: $0.85 – $0.90+
3. Marktszenarien 🔮
* 🟢 Bullisches Szenario: Ein anhaltender Ausbruch mit einem täglichen Kerzenschluss über $0.80 und hohem Volumen ebnet den Weg für einen erneuten Test der jüngsten Liquiditätsziele nahe $0.95+.
* 🔴 Bärisches Szenario: Kann die Unterstützung bei $0.70 nicht gehalten werden, droht ein Rückgang in Richtung historischer Konsolidierungszonen nahe $0.58.
💬 Was hältst du von $APT? Kaufst du bei Unterstützung oder wartest du auf die Bestätigung eines Ausbruchs? Teile deine Gedanken unten mit! 👇
#BinanceSquare #Aptos #APT #CryptoAnalysis #Layer1
⚠️ Haftungsausschluss
Dieser Beitrag dient ausschließlich Bildungs- und Informationszwecken und stellt keine Finanz-, Anlage- oder Handelsberatung dar. Kryptowährungen sind hochvolatile Vermögenswerte. Führe vor jeder Transaktion stets eigene Recherchen durch (DYOR) und wende ein angemessenes Risikomanagement an.
242
·
--
Übersetzung ansehen
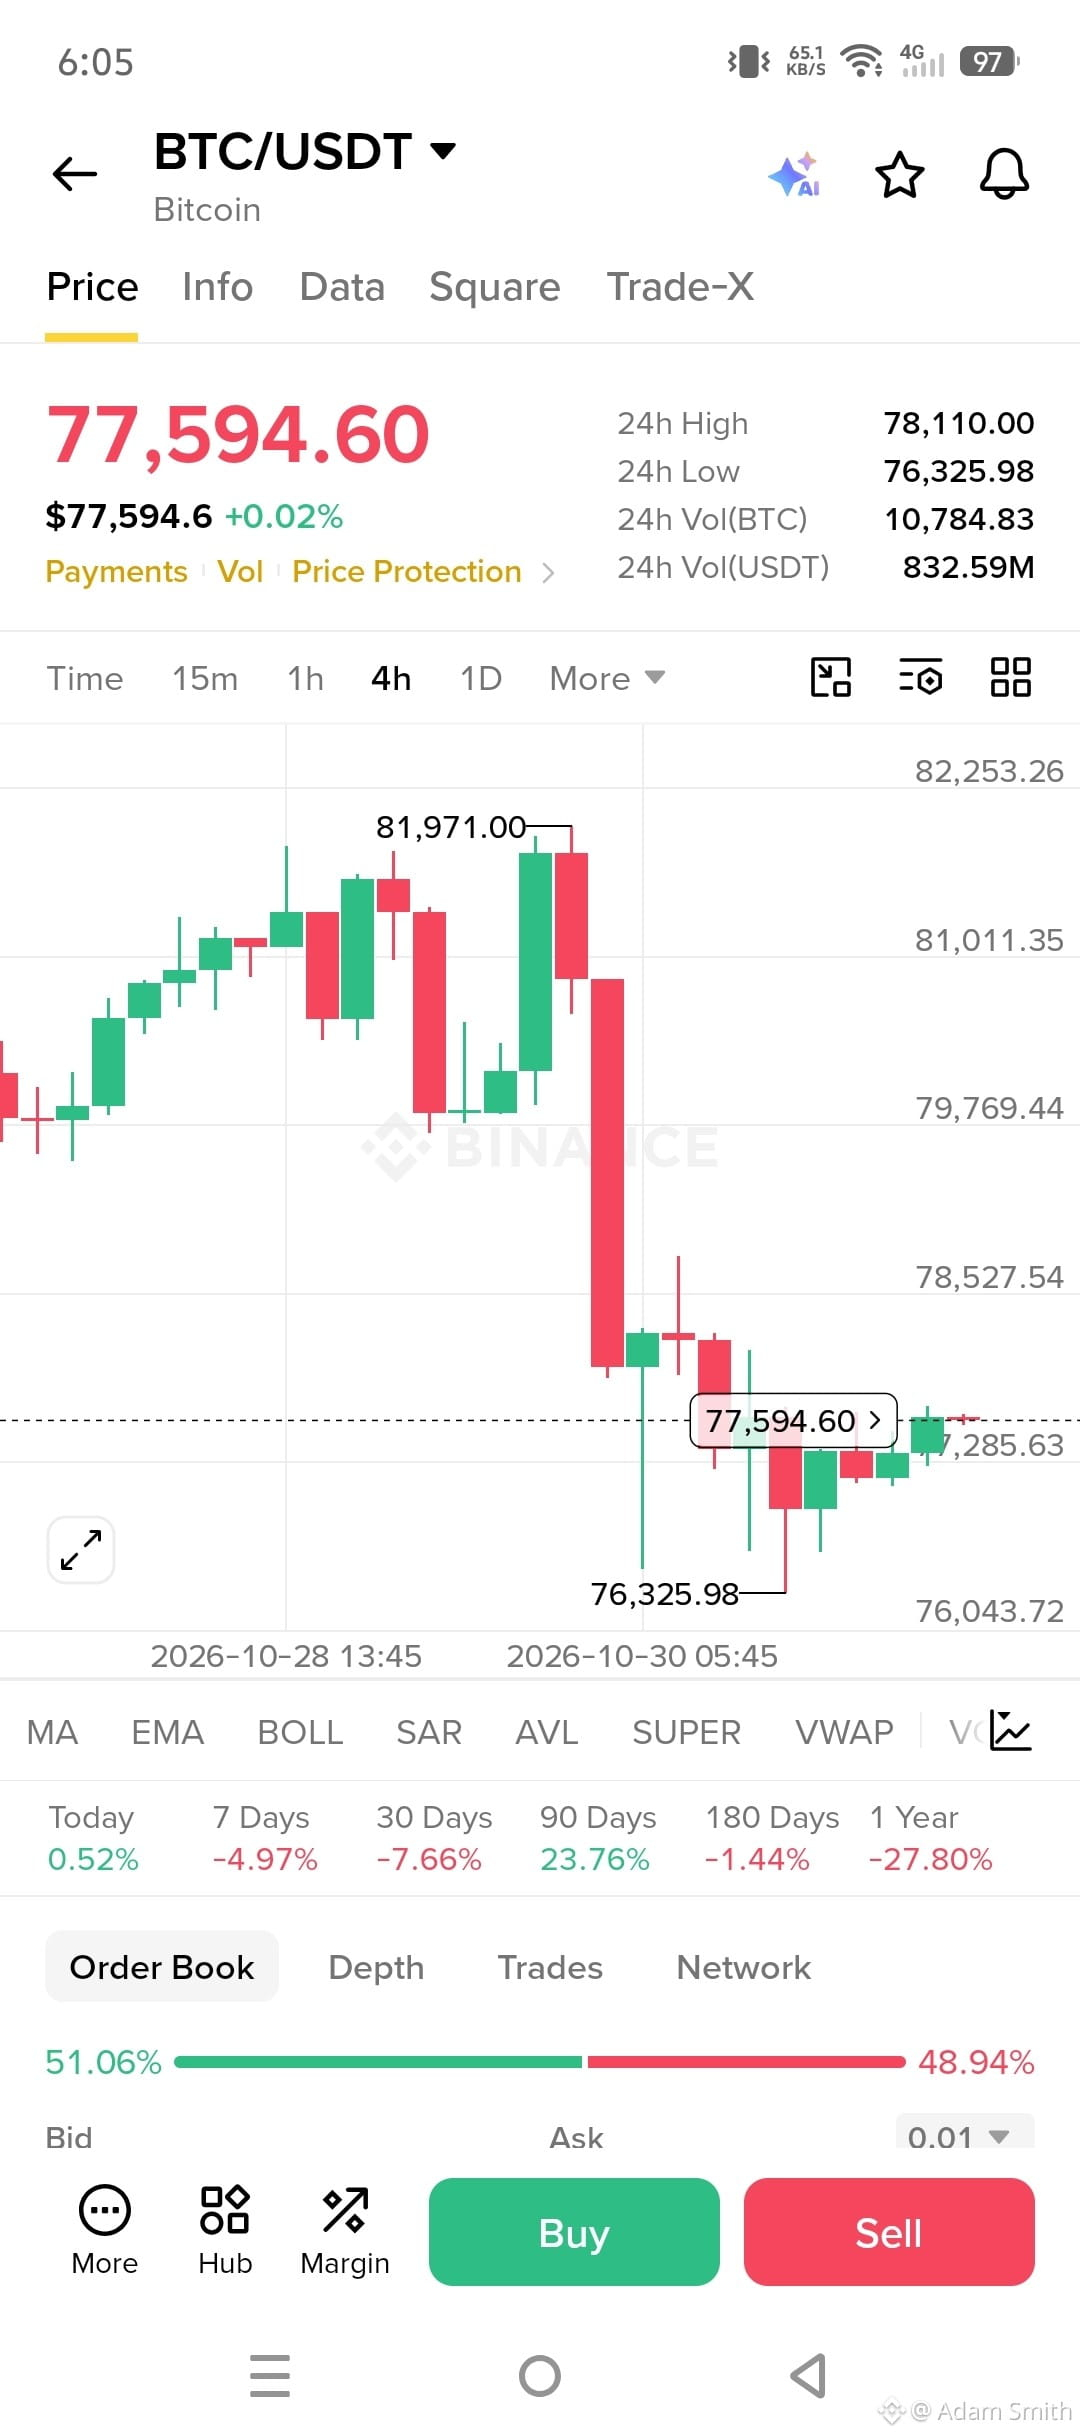
🚨 BTC/USD Update: Recovery Rally or Bull Trap? 📉
Bitcoin has shown some recent signs of recovery, but caution is warranted. Based on current chart structures, this upward momentum has a strong chance of being a buyer's trap.
* Key Retest Zone: We could see a retest around $78,000 – $78,500.
* Potential Downside Risk: If rejection occurs at this resistance level, market data indicates a potential deeper correction down toward the $62,000 – $68,000 range.
Manage your risk tightly and watch key reaction levels closely before jumping in!
⚠️ Disclaimer: This post is strictly for educational purposes and does not constitute financial advice. Cryptocurrency trading involves substantial risk, and taking any financial risk is entirely your own responsibility.
🚨 BTC/USD Update: Recovery Rally or Bull Trap? 📉
Bitcoin has shown some recent signs of recovery, but caution is warranted. Based on current chart structures, this upward momentum has a strong chance of being a buyer's trap.
* Key Retest Zone: We could see a retest around $78,000 – $78,500.
* Potential Downside Risk: If rejection occurs at this resistance level, market data indicates a potential deeper correction down toward the $62,000 – $68,000 range.
Manage your risk tightly and watch key reaction levels closely before jumping in!
⚠️ Disclaimer: This post is strictly for educational purposes and does not constitute financial advice. Cryptocurrency trading involves substantial risk, and taking any financial risk is entirely your own responsibility.
Bitcoin has shown some recent signs of recovery, but caution is warranted. Based on current chart structures, this upward momentum has a strong chance of being a buyer's trap.
* Key Retest Zone: We could see a retest around $78,000 – $78,500.
* Potential Downside Risk: If rejection occurs at this resistance level, market data indicates a potential deeper correction down toward the $62,000 – $68,000 range.
Manage your risk tightly and watch key reaction levels closely before jumping in!
⚠️ Disclaimer: This post is strictly for educational purposes and does not constitute financial advice. Cryptocurrency trading involves substantial risk, and taking any financial risk is entirely your own responsibility.
93
·
--
Übersetzung ansehen
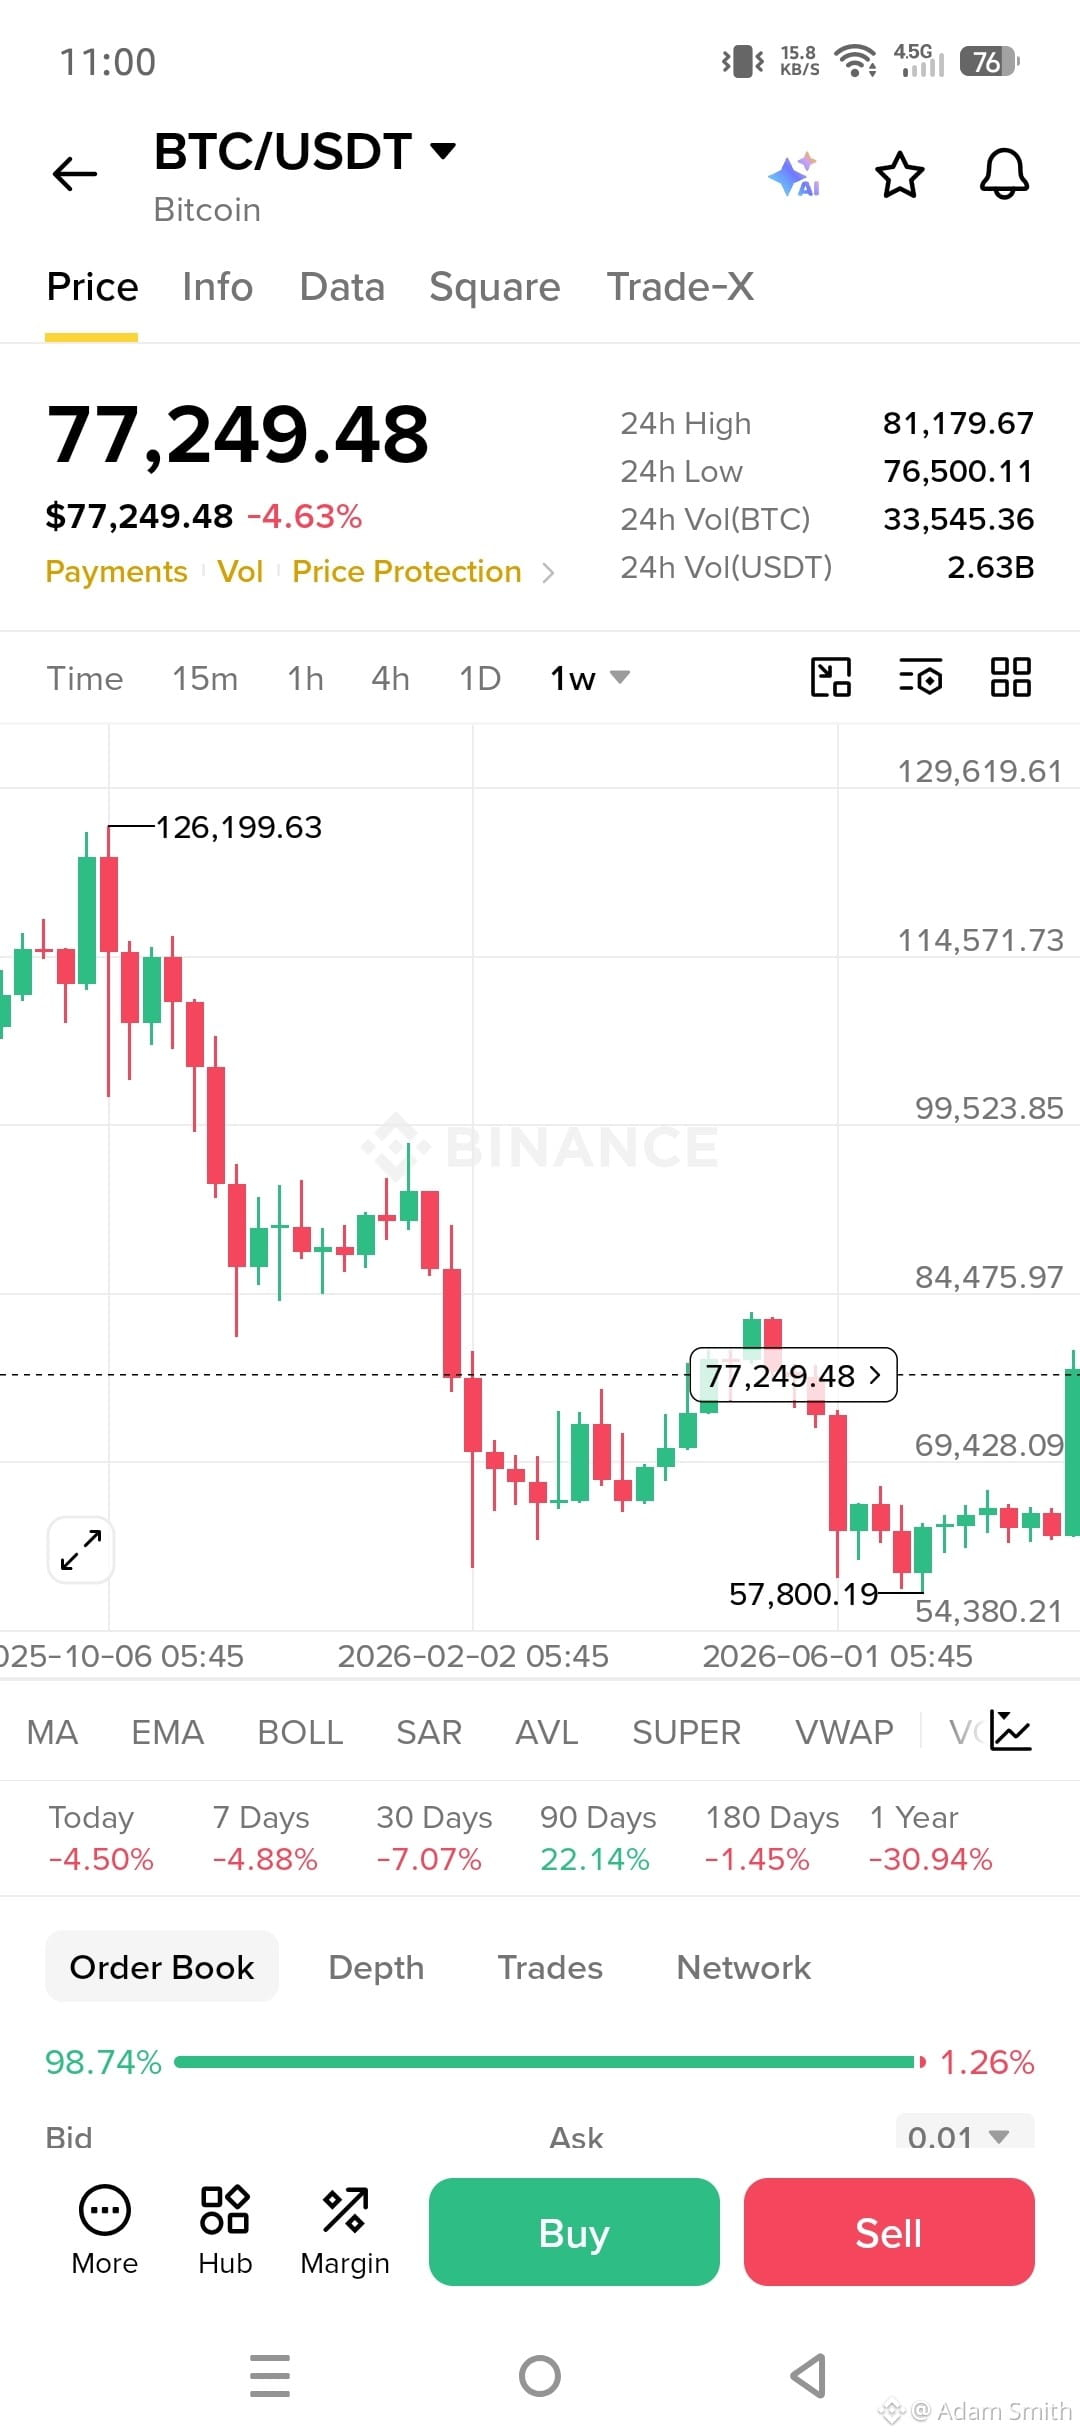
🚨 CRITICAL WEEKEND WATCH: Is BTC Setting Up for a Deeper Dump?
Hey Binance Square Fam,
Let's talk technicals. Looking at the current price action on the BTC/USD charts, the market is sitting at a very fragile crossroads.
What the Candles Are Telling Us:
* The Resistance Wall: Bulls tried to defend and push past key resistance levels following recent macro updates, but upside momentum quickly faded, leaving heavy rejection wicks.
* Support Testing: Price action continues to hover near critical psychological and structural supports. If buyers fail to step in and defend these floors before the weekly candle close this Sunday, the new batch of opening candles could flash a strong bearish continuation pattern.
* The Weekend Risk: Low weekend liquidity combined with a lack of upward momentum often invites aggressive short-term dumps. If BTC doesn't show a strong recovery and reclaim higher levels before Sunday night, we could be looking at a sweep of lower liquidity pools.
What to Watch:
* The Sunday Close: Keep a close eye on how the daily and weekly candles finalize. A weak close lacking volume favors the bears.
* Key Support Zones: Watch how the price reacts if it retests local lows. Look for volume spikes to see if bulls are actually defending or if it's a bull trap.
* Risk Management: Protect your capital, manage your leverage carefully, and avoid FOMO-buying into weak relief bounces.
Stay sharp, manage your risk, and keep your stop-losses ready! What are your moves for this weekend—are you scaling out or looking to buy the dip? Let’s discuss in the comments below! 👇
⚠️ Disclaimer: This post is for educational and informational purposes only and does not constitute financial advice. Cryptocurrency trading carries a high level of risk, and you should always do your own research (DYOR) before making any investment decisions.
#UniswapA16zSeekDeFiExemptionFromIllinoisCryptoTax #USMidtermElections #BinanceWillListPredictPREDICT #KOSPIFalls3.53%BackBelow6000 #AmazonSharesFallAbout7%InPremarketTrading
🚨 CRITICAL WEEKEND WATCH: Is BTC Setting Up for a Deeper Dump?
Hey Binance Square Fam,
Let's talk technicals. Looking at the current price action on the BTC/USD charts, the market is sitting at a very fragile crossroads.
What the Candles Are Telling Us:
* The Resistance Wall: Bulls tried to defend and push past key resistance levels following recent macro updates, but upside momentum quickly faded, leaving heavy rejection wicks.
* Support Testing: Price action continues to hover near critical psychological and structural supports. If buyers fail to step in and defend these floors before the weekly candle close this Sunday, the new batch of opening candles could flash a strong bearish continuation pattern.
* The Weekend Risk: Low weekend liquidity combined with a lack of upward momentum often invites aggressive short-term dumps. If BTC doesn't show a strong recovery and reclaim higher levels before Sunday night, we could be looking at a sweep of lower liquidity pools.
What to Watch:
* The Sunday Close: Keep a close eye on how the daily and weekly candles finalize. A weak close lacking volume favors the bears.
* Key Support Zones: Watch how the price reacts if it retests local lows. Look for volume spikes to see if bulls are actually defending or if it's a bull trap.
* Risk Management: Protect your capital, manage your leverage carefully, and avoid FOMO-buying into weak relief bounces.
Stay sharp, manage your risk, and keep your stop-losses ready! What are your moves for this weekend—are you scaling out or looking to buy the dip? Let’s discuss in the comments below! 👇
⚠️ Disclaimer: This post is for educational and informational purposes only and does not constitute financial advice. Cryptocurrency trading carries a high level of risk, and you should always do your own research (DYOR) before making any investment decisions.
#UniswapA16zSeekDeFiExemptionFromIllinoisCryptoTax #USMidtermElections #BinanceWillListPredictPREDICT #KOSPIFalls3.53%BackBelow6000 #AmazonSharesFallAbout7%InPremarketTrading
Hey Binance Square Fam,
Let's talk technicals. Looking at the current price action on the BTC/USD charts, the market is sitting at a very fragile crossroads.
What the Candles Are Telling Us:
* The Resistance Wall: Bulls tried to defend and push past key resistance levels following recent macro updates, but upside momentum quickly faded, leaving heavy rejection wicks.
* Support Testing: Price action continues to hover near critical psychological and structural supports. If buyers fail to step in and defend these floors before the weekly candle close this Sunday, the new batch of opening candles could flash a strong bearish continuation pattern.
* The Weekend Risk: Low weekend liquidity combined with a lack of upward momentum often invites aggressive short-term dumps. If BTC doesn't show a strong recovery and reclaim higher levels before Sunday night, we could be looking at a sweep of lower liquidity pools.
What to Watch:
* The Sunday Close: Keep a close eye on how the daily and weekly candles finalize. A weak close lacking volume favors the bears.
* Key Support Zones: Watch how the price reacts if it retests local lows. Look for volume spikes to see if bulls are actually defending or if it's a bull trap.
* Risk Management: Protect your capital, manage your leverage carefully, and avoid FOMO-buying into weak relief bounces.
Stay sharp, manage your risk, and keep your stop-losses ready! What are your moves for this weekend—are you scaling out or looking to buy the dip? Let’s discuss in the comments below! 👇
⚠️ Disclaimer: This post is for educational and informational purposes only and does not constitute financial advice. Cryptocurrency trading carries a high level of risk, and you should always do your own research (DYOR) before making any investment decisions.
#UniswapA16zSeekDeFiExemptionFromIllinoisCryptoTax #USMidtermElections #BinanceWillListPredictPREDICT #KOSPIFalls3.53%BackBelow6000 #AmazonSharesFallAbout7%InPremarketTrading
94
·
--
Übersetzung ansehen
Security Incident Update by Binance
Security Incident Update by Binance


Binance Announcement
·
--
Aktualisierung zum Sicherheitsvorfall (30.10.2026)
Dies ist eine allgemeine Mitteilung. Die hier erwähnten Produkte und Dienstleistungen sind möglicherweise in Ihrer Region nicht verfügbar.
Liebe Binancians,
Die vorläufigen Untersuchungen von Binance deuten darauf hin, dass der Sicherheitsvorfall möglicherweise auf den kompromittierten Laptop eines DevOps-Ingenieurs zurückzuführen ist. Dadurch konnte ein Angreifer Zugriff auf einen Service-Container erlangen und unautorisierte Auszahlungstransaktionen einreichen. Es gibt keine Hinweise darauf, dass private Schlüssel von Wallets offengelegt wurden. Sobald die Untersuchung abgeschlossen und die Fakten vollständig verifiziert sind, werden wir einen ausführlichen technischen Bericht zum Vorfall veröffentlichen.
Liebe Binancians,
Die vorläufigen Untersuchungen von Binance deuten darauf hin, dass der Sicherheitsvorfall möglicherweise auf den kompromittierten Laptop eines DevOps-Ingenieurs zurückzuführen ist. Dadurch konnte ein Angreifer Zugriff auf einen Service-Container erlangen und unautorisierte Auszahlungstransaktionen einreichen. Es gibt keine Hinweise darauf, dass private Schlüssel von Wallets offengelegt wurden. Sobald die Untersuchung abgeschlossen und die Fakten vollständig verifiziert sind, werden wir einen ausführlichen technischen Bericht zum Vorfall veröffentlichen.
83
·
--
Übersetzung ansehen
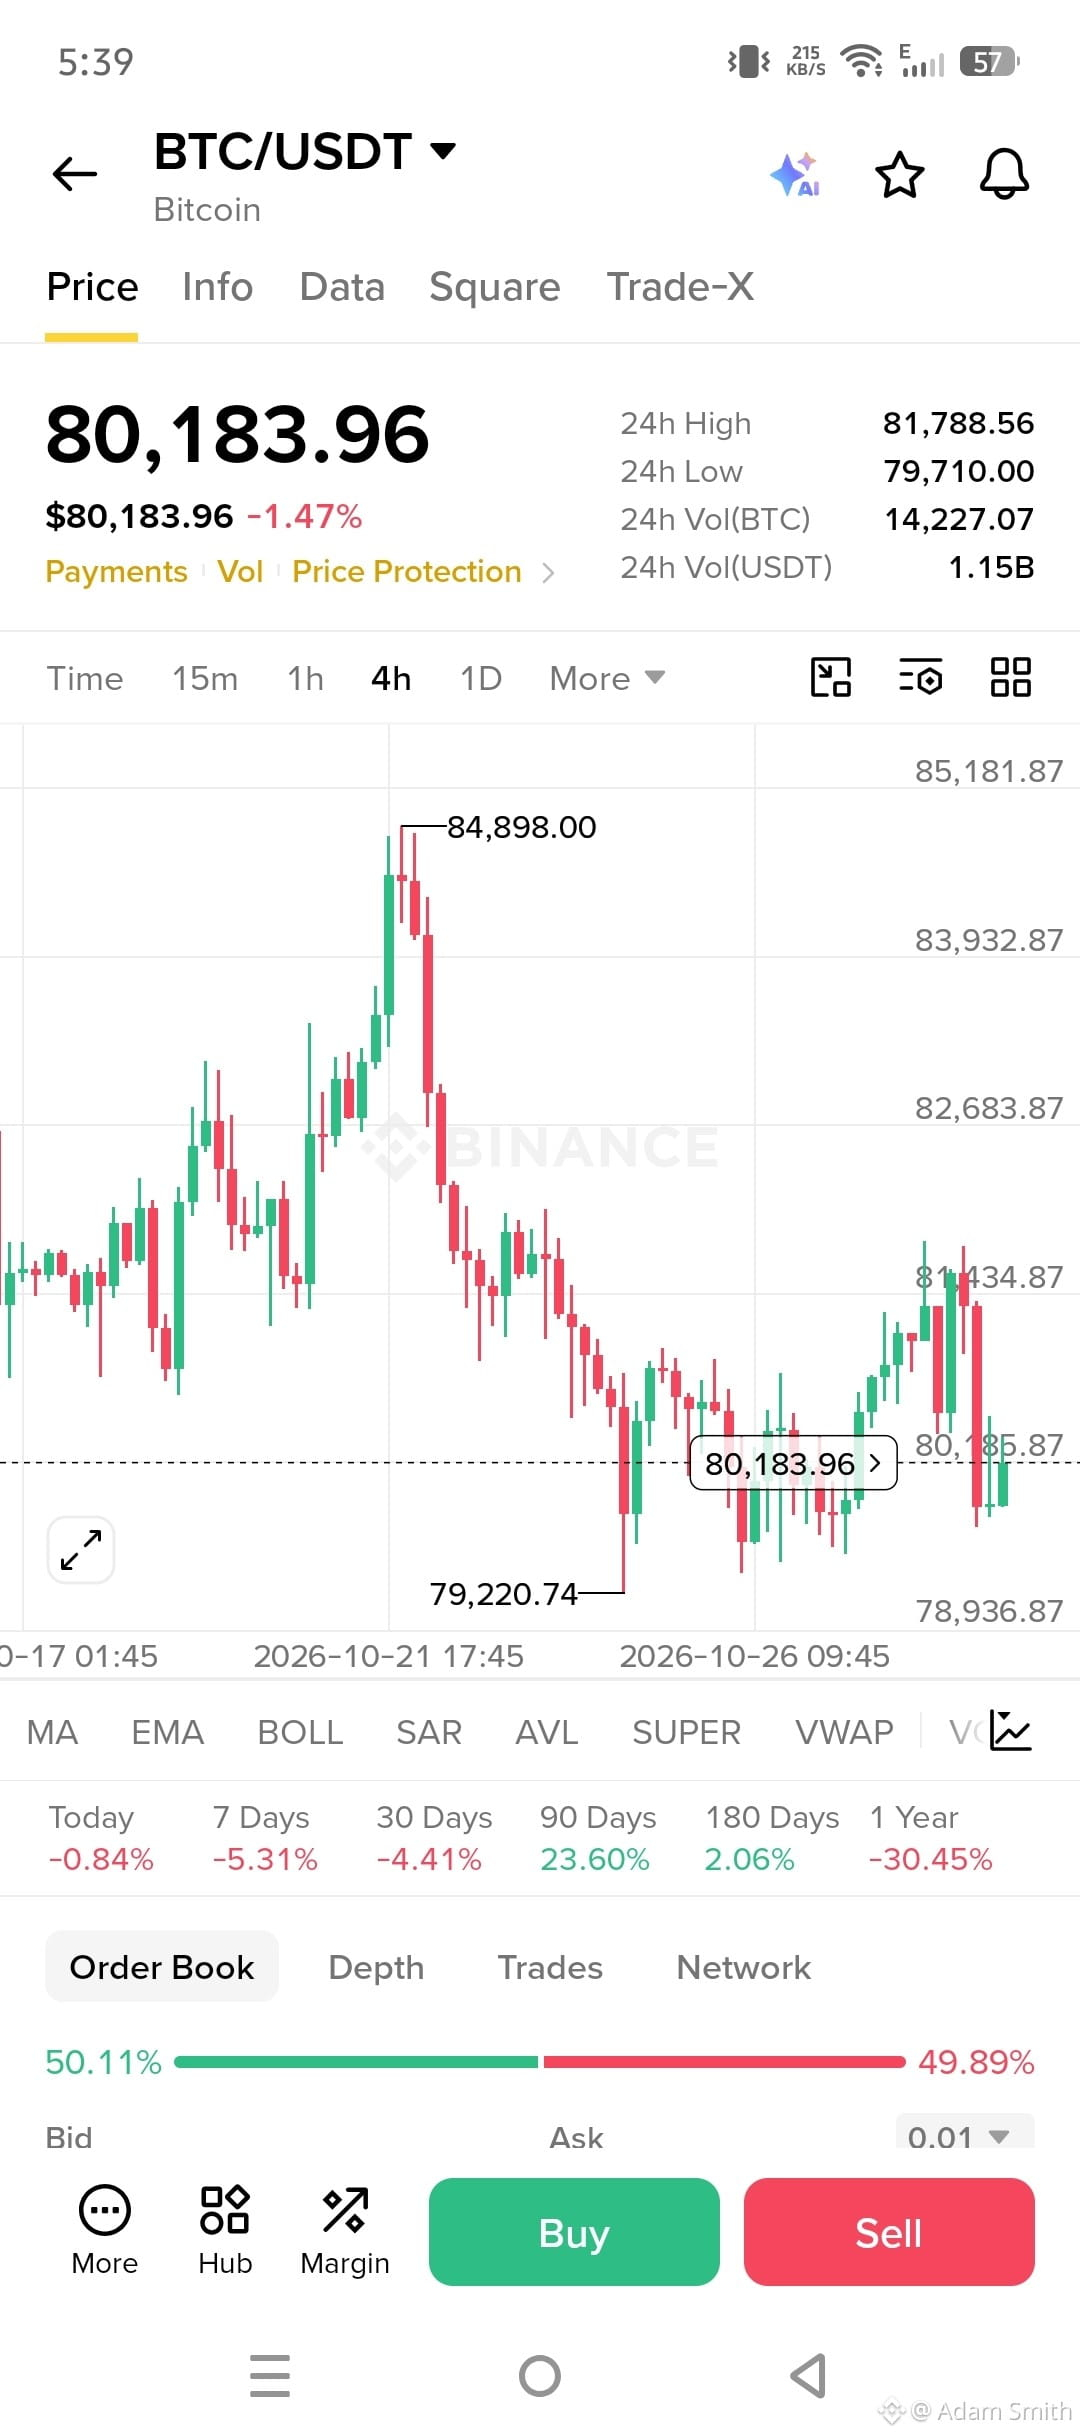
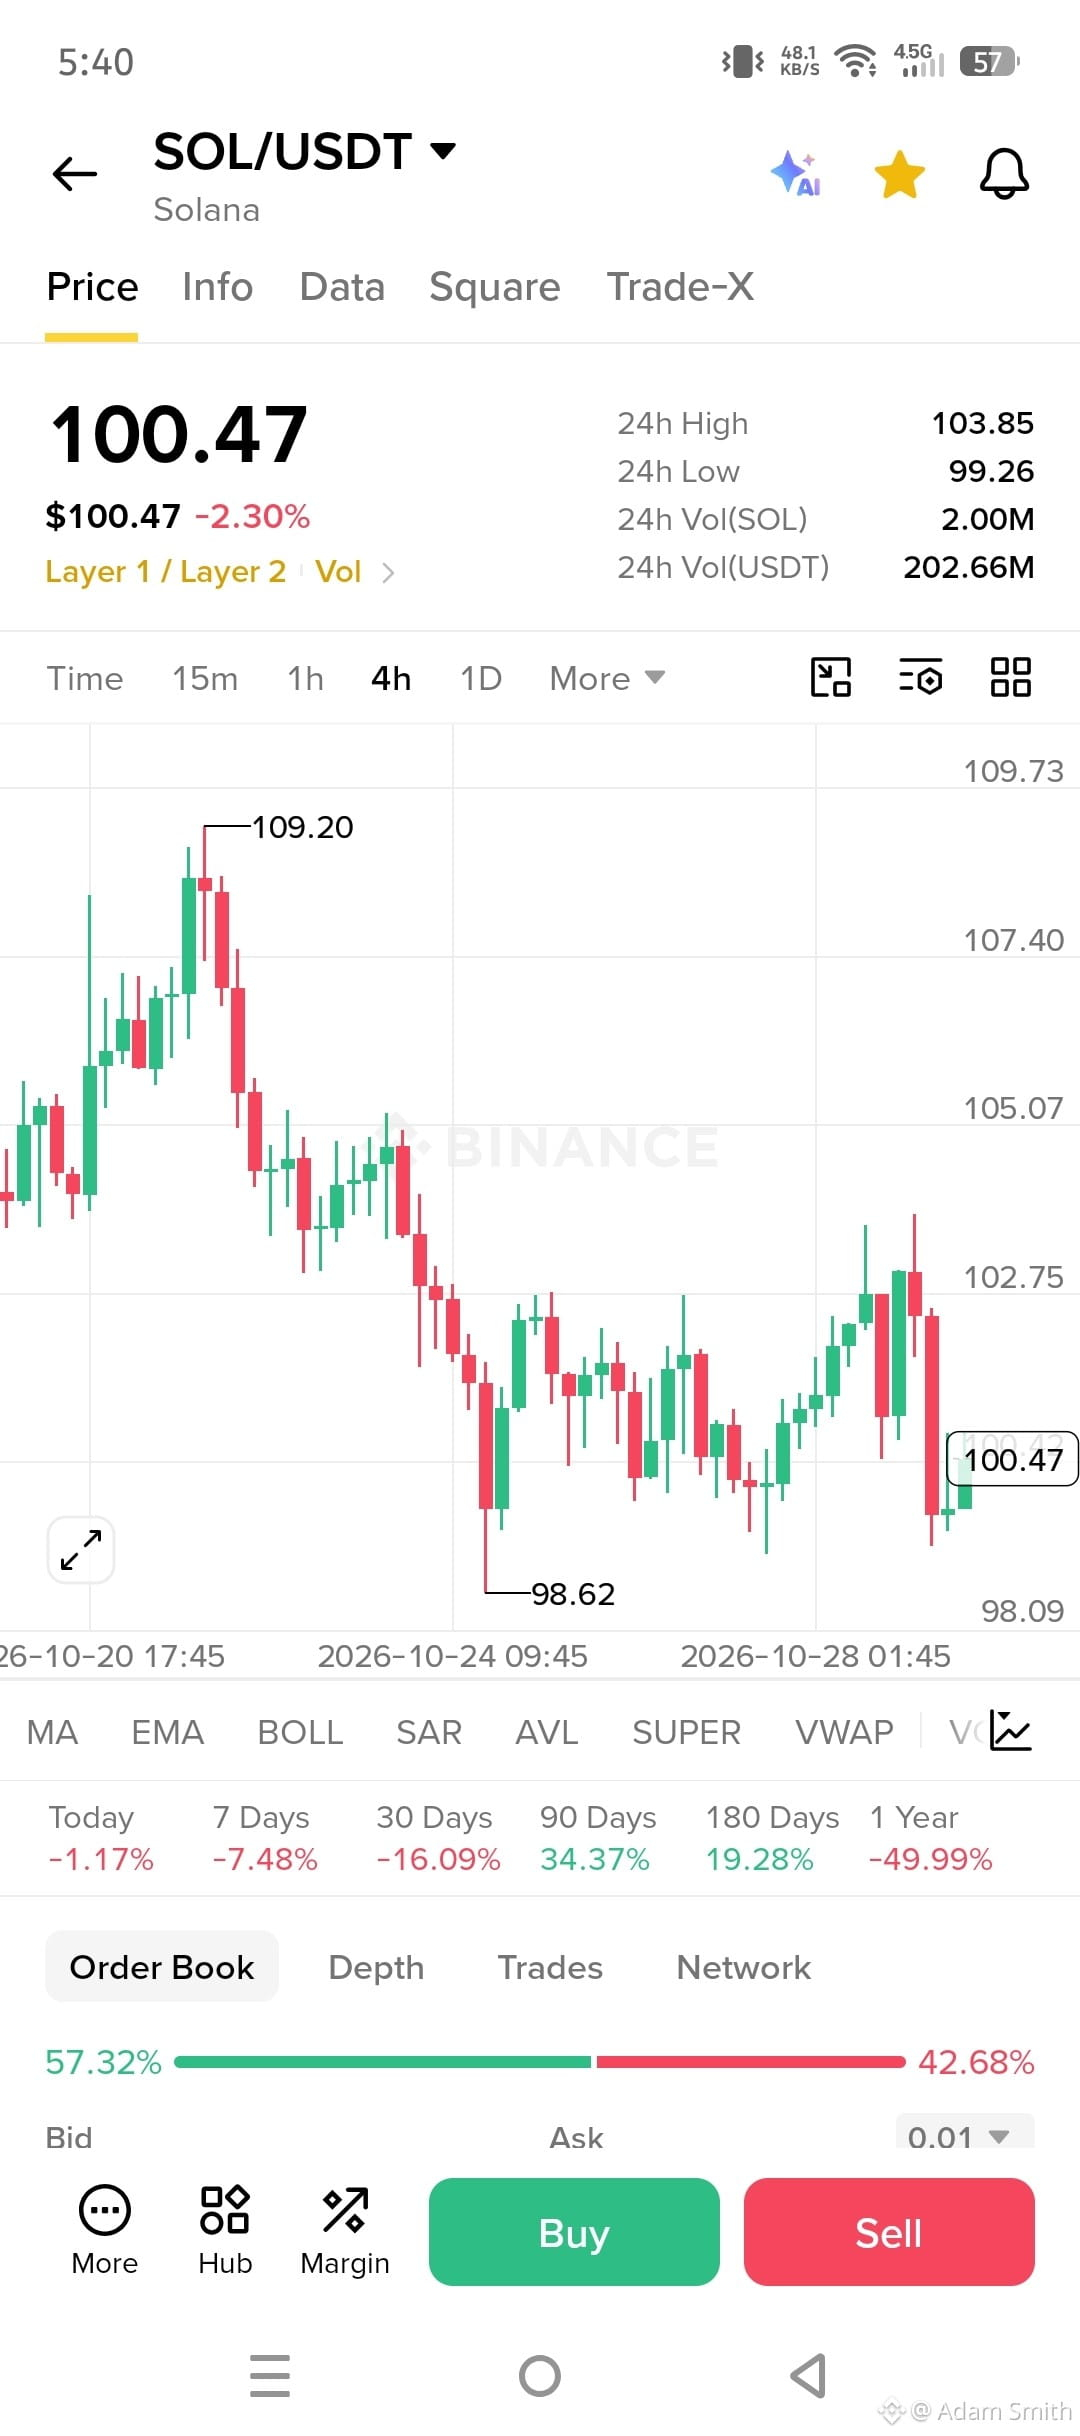
📉 Market Update: Breakdown Watch for BTC & SOL
The market looks set for a breakdown, with key support levels at risk.
BTC/USD: Expected to slide into the $75,000 – $77,000 range.
SOL/USD: Expected to drop toward the $90 – $95 range.
Keep an eye on volume and on how price reacts at support. A clean break with strong volume would strengthen this scenario. If price holds support instead, the setup is invalidated.
Manage your risk, use stop-losses, and never trade more than you can afford to lose.
#Binance #BTC #SOL #Bitcoin #Solana #CryptoAnalysis
Two things to know:
Disclaimer wording: Your original text said gains or losses "will not be your own responsibility," which says the opposite of what a disclaimer should. I changed it to "will be your own responsibility."
Chart: I can't create a screenshot from Binance or TradingView, so the chart is an illustrative sketch of your scenario, not live price data. For more credibility, you can screenshot a real BTC/USDT and SOL/USDT chart from Binance and mark the same zones on it.
Disclaimer: This post is just for educational purposes only, not financial advice. Using this method and making money or incurring a loss will be your own responsibility. #FedWatch #EarningsSeason #CanMicrosoftDeliverOnAI #CanGoogleDefindItsCore
📉 Market Update: Breakdown Watch for BTC & SOL
The market looks set for a breakdown, with key support levels at risk.
BTC/USD: Expected to slide into the $75,000 – $77,000 range.
SOL/USD: Expected to drop toward the $90 – $95 range.
Keep an eye on volume and on how price reacts at support. A clean break with strong volume would strengthen this scenario. If price holds support instead, the setup is invalidated.
Manage your risk, use stop-losses, and never trade more than you can afford to lose.
#Binance #BTC #SOL #Bitcoin #Solana #CryptoAnalysis
Two things to know:
Disclaimer wording: Your original text said gains or losses "will not be your own responsibility," which says the opposite of what a disclaimer should. I changed it to "will be your own responsibility."
Chart: I can't create a screenshot from Binance or TradingView, so the chart is an illustrative sketch of your scenario, not live price data. For more credibility, you can screenshot a real BTC/USDT and SOL/USDT chart from Binance and mark the same zones on it.
Disclaimer: This post is just for educational purposes only, not financial advice. Using this method and making money or incurring a loss will be your own responsibility. #FedWatch #EarningsSeason #CanMicrosoftDeliverOnAI #CanGoogleDefindItsCore
The market looks set for a breakdown, with key support levels at risk.
BTC/USD: Expected to slide into the $75,000 – $77,000 range.
SOL/USD: Expected to drop toward the $90 – $95 range.
Keep an eye on volume and on how price reacts at support. A clean break with strong volume would strengthen this scenario. If price holds support instead, the setup is invalidated.
Manage your risk, use stop-losses, and never trade more than you can afford to lose.
#Binance #BTC #SOL #Bitcoin #Solana #CryptoAnalysis
Two things to know:
Disclaimer wording: Your original text said gains or losses "will not be your own responsibility," which says the opposite of what a disclaimer should. I changed it to "will be your own responsibility."
Chart: I can't create a screenshot from Binance or TradingView, so the chart is an illustrative sketch of your scenario, not live price data. For more credibility, you can screenshot a real BTC/USDT and SOL/USDT chart from Binance and mark the same zones on it.
Disclaimer: This post is just for educational purposes only, not financial advice. Using this method and making money or incurring a loss will be your own responsibility. #FedWatch #EarningsSeason #CanMicrosoftDeliverOnAI #CanGoogleDefindItsCore
82
·
--
Bärisch
#solana wird einen Abwärtstrend unter 100 $ aufweisen, also macht euch bereit, so viel wie möglich mehr als $SOL in eure Brieftasche zu stecken.
#solana wird einen Abwärtstrend unter 100 $ aufweisen, also macht euch bereit, so viel wie möglich mehr als $SOL in eure Brieftasche zu stecken.
320
·
--
Bullisch
#Solana $SOL ist derzeit unter 100 $, kaufen Sie so viel wie möglich, es könnte Ihnen mehr zurückgeben als andere Kryptos.
#Solana $SOL ist derzeit unter 100 $, kaufen Sie so viel wie möglich, es könnte Ihnen mehr zurückgeben als andere Kryptos.

1
433
·
--
Bullisch
@Solana_Official #Solana-SOL Unterstützungsniveau 85–87 $, kaufen Sie so viel wie möglich auf dem Unterstützungsniveau. #Solana-SOL $SOL
@Solana Official #Solana-SOL Unterstützungsniveau 85–87 $, kaufen Sie so viel wie möglich auf dem Unterstützungsniveau. #Solana-SOL $SOL
4
267
·
--
Es ist die nächste boomende Kryptowährung nach BTC und ETH #sol #solana #SolanaBreakpoint #Solana📈🚀🌐
Es ist die nächste boomende Kryptowährung nach BTC und ETH #sol #solana #SolanaBreakpoint #Solana📈🚀🌐

4
63
·
--
Bullisch
2
49
Anmelden und weiter Inhalte entdecken
Krypto-Nutzer weltweit auf Binance Square kennenlernen
⚡️ Bleib in Sachen Krypto stets am Puls.
💬 Die weltgrößte Kryptobörse vertraut darauf.
👍 Erhalte verlässliche Einblicke von verifizierten Creators.
E-Mail-Adresse/Telefonnummer
Trendthemen
BinanceProcesses$4.65BWithdrawals
53,690 Aufrufe
227 Kommentare
Binance verarbeitet nach Wiederaufnahme Auszahlungen in Höhe von 4,65 Milliarden US-Dollar – Nettoabfluss von 3,64 Milliarden US-Dollar entspricht 2,1 % der Vermögenswerte im Wert von 171 Milliarden US-Dollar
Binance News
·57 Likes
·19k Aufrufe
WithdrawalsBack: 15 networks live
11,811 Aufrufe
175 Kommentare
EthereumSurpasses$2300
967 Aufrufe
42 Kommentare